 The summer holidays are over and schools are open again – sort of.
Restaurants, pubs and nightclubs are open again – sort of.
Gyms and leisure facilities are open again – sort of.
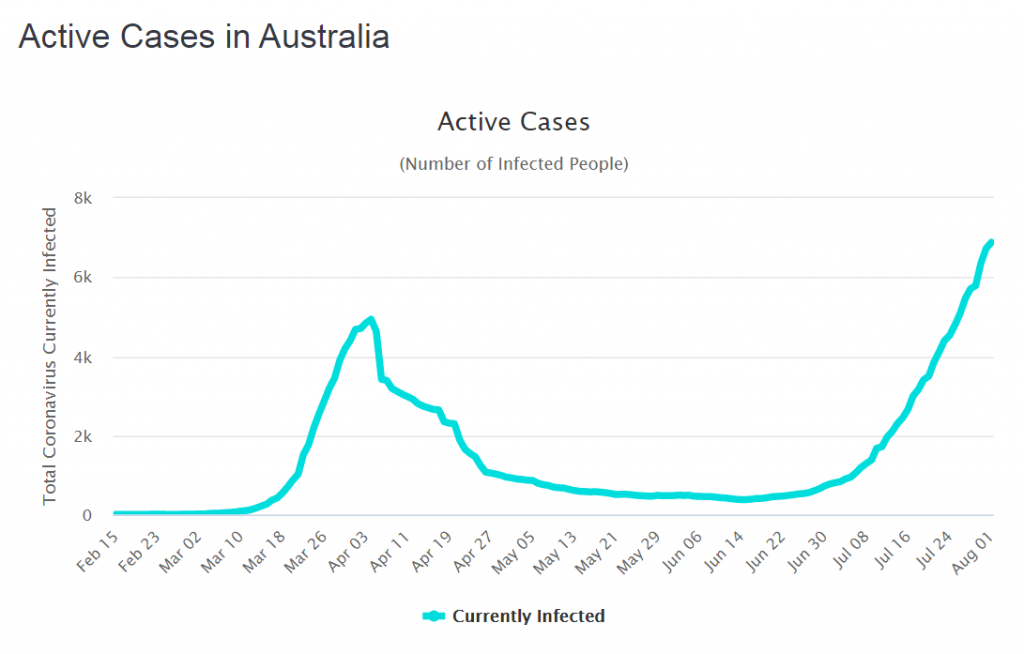
And after two months of gradual easing of social restrictions and massive expansion of test-and-trace we now have the spectre of a Second Wave looming. It has happened in Australia, Italy, Spain and France so it can happen here.
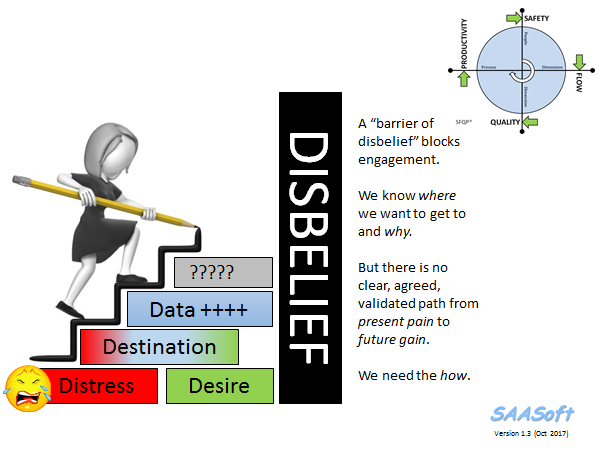
As usual, the UK media are hyping up the general hysteria and we now also have rioting disbelievers claiming it is all a conspiracy and that re-applying local restrictions is an infringement of their liberty.
So, what is all the fuss about?
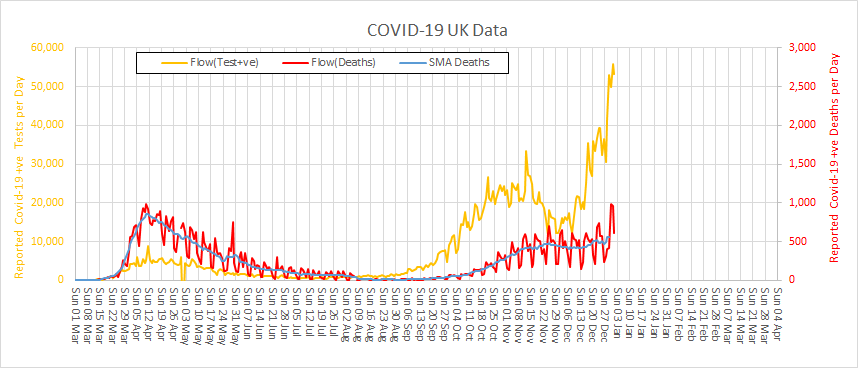
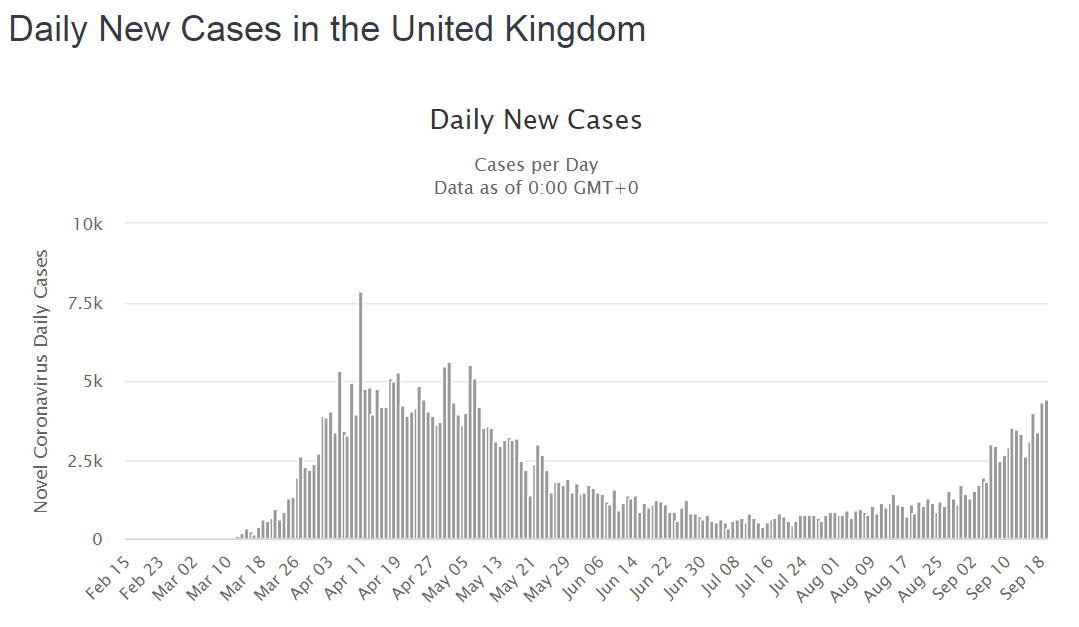
We need to side-step the gossip and get some hard data from a reliable source (i.e. not a newspaper). Here is what worldometer is sharing …
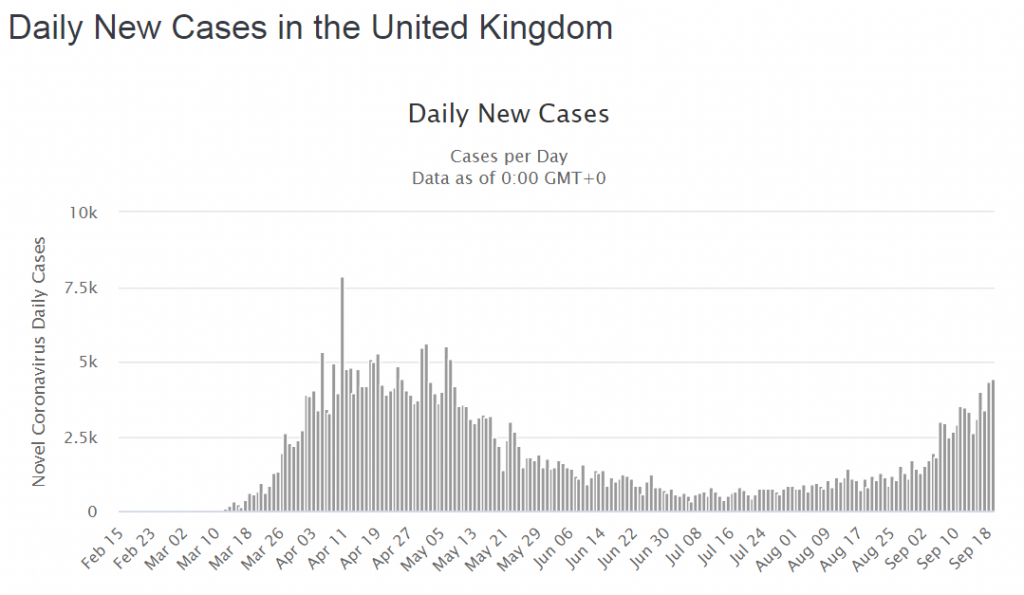
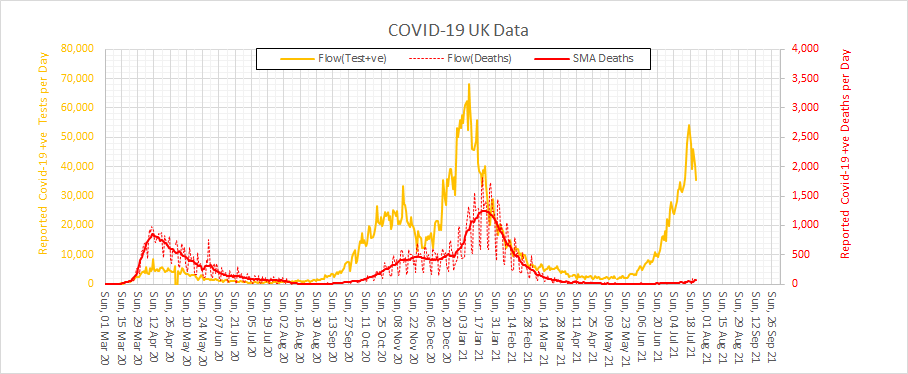
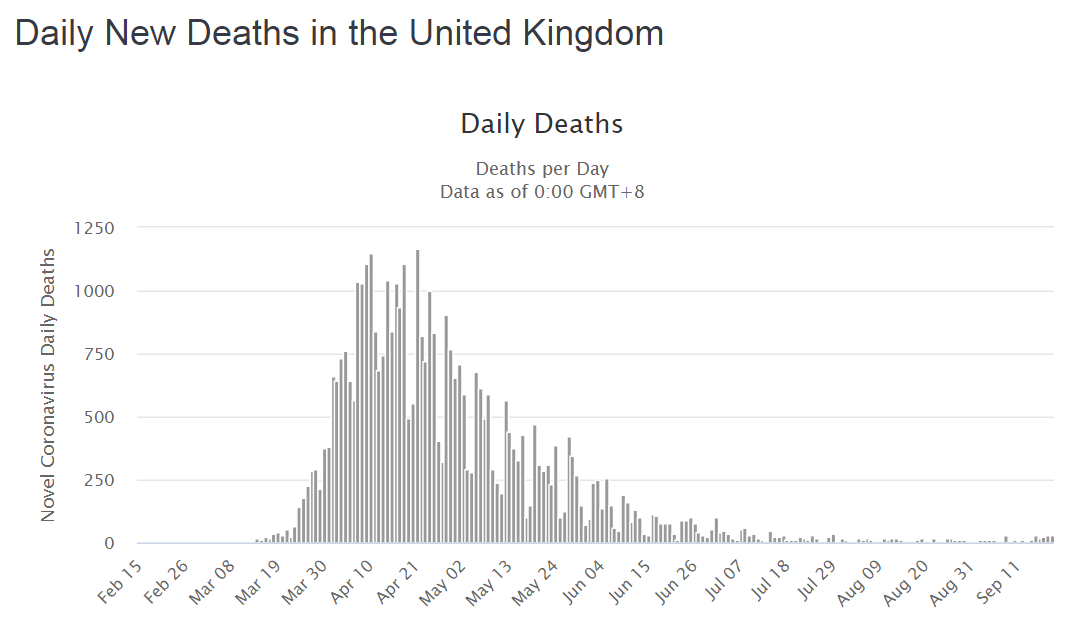
OMG! It looks like The Second Wave is here already! There are already as many cases now as in March and we still have the mantra “Stay At Home – Protect the NHS – Save Lives” ringing in our ears. But something is not quite right. No one is shouting that hospitals are bursting at the seams. No one is reporting that the mortuaries are filling up. Something is different. What is going on? We need more data.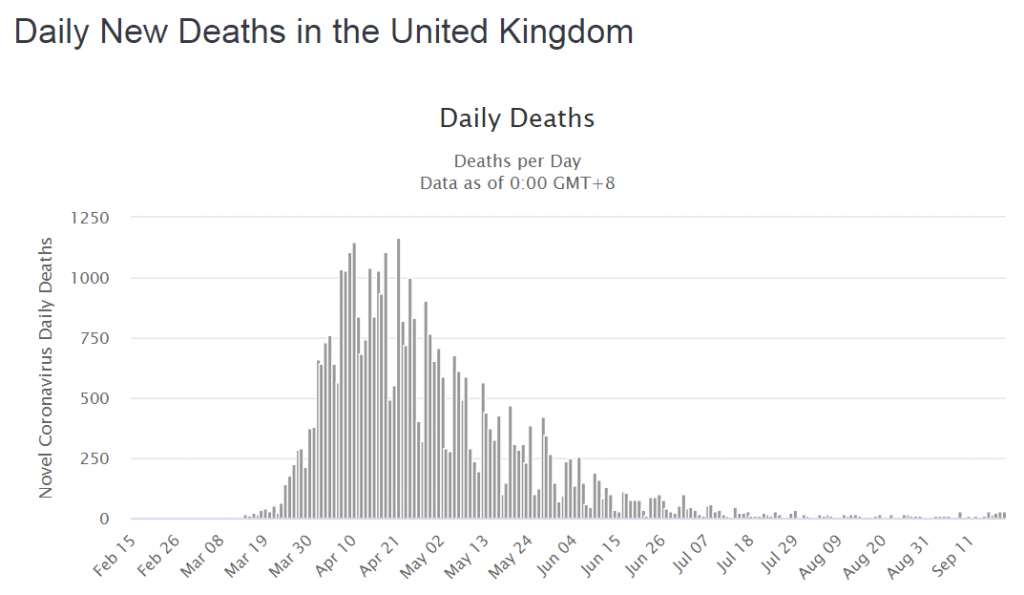 That is odd! We can clearly see that cases and deaths went hand-in-hand in the First Wave with about 1:5 cases not making it. But this time the deaths are not rising with the cases.
Ah ha! Maybe that is because the virus has mutated into something much more benign and because we have got much better at diagnosing and treating this illness – the ventilators and steroids saved the day. Hurrah! It’s all a big fuss about nothing … we should still be able to have friends round for parties and go on pub crawls again!
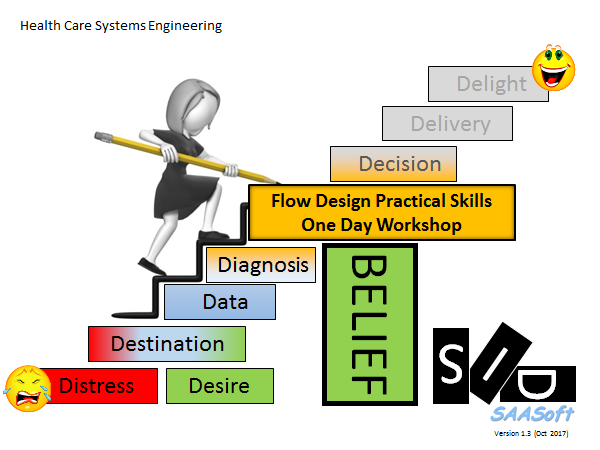
But … what if there was a different explanation for the patterns on the charts above?
It is said that “data without context is meaningless” … and I’d go further than that … data without context is dangerous because if it leads to invalid conclusions and inappropriate decisions we can get well-intended actions that cause unintended harm. Death.
So, we need to check the context of the data.
In the First Wave the availability of the antigen (swab) test was limited so it was only available to hospitals and the “daily new cases” were in patients admitted to hospital – the ones with severe enough symptoms to get through the NHS 111 telephone triage. Most people with symptoms, even really bad ones, stayed at home to protect the NHS. They didn’t appear in the statistics.
But did the collective sacrifice of our social lives save actual lives?
The original estimates of the plausible death toll in the UK ranged up to 500,000 from coronavirus alone (and no one knows how many more from the collateral effects of an overwhelmed NHS). The COVID-19 body count to date is just under 50000, so putting a positive spin on that tragic statistic, 90% of the potential deaths were prevented. The lock-down worked. The NHS did not collapse. The Nightingales stood ready and idle – an expensive insurance policy. Lives were actually saved.
Why isn’t that being talked about?
And the context changed in another important way. The antigen testing capacity was scaled up despite being mired in confusing jargon. Who thought up the idea of calling them “pillars”?
But, if we dig about on the GOV.UK website long enough there is a definition: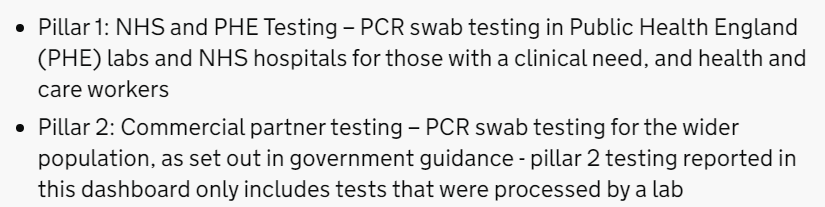
So, Pillar 1 = NHS testing capacity Pillar 2 = commercial testing capacity and we don’t actually know how much was in-hospital testing and how much was in-community testing because the definitions seem to reflect budgets rather than patients. Ever has it been thus in the NHS!
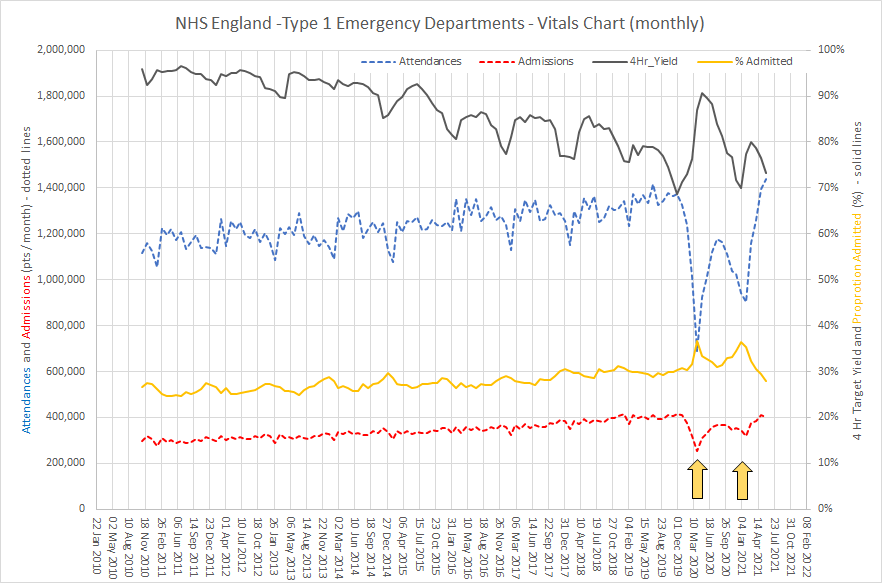
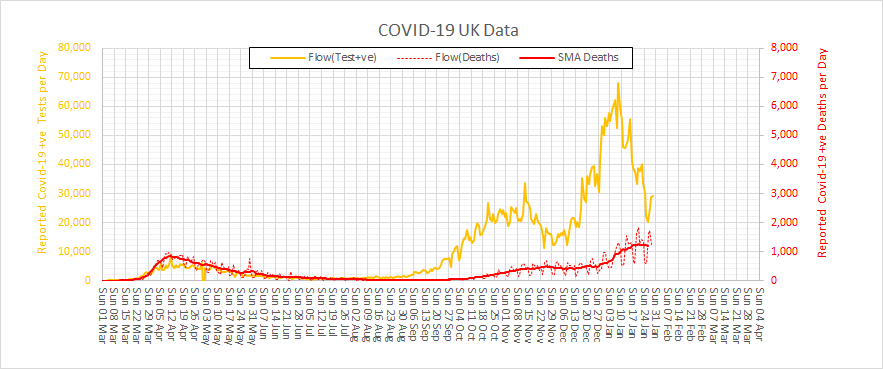
However, we can see from the chart below that testing activity (blue bars) has increased many-fold but the two testing streams (in hospital and outside hospital) are combined in one chart. Well, it is one big pot of tax-payers cash after all and it is the same test.
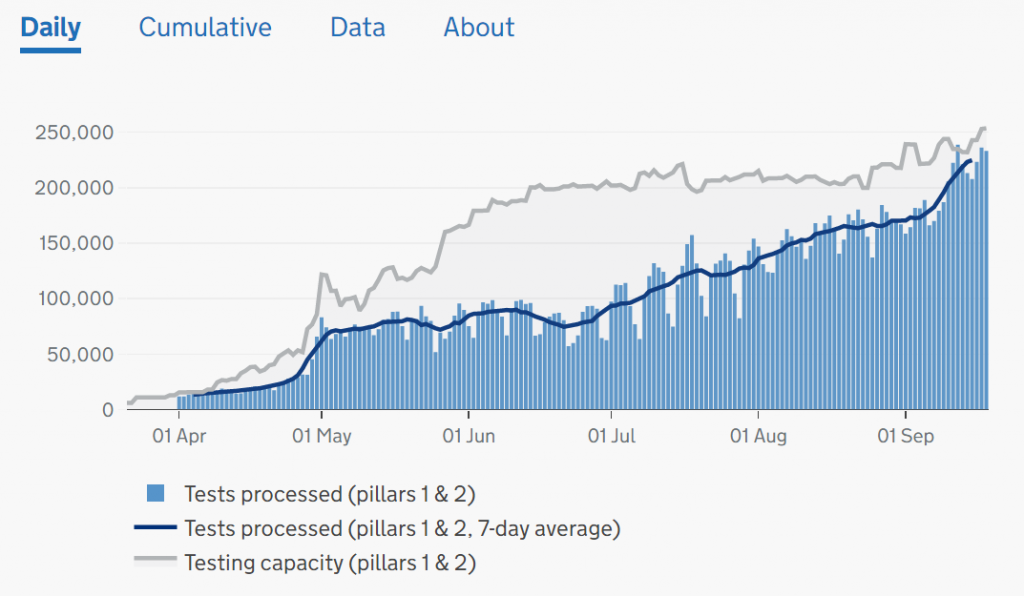
To unravel this a bit we have to dig into the website, download the raw data, and plot it ourselves. Looking at Pillar 2 (commercial) we can see they had a late start, caught the tail of the First Wave, and then ramped up activity as the population testing caught up with the available capacity (because hospital activity has been falling since late April).
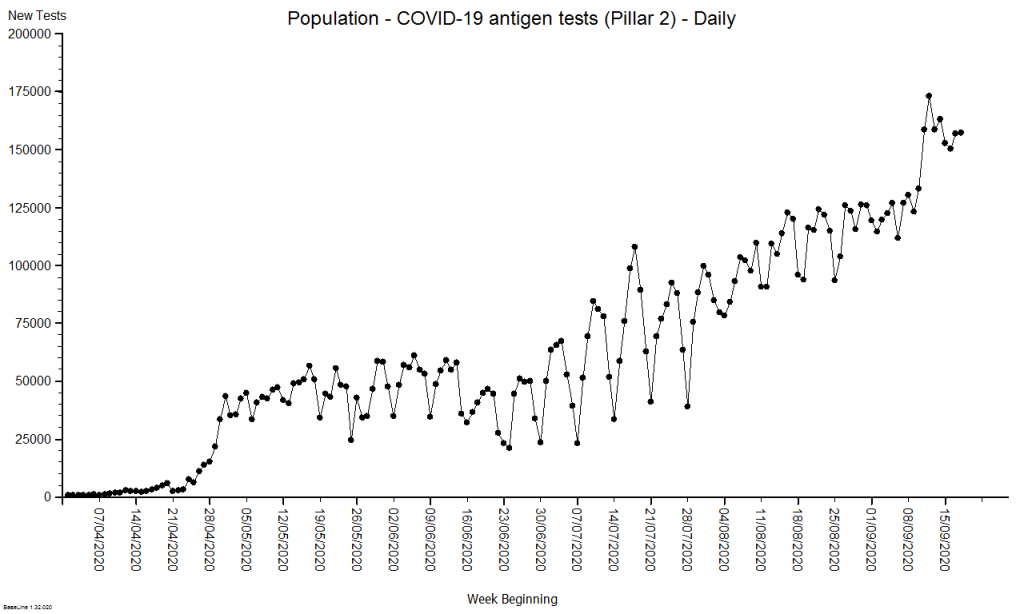
Now we can see that the increased number of positive tests could be explained by the fact that we are now testing anyone with possible COVID-19 symptoms who steps up – mainly in the community. And we were unable to do this before because the testing capacity did not exist.
The important message is that in the First Wave we were not measuring what was happening in the community – it was happening though – it must have been. We measured the knock on effects: hospital admissions with positive tests and deaths after positive tests.
So, to present the daily positive tests as one time-series chart that conflates both ‘pillars’ is both meaningless and dangerous and it is no surprise that people are confused.
This raises a question: “Can we estimate how many people there would have been in the community in the First Wave so that we can get a sense of what the rising positive test rate means now?“
The way that epidemiologists do this is to build a generic simulation of the system dynamics of an epidemic (a SEIR multi-compartment model) and then use the measured data to calibrate the this model so that it can then be used for specific prediction and planning.
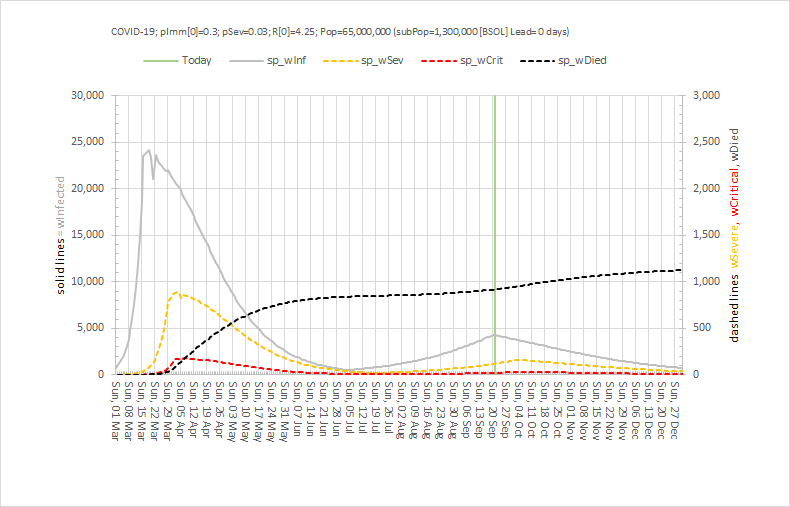
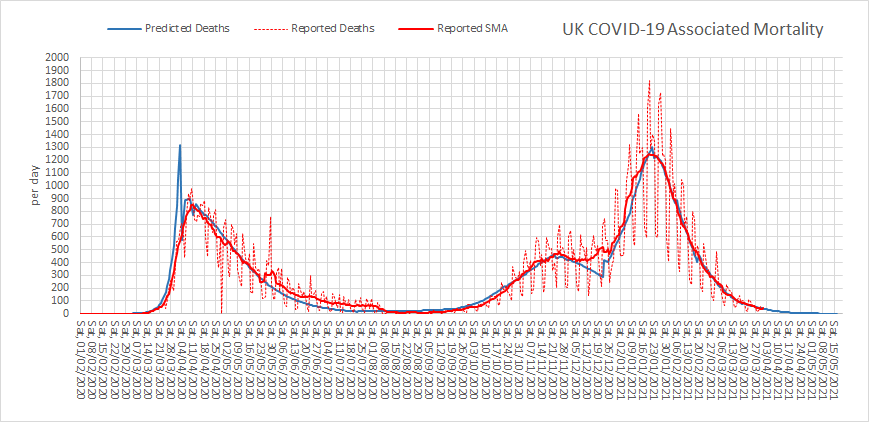
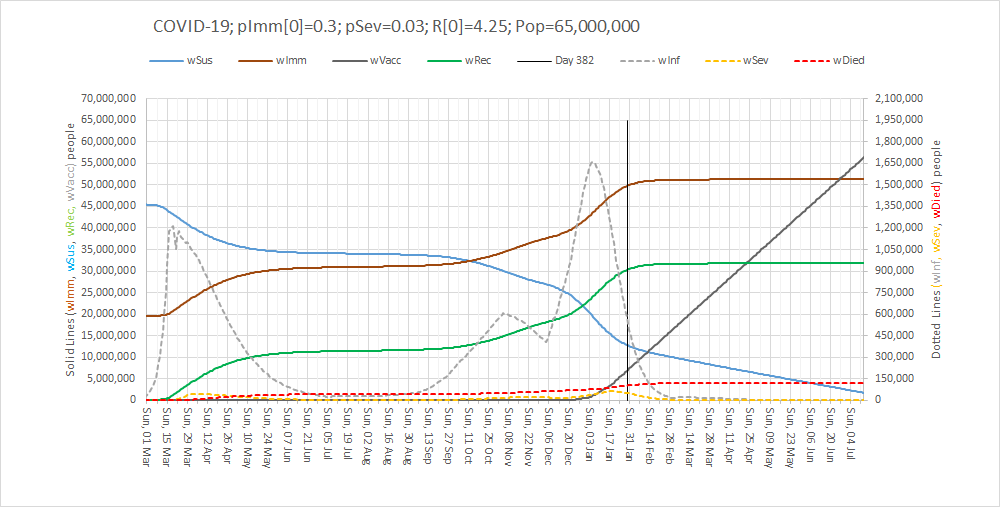
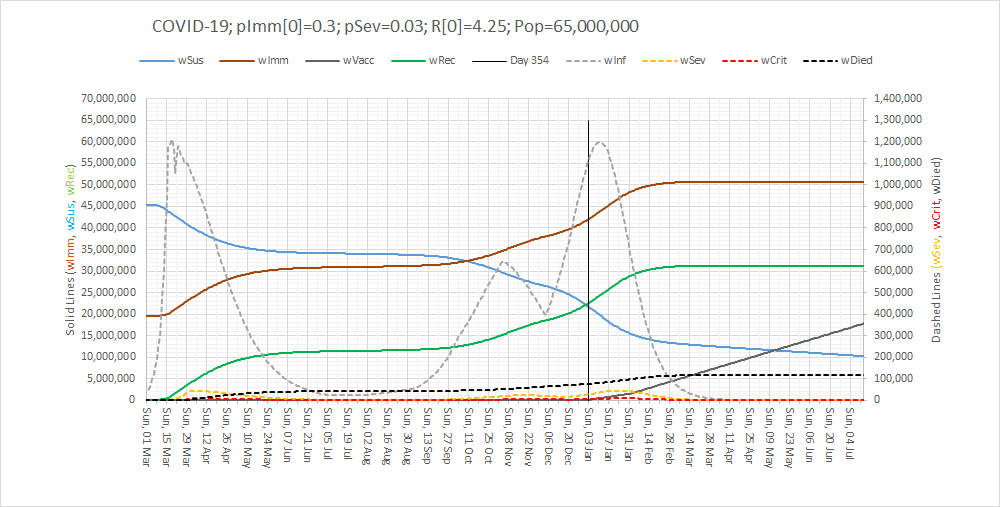
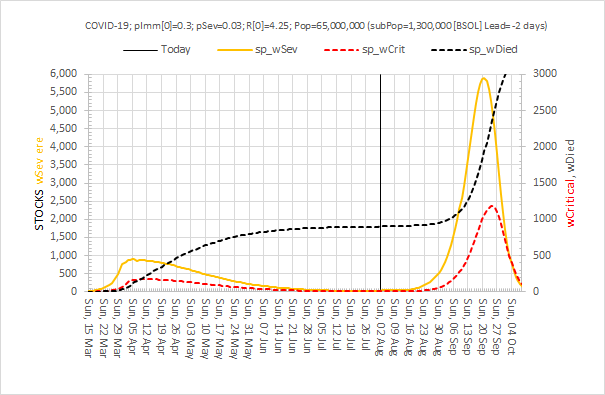
Here is an example of the output of a calibrated multi-compartment system dynamics model of the UK COVID-19 epidemic for a nominal 1.3 million population. The compartments that are included are Susceptible, Exposed, Infectious, and Recovered (i.e. not infectious) and this model also simulates the severity of the illness i.e. Severe (in hospital), Critical (in ITU) and Died.
The difference in size of the various compartments is so great that the graph below requires two scales – the solid line (Infectious) is plotted on the left hand scale and the others are plotted on the right hand scale which is 10 times smaller. The green line is today and the reported data up to that point has been used to calibrate the model and to estimate the historical metrics that we did not measure – such as how many people in the community were infectious (and would have tested positive).
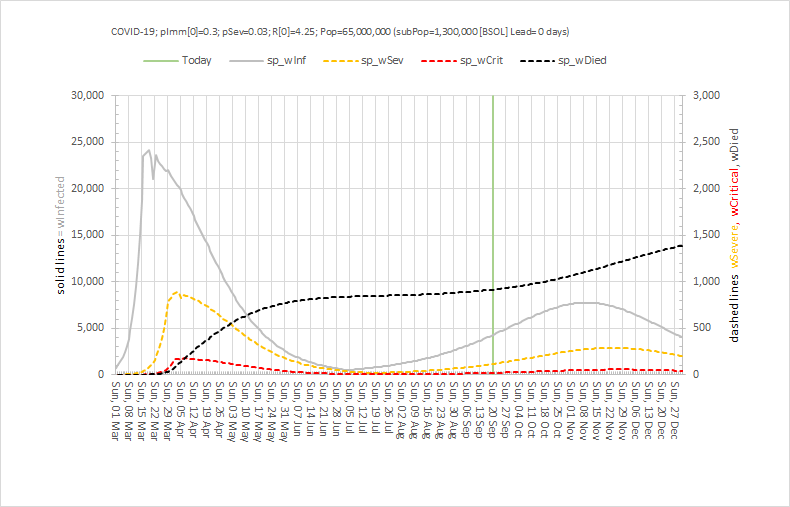
At the peak of the First Wave, for this population of 1.3 million, the model estimates there were about 800 patients in hospital (which there were) and 24,000 patients in the community who would have tested positive if we had been able to test them. 24,000/800 = 30 which means the peak of the grey line is 30 x higher than the peak of the orange line – hence the need for the two Y-axes with a 10-fold difference in scale.
Note the very rapid rise in the number of infectious people from the beginning of March when the first UK death was announced, before the global pandemic was declared and before the UK lock-down was enacted in law and implemented. Coronavirus was already spreading very rapidly.
Note how this rapid rise in the number of infectious people came to an abrupt halt when the UK lock-down was put into place in the third week of March 2020. Social distancing breaks the chain of transmission from one infectious person to many other susceptible ones.
Note how the peaks of hospital admissions, critical care admissions and deaths lag after the rise in infectious people (because it takes time for the coronavirus to do its damage) and how each peak is smaller (because only about 1:30 get sick enough to need admission, and only 1:5 of hospital admissions do not survive.
Note how the fall in the infectious group was more gradual than the rise (because the lock-down was partial, because not everyone could stay at home (essential services like the NHS had to continue), and because there was already a big pool of infectious people in the community.
So, by early July 2020 it was possible to start a gradual relaxation of the lock down and from then we can see a gradual rise in infectious people again. But now we were measuring them because of the growing capacity to perform antigen tests in the community. The relatively low level and the relatively slow rise are much less dramatic than what was happening in March (because of the higher awareness and the continued social distancing and use of face coverings). But it is all too easy to become impatient and complacent.
But by early September 2020 it was clear that the number on infectious people was growing faster in the community – and then we saw hospital admissions reach a minimum and start to rise again. And then the number if deaths reach a minimum and start to rise again. And this evidence proves that the current level of social distancing is not enough to keep a lid on this disease. We are in the foothills of a Second Wave.
So what do we do next?
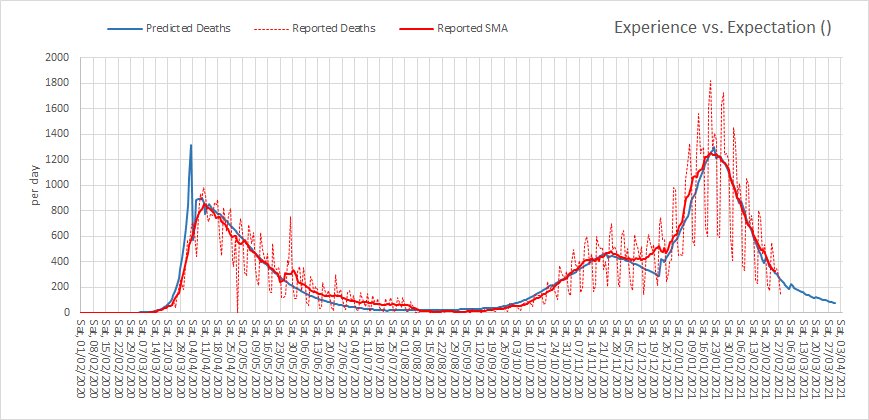
First, we must estimate the effect that the current social distancing policies are having and one way to do that would be to stop doing them and see what happens. Clearly that is not an ethical experiment to perform given what we already know. But, we can simulate that experiment using our calibrated SEIR model. Here is what is predicted to happen if we went back to the pre-lockdown behaviours: There would be a very rapid spread of the virus followed by a Second Wave that would be many times bigger than the first!! Then it would burn itself out and those who had survived could go back to some semblance of normality. The human sacrifice would be considerable though.
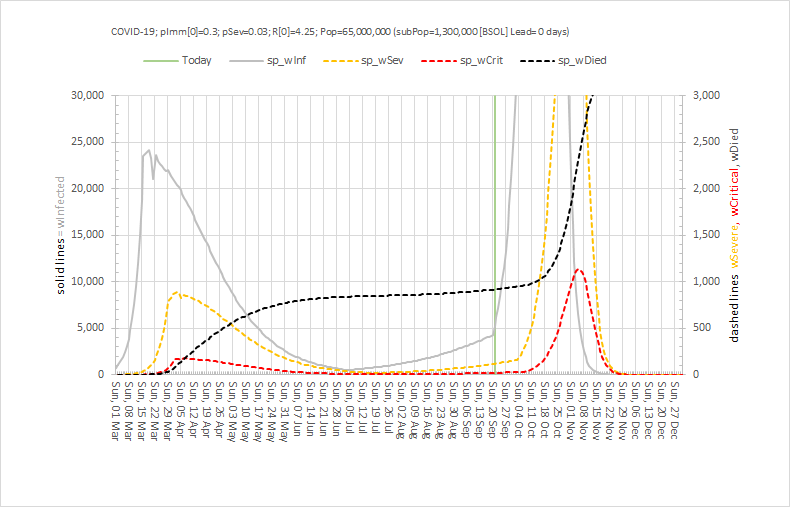
So, despite the problems that the current social distancing is causing, they pale into insignificance compared to what could happen if they were dropped.
The previous model shows what is predicted would happen if we continue as we are with no further easing of restrictions and assuming people stick to them. In short, we will have COVID-for-Christmas and it could be a very nasty business indeed as it would come at the same time as other winter-associated infectious diseases such as influenza and norovirus.
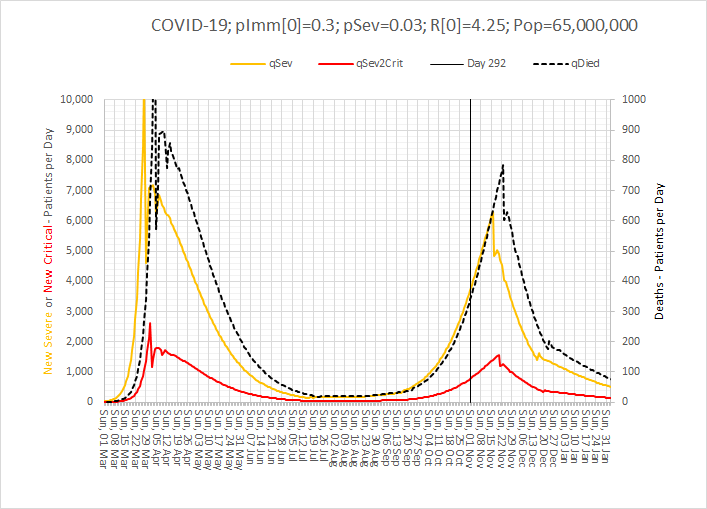
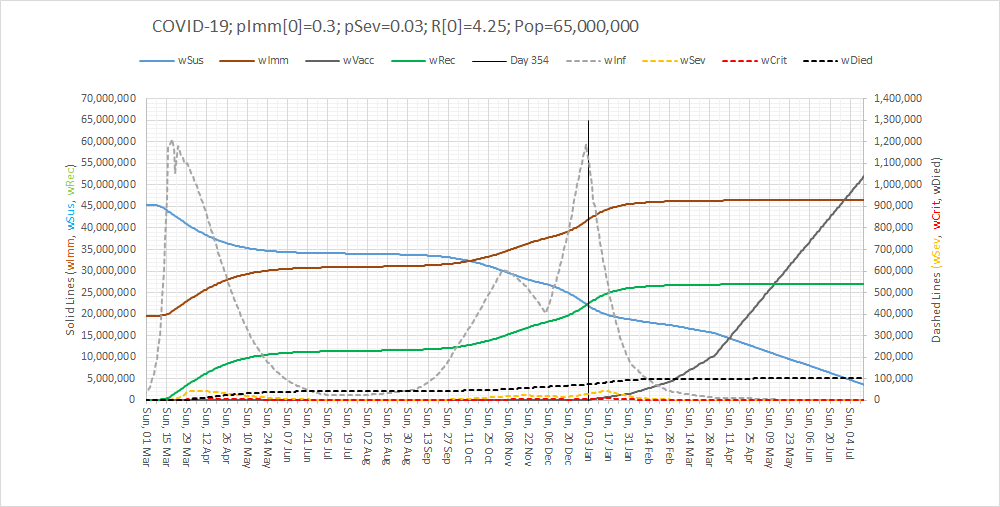
The next chart shows what could happen if we squeeze the social distancing brake a bit harder by focusing only on the behaviours that the track-and-trace-and-test system is highlighting as the key drivers of the growth infections, admissions and deaths.
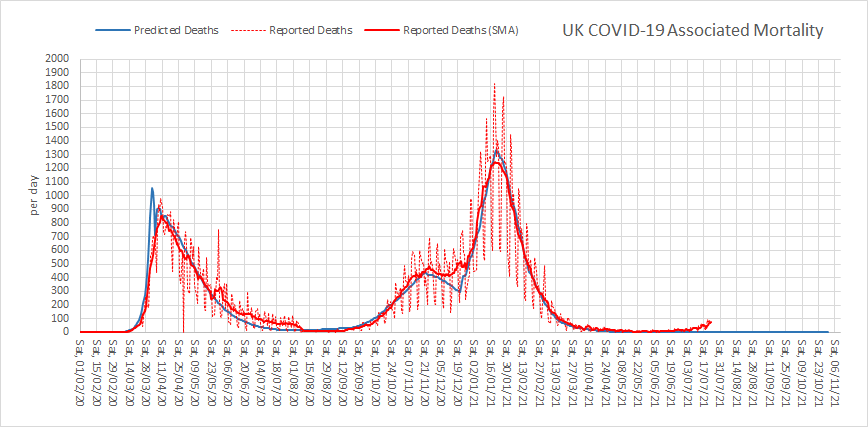
What we see is an arrest of the rise of the number of infectious people (as we saw before), a small and not sustained increase in hospital admissions, then a slow decline back to the levels that were achieved in early July – and at which point it would be reasonable to have a more normal Christmas.
And another potential benefit of a bit more social distancing might be a much less problematic annual flu epidemic because that virus would also find it harder to spread – plus we have a flu vaccination which we can use to reduce that risk further.
It is not going to be easy. We will have to sacrifice a bit of face-to-face social life for a bit longer. We will have to measure, monitor, model and tweak the plan as we go.
And one thing we can do immediately is to share the available information in a more informative and less histrionic way than we are seeing at the moment.
Update: Sunday 1st November 2020
Yesterday the Government had to concede that the policy of regional restrictions had failed and bluffing it out and ignoring the scientific advice was, with the clarity of hindsight, an unwise strategy.
In the face of the hard evidence of rapidly rising COVID+ve hospital admissions and deaths, the decision to re-impose a national 4-week lock-down was announced. This is the only realistic option to prevent overwhelming the NHS at a time of year that it struggles with seasonal influenza causing a peak of admissions and deaths.
Paradoxically, this year the effect of influenza may be less because social distancing will reduce the spread of that as well and also because there is a vaccination for influenza. Many will have had their flu jab early … I certainly did.
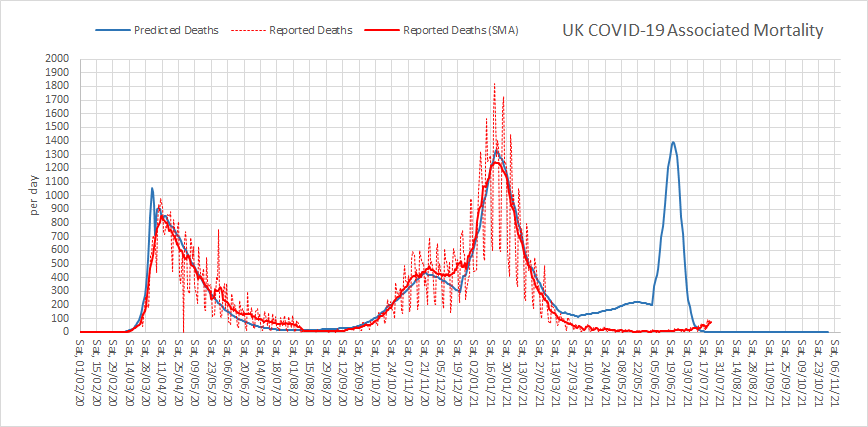
So, what is the predicted effect of a 4 week lock down? Well, the calibrated model (also used to generate the charts above) estimates that it could indeed suppress the Second Wave and mitigate a nasty COVID-4-Christmas scenario. But even with it the hospital admissions and associated mortality will continue to increase until the effect kicks in.
Brace yourselves.


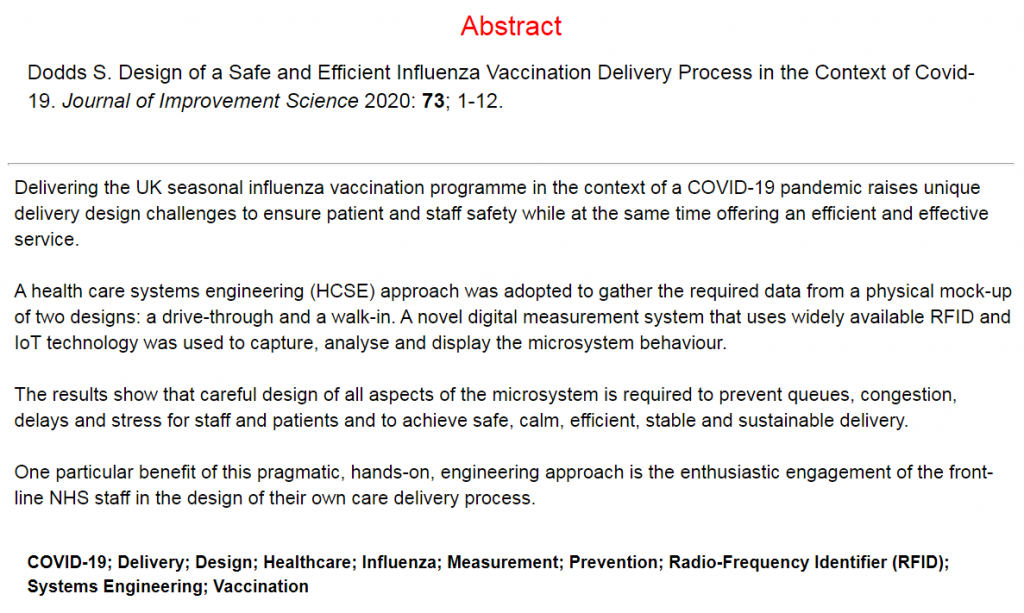


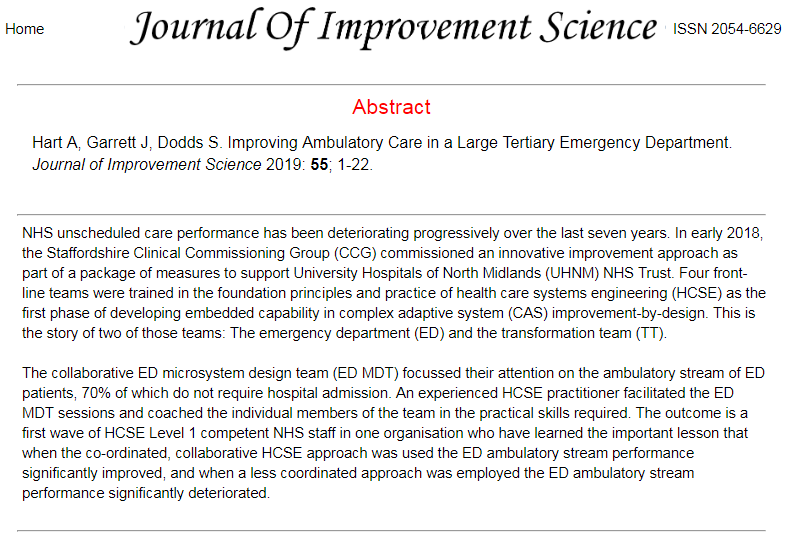
 Abstract


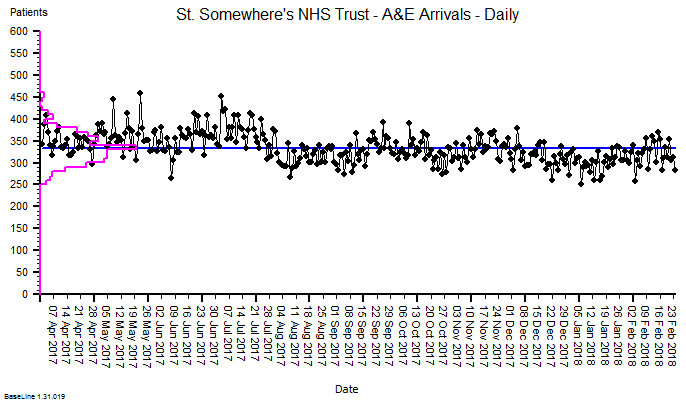
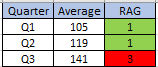
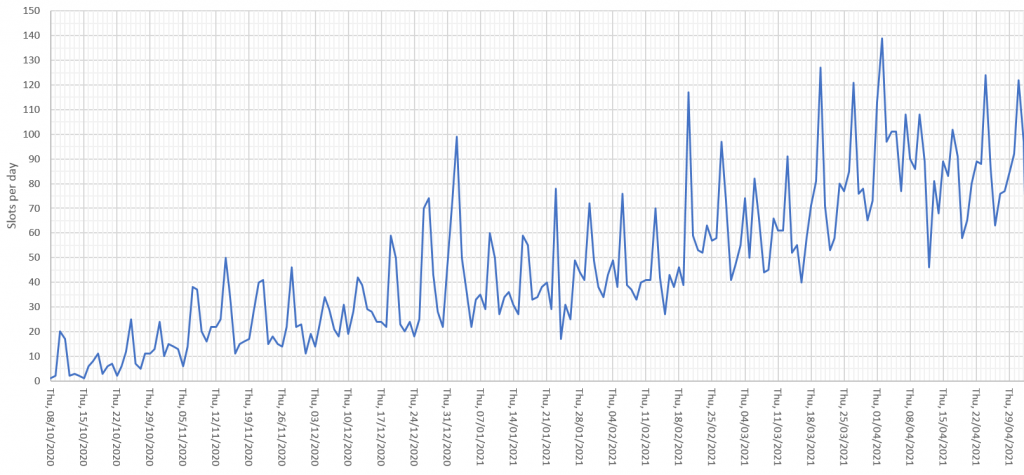
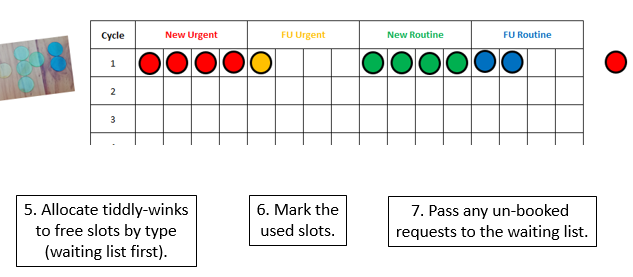
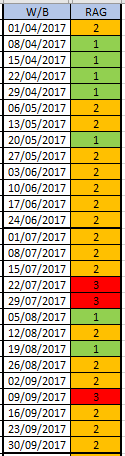 The quarterly target I need to stay below is 120 and my weekly RAG chart is set to show green when less than 108 (10% below target) and red when more than 132 (10% above target) because I know there is quite a lot of random week-to-week variation.