Pushmepullyu

The pushmepullyu is a fictional animal immortalised in the 1960’s film Dr Dolittle featuring Rex Harrison who learned from a parrot how to talk to animals.  The pushmepullyu was a rare, mysterious animal that was never captured and displayed in zoos. It had a sharp-horned head at both ends and while one head slept the other stayed awake so it was impossible to sneak up on and capture.

The spirit of the pushmepullyu lives on in Improvement Science as Push-Pull and remains equally mysterious and difficult to understand and explain. It is confusing terminology. So what does Push-Pull acually mean?

To decode the terminology we need to first understand a critical metric of any process – the constraint cycle time (CCT) – and to do that we need to define what the terms constraint and cycle time mean.

Consider a process that comprises a series of steps that must be completed in sequence.  If we put one task through the process we can measure how long each step takes to complete its contribution to the whole task.  This is the touch time of the step and if the resource is immediately available to start the next task this is also the cycle time of the step.

If we now start two tasks at the same time then we will observe when an upstream step has a longer cycle time than the next step downstream because it will shadow the downstream step. In contrast, if the upstream step has a shorter cycle time than the next step down stream then it will expose the downstream step. The differences in the cycle times of the steps will determine the behaviour of the process.

Confused? Probably.  The description above is correct BUT hard to understand because we learn better from reality than from rhetoric; and we find pictures work better than words.  Pragmatic comes before academic; reality before theory.  We need a realistic example to learn from.
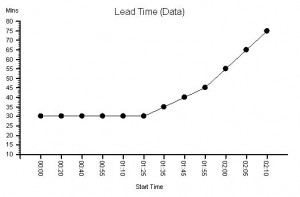
Suppose we have a process that we are told has three steps in sequence, and when one task is put through it takes 30 mins to complete.  This is called the lead time and is an important process output metric. We now know it is possible to complete the work in 30 mins so we can set this as our lead time expectation.  

Suppose we plot a chart of lead times in the order that the tasks start and record the start time and lead time for each one – and we get a chart that looks like this. It is called a lead time run chart.  The first six tasks complete in 30 mins as expected – then it all goes pear-shaped. But why?  The run chart does not tell  us the reason – it just alerts us to dig deeper. 

The clue is in the run chart but we need to know what to look for.  We do not know how to do that yet so we need to ask for some more data.
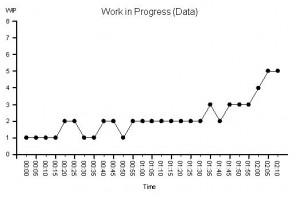
We are given this run chart – which is a count of the number of tasks being worked on recorded at 5 minute intervals. It is the work in progress run chart.

We know that we have a three step process and three separate resources – one for each step. So we know that that if there is a WIP of less than 3 we must have idle resources; and if there is a WIP of more than 3 we must have queues of tasks waiting.

We can see that the WIP run chart looks a bit like the lead time run chart.  But it still does not tell us what is causing the unstable behaviour.

In fact we do already have all the data we need to work it out but it is not intuitively obvious how to do it. We feel we need to dig deeper.

 We decide to go and see for ourselves and to observe exactly what happens to each of the twelve tasks and each of the three resources. We use these observations to draw a Gantt chart.
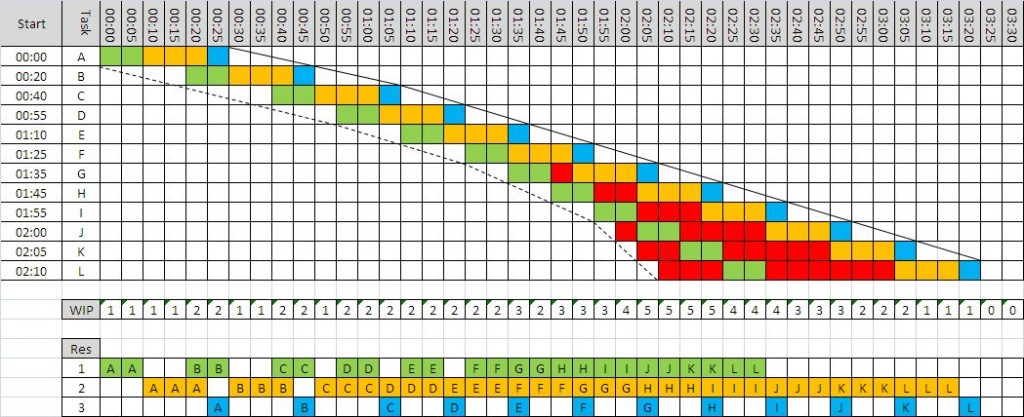
Now we can see what is happening.

We can see that the cycle time of Step 1 (green) is 10 mins; the cycle time for Step 2 (amber) is 15 mins; and the cycle time for Step 3 (blue) is 5 mins.


This explains why the minimum lead time was 30 mins: 10+15+5 = 30 mins. OK – that makes sense now.

Red means tasks waiting and we can see that a lead time longer than 30 mins is associated with waiting – which means one or more queues.  We can see that there are two queues – the first between Step 1 and Step 2 which starts to form at Task G and then grows; and the second before Step 1 which first appears for Task J  and then grows. So what changes at Task G and Task J?

Looking at the chart we can see that the slope of the left hand edge is changing – it is getting steeper – which means tasks are arriving faster and faster. We look at the interval between the start times and it confirms our suspicion. This data was the clue in the original lead time run chart. 

Looking more closely at the differences between the start times we can see that the first three arrive at one every 20 mins; the next three at one every 15 mins; the next three at one every 10 mins and the last three at one every 5 mins.

Ah ha!

Tasks are being pushed  into the process at an increasing rate that is independent of the rate at which the process can work.     

When we compare the rate of arrival with the cycle time of each step in a process we find that one step will be most exposed – it is called the constraint step and it is the step that controls the flow in the whole process. The constraint cycle time is therefore the critical metric that determines the maximum flow in the whole process – irrespective of how many steps it has or where the constraint step is situated.

If we push tasks into the process slower than the constraint cycle time then all the steps in the process will be able to keep up and no queues will form – but all the resources will be under-utilised. Tasks A to C;

If we push tasks into the process faster than the cycle time of any step then queues will grow upstream of these multiple constraint steps – and those queues will grow bigger, take up space and take up time, and will progressively clog up the resources upstream of the constraints while starving those downstream of work. Tasks G to L.

The optimum is when the work arrives at the same rate as the cycle time of the constraint – this is called pull and it means that the constraint is as the pacemaker and used to pull the work into the process. Tasks D to F.

With this new understanding we can see that the correct rate to load this process is one task every 15 mins – the cycle time of Step 2.
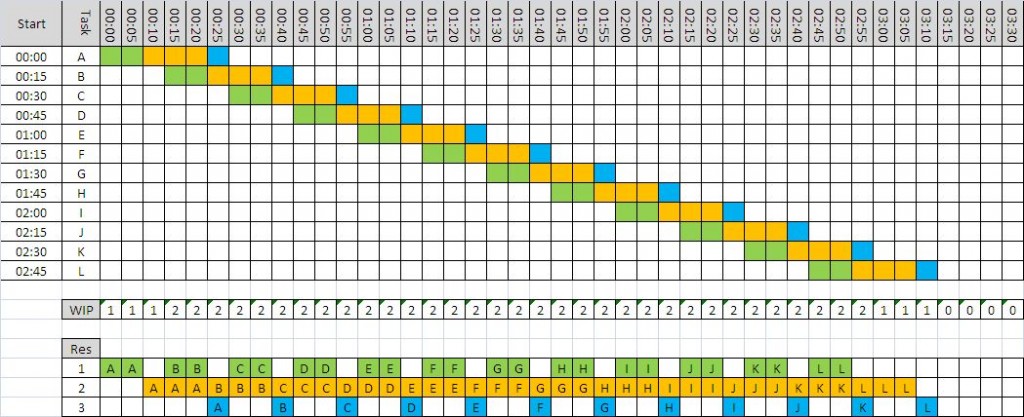
We can use a Gantt chart to predict what would happen.

The waiting is eliminated, the lead time is stable and meeting our expectation, and when task B arrives thw WIP is 2 and stays stable.

In this example we can see that there is now spare capacity at the end for another task – we could increase our productivity; and we can see that we need less space to store the queue which also improves our productivity.  Everyone wins. This is called pull scheduling.  Pull is a more productive design than push. 

To improve process productivity it is necessary to measure the sequence and cycle time of every step in the process.  Without that information it is impossible to understand and rationally improve our process.     

BUT in reality we have to deal with variation – in everything – so imagine how hard it is to predict how a multi-step process will behave when work is being pumped into it at a variable rate and resources come and go! No wonder so many processes feel unpredictable, chaotic, unstable, out-of-control and impossible to both understand and predict!

This feeling is an illusion because by learning and using the tools and techniques of Improvement Science it is possible to design and predict-within-limits how these complex systems will behave.  Improvement Science can unravel this Gordian knot!  And it is not intuitively obvious. If it were we would be doing it.

FISH

Several years ago I read an inspirational book called Fish! which recounts the tale of a manager who is given the task of “sorting out” the worst department in her organisation – a department that everyone hated to deal with and that everyone hated to work in. The nickname was The Toxic Energy Dump.

The story retells how, by chance, she stumbled across help in the unlikeliest of places – the Pike Place fish market in Seattle.  There she learned four principles that transformed her department and her worklife:

1. Work Made Fun Gets Done
2. Make Someone’s Day
3. Be Fully Present
4. Choose Your Attitude

 The take home lesson from Fish! is that we make our work miserable by the way we behave towards each other.   So if we are unhappy at work and we do nothing about our behaviour then our misery will continue.

This means we can choose to make work enjoyable – and it is the responsibility of leaders at all levels to create the context for this to happen.  Miserable staff = poor leadership.  And leadership starts with the leader.  

  • Effective leadership is inspiring others to achieve through example.
  • Leadership does not work without trust. 
  • Play is more than an activity – it is creative energy – and requires a culture of trust not a culture of fear. 
  • To make someone’s day all you need to so is show them how much you appreciate them. 
  • The attitude and behaviour of a leader has a powerful effect on those that they lead.
  • Effective leaders know what they stand for and ask others to hold them to account.

FISH has another meaning – it stands for Foundations of Improvement Science for Health – and it is the core set of skills needed to create a SELF – a Safe Environment for Learning and Fun.  The necessary context for culture change. It is more than that though – FISH also includes the skills to design more productive processes – releasing valuable lifetime and energy to invest in creative fun.  

Fish are immersed in their environment – and so are people. We learn by immersion in reality. Rhetoric – be it thinking, talking or writing – is a much less effective teacher.

So all we have to do is co-create a context for improvement and then immerse ourselves in it. The improvement that results is an inevitable consequence of th design. We design our system for improvement and it improves itself.

To learn more about Foundations of Improvement Science for Health (FISH)  click: here 

Single Sell System

In the pursuit of improvement it must be remembered that the system must remain viable: better but dead is not the intended outcome.  Viability of socioeconomic systems implies that money is flowing to where it is needed, when it is needed and in the amounts that are needed.

Money is like energy – it only does worthwhile work when it is moving: so the design of more effective money-streams is a critical part of socioeconomic system improvement.

But this is not easy or obvious because the devil is in the detail and complexity grows quicklyand obscures the picture. This lack of clear picture creates the temptation to clean, analyse, simplify and conceptualise and very often leads to analysis-paralysis and then over-simplification.

There is a useful metaphor for this challenge.

Biological systems use energy rather than money and the process of improvement has a different name – it is called evolution. Each of us is an evolution experiment. The viability requirement is the same though – the success of the experiment is measured by our viability. Do our genes and memes survive after we have gone?

It is only in recent times that the mechanism of this biological system has become better understood. It was not until the 19th Century that we realised that complex organisms were made of reproducing cells; and later that there were rules that governed how inherited characteristics passed from generation to generation; and that the vehicle of transmission was a chemical code molecule called DNA that is present in every copy of every cell capable of reproduction.

We learned that our chemical blueprint is stored in the nucleus of every cell (the dark spots in the picture of cells) and this led to the concept that the nucleus worked like a “brain” that issues chemical orders to the cell in the form of a very similar molecule called RNA.  This cellular command-and-control model is unfortunately more a projection of the rhetoric of society than the reality of the situation. The nucleus is not a “brain” – it is a gonad. The “brain” of a cell is the surface membrane – the sensitive interface between outside and inside; where the “sensor” molecules in the outer cell membrane connect to “effector” molecules on the inside.  Cells think with their skin – and their behaviour is guided by their  internal content and external context. Nature and nurture working as a system.

Cells have evolved to collaborate. Rogue cells that become “mentally” unstable and that break away, start to divide, and spread in an uncollaborative and selfish fashion threaten the viability of the whole: they are called malignant. The threat of malignant behaviour to long term viability is so great that we have evolved sophisticated mechanisms to detect and correct malignant behaviour. The fact that cancer is still a problem is because our malignancy defense mechanisms are not 100% effective. 

This realisation of the importance of the cell has led to a focus of medical research on understand how individual cells “sense”, “think”, “act” and “communicate” and has led to great leaps in our understanding of how multi-celled systems called animals and plants work; how they can go awry; and what can be done to prevent and correct these cellular niggles.  We are even learning how to “fix” bits of the the chemical blueprint to correct our chemical software glitches. We are no where near being able to design a cell from scratch though. We simply do not understand enough about how it works.

In comparison, the “single-sell” in an economic system could be considered to be a step in a process – the point where the stream and the silo meet – where expenses are converted to revenue for example.  I will wantonly bend the rules of grammar and use the word “sell” to distinguish it visually from “cell”. So before trying to understand the complex emergent behaviour of a multi-selled economic system we first need to understand better one sell works. How does work flow and time flow and money flow combined at the single sell?

When we do so we learn that the “economic mechanism” of a single sell can be described completely because it is a manfestation of the Laws of Physics – just as the mechanism of the weather can be describe using a small number of equations that combine to describe the flow, pressure, density, temperature etc of the atmospheric gases.  Our simplest single-selled economic system is described by a set of equations – there are about twenty of them in fact.

So, trying to work out in our heads how even a single sell in an economic system will behave amounts to mentally managing twenty simultanous equations – which is a bit of a problem because we’re not very good at that mental maths trick. The best we can do is to learn the patterns in the interdependent behaviour of the outputs of the equations; to recognise what they imply; and then how to use that understanding to craft wiser decisions.

No wonder the design of a viable socioeconomic multi-selled system seems to be eluding even the brightest economic minds at the moment!  It is a complicated system which exhibits complex behaviour.  Is there a better approach?  Our vastly more complex biological counterparts called “organisms” seem to have discovered one. So what can we learn from them?

One lesson might be that is is a good design to detect and correct malignant behaviour early; the unilateral, selfish, uncollaborative behaviour that multiplies, spreads, and becomes painful, incurable then lethal.

First we need to raise awareness and recognition of it … only then can we challenge and contain its toxic legacy.   

Systemory

How do we remember the vast amount of information that we seem to be capable of?

Our brains are comprised of billions of cells most of which are actually inactive and just there to support the active brain cells – the neurons.

Suppose that the active brain cell part is 50% and our brain has a volume of about 1.2 litres or 1,200 cu.cm or 1,200,000 cu.mm. We know from looking down a microscope that each neuron is about 20/1,000 mm x 20/1,000 mm  x 20/1,000 mm which gives a volume of 8/1,000,000 cu.mm or 125,000 neurons for every cu.mm. The population of a medium sized town in a grain of salt!  This is a concept we can just about grasp. And with these two facts we estimate that there are in the order of 140,000,000,000 neurons in a human brain – 140 billion – about 20 times the population of the whole World. Wow!

But even that huge number is less than the size of the memory on the hard disc of the computer I am writing this blog on – which has 200 gigabytes which is 1,600 gigabits which is 1,600 billion bits. Ten times as many memory cells as there are neurons in a human brain. 

But our brains are not just for storing data – they do all the data processing too – it is an integrated processor-and-memory design completely unlike the separate processor-or-memory design of a digital computer.  Each of our brains is remarkable in its capability, adaptability, and agility – its ability to cope with change – its ability to learn and to change its behaviour while still working.  So how does our biological memory work?

Well not like a digital computer where the zeros and ones, the binary digits (bits) are stored in regular structure of memory cells – a static structural memory – a data prison.  Our biological memory works in a completely different way – it is a temporal memory – it is time dependent. Our memories are not “recalled” like getting a book out of an indexed slot on a numbered in a massive library; are memories are replayed like a recording or rebuilt from a recipe. Time is the critical factor and this concept of temporal memory is a feature of all systems.

And that is not all – the temporal memory is not a library of video tapes – it is the simultaneous collective action of many parts of the system that create the illusion of the temporal memory – we have a parallel-distributed-temporal-memory. More like a video hologram. And it means we cannot point to the “memory” part of our brains – it is distributed throughout the system – and this means that the connections between the parts are as critical a part of the design and the parts themselves. It is a tricky concept to grasp and none of the billions of digital computers that co-inhabit this planet operate this way. They are feeble and fragile in comparison. An inferior design.

The terms distributed-temporal or systemic-memory are a bit cumbersome though so we need a new label – let us call it a systemory.  The properties of a systemory are remarkable – for example it still works when a bit of the systemory is removed.  When a bit of your brain is removed you don’t “forget” a bit of your name or lose the left ear on the mental picture of your friends face – as would happen with a computer.  A systemory is resilient to damage which is a necessary design-for-survival. It also implies that we can build our systemory with imperfect parts and incomplete connections. In a digital computer this would not work: the localised-static or silo-memory has to be perfect because if a single bit gets flipped or a single wire gets fractured it can render the whole computer inoperative useless junk.

Another design-for-survival property of a systemory is that it still works even when it is being changed – it is continuously adaptable and updateable.  Not so a computer – to change the operating system the computer has to be stopped, the old program overwritten by the new one, then the new one started. In fact computers are designed to prevent programs modifying themselves – because it a sure recipe for a critical system failure – the dreaded blue screen!

So if we map our systemory concept across from person to population and we replace neurons with people then we get an inkling of how a society can have a collective memory, a collective intelligence, a collective consciousness even – a social systemory. We might call that property the culture.  We can also see that the relationships that link the people are as critical as the people themselves and that both can be imperfect yet we get stable and reliable behaviour. We can also see that influencing the relationships between people has as much effect on the system behaviour as how the people themselves perform – because the properties of the systemory are emergent. Culture is an output not an input.

So in the World – the development of global communication systems means that all 7 billion people in the global social systemory can, in principle, connect to each other and can collectively learn and change faster and faster as the technology to connect more widely and more quickly develops. The rate of culture change is no longer governed by physical constraints such as geographic location, orand temporal constraints such as how long a letter takes to be delivered.

Perhaps the most challenging implication is that a systemory does not have a “point of control” – there is no librarian who acts as a gatekeeper to the data bank, no guard on the data prison.  The concept of “control” in a systemory is different – it is global not local – and it is influence not control.  The rapid development of mobile communication technology and social networking gives ample evidence – we would now rather communicate with a familar on the other side of the world than with a stranger standing next to us in the lunch queue. We have become tweeting and texting daemons.  Our emotional relationships are more important than our geographical ones. And if enough people can connect to each other they can act in a collective, coordinated, adaptive and agile way that no command-and-control system can either command or control. The recent events in the Middle East are ample evidence of the emergent effectiveness of a social systemory.

Our insight exposes a weakness of a social systemory – it is possible to adversely affect the whole by introducing a behavioural toxin that acts at the social connection level – on the relationships between people. The behavioural toxin needs only to have a weak and apparently harmless effect but when disseminated globally the cumulative effect creates cultural dysfunction.  It is rather like the effect of alcohol and other recreational chemical substances on the brain – it cause a temporary systemory dysfunction – but one that in an over-stressed psychological system paradoxically results in pleasure; or rather stress release. Hence the self-reinforcing nature of the addiction.  

Effective leaders are intuitively aware that just their behaviour can be a tonic or a toxin for the whole system: organisations are the the same emotional boat as their leader.

Effective leaders use their behaviour to steer the systemory of the organisation along a path of improvement and their behaviour is the output of their personal systemory.

Leaders have to be the change that they want their organisations to achieve.