 One tangible output of process or system design exercise is a blueprint.
This is the set of Policies that define how the design is built and how it is operated so that it delivers the specified performance.
These are just like the blueprints for an architectural design, the latter being the tangible structure, the former being the intangible function.
A computer system has the same two interdependent components that must be co-designed at the same time: the hardware and the software.
The functional design of a system is manifest as the Seven Flows and one of these is Cash Flow, because if the cash does not flow to the right place at the right time in the right amount then the whole system can fail to meet its design requirement. That is one reason why we need accountants – to manage the money flow – so a critical component of the system design is the Budget Policy.
We employ accountants to police the Cash Flow Policies because that is what they are trained to do and that is what they are good at doing – they are the Guardians of the Cash.
Providing flow-capacity requires providing resource-capacity, which requires providing resource-time; and because resource-time-costs-money then the flow-capacity design is intimately linked to the budget design.
This raises some important questions:
Q: Who designs the budget policy?
Q: Is the budget design done as part of the system design?
Q: Are our accountants trained in system design?
The challenge for all organisations is to find ways to improve productivity, to provide more for the same in a not-for-profit organisation, or to deliver a healthy return on investment in the for-profit arena (and remember our pensions are dependent on our future collective productivity).
To achieve the maximum cash flow (i.e. revenue) at the minimum cash cost (i.e. expense) then both the flow scheduling policy and the resource capacity policy must be co-designed to deliver the maximum productivity performance.
If we have a single-step process it is relatively easy to estimate both the costs and the budget to generate the required activity and revenue; but how do we scale this up to the more realistic situation when the flow of work crosses many departments – each of which does different work and has different skills, resources and budgets?
Q: Does it matter that these departments and budgets are managed independently?
Q: If we optimise the performance of each department separately will we get the optimum overall system performance?
Our intuition suggests that to maximise the productivity of the whole system we need to maximise the productivity of the parts. Yes – that is clearly necessary – but is it sufficient?
To answer this question we will consider a process where the stream flows though several separate steps – separate in the sense that that they have separate budgets – but not separate in that they are linked by the same flow.
The separate budgets are allocated from the total revenue generated by the outflow of the process. For the purposes of this exercise we will assume the goal is zero profit and we just need to calculate the price that needs to be charged the “customer” for us to break even.
The internal reports produced for each of our departments for each time period are:
1. Activity – the amount of work completed in the period.
2. Expenses – the cost of the resources made available in the period – the budget.
3. Utilisation – the ratio of the time spent using resources to the total time the resources were available.
We know that the theoretical maximum utilisation of resources is 100% and this can only be achieved when there is zero-variation. This is impossible in the real world but we will assume it is achievable for the purpose of this example.
There are three questions we need answers to:
Q1: What is the lowest price we can achieve and meet the required demand?
Q2: Will optimising each step independently step give us this lowest price?
Q3: How do we design our budgets to deliver maximum productivity?
To explore these questions let us play with a real example.
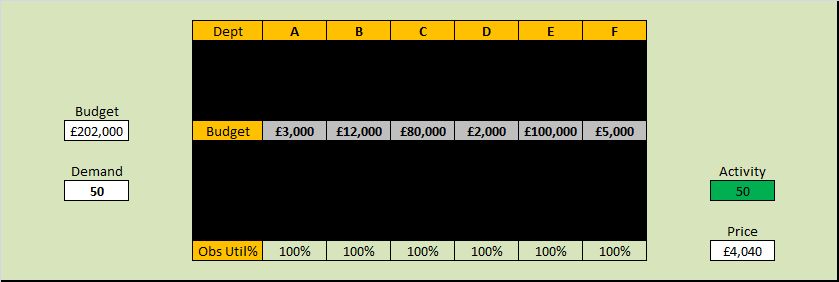
Let us assume we have a single stream of work that crosses six separate departments labelled A-F in that sequence. The department budgets have been allocated based on historical activity and utilisation and our required activity of 50 jobs per time period. We have already worked hard to remove all the errors, variation and “waste” within each department and we have achieved 100% observed utilisation of all our resources. We are very proud of our high effectiveness and our high efficiency.

Our current not-for-profit price is £202,000/50 = £4,040 and because our observed utilisation of resources at each step is 100% we conclude this is the most efficient design and that this is the lowest possible price.
Unfortunately our celebration is short-lived because the market for our product is growing bigger and more competitive and our market research department reports that to retain our market share we need to deliver 20% more activity at 80% of the current price!
A quick calculation shows that our productivity must increase by 50% (New Activity/New Price = 120%/80% = 150%) but as we already have a utilisation of 100% then this challenge looks hopelessly impossible. To increase activity by 20% will require increasing flow-capacity by 20% which will imply a 20% increase in costs so a 20% increase in budget – just to maintain the current price. If we no longer have customers who want to pay our current price then we are in trouble.
Fortunately our conclusion is incorrect – and it is incorrect because we are not using the data available to co-design the system such that cash flow and work flow are aligned. And we do not do that because we have not learned how to design-for-productivity. We are not even aware that this is possible. It is, and it is called Value Stream Accounting.
The blacked out boxes in the table above hid the data that we need to do this – an we do not know what they are. Yet.
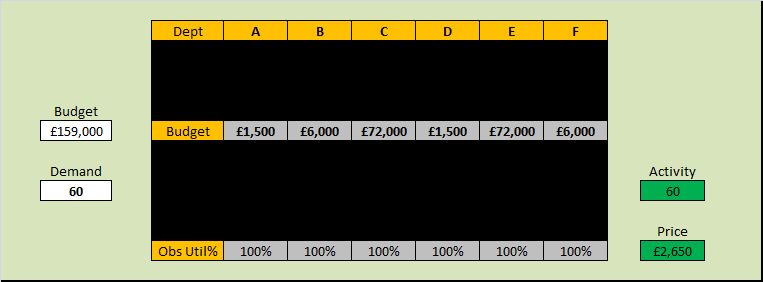
But if we apply the theory, techniques and tools of system design, and we use the data that is already available then we get this result …

We can see that the total budget is less, the budget allocations are different, the activity is 20% up and the zero-profit price is 34% less – which is a 83% increase in productivity!
More than enough to stay in business.
Yet the observed resource utilisation is still 100% and that is counter-intuitive and is a very surprising discovery for many. It is however the reality.
And it is important to be reminded that the work itself has not changed – the ONLY change here is the budget policy design – in other words the resource capacity available at each stage. A zero-cost policy change.
The example answers our first two questions:
A1. We now have a price that meets our customers needs, offers worthwhile work, and we stay in business.
A2. We have disproved our assumption that 100% utilisation at each step implies maximum productivity.
Our third question “How to do it?” requires learning the tools, techniques and theory of System Engineering and Design. It is not difficult and it is not intuitively obvious – if it were we would all be doing it.
Want to satisfy your curiosity?
Want to see how this was done?
Want to learn how to do it yourself?
You can do that here.
For more posts like this please vote here.
For more information please subscribe here.


