Business as Usual

At last the light appears to be visible at the end of the tunnel for Covid-19 in the UK. And we have our fingers-crossed that we can contemplate getting back to business as usual. What ever that is.

For the NHS, attention will no doubt return to patient access targets. The data has continued to be collected, processed and published for the last 16 months, so we are able to see the impact that the Covid-19 epidemic has had on the behaviour of the hospital-based emergency system. The Emergency Departments.

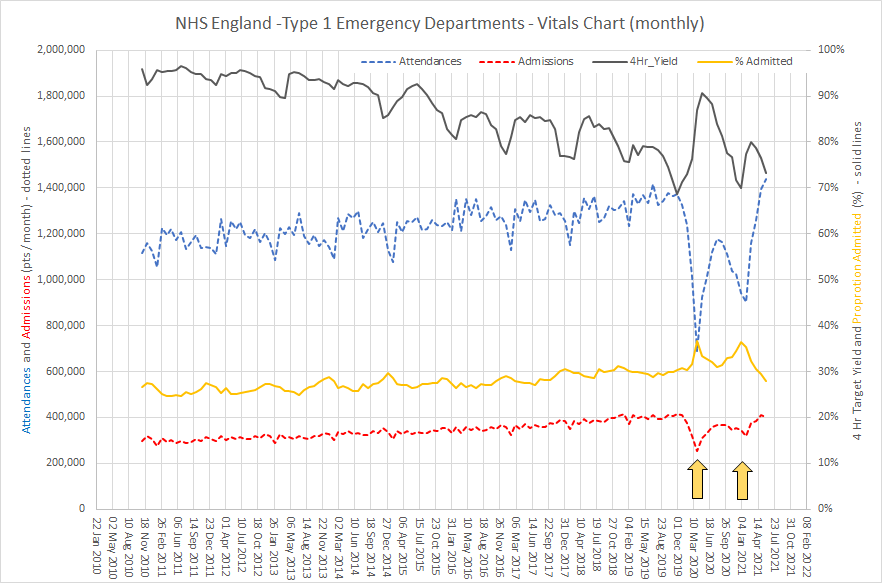
The run chart below shows the monthly reported ED metrics for England from Nov 2010.

The solid grey line is the infamous 4 Hr target – the proportion of ED attendances that are seen and admitted or discharged within 4 hours. It reveals that the progressive decline over the last decade improved during the first and second waves. And if we look for plausible causes we can see that the ED attendances dropped precipitously (blue dotted line) in both the first and second waves. We dutifully “Stayed at Home to Protect the NHS and Save Lives”.

The drop in ED attendances was accompanied by a drop in ED admissions (dotted red line) but a higher proportion of those who did attend were admitted (solid orange line) – which suggests they were sicker patients. So, all that makes sense.

And as restrictions are relaxed we can see that attendances, admissions, 4 Hr yield and proportion admitted are returning to the projected levels. Business as Usual.


Up to March 2021 the chart says that 70-75% of patients who attend ED did not need to be admitted to hospital. So this begs a raft of questions

Q1: What is that makes nearly 35,000 people per day to go to ED and then home?

Q2. How can the ED footfall drop by 50% almost overnight?

Q3. Where did those patients go for the services they were previously seeking in ED?

Q4. What were their outcomes?

Q5. What are the reasons they were choosing to go to ED rather than their GP before March 2020?

Q6. How much of the ED demand is spillover from Primary Care?

Q7: How much of the ED workload is diagnostic testing to exclude serious illness?

Q8: What lessons can be learned to mitigate the growing pressure on EDs?

Q9: Can urgent care services for this 70% be provided in a more distributed way?


And if we can do drive-thru urgent testing during Covid-19 and we can do and drive-thru urgent treatment during Covid-19 then perhaps we can do more drive-thru urgent care after Covid-19?

Warts-and-All

This week saw the publication of a landmark paper – one that will bring hope to many.  A paper that describes the first step of a path forward out of the mess that healthcare seems to be in.  A rational, sensible, practical, learnable and enjoyable path.


This week I also came across an idea that triggered an “ah ha” for me.  The idea is that the most rapid learning happens when we are making mistakes about half of the time.

And when I say ‘making a mistake’ I mean not achieving what we predicted we would achieve because that implies that our understanding of the world is incomplete.  In other words, when the world does not behave as we expect, we have an opportunity to learn and to improve our ability to make more reliable predictions.

And that ability is called wisdom.


When we get what we expect about half the time, and do not get what we expect about the other half of the time, then we have the maximum amount of information that we can use to compare and find the differences.

Was it what we did? Was it what we did not do? What are the acts and errors of commission and omission? What can we learn from those? What might we do differently next time? What would we expect to happen if we do?


And to explore this terrain we need to see the world as it is … warts and all … and that is the subject of the landmark paper that was published this week.


The context of the paper is improvement of cancer service delivery, and specifically of reducing waiting time from referral to first appointment.  This waiting is a time of extreme anxiety for patients who have suspected cancer.

It is important to remember that most people with suspected cancer do not have it, so most of the work of an urgent suspected cancer (USC) clinic is to reassure and to relieve the fear that the spectre of cancer creates.

So, the sooner that reassurance can happen the better, and for the unlucky minority who are diagnosed with cancer, the sooner they can move on to treatment the better.

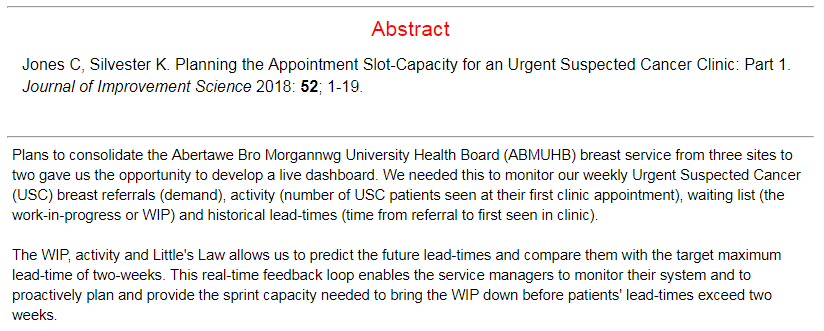
The more important paragraph in the abstract is the second one … which states that seeing the system behaviour as it is, warts-and-all,  in near-real-time, allows us to learn to make better decisions of what to do to achieve our intended outcomes. Wiser decisions.

And the reason this is the more important paragraph is because if we can do that for an urgent suspected cancer pathway then we can do that for any pathway.


The paper re-tells the first chapter of an emerging story of hope.  A story of how an innovative and forward-thinking organisation is investing in building embedded capability in health care systems engineering (HCSE), and is now delivering a growing dividend.  Much bigger than the investment on every dimension … better safety, faster delivery, higher quality and more affordability. Win-win-win-win.

The only losers are the “warts” – the naysayers and the cynics who claim it is impossible, or too “wicked”, or too difficult, or too expensive.

Innovative reality trumps cynical rhetoric … and the full abstract and paper can be accessed here.

So, well done to Chris Jones and the whole team in ABMU.

And thank you for keeping the candle of hope alight in these dark, stormy and uncertain times for the NHS.

Making NHS Data Count

The debate about how to sensibly report NHS metrics has been raging for decades.

So I am delighted to share the news that NHS Improvement have finally come out and openly challenged the dogma that two-point comparisons and red-amber-green (RAG) charts are valid methods for presenting NHS performance data.

Their rather good 147-page guide can be downloaded: HERE


The subject is something called a statistical process control (SPC) chart which sounds a bit scary!  The principle is actually quite simple:

Plot data that emerges over time as a picture that tells a story – #plotthedots

The  main trust of the guide is learning the ropes of how to interpret these pictures in a meaningful way and to avoid two traps (i.e. errors).

Trap #1 = Over-reacting to random variation.
Trap #2 = Under-reacting to non-random variation.

Both of these errors cause problems, but in different ways.


Over-reacting to random variation

Random variation is a fact of life.  No two days in any part of the NHS are the same.  Some days are busier/quieter than others.

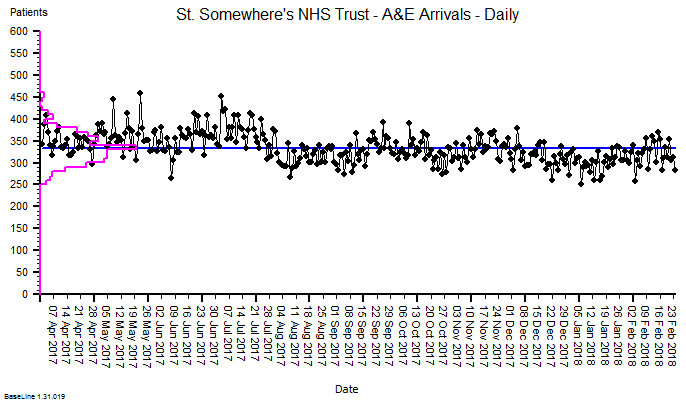
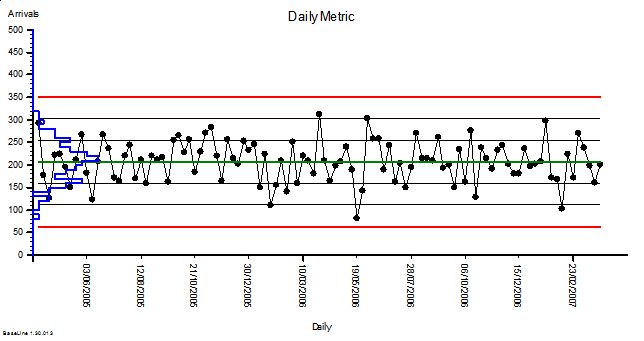
Plotting the daily-arrivals-in-A&E dots for a trust somewhere in England gives us this picture.  (The blue line is the average and the purple histogram shows the distribution of the points around this average.)

Suppose we were to pick any two days at random and compare the number of arrivals on those two days? We could get an answer anywhere between an increase of 80% (250 to 450) or a decrease of 44% (450 to 250).

But if we look at the while picture above we get the impression that, over time:

  1. There is an expected range of random-looking variation between about 270 and 380 that accounts for the vast majority of days.
  2. There are some occasional, exceptional days.
  3. There is the impression that average activity fell by about 10% in around August 2017.

So, our two-point comparison method seriously misleads us – and if we react to the distorted message that a two-point comparison generates then we run the risk of increasing the variation and making the problem worse.

Lesson: #plotthedots


One of the downsides of SPC is the arcane and unfamiliar language that is associated with it … terms like ‘common cause variation‘ and ‘special cause variation‘.  Sadly, the authors at NHS Improvement have fallen into this ‘special language’ trap and therefore run the risk of creating a new clique.

The lesson here is that SPC is a specific, simplified application of a more generic method called a system behaviour chart (SBC).

The first SPC chart was designed by Walter Shewhart in 1924 for one purpose and one purpose only – for monitoring the output quality of a manufacturing process in terms of how well the product conformed to the required specification.

In other words: SPC is an output quality audit tool for a manufacturing process.

This has a number of important implications for the design of the SPC tool:

  1. The average is not expected to change over time.
  2. The distribution of the random variation is expected to be bell-shaped.
  3. We need to be alerted to sudden shifts.

Shewhart’s chart was designed to detect early signs of deviation of a well-performing manufacturing process.  To detect possible causes that were worth investigating and minimise the adverse effects of over-reacting or under-reacting.


However,  for many reasons, the tool we need for measuring the behaviour of healthcare processes needs to be more sophisticated than the venerable SPC chart.  Here are three of them:

  1. The average is expected to change over time.
  2. The distribution of the random variation is not expected to be bell-shaped.
  3. We need to be alerted to slow drifts.

Under-Reacting to Non-Random Variation

Small shifts and slow drifts can have big cumulative effects.

Suppose I am a NHS service manager and I have a quarterly performance target to meet, so I have asked my data analyst to prepare a RAG chart to review my weekly data.

The quarterly target I need to stay below is 120 and my weekly RAG chart is set to show green when less than 108 (10% below target) and red when more than 132 (10% above target) because I know there is quite a lot of random week-to-week variation.
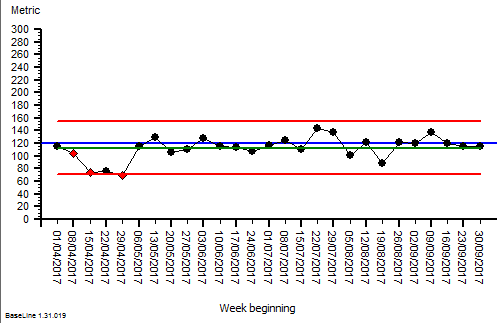
On the left is my weekly RAG chart for the first two quarters and I am in-the-green for both quarters (i.e. under target).

Q: Do I need to do anything?

A: The first quarter just showed “greens” and “ambers” so I relaxed and did nothing. There are a few “reds” in the second quarter, but about the same number as the “greens” and lots of “ambers” so it looks like I am about on target. I decide to do nothing again.

At the end of Q3 I’m in big trouble!

The quarterly RAG chart has flipped from Green to Red and I am way over target for the whole quarter. I missed the bus and I’m looking for a new job!

So, would a SPC chart have helped me here?

Here it is for Q1 and Q2.  The blue line is the target and the green line is the average … so below target for both quarters, as the RAG chart said.

The was a dip in Q1 for a few weeks but it was not sustained and the rest of the chart looks stable (all the points inside the process limits).  So, “do nothing” seemed like a perfectly reasonable strategy. Now I feel even more of a victim of fortune!

So, let us look at the full set of weekly date for the financial year and apply our  retrospectoscope.

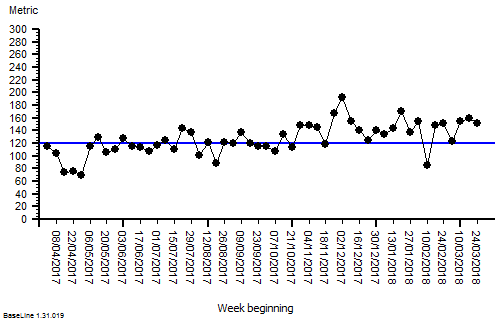
This is just a plain weekly performance run chart with the target limit plotted as the blue line.

It is clear from this that there is a slow upward drift and we can see why our retrospective quarterly RAG chart flipped from green to red, and why neither our weekly RAG chart nor our weekly SPC chart alerted us in time to avoid it!

This problem is often called ‘leading by looking in the rear view mirror‘.

The variation we needed to see was not random, it was a slowly rising average, but it was hidden in the random variation and we missed it.  So we under-reacted and we paid the price.


This example illustrates another limitation of both RAG charts and SPC charts … they are both insensitive to small shifts and slow drifts when there is lots of random variation around, which there usually is.

So, is there a way to avoid this trap?

Yes. We need to learn to use the more powerful system behaviour charts and the systems engineering techniques and tools that accompany them.


But that aside, the rather good 147-page guide from NHS Improvement is a good first step for those still using two-point comparisons and RAG charts and it can be downloaded: HERE

The Strangeness of LoS

It had been some time since Bob and Leslie had chatted so an email from the blue was a welcome distraction from a complex data analysis task.

<Bob> Hi Leslie, great to hear from you. I was beginning to think you had lost interest in health care improvement-by-design.

<Leslie> Hi Bob, not at all.  Rather the opposite.  I’ve been very busy using everything that I’ve learned so far.  It’s applications are endless, but I have hit a problem that I have been unable to solve, and it is driving me nuts!

<Bob> OK. That sounds encouraging and interesting.  Would you be able to outline this thorny problem and I will help if I can.

<Leslie> Thanks Bob.  It relates to a big issue that my organisation is stuck with – managing urgent admissions.  The problem is that very often there is no bed available, but there is no predictability to that.  It feels like a lottery; a quality and safety lottery.  The clinicians are clamoring for “more beds” but the commissioners are saying “there is no more money“.  So the focus has turned to reducing length of stay.

<Bob> OK.  A focus on length of stay sounds reasonable.  Reducing that can free up enough beds to provide the necessary space-capacity resilience to dramatically improve the service quality.  So long as you don’t then close all the “empty” beds to save money, or fall into the trap of believing that 85% average bed occupancy is the “optimum”.

<Leslie> Yes, I know.  We have explored all of these topics before.  That is not the problem.

<Bob> OK. What is the problem?

<Leslie> The problem is demonstrating objectively that the length-of-stay reduction experiments are having a beneficial impact.  The data seems to say they they are, and the senior managers are trumpeting the success, but the people on the ground say they are not. We have hit a stalemate.


<Bob> Ah ha!  That old chestnut.  So, can I first ask what happens to the patients who cannot get a bed urgently?

<Leslie> Good question.  We have mapped and measured that.  What happens is the most urgent admission failures spill over to commercial service providers, who charge a fee-per-case and we have no choice but to pay it.  The Director of Finance is going mental!  The less urgent admission failures just wait on queue-in-the-community until a bed becomes available.  They are the ones who are complaining the most, so the Director of Governance is also going mental.  The Director of Operations is caught in the cross-fire and the Chief Executive and Chair are doing their best to calm frayed tempers and to referee the increasingly toxic arguments.

<Bob> OK.  I can see why a “Reduce Length of Stay Initiative” would tick everyone’s Nice If box.  So, the data analysts are saying “the length of stay has come down since the Initiative was launched” but the teams on the ground are saying “it feels the same to us … the beds are still full and we still cannot admit patients“.

<Leslie> Yes, that is exactly it.  And everyone has come to the conclusion that demand must have increased so it is pointless to attempt to reduce length of stay because when we do that it just sucks in more work.  They are feeling increasingly helpless and hopeless.

<Bob> OK.  Well, the “chronic backlog of unmet need” issue is certainly possible, but your data will show if admissions have gone up.

<Leslie> I know, and as far as I can see they have not.

<Bob> OK.  So I’m guessing that the next explanation is that “the data is wonky“.

<Leslie> Yup.  Spot on.  So, to counter that the Information Department has embarked on a massive push on data collection and quality control and they are adamant that the data is complete and clean.

<Bob> OK.  So what is your diagnosis?

<Leslie> I don’t have one, that’s why I emailed you.  I’m stuck.


<Bob> OK.  We need a diagnosis, and that means we need to take a “history” and “examine” the process.  Can you tell me the outline of the RLoS Initiative.

<Leslie> We knew that we would need a baseline to measure from so we got the historical admission and discharge data and plotted a Diagnostic Vitals Chart®.  I have learned something from my HCSE training!  Then we planned the implementation of a visual feedback tool that would show ward staff which patients were delayed so that they could focus on “unblocking” the bottlenecks.  We then planned to measure the impact of the intervention for three months, and then we planned to compare the average length of stay before and after the RLoS Intervention with a big enough data set to give us an accurate estimate of the averages.  The data showed a very obvious improvement, a highly statistically significant one.

<Bob> OK.  It sounds like you have avoided the usual trap of just relying on subjective feedback, and now have a different problem because your objective and subjective feedback are in disagreement.

<Leslie> Yes.  And I have to say, getting stuck like this has rather dented my confidence.

<Bob> Fear not Leslie.  I said this is an “old chestnut” and I can say with 100% confidence that you already have what you need in your T4 kit bag?

<Leslie>Tee-Four?

<Bob> Sorry, a new abbreviation. It stands for “theory, techniques, tools and training“.

<Leslie> Phew!  That is very reassuring to hear, but it does not tell me what to do next.

<Bob> You are an engineer now Leslie, so you need to don the hard-hat of Improvement-by-Design.  Start with your Needs Analysis.


<Leslie> OK.  I need a trustworthy tool that will tell me if the planned intervention has has a significant impact on length of stay, for better or worse or not at all.  And I need it to tell me that quickly so I can decide what to do next.

<Bob> Good.  Now list all the things that you currently have that you feel you can trust.

<Leslie> I do actually trust that the Information team collect, store, verify and clean the raw data – they are really passionate about it.  And I do trust that the front line teams are giving accurate subjective feedback – I work with them and they are just as passionate.  And I do trust the systems engineering “T4” kit bag – it has proven itself again-and-again.

<Bob> Good, and I say that because you have everything you need to solve this, and it sounds like the data analysis part of the process is a good place to focus.

<Leslie> That was my conclusion too.  And I have looked at the process, and I can’t see a flaw. It is driving me nuts!

<Bob> OK.  Let us take a different tack.  Have you thought about designing the tool you need from scratch?

<Leslie> No. I’ve been using the ones I already have, and assume that I must be using them incorrectly, but I can’t see where I’m going wrong.

<Bob> Ah!  Then, I think it would be a good idea to run each of your tools through a verification test and check that they are fit-4-purpose in this specific context.

<Leslie> OK. That sounds like something I haven’t covered before.

<Bob> I know.  Designing verification test-rigs is part of the Level 2 training.  I think you have demonstrated that you are ready to take the next step up the HCSE learning curve.

<Leslie> Do you mean I can learn how to design and build my own tools?  Special tools for specific tasks?

<Bob> Yup.  All the techniques and tools that you are using now had to be specified, designed, built, verified, and validated. That is why you can trust them to be fit-4-purpose.

<Leslie> Wooohooo! I knew it was a good idea to give you a call.  Let’s get started.


[Postscript] And Leslie, together with the other stakeholders, went on to design the tool that they needed and to use the available data to dissolve the stalemate.  And once everyone was on the same page again they were able to work collaboratively to resolve the flow problems, and to improve the safety, flow, quality and affordability of their service.  Oh, and to know for sure that they had improved it.

Unknown-Knowns

This is the now-infamous statement that Donald Rumsfeld made at a Pentagon Press Conference which triggered some good-natured jesting from the assembled journalists.

But there is a problem with it.

There is a fourth combination that he does not mention: the Unknown-Knowns.

Which is a shame because they are actually the most important because they cause the most problems.  Avoidable problems.


Suppose there is a piece of knowledge that someone knows but that someone else does not; then we have an unknown-known.

None of us know everything and we do not need to, because knowledge that is of no value to us is irrelevant for us.

But what happens when the unknown-known is of value to us, and more than that; what happens when it would be reasonable for someone else to expect us to know it; because it is our job to know.


A surgeon would be not expected to know a lot about astronomy, but they would be expected to know a lot about anatomy.


So, what happens if we become aware that we are missing an important piece of knowledge that is actually already known?  What is our normal human reaction to that discovery?

Typically, our first reaction is fear-driven and we express defensive behaviour.  This is because we fear the potential loss-of-face from being exposed as inept.

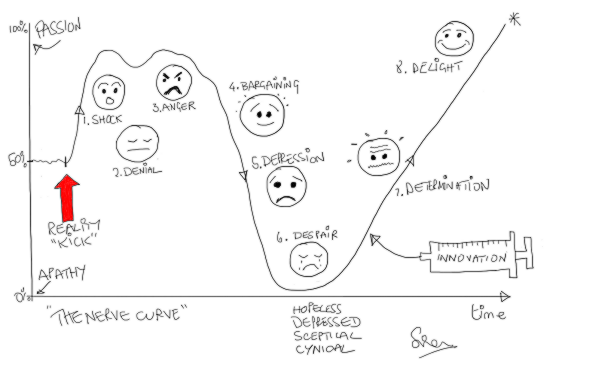
From this sudden shock we then enter a characteristic emotional pattern which is called the Nerve Curve.

After the shock of discovery we quickly flip into denial and, if that does not work then to anger (i.e. blame).  We ignore the message and if that does not work we shoot the messenger.


And when in this emotionally charged state, our rationality tends to take a back seat.  So, if we want to benefit from the discovery of an unknown-known, then we have to learn to bite-our-lip, wait, let the red mist dissipate, and then re-examine the available evidence with a cool, curious, open mind.  A state of mind that is receptive and open to learning.


Recently, I was reminded of this.


The context is health care improvement, and I was using a systems engineering framework to conduct some diagnostic data analysis.

My first task was to run a data-completeness-verification-test … and the data I had been sent did not pass the test.  There was some missing.  It was an error of omission (EOO) and they are the hardest ones to spot.  Hence the need for the verification test.

The cause of the EOO was an unknown-known in the department that holds the keys to the data warehouse.  And I have come across this EOO before, so I was not surprised.

Hence the need for the verification test.

I was not annoyed either.  I just fed back the results of the test, explained what the issue was, explained the cause, and they listened and learned.


The implication of this specific EOO is quite profound though because it appears to be ubiquitous across the NHS.

To be specific it relates to the precise details of how raw data on demand, activity, length of stay and bed occupancy is extracted from the NHS data warehouses.

So it is rather relevant to just about everything the NHS does!

And the error-of-omission leads to confusion at best; and at worst … to the following sequence … incomplete data =>  invalid analysis => incorrect conclusion => poor decision => counter-productive action => unintended outcome.

Does that sound at all familiar?


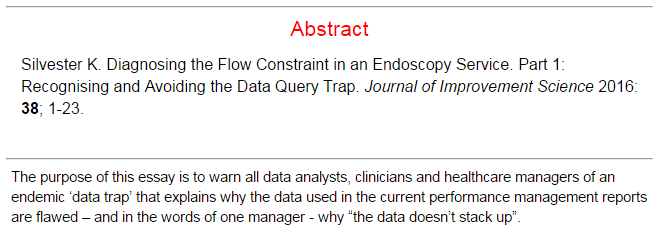
So, if would you like to learn about this valuable unknown-known is then I recommend the narrative by Dr Kate Silvester, an internationally recognised expert in healthcare improvement.  In it, Kate re-tells the story of her emotional roller-coaster ride when she discovered she was making the same error.


Here is the link to the full abstract and where you can download and read the full text of Kate’s excellent essay, and help to make it a known-known.

That is what system-wide improvement requires – sharing the knowledge.

Catch-22

There is a Catch-22 in health care improvement and it goes a bit like this:

Most people are too busy fire-fighting the chronic chaos to have time to learn how to prevent the chaos, so they are stuck.

There is a deeper Catch-22 as well though:

The first step in preventing chaos is to diagnose the root cause and doing that requires experience, and we don’t have that experience available, and we are too busy fire-fighting to develop it.


Health care is improvement science in action – improving the physical and psychological health of those who seek our help. Patients.

And we have a tried-and-tested process for doing it.

First we study the problem to arrive at a diagnosis; then we design alternative plans to achieve our intended outcome and we decide which plan to go with; and then we deliver the plan.

Study ==> Plan ==> Do.

Diagnose  ==> Design & Decide ==> Deliver.

But here is the catch. The most difficult step is the first one, diagnosis, because there are many different illnesses and they often present with very similar patterns of symptoms and signs. It is not easy.

And if we make a poor diagnosis then all the action plans that follow will be flawed and may lead to disappointment and even harm.

Complaints and litigation follow in the wake of poor diagnostic ability.

So what do we do?

We defer reassuring our patients, we play safe, we request more tests and we refer for second opinions from specialists. Just to be on the safe side.

These understandable tactics take time, cost money and are not 100% reliable.  Diagnostic tests are usually precisely focused to answer specific questions but can have false positive and false negative results.

To request a broad batch of tests in the hope that the answer will appear like a rabbit out of a magician’s hat is … mediocre medicine.


This diagnostic dilemma arises everywhere: in primary care and in secondary care, and in non-urgent and urgent pathways.

And it generates extra demand, more work, bigger queues, longer delays, growing chaos, and mounting frustration, disappointment, anxiety and cost.

The solution is obvious but seemingly impossible: to ensure the most experienced diagnostician is available to be consulted at the start of the process.

But that must be impossible because if the consultants were seeing the patients first, what would everyone else do?  How would they learn to become more expert diagnosticians? And would we have enough consultants?


When I was a junior surgeon I had the great privilege to have the opportunity to learn from wise and experienced senior surgeons, who had seen it, and done it and could teach it.

Mike Thompson is one of these.  He is a general surgeon with a special interest in the diagnosis and treatment of bowel cancer.  And he has a particular passion for improving the speed and accuracy of the diagnosis step; because it can be a life-saver.

Mike is also a disruptive innovator and an early pioneer of the use of endoscopy in the outpatient clinic.  It is called point-of-care testing nowadays, but in the 1980’s it was a radically innovative thing to do.

He also pioneered collecting the symptoms and signs from every patient he saw, in a standard way using a multi-part printed proforma. And he invested many hours entering the raw data into a computer database.

He also did something that even now most clinicians do not do; when he knew the outcome for each patient he entered that into his database too – so that he could link first presentation with final diagnosis.


Mike knew that I had an interest in computer-aided diagnosis, which was a hot topic in the early 1980’s, and also that I did not warm to the Bayesian statistical models that underpinned it.  To me they made too many simplifying assumptions.

The human body is a complex adaptive system. It defies simplification.

Mike and I took a different approach.  We  just counted how many of each diagnostic group were associated with each pattern of presenting symptoms and signs.

The problem was that even his database of 8000+ patients was not big enough! This is why others had resorted to using statistical simplifications.

So we used the approach that an experienced diagnostician uses.  We used the information we had already gleaned from a patient to decide which question to ask next, and then the next one and so on.


And we always have three pieces of information at the start – the patient’s age, gender and presenting symptom.

What surprised and delighted us was how easy it was to use the database to help us do this for the new patients presenting to his clinic; the ones who were worried that they might have bowel cancer.

And what surprised us even more was how few questions we needed to ask arrive at a statistically robust decision to reassure-or-refer for further tests.

So one weekend, I wrote a little computer program that used the data from Mike’s database and our simple bean-counting algorithm to automate this process.  And the results were amazing.  Suddenly we had a simple and reliable way of using past experience to support our present decisions – without any statistical smoke-and-mirror simplifications getting in the way.

The computer program did not make the diagnosis, we were still responsible for that; all it did was provide us with reliable access to a clear and comprehensive digital memory of past experience.


What it then enabled us to do was to learn more quickly by exploring the complex patterns of symptoms, signs and outcomes and to develop our own diagnostic “rules of thumb”.

We learned in hours what it would take decades of experience to uncover. This was hot stuff, and when I presented our findings at the Royal Society of Medicine the audience was also surprised and delighted (and it was awarded the John of Arderne Medal).

So, we called it the Hot Learning System, and years later I updated it with Mike’s much bigger database (29,000+ records) and created a basic web-based version of the first step – age, gender and presenting symptom.  You can have a play if you like … just click HERE.


So what are the lessons here?

  1. We need to have the most experienced diagnosticians at the start of the improvement process.
  2. The first diagnostic assessment can be very quick so long as we have developed evidence-based heuristics.
  3. We can accelerate the training in diagnostic skills using simple information technology and basic analysis techniques.

And exactly the same is true in the health care system improvement.

We need to have an experienced health care improvement practitioner involved at the start, because if we skip this critical study step and move to plan without a correct diagnosis, then we will make errors, poor decisions, and counter-productive actions.  And then generate more work, more queues, more delays, more chaos, more distress and increased costs.

Exactly the opposite of what we want.

Q1: So, how do we develop experienced improvement practitioners more quickly?

Q2: Is there a hot learning system for improvement science?

A: Yes, there is. It can be found here.

The Storyboard

This week about thirty managers and clinicians in South Wales conducted two experiments to test the design of the Flow Design Practical Skills One Day Workshop.

Their collective challenge was to diagnose and treat a “chronically sick” clinic and the majority had no prior exposure to health care systems engineering (HCSE) theory, techniques, tools or training.

Two of the group, Chris and Jat, had been delegates at a previous ODWS, and had then completed their Level-1 HCSE training and real-world projects.

They had seen it and done it, so this experiment was to test if they could now teach it.

Could they replicate the “OMG effect” that they had experienced and that fired up their passion for learning and using the science of improvement?

Continue reading “The Storyboard”

How Do We Know We Have Improved?

Phil and Pete are having a coffee and a chat.  They both work in the NHS and have been friends for years.

They have different jobs. Phil is a commissioner and an accountant by training, Pete is a consultant and a doctor by training.

They are discussing a challenge that affects them both on a daily basis: unscheduled care.

Both Phil and Pete want to see significant and sustained improvements and how to achieve them is often the focus of their coffee chats.


<Phil> We are agreed that we both want improvement, both from my perspective as a commissioner and from your perspective as a clinician. And we agree that what we want to see improvements in patient safety, waiting, outcomes, experience for both patients and staff, and use of our limited NHS resources.

<Pete> Yes. Our common purpose, the “what” and “why”, has never been an issue.  Where we seem to get stuck is the “how”.  We have both tried many things but, despite our good intentions, it feels like things are getting worse!

<Phil> I agree. It may be that what we have implemented has had a positive impact and we would have been even worse off if we had done nothing. But I do not know. We clearly have much to learn and, while I believe we are making progress, we do not appear to be learning fast enough.  And I think this knowledge gap exposes another “how” issue: After we have intervened, how do we know that we have (a) improved, (b) not changed or (c) worsened?

<Pete> That is a very good question.  And all that I have to offer as an answer is to share what we do in medicine when we ask a similar question: “How do I know that treatment A is better than treatment B?”  It is the essence of medical research; the quest to find better treatments that deliver better outcomes and at lower cost.  The similarities are strong.

<Phil> OK. How do you do that? How do you know that “Treatment A is better than Treatment B” in a way that anyone will trust the answer?

 <Pete> We use a science that is actually very recent on the scientific timeline; it was only firmly established in the first half of the 20th century. One reason for that is that it is rather a counter-intuitive science and for that reason it requires using tools that have been designed and demonstrated to work but which most of us do not really understand how they work. They are a bit like magic black boxes.

<Phil> H’mm. Please forgive me for sounding skeptical but that sounds like a big opportunity for making mistakes! If there are lots of these “magic black box” tools then how do you decide which one to use and how do you know you have used it correctly?

<Pete> Those are good questions! Very often we don’t know and in our collective confusion we generate a lot of unproductive discussion.  This is why we are often forced to accept the advice of experts but, I confess, very often we don’t understand what they are saying either! They seem like the medieval Magi.

<Phil> H’mm. So these experts are like ‘magicians’ – they claim to understand the inner workings of the black magic boxes but are unable, or unwilling, to explain in a language that a ‘muggle’ would understand?

<Pete> Very well put. That is just how it feels.

<Phil> So can you explain what you do understand about this magical process? That would be a start.


<Pete> OK, I will do my best.  The first thing we learn in medical research is that we need to be clear about what it is we are looking to improve, and we need to be able to measure it objectively and accurately.

<Phil> That  makes sense. Let us say we want to improve the patient’s subjective quality of the A&E experience and objectively we want to reduce the time they spend in A&E. We measure how long they wait. 

<Pete> The next thing is that we need to decide how much improvement we need. What would be worthwhile? So in the example you have offered we know that reducing the average time patients spend in A&E by just 30 minutes would have a significant effect on the quality of the patient and staff experience, and as a by-product it would also dramatically improve the 4-hour target performance.

<Phil> OK.  From the commissioning perspective there are lots of things we can do, such as commissioning alternative paths for specific groups of patients; in effect diverting some of the unscheduled demand away from A&E to a more appropriate service provider.  But these are the sorts of thing we have been experimenting with for years, and it brings us back to the question: How do we know that any change we implement has had the impact we intended? The system seems, well, complicated.

<Pete> In medical research we are very aware that the system we are changing is very complicated and that we do not have the power of omniscience.  We cannot know everything.  Realistically, all we can do is to focus on objective outcomes and collect small samples of the data ocean and use those in an attempt to draw conclusions can trust. We have to design our experiment with care!

<Phil> That makes sense. Surely we just need to measure the stuff that will tell us if our impact matches our intent. That sounds easy enough. What’s the problem?

<Pete> The problem we encounter is that when we measure “stuff” we observe patient-to-patient variation, and that is before we have made any changes.  Any impact that we may have is obscured by this “noise”.

<Phil> Ah, I see.  So if the our intervention generates a small impact then it will be more difficult to see amidst this background noise. Like trying to see fine detail in a fuzzy picture.

<Pete> Yes, exactly like that.  And it raises the issue of “errors”.  In medical research we talk about two different types of error; we make the first type of error when our actual impact is zero but we conclude from our data that we have made a difference; and we make the second type of error when we have made an impact but we conclude from our data that we have not.

<Phil> OK. So does that imply that the more “noise” we observe in our measure for-improvement before we make the change, the more likely we are to make one or other error?

<Pete> Precisely! So before we do the experiment we need to design it so that we reduce the probability of making both of these errors to an acceptably low level.  So that we can be assured that any conclusion we draw can be trusted.

<Phil> OK. So how exactly do you do that?

<Pete> We know that whenever there is “noise” and whenever we use samples then there will always be some risk of making one or other of the two types of error.  So we need to set a threshold for both. We have to state clearly how much confidence we need in our conclusion. For example, we often use the convention that we are willing to accept a 1 in 20 chance of making the Type I error.

<Phil> Let me check if I have heard you correctly. Suppose that, in reality, our change has no impact and we have set the risk threshold for a Type 1 error at 1 in 20, and suppose we repeat the same experiment 100 times – are you saying that we should expect about five of our experiments to show data that says our change has had the intended impact when in reality it has not?

<Pete> Yes. That is exactly it.

<Phil> OK.  But in practice we cannot repeat the experiment 100 times, so we just have to accept the 1 in 20 chance that we will make a Type 1 error, and we won’t know we have made it if we do. That feels a bit chancy. So why don’t we just set the threshold to 1 in 100 or 1 in 1000?

<Pete> We could, but doing that has a consequence.  If we reduce the risk of making a Type I error by setting our threshold lower, then we will increase the risk of making a Type II error.

<Phil> Ah! I see. The old swings-and-roundabouts problem. By the way, do these two errors have different names that would make it  easier to remember and to explain?

<Pete> Yes. The Type I error is called a False Positive. It is like concluding that a patient has a specific diagnosis when in reality they do not.

<Phil> And the Type II error is called a False Negative?

<Pete> Yes.  And we want to avoid both of them, and to do that we have to specify a separate risk threshold for each error.  The convention is to call the threshold for the false positive the alpha level, and the threshold for the false negative the beta level.

<Phil> OK. So now we have three things we need to be clear on before we can do our experiment: the size of the change that we need, the risk of the false positive that we are willing to accept, and the risk of a false negative that we are willing to accept.  Is that all we need?

<Pete> In medical research we learn that we need six pieces of the experimental design jigsaw before we can proceed. We only have three pieces so far.

<Phil> What are the other three pieces then?

<Pete> We need to know the average value of the metric we are intending to improve, because that is our baseline from which improvement is measured.  Improvements are often framed as a percentage improvement over the baseline.  And we need to know the spread of the data around that average, the “noise” that we referred to earlier.

<Phil> Ah, yes!  I forgot about the noise.  But that is only five pieces of the jigsaw. What is the last piece?

<Pete> The size of the sample.

<Phil> Eh?  Can’t we just go with whatever data we can realistically get?

<Pete> Sadly, no.  The size of the sample is how we control the risk of a false negative error.  The more data we have the lower the risk. This is referred to as the power of the experimental design.

<Phil> OK. That feels familiar. I know that the more experience I have of something the better my judgement gets. Is this the same thing?

<Pete> Yes. Exactly the same thing.

<Phil> OK. So let me see if I have got this. To know if the impact of the intervention matches our intention we need to design our experiment carefully. We need all six pieces of the experimental design jigsaw and they must all fall inside our circle of control. We can measure the baseline average and spread; we can specify the impact we will accept as useful; we can specify the risks we are prepared to accept of making the false positive and false negative errors; and we can collect the required amount of data after we have made the intervention so that we can trust our conclusion.

<Pete> Perfect! That is how we are taught to design research studies so that we can trust our results, and so that others can trust them too.

<Phil> So how do we decide how big the post-implementation data sample needs to be? I can see we need to collect enough data to avoid a false negative but we have to be pragmatic too. There would appear to be little value in collecting more data than we need. It would cost more and could delay knowing the answer to our question.

<Pete> That is precisely the trap than many inexperienced medical researchers fall into. They set their sample size according to what is achievable and affordable, and then they hope for the best!

<Phil> Well, we do the same. We analyse the data we have and we hope for the best.  In the magical metaphor we are asking our data analysts to pull a white rabbit out of the hat.  It sounds rather irrational and unpredictable when described like that! Have medical researchers learned a way to avoid this trap?

<Pete> Yes, it is a tool called a power calculator.

<Phil> Ooooo … a power tool … I like the sound of that … that would be a cool tool to have in our commissioning bag of tricks. It would be like a magic wand. Do you have such a thing?

<Pete> Yes.

<Phil> And do you understand how the power tool magic works well enough to explain to a “muggle”?

<Pete> Not really. To do that means learning some rather unfamiliar language and some rather counter-intuitive concepts.

<Phil> Is that the magical stuff I hear lurks between the covers of a medical statistics textbook?

<Pete> Yes. Scary looking mathematical symbols and unfathomable spells!

<Phil> Oh dear!  Is there another way for to gain a working understanding of this magic? Something a bit more pragmatic? A path that a ‘statistical muggle’ might be able to follow?

<Pete> Yes. It is called a simulator.

<Phil> You mean like a flight simulator that pilots use to learn how to control a jumbo jet before ever taking a real one out for a trip?

<Pete> Exactly like that.

<Phil> Do you have one?

<Pete> Yes. It was how I learned about this “stuff” … pragmatically.

<Phil> Can you show me?

<Pete> Of course.  But to do that we will need a bit more time, another coffee, and maybe a couple of those tasty looking Danish pastries.

<Phil> A wise investment I’d say.  I’ll get the the coffee and pastries, if you fire up the engines of the simulator.

The Lost Tribe

figures_lost_looking_at_map_anim_150_wht_15601

“Jingle Bells, Jingle Bells” announced Bob’s computer as he logged into the Webex meeting with Lesley.

<Bob> Hi Lesley, in case I forget later I’d like to wish you a Happy Christmas and hope that 2017 brings you new opportunity for learning and fun.

<Lesley> Thanks Bob, and I wish you the same. And I believe the blog last week pointed to some.

<Bob> Thank you and I agree;  every niggle is an opportunity for improvement and the “Houston we have a problem!” one is a biggie.

<Lesley> So how do we start on this one? It is massive!

<Bob> The same way we do on all niggles; we diagnose the root cause first. What do you feel they might be?

<Lesley> Well, following it backwards from your niggle, the board reports are created by the data analysts, and they will produce whatever they are asked to. It must be really irritating for them to have their work rubbished!

<Bob> Are you suggesting that they understand the flaws in what they are asked to do but keep quiet?

<Lesley> I am not sure they do, but there is clearly a gap between their intent and their impact. Where would they gain the insight? Do they have access to the sort of training I have am getting?

<Bob> That is a very good question, and until this week I would not have been able to answer, but an interesting report by the Health Foundation was recently published on that very topic. It is entitled “Understanding Analytical Capability In Health Care” and what it says is that there is a lost tribe of data analysts in the NHS.

<Lesley> How interesting! That certainly resonates with my experience.  All the data analysts I know seem to be hidden away behind their computers, caught in the cross-fire between between the boards and the wards, and very sensibly keeping their heads down and doing what they are asked to.

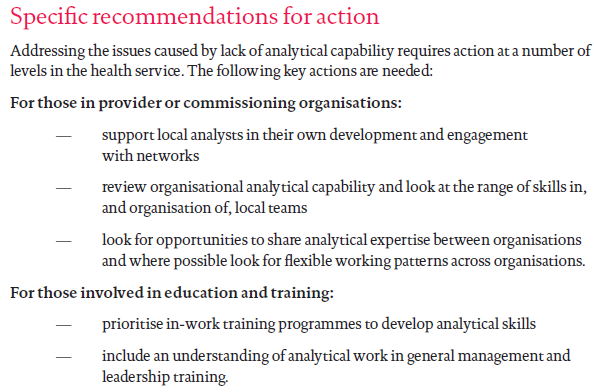
<Bob> That would certainly help to explain what we are seeing! And the good news is that Martin Bardsley, the author of the paper, has interviewed many people across the system, gathered their feedback, and offered some helpful recommendations.  Here is a snippet.

analysiscapability

<Lesley> I like these recommendations, especially the “in-work training programmes” and inclusion “in general management and leadership training“. But isn’t that one of the purposes of the CHIPs training?

<Bob> It is indeed, which is why it is good to see that Martin has specifically recommended it.

saasoftrecommended

<Lesley> Excellent! That means that my own investment in the CHIPs training has just gained in street value and that’s good for my CV. An unexpected early Xmas present. Thank you!

“Houston, we have a problem!”

The immortal words from Apollo 13 that alerted us to an evolving catastrophe …

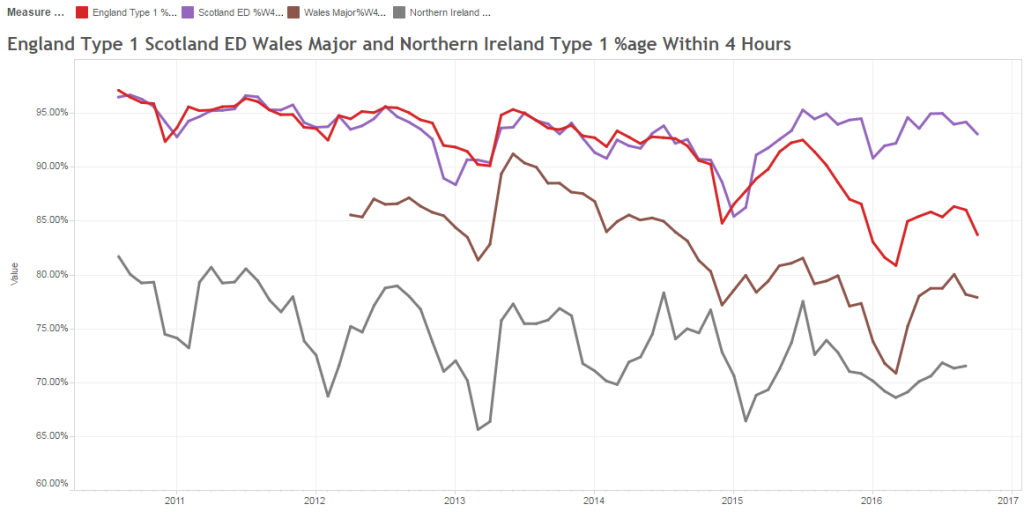
… and that is what we are seeing in the UK health and social care system … using the thermometer of A&E 4-hour performance. England is the red line.

uk_ae_runchart

The chart shows that this is not a sudden change, it has been developing over quite a long period of time … so why does it feel like an unpleasant surprise?


One reason may be that NHS England is using performance management techniques that were out of date in the 1980’s and are obsolete in the 2010’s!

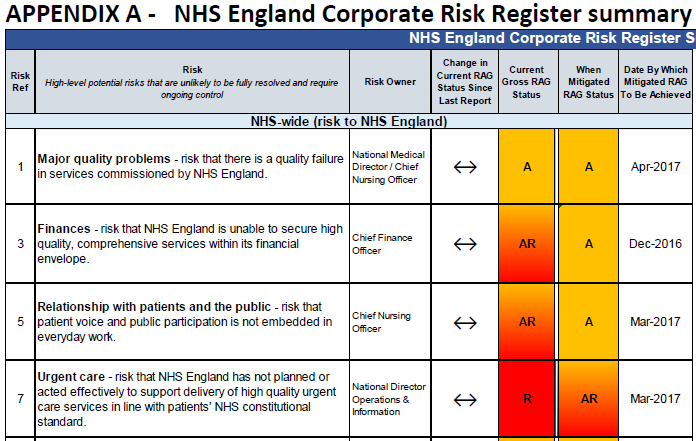
Let me show you what I mean. This is a snapshot from the NHS England Board Minutes for November 2016.

nhse_rag_nov_2016
RAG stands for Red-Amber-Green and what we want to see on a Risk Assessment is Green for the most important stuff like safety, flow, quality and affordability.

We are not seeing that.  We are seeing Red/Amber for all of them. It is an evolving catastrophe.

A risk RAG chart is an obsolete performance management tool.

Here is another snippet …

nhse_ae_nov_2016

This demonstrates the usual mix of single point aggregates for the most recent month (October 2016); an arbitrary target (4 hours) used as a threshold to decide failure/not failure; two-point comparisons (October 2016 versus October 2015); and a sprinkling of ratios. Not a single time-series chart in sight. No pictures that tell a story.

Click here for the full document (which does also include some very sensible plans to maintain hospital flow through the bank holiday period).

The risk of this way of presenting system performance data is that it is a minefield of intuitive traps for the unwary.  Invisible pitfalls that can lead to invalid conclusions, unwise decisions, potentially ineffective and/or counter-productive actions, and failure to improve. These methods are risky and that is why they should be obsolete.

And if NHSE is using obsolete tools than what hope do CCGs and Trusts have?


Much better tools have been designed.  Tools that are used by organisations that are innovative, resilient, commercially successful and that deliver safety, on-time delivery, quality and value for money. At the same time.

And they are obsolete outside the NHS because in the competitive context of the dog-eat-dog real world, organisations do not survive if they do not innovate, improve and learn as fast as their competitors.  They do not have the luxury of being shielded from reality by having a central tax-funded monopoly!

And please do not misinterpret my message here; I am a 100% raving fan of the NHS ethos of “available to all and free at the point of delivery” and an NHS that is funded centrally and fairly. That is not my issue.

My issue is the continued use of obsolete performance management tools in the NHS.


Q: So what are the alternatives? What do the successful commercial organisations use instead?

A: System behaviour charts.

SBCs are pictures of how the system is behaving over time – pictures that tell a story – pictures that have meaning – pictures that we can use to diagnose, design and deliver a better outcome than the one we are heading towards.

Pictures like the A&E performance-over-time chart above.

Click here for more on how and why.


Therefore, if the DoH, NHSE, NHSI, STPs, CCGs and Trust Boards want to achieve their stated visions and missions then the writing-on-the-wall says that they will need to muster some humility and learn how successful organisations do this.

This is not a comfortable message to hear and it is easier to be defensive than receptive.

The NHS has to change if it wants to survive and continue serve the people who pay the salaries. And time is running out. Continuing as we are is not an option. Complaining and blaming are not options. Doing nothing is not an option.

Learning is the only option.

Anyone can learn to use system behaviour charts.  No one needs to rely on averages, two-point comparisons, ratios, targets, and the combination of failure-metrics and us-versus-them-benchmarking that leads to the chronic mediocrity trap.

And there is hope for those with enough hunger, humility and who are prepared to do the hard-work of developing their personal, team, department and organisational capability to use better management methods.


Apollo 13 is a true story.  The catastrophe was averted.  The astronauts were brought home safely.  The film retells the story of how that miracle was achieved. Perhaps watching the whole film would be somewhere to start, because it holds many valuable lessons for us all – lessons on how effective teams behave.

Early Warning System

radar_screen_anim_300_clr_11649The most useful tool that a busy operational manager can have is a reliable and responsive early warning system (EWS).

One that alerts when something is changing and that, if missed or ignored, will cause a big headache in the future.

Rather like the radar system on an aircraft that beeps if something else is approaching … like another aircraft or the ground!


Operational managers are responsible for delivering stuff on time.  So they need a radar that tells them if they are going to deliver-on-time … or not.

And their on-time-delivery EWS needs to alert them soon enough that they have time to diagnose the ‘threat’, design effective plans to avoid it, decide which plan to use, and deliver it.

So what might an effective EWS for a busy operational manager look like?

  1. It needs to be reliable. No missed threats or false alarms.
  2. It needs to be visible. No tomes of text and tables of numbers.
  3. It needs to be simple. Easy to learn and quick to use.

And what is on offer at the moment?

The RAG Chart
This is a table that is coloured red, amber and green. Red means ‘failing’, green means ‘not failing’ and amber means ‘not sure’.  So this meets the specification of visible and simple, but it is reliable?

It appears not.  RAG charts do not appear to have helped to solve the problem.

A RAG chart is generated using historic data … so it tells us where we are now, not how we got here, where we are going or what else is heading our way.  It is a snapshot. One frame from the movie.  Better than complete blindness perhaps, but not much.

The SPC Chart
This is a statistical process control chart and is a more complicated beast.  It is a chart of how some measure of performance has changed over time in the past.  So like the RAG chart it is generated using historic data.  The advantage is that it is not just a snapshot of where were are now, it is a picture of story of how we got to where we are, so it offers the promise of pointing to where we may be heading.  It meets the specification of visible, and while more complicated than a RAG chart, it is relatively easy to learn and quick to use.

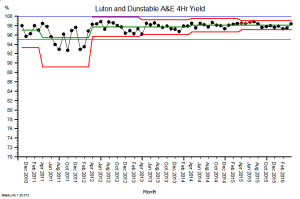
Luton_A&E_4Hr_YieldHere is an example. It is the SPC  chart of the monthly A&E 4-hour target yield performance of an acute NHS Trust.  The blue lines are the ‘required’ range (95% to 100%), the green line is the average and the red lines are a measure of variation over time.  What this charts says is: “This hospital’s A&E 4-hour target yield performance is currently acceptable, has been so since April 2012, and is improving over time.”

So that is much more helpful than a RAG chart (which in this case would have been green every month because the average was above the minimum acceptable level).


So why haven’t SPC charts replaced RAG charts in every NHS Trust Board Report?

Could there be a fly-in-the-ointment?

The answer is “Yes” … there is.

SPC charts are a quality audit tool.  They were designed nearly 100 years ago for monitoring the output quality of a process that is already delivering to specification (like the one above).  They are designed to alert the operator to early signals of deterioration, called ‘assignable cause signals’, and they prompt the operator to pay closer attention and to investigate plausible causes.

SPC charts are not designed for predicting if there is a flow problem looming over the horizon.  They are not designed for flow metrics that exhibit expected cyclical patterns.  They are not designed for monitoring metrics that have very skewed distributions (such as length of stay).  They are not designed for metrics where small shifts generate big cumulative effects.  They are not designed for metrics that change more slowly than the frequency of measurement.

And these are exactly the sorts of metrics that a busy operational manager needs to monitor, in reality, and in real-time.

Demand and activity both show strong cyclical patterns.

Lead-times (e.g. length of stay) are often very skewed by variation in case-mix and task-priority.

Waiting lists are like bank accounts … they show the cumulative sum of the difference between inflow and outflow.  That simple fact invalidates the use of the SPC chart.

Small shifts in demand, activity, income and expenditure can lead to big cumulative effects.

So if we abandon our RAG charts and we replace them with SPC charts … then we climb out of the RAG frying pan and fall into the SPC fire.

Oops!  No wonder the operational managers and financial controllers have not embraced SPC.


So is there an alternative that works better?  A more reliable EWS that busy operational managers and financial controllers can use?

Yes, there is, and here is a clue …

… but tread carefully …

… building one of these Flow-Productivity Early Warning Systems is not as obvious as it might first appear.  There are counter-intuitive traps for the unwary and the untrained.

You may need the assistance of a health care systems engineer (HCSE).

Notably Absent

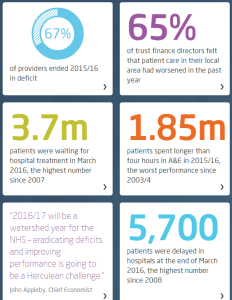
KingsFund_Quality_Report_May_2016This week the King’s Fund published their Quality Monitoring Report for the NHS, and it makes depressing reading.

These highlights are a snapshot.

The website has some excellent interactive time-series charts that transform the deluge of data the NHS pumps out into pictures that tell a shameful story.

On almost all reported dimensions, things are getting worse and getting worse faster.

Which I do not believe is the intention.

But it is clearly the impact of the last 20 years of health and social care policy.


What is more worrying is the data that is notably absent from the King’s Fund QMR.

The first omission is outcome: How well did the NHS deliver on its intended purpose?  It is stated at the top of the NHS England web site …

NHSE_Purpose

And lets us be very clear here: dying, waiting, complaining, and over-spending are not measures of what we want: health and quality success metrics.  They are a measures of what we do not want; they are failure metrics.

The fanatical focus on failure is part of the hyper-competitive, risk-averse medical mindset:

primum non nocere (first do no harm),

and as a patient I am reassured to hear that but is no harm all I can expect?

What about:

tunc mederi (then do some healing)


And where is the data on dying in the Kings Fund QMR?

It seems to be notably absent.

And I would say that is a quality issue because it is something that patients are anxious about.  And that may be because they are given so much ‘open information’ about what might go wrong, not what should go right.


And you might think that sharp, objective data on dying would be easy to collect and to share.  After all, it is not conveniently fuzzy and subjective like satisfaction.

It is indeed mandatory to collect hospital mortality data, but sharing it seems to be a bit more of a problem.

The fear-of-failure fanaticism extends there too.  In the wake of humiliating, historical, catastrophic failures like Mid Staffs, all hospitals are monitored, measured and compared. And the negative deviants are named, shamed and blamed … in the hope that improvement might follow.

And to do the bench-marking we need to compare apples with apples; not peaches with lemons.  So we need to process the raw data to make it fair to compare; to ensure that factors known to be associated with higher risk of death are taken into account. Factors like age, urgency, co-morbidity and primary diagnosis.  Factors that are outside the circle-of-control of the hospitals themselves.

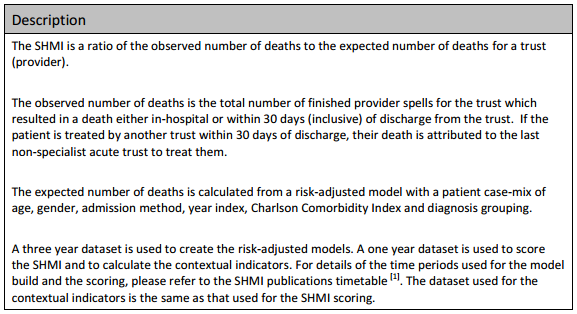
And there is an army of academics, statisticians, data processors, and analysts out there to help. The fruit of their hard work and dedication is called SHMI … the Summary Hospital Mortality Index.

SHMI_Specification

Now, the most interesting paragraph is the third one which outlines what raw data is fed in to building the risk-adjusted model.  The first four are objective, the last two are more subjective, especially the diagnosis grouping one.

The importance of this distinction comes down to human nature: if a hospital is failing on its SHMI then it has two options:
(a) to improve its policies and processes to improve outcomes, or
(b) to manipulate the diagnosis group data to reduce the SHMI score.

And the latter is much easier to do, it is called up-coding, and basically it involves camping at the pessimistic end of the diagnostic spectrum. And we are very comfortable with doing that in health care. We favour the Black Hat.

And when our patients do better than our pessimistically-biased prediction, then our SHMI score improves and we look better on the NHS funnel plot.

We do not have to do anything at all about actually improving the outcomes of the service we provide, which is handy because we cannot do that. We do not measure it!


And what might be notably absent from the data fed in to the SHMI risk-model?  Data that is objective and easy to measure.  Data such as length of stay (LOS) for example?

Is there a statistical reason that LOS is omitted? Not really. Any relevant metric is a contender for pumping into a risk-adjustment model.  And we all know that the sicker we are, the longer we stay in hospital, and the less likely we are to come out unharmed (or at all).  And avoidable errors create delays and complications that imply more risk, more work and longer length of stay. Irrespective of the illness we arrived with.

So why has LOS been omitted from SHMI?

The reason may be more political than statistical.

We know that the risk of death increases with infirmity and age.

We know that if we put frail elderly patients into a hospital bed for a few days then they will decondition and become more frail, require more time in hospital, are more likely to need a transfer of care to somewhere other than home, are more susceptible to harm, and more likely to die.

So why is LOS not in the risk-of-death SHMI model?

And it is not in the King’s Fund QR report either.

Nor is the amount of cash being pumped in to keep the HMS NHS afloat each month.

All notably absent!

Type II Error

figure_pointing_out_chart_data_150_clr_8005It was the time for Bob and Leslie’s regular Improvement Science coaching session.

<Leslie> Hi Bob, how are you today?

<Bob> I am getting over a winter cold but otherwise I am good.  And you?

<Leslie> I am OK and I need to talk something through with you because I suspect you will be able to help.

<Bob> OK. What is the context?

<Leslie> Well, one of the projects that I am involved with is looking at the elderly unplanned admission stream which accounts for less than half of our unplanned admissions but more than half of our bed days.

<Bob> OK. So what were you looking to improve?

<Leslie> We want to reduce the average length of stay so that we free up beds to provide resilient space-capacity to ease the 4-hour A&E admission delay niggle.

<Bob> That sounds like a very reasonable strategy.  So have you made any changes and measured any improvements?

<Leslie> We worked through the 6M Design® sequence. We studied the current system, diagnosed some time traps and bottlenecks, redesigned the ones we could influence, modified the system, and continued to measure to monitor the effect.

<Bob> And?

<Leslie> It feels better but the system behaviour charts do not show an improvement.

<Bob> Which charts, specifically?

<Leslie> The BaseLine XmR charts of average length of stay for each week of activity.

<Bob> And you locked the limits when you made the changes?

<Leslie> Yes. And there still were no red flags. So that means our changes have not had a significant effect. But it definitely feels better. Am I deluding myself?

<Bob> I do not believe so. Your subjective assessment is very likely to be accurate. Our Chimp OS 1.0 is very good at some things! I think the issue is with the tool you are using to measure the change.

<Leslie> The XmR chart?  But I thought that was THE tool to use?

<Bob> Like all tools it is designed for a specific purpose.  Are you familiar with the term Type II Error.

<Leslie> Doesn’t that come from research? I seem to remember that is the error we make when we have an under-powered study.  When our sample size is too small to confidently detect the change in the mean that we are looking for.

<Bob> A perfect definition!  The same error can happen when we are doing before and after studies too.  And when it does, we see the pattern you have just described: the process feels better but we do not see any red flags on our BaseLine© chart.

<Leslie> But if our changes only have a small effect how can it feel better?

<Bob> Because some changes have cumulative effects and we omit to measure them.

<Leslie> OMG!  That makes complete sense!  For example, if my bank balance is stable my average income and average expenses are balanced over time. So if I make a small-but-sustained improvement to my expenses, like using lower cost generic label products, then I will see a cumulative benefit over time to the balance, but not the monthly expenses; because the noise swamps the signal on that chart!

<Bob> An excellent analogy!

<Leslie> So the XmR chart is not the tool for this job. And if this is the only tool we have then we risk making a Type II error. Is that correct?

<Bob> Yes. We do still use an XmR chart first though, because if there is a big enough and fast enough shift then the XmR chart will reveal it.  If there is not then we do not give up just yet; we reach for our more sensitive shift detector tool.

<Leslie> Which is?

<Bob> I will leave you to ponder on that question.  You are a trained designer now so it is time to put your designer hat on and first consider the purpose of this new tool, and then create the outline a fit-for-purpose design.

<Leslie> OK, I am on the case!

Hot and Cold

stick_figure_on_cloud_150_wht_9604Last week Bob and Leslie were exploring the data analysis trap called a two-points-in-time comparison: as illustrated by the headline “This winter has not been as bad as last … which proves that our winter action plan has worked.

Actually it doesn’t.

But just saying that is not very helpful. We need to explain the reason why this conclusion is invalid and therefore potentially dangerous.


So here is the continuation of Bob and Leslie’s conversation.

<Bob> Hi Leslie, have you been reflecting on the two-points-in-time challenge?

<Leslie> Yes indeed, and you were correct, I did know the answer … I just didn’t know I knew if you get my drift.

<Bob> Yes, I do. So, are you willing to share your story?

<Leslie> OK, but before I do that I would like to share what happened when I described what we talked about to some colleagues.  They sort of got the idea but got lost in the unfamiliar language of ‘variance’ and I realized that I needed an example to illustrate.

<Bob> Excellent … what example did you choose?

<Leslie> The UK weather – or more specifically the temperature.  My reasons for choosing this were many: first it is something that everyone can relate to; secondly it has strong seasonal cycle; and thirdly because the data is readily available on the Internet.

<Bob> OK, so what specific question were you trying to answer and what data did you use?

<Leslie> The question was “Are our winters getting warmer?” and my interest in that is because many people assume that the colder the winter the more people suffer from respiratory illness and the more that go to hospital … contributing to the winter A&E and hospital pressures.  The data that I used was the maximum monthly temperature from 1960 to the present recorded at our closest weather station.

<Bob> OK, and what did you do with that data?

<Leslie> Well, what I did not do was to compare this winter with last winter and draw my conclusion from that!  What I did first was just to plot-the-dots … I created a time-series chart … using the BaseLine© software.

MaxMonthTemp1960-2015

And it shows what I expected to see, a strong, regular, 12-month cycle, with peaks in the summer and troughs in the winter.

<Bob> Can you explain what the green and red lines are and why some dots are red?

<Leslie> Sure. The green line is the average for all the data. The red lines are called the upper and lower process limits.  They are calculated from the data and what they say is “if the variation in this data is random then we will expect more than 99% of the points to fall between these two red lines“.

<Bob> So, we have 55 years of monthly data which is nearly 700 points which means we would expect fewer than seven to fall outside these lines … and we clearly have many more than that.  For example, the winter of 1962-63 and the summer of 1976 look exceptional – a run of three consecutive dots outside the red lines. So can we conclude the variation we are seeing is not random?

<Leslie> Yes, and there is more evidence to support that conclusion. First is the reality check … I do not remember either of those exceptionally cold or hot years personally, so I asked Dr Google.

BigFreeze_1963This picture from January 1963 shows copper telephone lines that are so weighed down with ice, and for so long, that they have stretched down to the ground.  In this era of mobile phones we forget this was what telecommunication was like!


HeatWave_1976

And just look at the young Michal Fish in the Summer of ’76! Did people really wear clothes like that?

And there is more evidence on the chart. The red dots that you mentioned are indicators that BaseLine© has detected other non-random patterns.

So the large number of red dots confirms our Mark I Eyeball conclusion … that there are signals mixed up with the noise.

<Bob> Actually, I do remember the Summer of ’76 – it was the year I did my O Levels!  And your signals-in-the-noise phrase reminds me of SETI – the search for extra-terrestrial intelligence!  I really enjoyed the 1997 film of Carl Sagan’s book Contact with Jodi Foster playing the role of the determined scientist who ends up taking a faster-than-light trip through space in a machine designed by ET and built by humans. And especially the line about 10 minutes from the end when those-in-high-places who had discounted her story as “unbelievable” realized they may have made an error … the line ‘Yes, that is interesting isn’t it’.

<Leslie> Ha ha! Yes. I enjoyed that film too. It had lots of great characters – her glory seeking boss; the hyper-suspicious head of national security who militarized the project; the charismatic anti-hero; the ranting radical who blew up the first alien machine; and John Hurt as her guardian angel. I must watch it again.

Anyway, back to the story. The problem we have here is that this type of time-series chart is not designed to extract the overwhelming cyclical, annual pattern so that we can search for any weaker signals … such as a smaller change in winter temperature over a longer period of time.

<Bob>Yes, that is indeed the problem with these statistical process control charts.  SPC charts were designed over 60 years ago for process quality assurance in manufacturing not as a diagnostic tool in a complex adaptive system such a healthcare. So how did you solve the problem?

<Leslie> I realized that it was the regularity of  the cyclical pattern that was the key.  I realized that I could use that to separate out the annual cycle and to expose the weaker signals.  I did that using the rational grouping feature of BaseLine© with the month-of-the-year as the group.

MaxMonthTemp1960-2015_ByMonth

Now I realize why the designers of the software put this feature in! With just one mouse click the story jumped out of the screen!

<Bob> OK. So can you explain what we are looking at here?

<Leslie> Sure. This chart shows the same data as before except that I asked BaseLine© first to group the data by month and then to create a mini-chart for each month-group independently.  Each group has its own average and process limits.  So if we look at the pattern of the averages, the green lines, we can clearly see the annual cycle.  What is very obvious now is that the process limits for each sub-group are much narrower, and that there are now very few red points  … other than in the groups that are coloured red anyway … a niggle that the designers need to nail in my opinion!

<Bob> I will pass on your improvement suggestion! So are you saying that the regular annual cycle has accounted for the majority of the signal in the previous chart and that now we have extracted that signal we can look for weaker signals by looking for red flags in each monthly group?

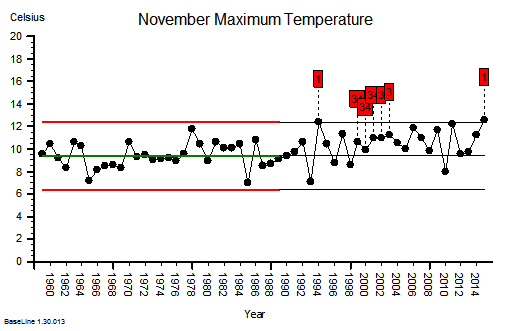
<Leslie> Exactly so.  And the groups I am most interested in are the November to March ones.  So, next I filtered out the November data and plotted it as a separate chart; and I then used another cool feature of BaseLine© called limit locking.

MaxTempNov1960-2015_LockedLimits

What that means is that I have used the November maximum temperature data for the first 30 years to get the baseline average and natural process limits … and we can see that there are no red flags in that section, no obvious signals.  Then I locked these limits at 1990 and this tells BaseLine© to compare the subsequent 25 years of data against these projected limits.  That exposed a lot of signal flags, and we can clearly see that most of the points in the later section are above the projected average from the earlier one.  This confirms that there has been a significant increase in November maximum temperature over this 55 year period.

<Bob> Excellent! You have answered part of your question. So what about December onwards?

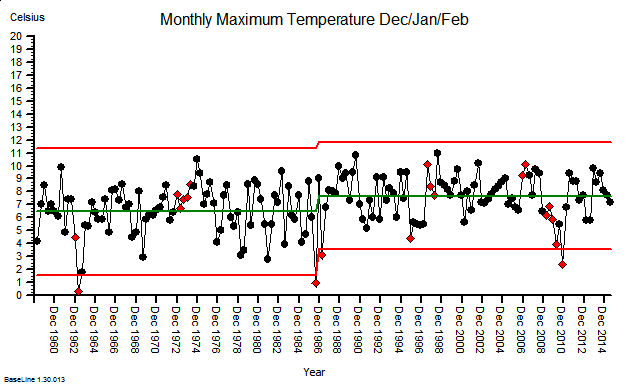
<Leslie> I was on a roll now! I also noticed from my second chart that the December, January and February groups looked rather similar so I filtered that data out and plotted them as a separate chart.

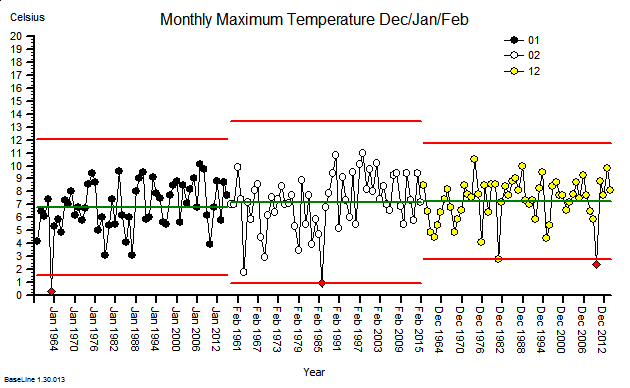
MaxTempDecJanFeb1960-2015_GroupedThese were indeed almost identical so I lumped them together as a ‘winter’ group and compared the earlier half with the later half using another BaseLine© feature called segmentation.

MaxTempDecJanFeb1960-2015-SplitThis showed that the more recent winter months have a higher maximum temperature … on average. The difference is just over one degree Celsius. But it also shows that that the month-to-month and year-to-year variation still dominates the picture.

<Bob> Which implies?

<Leslie> That, with data like this, a two-points-in-time comparison is meaningless.  If we do that we are just sampling random noise and there is no useful information in noise. Nothing that we can  learn from. Nothing that we can justify a decision with.  This is the reason the ‘this year was better than last year’ statement is meaningless at best; and dangerous at worst.  Dangerous because if we draw an invalid conclusion, then it can lead us to make an unwise decision, then decide a counter-productive action, and then deliver an unintended outcome.

By doing invalid two-point comparisons we can too easily make the problem worse … not better.

<Bob> Yes. This is what W. Edwards Deming, an early guru of improvement science, referred to as ‘tampering‘.  He was a student of Walter A. Shewhart who recognized this problem in manufacturing and, in 1924, invented the first control chart to highlight it, and so prevent it.  My grandmother used the term meddling to describe this same behavior … and I now use that term as one of the eight sources of variation. Well done Leslie!
The Two-Points-In-Time Comparison Trap

comparing_information_anim_5545[Bzzzzzz] Bob’s phone vibrated to remind him it was time for the regular ISP remote coaching session with Leslie. He flipped the lid of his laptop just as Leslie joined the virtual meeting.

<Leslie> Hi Bob, and Happy New Year!

<Bob> Hello Leslie and I wish you well in 2016 too.  So, what shall we talk about today?

<Leslie> Well, given the time of year I suppose it should be the Winter Crisis.  The regularly repeating annual winter crisis. The one that feels more like the perpetual winter crisis.

<Bob> OK. What specifically would you like to explore?

<Leslie> Specifically? The habit of comparing of this year with last year to answer the burning question “Are we doing better, the same or worse?”  Especially given the enormous effort and political attention that has been focused on the hot potato of A&E 4-hour performance.

<Bob> Aaaaah! That old chestnut! Two-Points-In-Time comparison.

<Leslie> Yes. I seem to recall you usually add the word ‘meaningless’ to that phrase.

<Bob> H’mm.  Yes.  It can certainly become that, but there is a perfectly good reason why we do this.

<Leslie> Indeed, it is because we see seasonal cycles in the data so we only want to compare the same parts of the seasonal cycle with each other. The apples and oranges thing.

<Bob> Yes, that is part of it. So what do you feel is the problem?

<Leslie> It feels like a lottery!  It feels like whether we appear to be better or worse is just the outcome of a random toss.

<Bob> Ah!  So we are back to the question “Is the variation I am looking at signal or noise?” 

<Leslie> Yes, exactly.

<Bob> And we need a scientifically robust way to answer it. One that we can all trust.

<Leslie> Yes.

<Bob> So how do you decide that now in your improvement work?  How do you do it when you have data that does not show a seasonal cycle?

<Leslie> I plot-the-dots and use an XmR chart to alert me to the presence of the signals I am interested in – especially a change of the mean.

<Bob> Good.  So why can we not use that approach here?

<Leslie> Because the seasonal cycle is usually a big signal and it can swamp the smaller change I am looking for.

<Bob> Exactly so. Which is why we have to abandon the XmR chart and fall back the two points in time comparison?

<Leslie> That is what I see. That is the argument I am presented with and I have no answer.

<Bob> OK. It is important to appreciate that the XmR chart was not designed for doing this.  It was designed for monitoring the output quality of a stable and capable process. It was designed to look for early warning signs; small but significant signals that suggest future problems. The purpose is to alert us so that we can identify the root causes, correct them and the avoid a future problem.

<Leslie> So we are using the wrong tool for the job. I sort of knew that. But surely there must be a better way than a two-points-in-time comparison!

<Bob> There is, but first we need to understand why a TPIT is a poor design.

<Leslie> Excellent. I’m all ears.

<Bob> A two point comparison is looking at the difference between two values, and that difference can be positive, zero or negative.  In fact, it is very unlikely to be zero because noise is always present.

<Leslie> OK.

<Bob> Now, both of the values we are comparing are single samples from two bigger pools of data.  It is the difference between the pools that we are interested in but we only have single samples of each one … so they are not measurements … they are estimates.

<Leslie> So, when we do a TPIT comparison we are looking at the difference between two samples that come from two pools that have inherent variation and may or may not actually be different.

<Bob> Well put.  We give that inherent variation a name … we call it variance … and we can quantify it.

<Leslie> So if we do many TPIT comparisons then they will show variation as well … for two reasons; first because the pools we are sampling have inherent variation; and second just from the process of sampling itself.  It was the first lesson in the ISP-1 course.

<Bob> Well done!  So the question is: “How does the variance of the TPIT sample compare with the variance of the pools that the samples are taken from?”

<Leslie> My intuition tells me that it will be less because we are subtracting.

<Bob> Your intuition is half-right.  The effect of the variation caused by the signal will be less … that is the rationale for the TPIT after all … but the same does not hold for the noise.

<Leslie> So the noise variation in the TPIT is the same?

<Bob> No. It is increased.

<Leslie> What! But that would imply that when we do this we are less likely to be able to detect a change because a small shift in signal will be swamped by the increase in the noise!

<Bob> Precisely.  And the degree that the variance increases by is mathematically predictable … it is increased by a factor of two.

<Leslie> So as we usually present variation as the square root of the variance, to get it into the same units as the metric, then that will be increased by the square root of two … 1.414

<Bob> Yes.

<Leslie> I need to put this counter-intuitive theory to the test!

<Bob> Excellent. Accept nothing on faith. Always test assumptions. And how will you do that?

<Leslie> I will use Excel to generate a big series of normally distributed random numbers; then I will calculate a series of TPIT differences using a fixed time interval; then I will calculate the means and variations of the two sets of data; and then I will compare them.

<Bob> Excellent.  Let us reconvene in ten minutes when you have done that.


10 minutes later …


<Leslie> Hi Bob, OK I am ready and I would like to present the results as charts. Is that OK?

<Bob> Perfect!

<Leslie> Here is the first one.  I used our A&E performance data to give me some context. We know that on Mondays we have an average of 210 arrivals with an approximately normal distribution and a standard deviation of 44; so I used these values to generate the random numbers. Here is the simulated Monday Arrivals chart for two years.

TPIT_SourceData

<Bob> OK. It looks stable as we would expect and I see that you have plotted the sigma levels which look to be just under 50 wide.

<Leslie> Yes, it shows that my simulation is working. So next is the chart of the comparison of arrivals for each Monday in Year 2 compared with the corresponding week in Year 1.

TPIT_DifferenceData <Bob> Oooookaaaaay. What have we here?  Another stable chart with a mean of about zero. That is what we would expect given that there has not been a change in the average from Year 1 to Year 2. And the variation has increased … sigma looks to be just over 60.

<Leslie> Yes!  Just as the theory predicted.  And this is not a spurious answer. I ran the simulation dozens of times and the effect is consistent!  So, I am forced by reality to accept the conclusion that when we do two-point-in-time comparisons to eliminate a cyclical signal we will reduce the sensitivity of our test and make it harder to detect other signals.

<Bob> Good work Leslie!  Now that you have demonstrated this to yourself using a carefully designed and conducted simulation experiment, you will be better able to explain it to others.

<Leslie> So how do we avoid this problem?

<Bob> An excellent question and one that I will ask you to ponder on until our next chat.  You know the answer to this … you just need to bring it to conscious awareness.


The Catastrophe is Coming

Monitor_Summary


This week an interesting report was published by Monitor – about some possible reasons for the A&E debacle that England experienced in the winter of 2014.

Summary At A Glance

“91% of trusts did not  meet the A&E 4-hour maximum waiting time standard last winter – this was the worst performance in 10 years”.


So it seems a bit odd that the very detailed econometric analysis and the testing of “Ten Hypotheses” did not look at the pattern of change over the previous 10 years … it just compared Oct-Dec 2014 with the same period for 2013! And the conclusion: “Hospitals were fuller in 2014“.  H’mm.


The data needed to look back 10 years is readily available on the various NHS England websites … so here it is plotted as simple time-series charts.  These are called system behaviour charts or SBCs. Our trusted analysis tools will be a Mark I Eyeball connected to the 1.3 kg of wetware between our ears that runs ChimpOS 1.0 …  and we will look back 11 years to 2004.

A&E_Arrivals_2004-15First we have the A&E Arrivals chart … about 3.4 million arrivals per quarter. The annual cycle is obvious … higher in the summer and falling in the winter. And when we compare the first five years with the last six years there has been a small increase of about 5% and that seems to associate with a change of political direction in 2010.

So over 11 years the average A&E demand has gone up … a bit … but only by about 5%.


A&E_Admissions_2004-15In stark contrast the A&E arrivals that are admitted to hospital has risen relentlessly over the same 11 year period by about 50% … that is about 5% per annum … ten times the increase in arrivals … and with no obvious step in 2010. We can see the annual cycle too.  It is a like a ratchet. Click click click.


But that does not make sense. Where are these extra admissions going to? We can only conclude that over 11 years we have progressively added more places to admit A&E patients into.  More space-capacity to store admitted patients … so we can stop the 4-hour clock perhaps? More emergency assessment units perhaps? Places to wait with the clock turned off perhaps? The charts imply that our threshold for emergency admission has been falling: Admission has become increasingly the ‘easier option’ for whatever reason.  So why is this happening? Do more patients need to be admitted?


In a recent empirical study we asked elderly patients about their experience of the emergency process … and we asked them just after they had been discharged … when it was still fresh in their memories. A worrying pattern emerged. Many said that they had been admitted despite them saying they did not want to be.  In other words they did not willingly consent to admission … they were coerced.

This is anecdotal data so, by implication, it is wholly worthless … yes?  Perhaps from a statistical perspective but not from an emotional one.  It is a red petticoat being waved that should not be ignored.  Blissful ignorance comes from ignoring anecdotal stuff like this. Emotionally uncomfortable anecdotal stories. Ignore the early warning signs and suffer the potentially catastrophic consequences.


A&E_Breaches_2004-15And here is the corresponding A&E 4-hour Target Failure chart.  Up to 2010 the imposed target was 98% success (i.e. 2% acceptable failure) and, after bit of “encouragement” in 2004-5, this was actually achieved in some of the summer months (when the A&E demand was highest remember).

But with a change of political direction in 2010 the “hated” 4-hour target was diluted down to 95% … so a 5% failure rate was now ‘acceptable’ politically, operationally … and clinically.

So it is no huge surprise that this is what was achieved … for a while at least.

In the period 2010-13 the primary care trusts (PCTs) were dissolved and replaced by clinical commissioning groups (CCGs) … the doctors were handed the ignition keys to the juggernaut that was already heading towards the cliff.

The charts suggest that the seeds were already well sown by 2010 for an evolving catastrophe that peaked last year; and the changes in 2010 and 2013 may have just pressed the accelerator pedal a bit harder. And if the trend continues it will be even worse this coming winter. Worse for patients and worse for staff and worse for commissioners and  worse for politicians. Lose lose lose lose.


So to summarise the data from the NHS England’s own website:

1. A&E arrivals have gone up 5% over 11 years.
2. Admissions from A&E have gone up 50% over 11 years.
3. Since lowering the threshold for acceptable A&E performance from 98% to 95% the system has become unstable and “fallen off the cliff” … but remember, a temporal association does not prove causation.

So what has triggered the developing catastrophe?

Well, it is important to appreciate that when a patient is admitted to hospital it represents an increase in workload for every part of the system that supports the flow through the hospital … not just the beds.  Beds represent space-capacity. They are just where patients are stored.  We are talking about flow-capacity; and that means people, consumables, equipment, data and cash.

So if we increase emergency admissions by 50% then, if nothing else changes, we will need to increase the flow-capacity by 50% and the space-capacity to store the work-in-progress by 50% too. This is called Little’s Law. It is a mathematically proven Law of Flow Physics. It is not negotiable.

So have we increased our flow-capacity and our space-capacity (and our costs) by 50%? I don’t know. That data is not so easy to trawl from the websites. It will be there though … somewhere.

What we have seen is an increase in bed occupancy (the red box on Monitor’s graphic above) … but not a 50% increase … that is impossible if the occupancy is already over 85%.  A hospital is like a rigid metal box … it cannot easily expand to accommodate a growing queue … so the inevitable result in an increase in the ‘pressure’ inside.  We have created an emergency care pressure cooker. Well lots of them actually.

And that is exactly what the staff who work inside hospitals says it feels like.

And eventually the relentless pressure and daily hammering causes the system to start to weaken and fail, gradually at first then catastrophically … which is exactly what the NHS England data charts are showing.


So what is the solution?  More beds?

Nope.  More beds will create more space and that will relieve the pressure … for a while … but it will not address the root cause of why we are admitting 50% more patients than we used to; and why we seem to need to increase the pressure inside our hospitals to squeeze the patients through the process and extrude them out of the various exit nozzles.

Those are the questions we need to have understandable and actionable answers to.

Q1: Why are we admitting 5% more of the same A&E arrivals each year rather than delivering what they need in 4 hours or less and returning them home? That is what the patients are asking for.

Q2: Why do we have to push patients through the in-hospital process rather than pulling them through? The staff are willing to work but not inside a pressure cooker.


A more sensible improvement strategy is to look at the flow processes within the hospital and ensure that all the steps and stages are pulling together to the agreed goals and plan for each patient. The clinical management plan that was decided when the patient was first seen in A&E. The intended outcome for each patient and the shortest and quickest path to achieving it.


Our target is not just a departure within 4 hours of arriving in A&E … it is a competent diagnosis (study) and an actionable clinical management plan (plan) within 4 hours of arriving; and then a process that is designed to deliver (do) it … for every patient. Right, first time, on time, in full and at a cost we can afford.

Q: Do we have that?
A: Nope.

Q: Is that within our gift to deliver?
A: Yup.

Q: So what is the reason we are not already doing it?
A: Good question.  Who in the NHS is trained how to do system-wide flow design like this?

A Stab At The Vitals

pirate_flag_anim_150_wht_12881[Drrring Drrring] The phone heralded the start of the weekly ISP mentoring session.

<Bob> Hi Leslie, how are you today?

<Leslie> Hi Bob. To be honest I am not good. I am drowning. Drowning in data!

<Bob> Oh dear! I am sorry to hear that. Can I help? What led up to this?

<Leslie> Well, it was sort of triggered by our last chat and after you opened my eyes to the fact that we habitually throw most of our valuable information away by thresholding, aggregating and normalising.  Then we wonder why we make poor decisions … and then we get frustrated because nothing seems to improve.

<Bob> OK. What happened next?

<Leslie> I phoned our Performance Team and asked for some raw data. Three months worth.

<Bob> And what was their reaction?

<Leslie> They said “OK, here you go!” and sent me a twenty megabyte Excel spreadsheet that clogged my email inbox!  I did manage to unclog it eventually by deleting loads of old junk.  But I could swear that I heard the whole office laughing as they hung up the phone! Maybe I am paranoid?

<Bob> OK. And what happened next?

<Leslie> I started drowning!  The mega-file had a row of data for every patient that has attended A&E for the last three months as I had requested, but there were dozens of columns!  Trying to slice-and-dice it was a nightmare! My computer was smoking and each step took ages for it to complete.  In the end I gave up in frustration.  I now have a lot more respect for the Performance Team I can tell you! They do this for a living?

<Bob> OK.  It sounds like you are ready for a Stab At the Vitals.

<Leslie> What?  That sounds rather piratical!  Are you making fun of my slicing-and-dicing metaphor?

<Bob> No indeed.  I am deadly serious!  Before we leap into the data ocean we need to be able to swim; and we also need a raft that will keep us afloat;  and we need a sail to power our raft; and we need a way to navigate our raft to our desired destination.

<Leslie> OK. I like the nautical metaphor but how does it help?

<Bob> Let me translate. Learning to use system behaviour charts is equivalent to learning the skill of swimming. We have to do that first and practice until we are competent and confident.  Let us call our raft “ISP” – you are already aboard.  The sail you also have already – your Excel software.  The navigation aid is what I refer to as Vitals. So we need to have a “stab at the vitals”.

<Leslie> Do you mean we use a combination of time-series charts, ISP and Excel to create a navigation aid that helps avoid the Depths of Data and the Rocks of DRAT?

<Bob> Exactly.

<Leslie> Can you demonstrate with an example?

<Bob> Sure. Send me some of your data … just the arrival and departure events for one day – a typical one.

<Leslie> OK … give me a minute!  …  It is on its way.  How long will it take for you to analyse it?

<Bob> About 2 seconds. OK, here is your email … um … copy … paste … copy … reply

Vitals_Charts<Leslie> What the ****? That was quick! Let me see what this is … the top left chart is the demand, activity and work-in-progress for each hour; the top right chart is the lead time by patient plotted in discharge order; the table bottom left includes the 4 hour breach rate.  Those I do recognise. What is the chart on the bottom right?

<Bob> It is a histogram of the lead times … and it shows a problem.  Can you see the spike at 225 to 240 minutes?

<Leslie> Is that the fabled Horned Gaussian?

<Bob> Yes.  That is the sign that the 4-hour performance target is distorting the behaviour of the system.  And this is yet another reason why the  Breach Rate is a dangerous management metric. The adaptive reaction it triggers amplifies the variation and fuels the chaos.

<Leslie> Wow! And you did all that in Excel using my data in two seconds?  That must need a whole host of clever macros and code!

<Bob> “Yes” it was done in Excel and “No” it does not need any macros or code.  It is all done using simple formulae.

<Leslie> That is fantastic! Can you send me a copy of your Excel file?

<Bob> Nope.

<Leslie>Whaaaat? Why not? Is this some sort of evil piratical game?

<Bob> Nope. You are going to learn how to do this yourself – you are going to build your own Vitals Chart Generator – because that is the only way to really understand how it works.

<Leslie> Phew! You had me going for a second there! Bring it on! What do I do next?

<Bob> I will send you the step-by-step instructions of how to build, test and use a Vitals Chart Generator.

<Leslie> Thanks Bob. I cannot wait to get started! Weigh anchor and set the sails! Ha’ harrrr me hearties.

Ratio Hazards

waste_paper_shot_miss_150_wht_11853[Bzzzzz Bzzzzz] Bob’s phone was on silent but the desktop amplified the vibration and heralded the arrival of Leslie’s weekly ISP coaching call.

<Bob> Hi Leslie.  How are you today and what would you like to talk about?

<Leslie> Hi Bob.  I am well and I have an old chestnut to roast today … target-driven-behaviour!

<Bob> Excellent. That is one of my favorite topics. Is there a specific context?

<Leslie> Yes.  The usual desperate directive from on-high exhorting everyone to “work harder to hit the target” and usually accompanied by a RAG table of percentages that show just who is failing and how badly they are doing.

<Bob> OK. Red RAGs irritating the Bulls eh? Percentages eh? Have we talked about Ratio Hazards?

<Leslie> We have talked about DRATs … Delusional Ratios and Arbitrary Targets as you call them. Is that the same thing?

<Bob> Sort of. What happened when you tried to explain DRATs to those who are reacting to these ‘desperate directives’?

<Leslie> The usual reply is ‘Yes, but that is how we are required to report our performance to our Commissioners and Regulatory Bodies.’

<Bob> And are the key performance indicators that are reported upwards and outwards also being used to manage downwards and inwards?  If so, then that is poor design and is very likely to be contributing to the chaos.

<Leslie> Can you explain that a bit more? It feels like a very fundamental point you have just made.

 <Bob> OK. To do that let us work through the process by which the raw data from your system is converted into the externally reported KPI.  Choose any one of your KPIs

<Leslie> Easy! The 4-hour A&E target performance.

<Bob> What is the raw data that goes in to that?

<Leslie> The percentage of patients who breach 4-hours per day.

<Bob> And where does that ratio come from?

<Leslie> Oh! I see what you mean. That comes from a count of the number of patients who are in A&E for more than 4 hours divided by a count of the number of patients who attended.

<Bob> And where do those counts come come from?

<Leslie> We calculate the time the patient is in A&E and use the 4-hour target to label them as breaches or not.

<Bob> And what data goes into the calculation of that time?

<Leslie>The arrival and departure times for each patient. The arrive and depart events.

<Bob>OK. Is that the raw data?

<Leslie>Yes. Everything follows from that.

<Bob> Good.  Each of these two events is a time – which is a continuous metric.  In principle,  we could in record it to any degree of precision we like – milliseconds if we had a good enough enough clock.

<Leslie> Yes. We record it to an accuracy of of seconds – it is when the patient is ‘clicked through’ on the computer.

<Bob> Careful Leslie, do not confuse precision with accuracy. We need both.

<Leslie> Oops! Yes I remember we had that conversation before.

<Bob> And how often is the A&E 4-hour target KPI reported externally?

<Leslie> Quarterly. We either succeed or fail each quarter of the financial year.

<Bob> That is a binary metric. An “OK or not OK”. No gray zone.

<Leslie> Yes. It is rather blunt but that is how we are contractually obliged to report our performance.

<Bob> OK. And how many patients per day on average come to A&E?

<Leslie> About 200 per day.

<Bob> So the data analysis process is boiling down about 36,000 pieces of continuous data into one Yes-or-No bit of binary data.

<Leslie> Yes.

<Bob> And then that one bit is used to drive the action of the Board: if it is ‘OK last quarter’ then there is no ‘desperate directive’ and if it is a ‘Not OK last quarter’ then there is.

<Leslie> Yes.

<Bob> So you are throwing away 99.9999% of your data and wondering why what is left is not offering much insight in what to do.

<Leslie>Um, I guess so … when you say it like that.  But how does that relate to your phrase ‘Ratio Hazards’?

<Bob> A ratio is just one of the many ways that we throw away information. A ratio requires two numbers to calculate it; and it gives one number as an output so we are throwing half our information away.  And this is an irreversible act.  Two specific numbers will give one ratio; but that ratio can be created by an infinite number possible pairs of numbers and we have no way of knowing from the ratio what specific pair was used to create it.

<Leslie> So a ratio is an exercise in obfuscation!

<Bob> Well put! And there is an even more data-wasteful behaviour that we indulge in. We aggregate.

<Leslie> By that do you mean we summarise a whole set of numbers with an average?

<Bob> Yes. When we average we throw most of the data away and when we average over time then we abandon our ability to react in a timely way.

<Leslie>The Flaw of Averages!

<Bob> Yes. One of them. There are many.

<Leslie>No wonder it feels like we are flying blind and out of control!

<Bob> There is more. There is an even worse data-wasteful behaviour. We threshold.

<Leslie>Is that when we use a target to decide if the lead time is OK or Not OK.

<Bob> Yes. And using an arbitrary target makes it even worse.

<Leslie> Ah ha! I see what you are getting at.  The raw event data that we painstakingly collect is a treasure trove of information and potential insight that we could use to help us diagnose, design and deliver a better service. But we throw all but one single solitary binary digit when we put it through the DRAT Processor.

<Bob> Yup.

<Leslie> So why could we not do both? Why could we not use use the raw data for ourselves and the DRAT processed data for external reporting.

<Bob> We could.  So what is stopping us doing just that?

<Leslie> We do not know how to effectively and efficiently interpret the vast ocean of raw data.

<Bob> That is what a time-series chart is for. It turns the thousands of pieces of valuable information onto a picture that tells a story – without throwing the information away in the process. We just need to learn how to interpret the pictures.

<Leslie> Wow! Now I understand much better why you insist we ‘plot the dots’ first.

<Bob> And now you understand the Ratio Hazards a bit better too.

<Leslie> Indeed so.  And once again I have much to ponder on. Thank you again Bob.

The Victim Vortex

[Beep Beep] Bob tapped the “Answer” button on his smartphone – it was Lesley calling in for their regular ISP coaching session.

<Bob>Hi Lesley. How are you today? And which tunnel in the ISP Learning Labyrinth shall we explore today?

<Lesley>Hi Bob. I am OK thank you. Can we invest some time in the Engagement Maze?

<Bob>OK. Do you have a specific example?

<Lesley>Sort of. This week I had a conversation with our Chief Executive about the potential of Improvement Science and the reply I got was “I am convinced by what you say but it is your colleagues who need to engage. If you have not succeeded in convincing them then how can I?” I was surprised by that response and slightly niggled because it had an uncomfortable nugget of truth in it.

<Bob>That sounds like the wisdom of a leader who understands that the “power” to make things happen does not sit wholly in the lap of those charged with accountability.

<Lesley> I agree.  And at the same time everything that the “Top Team” suggest gets shot down in flames by a small and very vocal group of my more skeptical colleagues.

<Bob>Ah ha!  It sounds like the Victim Vortex is causing trouble here.

<Lesley>The Victim Vortex?

<Bob>Yes.  Let me give you an example.  One of the common initiators of the Victim Vortex is the data flow part of a complex system design.  The Sixth Flow.  So can I ask you: “How are new information systems developed in your organization?

<Lesley>Wow!  You hit the nail on the head first time!  Just this week there has been another firestorm of angry emails triggered by yet another silver-bullet IT system being foisted on us!

<Bob>Interesting use of language Lesley.  You sound quite “niggled”.

<Lesley>I am.  Not by the constant “drizzle of IT magic” – that is irritating enough – but more by the vehemently cynical reaction of my peers.

<Bob>OK.  This sounds like good enough example of the Victim Vortex.  What do you expect the outcome will be?

<Lesley>Well, if past experience is a predictor for future performance – an expensive failure, more frustration and a deeper well of cynicism.

<Bob>Frustrating for whom?

<Lesley>Everyone.  The IT department as well.  It feels like we are all being sucked into a lose-lose-lose black hole of depression and despair!

<Bob>A very good description of the Victim Vortex.

<Lesley>So the Victim Vortex is an example of the Drama Triangle acting on an organizational level?

tornada_150_wht_10155<Bob>Yes. Visualize a cultural tornado.  The energy that drives it is the emotional  currency spent in playing the OK – Not OK Games.  It is a self-fueling system, a stable design, very destructive and very resistant to change.

<Lesley>That metaphor works really well for me!

<Bob>A similar one is a whirlpool – a water vortex.  If you were out swimming and were caught up in a whirlpool what are your exit strategy options?

<Lesley>An interesting question.  I have never had that experience and would not want it – it sounds rather hazardous.  Let me think.  If I do nothing I will just get swept around in the chaos and I am at risk of  getting bashed, bruised and then sucked under.

<Bob>Yes – you would probably spend all your time and energy just treading water and dodging the flotsam and jetsam that has been sucked into the Vortex.  That is what most people do.  It is called the Hamster Wheel effect.

<Lesley>So another option is to actively swim towards the middle of the Vortex – the end would at least be quick! But that is giving up and adopting the Hopelessness attitude of burned out Victim.  That would be the equivalent of taking voluntary redundancy or early retirement.  It is not my style!

<Bob>Yes.  It does not solve the problem either.  The Vortex is always hoovering up new Victims.  It is insatiable.

<Lesley> And another option would be to swim with the flow to avoid being “got” from behind.  That would be seem sensible and is possible; and at least I would feel better for doing something. I might even escape if I swim fast enough!

<Bob>That is indeed what some try.  The movers and shakers.  The pace setters.  The optimists.  The extrovert leaders.  The problem is that it makes the Vortex spin even faster.  It actually makes the Vortex bigger,  more chaotic and more dangerous than before.

<Lesley>Yes – I can see that.  So my other option is to swim against the flow in an attempt to slow the Vortex down.  Would that work?

<Bob>If everyone did that at the same time it might but that is unlikely to happen spontaneously.  If you could achieve that degree of action alignment you would not have a Victim Vortex in the first place.  Trying to do it alone is ineffective, you tire very quickly, the other Victims bash into you, you slow them down, and then you all get sucked down the Plughole of Despair.

<Lesley>And I suppose a small group of like-minded champions who try to swim-against the flow might last longer if they stick together but even then eventually they would get bashed up and broken up too.  I have seen that happen.  And that is probably where our team are heading at the moment.  I am out of options.  Is it impossible to escape the Victim Vortex?

<Bob>There is one more direction you can swim.

<Lesley>Um?  You mean across the flow heading directly away from the center?

<Bob>Exactly.  Consider that option.

<Lesley>Well, it would still be hard work and I would still be going around with the Vortex and I would still need to watch out for flotsam but every stroke I make would take me further from the center.  The chaos would get gradually less and eventually I would be in clear water and out of danger.  I could escape the Victim Vortex!

<Bob>Yes. And what would happen if others saw you do that and did the same?

<Lesley>The Victim Vortex would dissipate!

<Bob>Yes.  So that is your best strategy.  It is a win-win-win strategy too. You can lead others out of the Victim Vortex.

<Lesley>Wow!  That is so cool!  So how would I apply that metaphor to the Information System niggle?

<Bob>I will leave you to ponder on that.  Think about it as a design assignment.  The design of the system that generates IT solutions that are fit-for-purpose.

<Lesley> Somehow I knew you were going to say that!  I have my squared-paper and sharpened pencil at the ready.  Yes – an improvement-by-design assignment.  Thank you once again Bob.  This ISP course is the business!

Structure Time to Fuel Improvement

The expected response to any suggestion of change is “Yes, but I am too busy – I do not have time.”

And the respondent is correct. They do not.

All their time is used just keeping their head above water or spinning the hamster wheel or whatever other metaphor they feel is appropriate.  We are at an impasse. A stalemate. We know change requires some investment of time and there is no spare time to invest so change cannot happen. Yes?  But that is not good enough – is it?

Well-intended experts proclaim that “I’m too busy” actually means “I have other things to do that are higher priority“. And by that we mean ” … that are a greater threat to my security and to what I care about“. So to get our engagement our well-intended expert pours emotional petrol on us and sets light to it. They show us dramatic video evidence of how our “can’t do” attitude and behaviour is part of the problem. We are the recalcitrant child who is standing in the way of  change and we need to have our face rubbed in our own cynical poo.

Now our platform is really burning. Inflamed is exactly what we are feeling – angry in fact. “Thanks-a-lot. Now #!*@ off!”   And our well-intentioned expert retreats – it is always the same. The Dinosaurs and the Dead Wood are clogging the way ahead.

Perhaps a different perspective might be more constructive.


It is not just how much time we have that is most important – it is how our time is structured.


Humans hate unstructured time. We like to be mentally active for all of our waking moments. 

To test this hypothesis try this demonstration of our human need to fill idle time with activity. When you next talk to someone you know well – at some point after they have finished telling you something just say nothing;  keep looking at them; and keep listening – and say nothing. For up to twenty seconds if necessary. Both you and they will feel an overwhelming urge to say something, anything – to fill the silence. It is called the “pregnant pause effect” and most people find even a gap of a second or two feels uncomfortable. Ten seconds would be almost unbearable. Hold your nerve and stay quiet. They will fill the gap.

This technique is used by cognitive behavioural therapists, counsellors and coaches to help us reveal stuff about ourselves to ourselves – and it works incredibly well. It is also used for less altrusitic purposes by some – so when you feel the pain of the pregnant pause just be aware of what might be going on and counter with a question.


If we have no imposed structure for our time then we will create one – because we feel better for it. We have a name for these time-structuring behaviours: habits, past-times and rituals. And they are very important to us because they reduce anxiety.

There is another name for a pre-meditated time-structure:  it is called a plan or a process design. Many people hate not having a plan – and to them any plan is better than none. So in the absence of an imposed alternative we habitually make do with time-wasting plans and poorly designed processes.  We feel busy because that is the purpose of our time-structuring behaviour – and we look busy too – which is also important. This has an important lesson for all improvement scientists: Using a measure of “business” such as utilisation as a measure of efficiency and productivity is almost meaningless. Utilisation does not distinguish between useful busi-ness and useless busi-ness.

We also time-structure our non-working lives. Reading a newspaper, doing the crossword, listening to the radio,  watching television, and web-browsing are all time-structuring behaviours.


This insight into our need for structured time leads to a rational way to release time for change and improvement – and that is to better structure some of our busy time.

A useful metaphor for a time-structure is a tangible structure – such as a building. Buildings have two parts – a supporting, load bearing, structural framework and the functional fittings that are attached to it. Often the structural framework is invisible in the final building – invisible but essential. That is why we need structural engineers. The same is true for time-structuring: the supporting form should be there but it should not not get in the way of the intended function. That is why we need process design engineers too. Good process design is invisible time-structuring.


One essential investment of time in all organisations is communication. Face-to-face talking, phone calls, SMS, emails, reports, meetings, presentations, webex and so on. We spend more time communicating with each other than doing anything else other than sleeping.  And more niggles are generated by poorly designed and delivered communication processes than everything else combined. By a long way.


As an example let us consider management meetings.

From a process design perspective mmany management meetings are both ineffective and inefficient. They are unproductive.  So why do we still have them?

One possibkle answer is because meetings have two other important purposes: first as a tool for social interaction, and second as a way to structure time.  It turns out that we dislike loneliness even more than idleness – and we can meet both needs at the same time by having a meeting. Productivity is not the primary purpose.


So when we do have to communicate effectively and efficiently in order to collectively resolve a real and urgent problem then we are ill prepared. And we know this. We know that as soon as Crisis Management Committees start to form then we are in really big trouble. What we want in a time of crisis is for someone to structure time for us. To tell us what to do.

And some believe that we unconsciously create crisis after crisis for just that purpose.


Recently I have been running an improvement experiment.  I have  been testing the assumption that we have to meet face-to-face to be effective. This has big implications for efficiency because I work in a multi-site organisation and to attend a meeting on another site implies travelling there and back. That travel takes one hour in each direction when all the separate parts are added together. It has two other costs. The financial cost of the fuel – which is a variable cost – if I do not travel then I do not incur the cost. And there is an emotional cost – I have to concentrate on driving and will use up some of my brain-fuel in doing so. There are three currencies – emotional, temporal and financial.

The experiment was a design change. I changed the design of the communication process from at-the-same-place-and-time to just at-the-same-time. I used an internet-based computer-to-computer link (rather like Skype or FaceTime but with some other useful tools like application sharing).

It worked much better than I expected.

There was the anticipated “we cannot do this because we do not have webcams and no budget for even pencils“. This was solved by buying webcams from the money saved by not burning petrol. The conversion rate was one webcam per four trips – and the webcam is a one off capital cost not a recurring revenue cost. This is accpiuntant-speak for “the actual cash released will fund the change“. No extra budget is required. And combine the fuel savings for everyone, and parking charges and the payback time is even shorter.

There were also the anticipated glitches as people got used to the unfamiliar technology (they did not practice of course because they were too busy) but the niggles go away with a few iterations.

So what were the other benefits?

Well one was the travel time saved – two hours per meeting – which was longer than the meeting! The released time cannot be stored and used later like the money can – it has to be reinvested immediately. I reinvested it in other improvement work. So the benefit was amplified.

Another was the brain-fuel saved from not having to drive – which I used to offset my cumuative brain-fuel deficit called chronic fatigue. The left over was re-invested in the improvement work. 100% recycled. Nothing was wasted.


The unexpected benefit was the biggest one.

The different communication design of a virtual meeting required a different form of meeting structure and discipline. It took a few iterations to realise this – then click – both effectiveness and efficiency jumped up. The time became even better structured, more productive and released even more time to reinvest. Wow!

And the whole thing funded itself.

Building a Big Picture from the Small Bits

We are all a small piece of a complex system that extends well beyond the boundaries of our individual experience.

We all know this.

We also know that seeing the big picture is very helpful because it gives us context, meaning and leads to better decisions more effective actions.

We feel better when we know where we fit into the Big Picture – and we feel miserable when we do not.

And when our system is not working as well as we would like then we need to improve it; and to do that we need to understand how it works so that we only change what we need to.

To do that we need to see the Big Picture and to understand it.


So how do we build the Big Picture from the Small Bits?

Solving a jigsaw puzzle is a good metaphor for the collective challenge we face. Each of us holds a piece which we know very well because it is what we see, hear, touch, smell and taste every day. But how do we assemble the pieces so that we can all clearly see and appreciate the whole rather than dimly perceive a dysfunctional heap of bits?

One strategy is to look for tell-tale features that indicate where a piece might fit – irrespective of the unique picture on it. Such as the four corners.

We also use this method to group pieces that belong on the sides – but this is not enough  to tell us which side and where on which side each piece fits.

So far all we have are some groups of bits – rough parts of the whole – but no clear view of the picture. To see that we need to look at the detail – the uniqueness of each piece.


Our next strategy is to look at the shapes of the edges to find the pieces that are complementary – that leave no gaps when fitted together. These are our potential neighbours. Sometimes there is only one bit that fits, sometimes there are many that fit well enough.


Our third strategy is to look at the patterns on the potential neighbours and to check for continuity because the picture should flow across the boundary – and a mismatch means we have made an error.

 What we have now is the edges of the picture and a heap of bits that go somewhere in the middle.

By connecting the edge-pieces we can see that there are gaps and this is an important insight.

It is not until we have a framework that spans the whole picture that the gaps become obvious.

But we do not know yet if our missing pieces are in the heap or not – we will not know that until we have solved the jigsaw puzzle.


Throughout the problem-dissolving process we are using three levels of content:
Data that we gain through our senses, in this case our visual system;
Information which is the result of using context to classify the data – shape and colour for example; and
Knowlege which we derive from past experience to help us make decisions – “That is a top-left corner so it goes there; that is an edge so it goes in that group; that edge matches that one so they might be neighbours and I will try fitting them together; the picture does not flow so they cannot be neighbours and I must separate them”.

The important point is that we do not need to Understand the picture to do this – we can just use “dumb” pattern-matching techniques, simple logic and brute force to decide which bits go together and which do not. A computer could do it – and we or the computer can solve the puzzle and still not recognise what we are looking at, understand what it means, or be able to make a wise decision.


To do that we need to search for meaning – and that usually means looking for and recognising symbols that are labels for concepts and using the picture to reveal how they relate to each other.

As we fit the neighbours together we see words and phrases that we may recognise – “Legend” and “cycle” for example (click the picture to enlarge)  – and we can use these labels to start to build a conceptual framework, and from that we create an expectation. Just as we did with the corners and edges.

The word “cycle” implies a circle, which is often drawn as a curved line, so we can use this expectation to look for pieces of a circle and lay them out – just as we did with the edges.

We may not recognise all the symbols – “citric acid” for example – and that finding means that there is new knowledge hidden in the picture. By the end we may understand what those new symbols mean from the context that the Big Picture creates.

By searching for meaning we are doing more than mechanically completing a task – we are learning, expanding our knowledge and deepening our understanding.

But to do this we need to separate the heap of bits so they do not obscure each other and so we can see each clearly. When it is a mess the new learning and deeper understanding will elude us.

We have now found some pieces with lines on that look like parts of a circle, so we can arrange them into an approximate sequence – and when we do that we are delighted to find that the pieces fit together, the pictures flow from one to the other, and there is a sense of order and structure starting to emerge from within the picture itself.

Until now the only structure we saw was the artificial and meaningless boundary.  We now see a new and unfamiliar phrase “citric acid cycle” – what is that? Our curiosity is building.

As we progress we find repeated symbols that we now recognise but do not understand – red and gray circles linked together. In the top right under the word “Legend” we see the same symbols together with some we do recognise – “hydrogen, carbon and oxygen”.

Ah ha! Now we can translate the unfamiliar symbols into familiar concepts, and now we suspect that this is something to do with chemistry. But what?

We are nearly there.  Almost all the pieces are in place and we have identified where the last few fit.

Now we can see that all the pieces are from the same jigsaw, there are none missing and there are no damaged, distorted, or duplicated pieces. The Big Picture looks complete.

We can see that the lines between the pieces are not part of the picture – they are artificial boundaries created when the picture was broken into parts – and useful only for helping us to re-assemble the big picture.

Now they are getting in the way – they are distracting us from seeing the picture as clearly as we could – so we can dispense with them – they have served their purpose.

We can also see that the pieces appear to be arranged in columns and rows – and we could view our picture as a set of interlocked vertical stripes or as a set of interlocked horizontal strips – but that this is an artificial structure created by our artificial boundaries. The picture we are seeing transcends our artificial linear decomposition.

We erase all the artificial boundaries and the full picture emerges.

Now we can see that we have a chemical system where a series of reactions are linked in a cycle – and we can see something called pyruvate coming in top left and we recognise the symbols water and CO2 and we conclude that this might be part of the complex biochemical system that is called cellular respiration – the process by which the food that we eat and the oxygen we breathe is converted into energy and the CO2 that we breathe out.

Wow!

And we can see that this is just part of a bigger map – the edges were also artificial and arbitrary! But where does the oxygen fit? And which bit is the energy? And what is the link between the carbohydrate that we eat and this new thing called pyruvate?

Our bigger picture and deeper understanding has generated a lot of new questions, there is so much more to explore, to learn and to understand!!


Let us stop and reflect. What have we learned?

We have learned that our piece was not just one of a random heap of unconnected jigsaw bits; we have learned where our piece fits into a Bigger Picture; we have learned how our piece is an essential part of that picture; we have learned that there is a design in the picture and we have learned how we are part of that design.

And when we all know and we all understand the whole design and how it works then we all have a much better chance of being able to improve it in a rational, sensible, explainable and actionable way.

Building the System Picture from the disorganised heap of Step Parts is one of the key skills of an Improvement Science Practitioner.

And the more practice we get, the quicker we recognise what we are looking at – because there are a relatively few effective system designs.

This is insight is important because most of the unsolved problems are system problems – and the sooner we can diagnose the system design flaws that are the root causes of the system problems, then the sooner we can propose, test and implement solutions and experience the expected improvements.

That is a Win-Win-Win strategy.

That is systems engineering in a nutshell.

Seeing Is Believing or Is It?

Do we believe what we see or do we see what we believe?  It sounds like a chicken-and-egg question – so what is the answer? One, the other or both?

Before we explore further we need to be clear about what we mean by the concept “see”.  I objectively see with my real eyes but I subjectively see with my mind’s eye. So to use the word see for both is likely to result in confusion and conflict and to side-step this we will use the word perceive for seeing-with-our-minds-eye.   

When we are sure of our belief then we perceive what we believe. This may sound incorrect but psychologists know better – they have studied sensation and perception in great depth and they have proved that we are all susceptible to “perceptual bias”. What we believe we will see distorts what we actually perceive – and we do it unconsciously. Our expectation acts like a bit of ancient stained glass that obscures and distorts some things and paints in a false picture of the rest.  And that is just during the perception process: when we recall what we perceived we can add a whole extra layer of distortion and can can actually modify our original memory! If we do that often enough we can become 100% sure we saw something that never actually happened. This is why eye-witness accounts are notoriously inaccurate! 

But we do not do this all of the time.  Sometimes we are open-minded, we have no expectation of what we will see or we actually expect to be surprised by what we will see. We like the feeling of anticipation and excitement – of not knowing what will happen next.   That is the psychological basis of entertainment, of exploration, of discovery, of learning, and of improvement science.

An experienced improvement facilitator knows this – and knows how to create a context where deeply held beliefs can be explored with sensitivity and respect; how to celebrate what works and how and why it does; how to challenge what does not; and how to create novel experiences; foster creativity and release new ideas that enhance what is already known, understood and believed.

Through this exploration process our perception broadens, sharpens and becomes more attuned with reality. We achieve both greater clarity and deeper understanding – and it is these that enable us to make wiser decisions and commit to more effective action.

Sometimes we have an opportunity to see for real what we would like to believe is possible – and that can be the pivotal event that releases our passion and generates our commitment to act. It is called the Black Swan effect because seeing just one black swan dispels our belief that all swans are white.

A practical manifestation of this principle is in the rational design of effective team communication – and one of the most effective I have seen is the Communication Cell – a standardised layout of visual information that is easy-to-see and that creates an undistorted perception of reality.  I first saw it many years ago as a trainee pilot when we used it as the focus for briefings and debriefings; I saw it again a few years ago at Unipart where it is used for daily communication; and I have seen it again this week in the NHS where it is being used as part of a service improvement programme.

So if you do not believe then come and see for yourself.

The Three Faces of Improvement Science

There is always more than one way to look at something and each perspective is complementary to the others.

Improvement Science has three faces: the first is the Process Face; the second is the People face and the third is the System face – and is represented in the logo with a different colour for each face.

The process face is the easiest to start with because it is logical, objective and absolute.  It describes the process; the what, where, when and how. It is the combination of the hardware and the software; the structure and the function – and it is constrained by the Laws of Physics.

The people face is emotional, subjective and relative.  It describes the people and their perceptions and their purposes. Each person interacts both with the process and with each other and their individual beliefs and behaviours drive the web of relationships. This is the world of psychology and politics.

The system face is neither logical nor emotional – it has characteristics that are easy to describe but difficult to define. Characteritics such a self-organisation; emergent behaviour; and complexity.  Our brains do not appear to be able to comprehend systems as easily and intuitively and we might like to believe. This is one reason why systems often feel counter-intuitive, unpredictable and mysterious. We discover that we are unable to make intuitive decisions that result in whole system improvement  because our intuition tricks us.

Gaining confidence and capability in the practical application of Improvement Science requires starting from our zone of relative strength – our conscious, logical, rational, explanable, teachable, learnable, objective dependency on the physical world. From this solid foundation we can explore our zone of self-control – our internal unconscious, psychological and emotional world; and from there to our zone of relative weakness –  the systemic world of multiple interdependencies that, over time, determine our individual and collective fate.

The good news is that the knowledge and skills we need to handle the rational physical process face are easy and quick to learn.  It can be done with only a short period of focussed, learning-by-doing.  With that foundation in place we can then explore the more difficult areas of people and systems.


Watch Out for the Overshoot!

In 1972 a group called the Club of Rome published a report entitled “The Limits to Growth” that examined the possible global impact of our current obsession with competition and growth. They used Jay W Forrester’s computer models described in World Dynamics – models of global stocks and flows of natural resources, capital and people – and explored the range future possibilities based on the best understanding of current reality. Their conclusions were not encouraging – the most likely outcome they predicted if current behaviours continued would be global natural, economic and population collapse before 2100!

Their conclusions were discounted by governments, corporations and individuals as doom-preaching but it struck a chord with many and helped to fuel the growth of the global environmental movement.

Thirty years later the original work has been revised, updated and the original predictions compared with actual changes.

The original forecast proved to be prophetic – and revealed an alarming conclusion – that we may already be past the point of no return. It is now forty years since the original work and we have enjoyed the predicted boom years of the 1980’s and ignored the warnings so many options for avoiding a future global collapse have already been squandered. Even if we corrected all the errors of commission and errors of omission today it may be too late because we over-estimate our ability to solve problems and underestimate the effect of “overshoot”.

Suppose you are driving at night in freezing fog and you want to get to your destination as soon as possible so you press on the accelerator and your speed grows. You have not been on this particular road before but you have been driving for years and you trust your experience, skills, and reactions. Suddenly a red light appears out of the gloom – it is a stop light and it is close, too close, so you hit the brakes! You don’t stop immediately though – you are slowing down but not fast enough. The road is slippery, your tyres do not grip as well as usual, and your momentum carries you on. You are burning up the remaining tarmac fast and now you see other lights – white lights – coming from the right. A juggernaut is nearly at the crossroads and it has the green light and is not slowing down.  You are on a crash course – and there is nothing you can do – you have no options. The awful realisation dawns that you have made a fatal error of judgement and this is the end as you overshoot the red light and are crushed to a mangled pulp of metal and flesh under the wheels of the juggernaut!

The accident was avoidable – in retrospect. Was it avoidable in prospect? Of course – but only
– IF we were able to challenge our blind trust in our own capability and
– IF we were able to anticipate what could happen and
– IF we had set up trustworthy early warning signals and
– IF we had prepared contingency plans of what we would do if any of the warning bells rang.

Easy enough for an individual to do perhaps – but much more difficult for a group of individuals who have low regard for each other and who are competing to grow bigger and faster. Our mastery of  nature has given us the means to change global system dynamics – so our collective fate is sealed by our collective behaviour. We have the ability to achieve mutually assured destruction (MAD) without dropping a single bomb – and we are on course to do so not because we set out to – but because we did not set out not to. The error of omission is the stealth killer.

Is this global disaster scenario realistic? Is there anything that can be done? Are we collectively capable of doing it? The evidence suggests “yes” to all three questions – there is hope – but it will require a paradigm shift in thinking rather than a breakthrough in technology.

The laws of physics will seal our fate unless the laws of people adapt – and it may already be too late to avoid some degree of catastrophic decline – which implies billions of lives will be lost needlessly. Those of us in positions of most influence are already to old to expect to live to see the fruits of our collective error of omission – our children will bear the pain of our ignorance and arrogance.  What do you want carved on your gravestone … “Here lies X – who saw but did not act. Sorry.”

Limits to Growth – the 30 year update. ISBN 978-1-84407-144-9

Do You Have A Miserable Job?

If you feel miserable at work and do not know what to do then then take heart because you could be suffering from a treatable organisational disease called CRAP (cynically resistant arrogant pessimism).

To achieve a healthier work-life then it is useful to understand the root cause of CRAP and the rationale of how to diagnose and treat it.

Organisations have three interdependent dimensions of performance: value, time and money.  All organisations require both the people and the processes to be working in synergy to reliably deliver value-for-money over time.  To create a productive system it is necessary to understand the relationships between  value, money and time. Money is easier because it is tangible and durable; value is harder because it is intangible and transient. This means that the focus of attention is usually on the money – and it is often assumed that if the money is OK then the value must be OK too.  This assumption is incorrect.

Value and money are interdependent but have different “rates of change”  and can operate in different “directions”.  A common example is when a dip in financial performance triggers an urgent “drive” to improve the “bottom line”.  Reactive revenue generation and cost cutting results in a small, quick, and tangible improvement on the money dimension but at the same time sets off a large, slow, and intangible deterioration on the value dimension.  Money, time and  value are interdependent and the inevitable outcome is a later and larger deterioration in the money – as illustrated in the doodle. If only money is measured the deteriorating value is not detected, and by the time the money starts to falter the momentum of the falling value is so great that even heroic efforts to recover are futile. As the money starts to fall the value falls even further and even faster – the lose-lose-lose spiral of organisational failure is now underway.

People who demonstrate in their attitude and behaviour that they are miserable at work provide the cardinal sign of falling system value. A miserable, sceptical and cynical employee poisons the emotional atmosphere for everyone around them. Misery is both defective and infective.  The primary cause of a miserable job is the behaviour exhibited by people in positions of authority – and the more the focus is only on money the more misery their behaviour generates.

Fortunately there is an antidote; a way to break out of the vicious tail spin – measure both value and money, focus on improving value and observe the positive effect on the money.  The critical behaviour is to actively test the emotional temperature and to take action to keep it moving in a positive direction.  “The Three Signs of a Miserable Job” by Patrick Lencioni tells a story of how an experienced executive learns that the three things a successful managerial leader must do to achieve system health are:
1) ensure employees know their unique place, role and value in the whole system;
2) ensure employees can consciously connect their work with a worthwhile system goal; and
3) ensure employees can objectively measure how they are doing.

Miserable jobs are those where the people feel anonymous, where people feel their work is valueless, and where people feel that they get no feedback from their seniors, peers or juniors. And it does not matter if it is the cleaner or the chief executive – everyone needs a role, a goal and to know all their interdependencies.

We do not have to endure a Miserable Job – we all have the power to transform it into Worthwhile Work.

Politics, Policy and Police.

I love words – they are a window into the workings of our caveman wetware. Spoken and written language is the remarkably recent innovation that opened the door to the development of civilisations because it allowed individual knowledge to accumulate, to be shared, to become collective and to span generations (the picture is 4000 year old Minoan script) .

We are social animals and we have discovered that our lives are more comfortable and more predictable if we arrange ourselves into collaborative groups – families, tribes and communities; and through our collaboration we have learned to tame our enironment enough to allow us to settle in one place and to concentrate more time and effort on new learning.  The benefits of this strategy comes at a price – because as the size of our communities grow we are forced to find new ways to make decisions that are in the best interests of everyone.  And we need to find new ways to help ourselves abide by those decisions as individuals without incurring the cost of enforcement.  The word “civis” means a person who shares the privileges and the duties of the community in which they live.  And size matters – hamlets, villages and towns developed along with our ability to behave in a “civilised” way. Eventually cities appeared around 6000 years ago – and the Greek word for a city is “polis”.  The bigger the city the greater the capacity to support learning and he specialistion of individual knowledge, skills and experience. This in turn fuels the growth of the group and the development of specialised groups – tribes within tribes. A positive feedback loop is created that drives bigger-and-bigger settlements and more and more knowledge. Until … we forget what it is that underpins the whole design – civilised behaviour.  While our knowkedge has evolved at an accelerating pace our caveman brains have not kept up – and this is where the three “Poli” words come in – they all derive from the same root “polis” and they describe a process:

1. Politic  is the method by which the collective decisions are generated.
2. Policy is the method by which the Political decisions are communicated.
3. Police is the method by which the System of Policies are implemented.

The problem arises when the growth of knowledge and the inevitable changes that result starts to challenge the current Politic+Policy+Police Paradigm that created the context for the change to happen.  The Polices are continulally evolving – as evidenced by the continuous process of legislation. The Paradigm can usually absorb a lot of change but there usually comes a point when it becomes increasingly apparent to the society the the Paradigm has to change radically to support further growth. The more rigid the Policy and the more power to enforce if present the greater the social pressure that builds before the paradigm fractures – and the greater the disruption that will ensue as the social pressure is released.  History is a long catalogue of political paradigm shifts of every size – from minor tremors to major quakes – shifts that are driven by our insatiable hunger for knowledge, understanding and meaning.

Improvement Science operates at the Policy stage and is therefore forms the critical link between Politics and Police.  The purpose of Improvement Science is to design, test and implement Policies that deliver the collective Win-Win-Win outcomes.  Improvement Science is an embodiment of civilised behaviour and it embraces both the constraints that are decided by the People and the constraints that are defined by the Physics.

Lies, Damned Lies and Statistics!

Most people are confused by statistics and because of this experts often regard them as ignorant, stupid or both.  However, those who claim to be experts in statistics need to proceed with caution – and here is why.

The people who are confused by statistics are confused for a reason – the statistics they see presented do not make sense to them in their world.  They are not stupid – many are graduates and have high IQ’s – so this means they must be ignorant and the obvious solution is to tell them to go and learn statistics. This is the strategy adopted in medicine: Trainees are expected to invest some time doing research and in the process they are expected to learn how to use statistics in order to develop their critical thinking and decision making.  So far so good, so what  is the outcome?

Well, we have been running this experiment for decades now – there are millions of peer reviewed papers published – each one having passed the scrutiny of a statistical expert – and yet we still have a health care system that is not delivering what we need at a cost we can afford.  So, there must be someone else at fault – maybe the managers! They are not expected to learn or use statistics so that statistically-ignorant rabble must be the problem -so the next plan is “Beat up the managers” and “Put statistically trained doctors in charge”.

Hang on a minute! Before we nail the managers and restructure the system let us step back and consider another more radical hypothesis. What if there is something not right about the statistics we are using? The medical statistics experts will rise immediately and state “Research statistics is a rigorous science derived from first principles and is mathematically robust!”  They are correct. It is. But all mathematical derivations are based on some initial fundamental assumptions so when the output does not seem to work in all cases then it is always worth re-examining the initial assumptions. That is the tried-and-tested path to new breakthroughs and new understanding.

The basic assumption that underlies research statistics is that all measurements are independent of each other which also implies that order and time can be ignored.  This is the reason that so much effort, time and money is invested in the design of a research trial – to ensure that the statistical analysis will be correct and the conclusions will be valid. In other words the research trial is designed around the statistical analysis method and its founding assumption. And that is OK when we are doing research.
However, when we come to apply the output of our research trials to the Real World we have a problem.

How do we demonstrate that implementing the research recommendation has resulted in an improvement? We are outside the controlled environment of research now and we cannot distort the Real World to suit our statistical paradigm.  Are the statistical tools we used for the research still OK? Is the founding assumption still valid? Can we still ignore time? Our answer is clearly “NO” because we are looking for a change over time! So can we assume the measurements are independent – again our answer is “NO” because for a process the measurement we make now is influenced by the system before, and the same system will also influence the next measurement. The measurements are NOT independent of each other.

Our statistical paradigm suddenly falls apart because the founding assumption on which it is built is no longer valid. We cannot use the statistics that we used in the research when we attempt to apply the output of the research to the Real World. We need a new and complementary statistical approach.

Fortunately for us it already exists and it is called improvement statistics and we use it all the time – unconsciously. No doctor would manage the blood pressure of a patient on Ward A  based on the average blood pressure of the patients on Ward B – it does not make sense and would not be safe.  This single flash of insight is enough to explain our confusion. There is more than one type of statistics!
New insights also offer new options and new actions. One action would be that the Academics learn improvement statistics so that they can understand better the world outside research; another action would be that the Pragmatists learn improvement statistics so that they can apply the output of well-conducted research in the Real World in a rational, robust and safe way. When both groups have a common language the opportunities for systemic improvment increase. 

BaseLine© is a tool designed specifically to offer the novice a path into the world of improvement statistics.

How Do We Measure the Cost of Waste?

There is a saying in Yorkshire “Where there’s muck there’s brass” which means that muck or waste is expensive to create and to clean up. 

Improvement science provides the theory, techniques and tools to reduce the cost of waste and to re-invest the savings in further improvement.  But how much does waste cost us? How much can we expect to release to re-invest?  The answer is deceptively simple to work out and decidedly alarming when we do.

We start with the conventional measurement of cost – the expenses – be they materials, direct labour, indirect labour, whatever. We just add up all the costs for a period of time to give the total spend – let us call that the stage cost. The next step requires some new thinking – it requires looking from the perspective of the job or customer – and following the path backwards from the intended outcome, recording what was done, how much resource-time and material it required and how much that required work actually cost.  This is what one satisfied customer is prepared to pay for; so let us call this the required stream cost. We now just multiply the output or activity for the period of time by the required stream cost and we will call that the total stream cost. We now just compare the stage cost and the stream cost – the difference is the cost of waste – the cost of all the resources consumed that did not contribute to the intended outcome. The difference is usually large; the stream cost is typically only 20%-50% of the stage cost!

This may sound unbelieveable but it is true – and the only way to prove it to go and observe the process and do the calculation – just looking at our conventional finanical reports will not give us the answer.  Once we do this simple experiment we will see the opportunity that Improvement Science offers – to reduce the cost of waste in a planned and predictable manner.

But if we are not prepared to challenge our assumptions by testing them against reality then we will deny ourselves that opportunity. The choice is ours.

One of the commonest assumptions we make is called the Flaw of Averages: the assumption that it is always valid to use averages when developing business cases. This assumption is incorrect.  But it is not immediately obvious why it is incorrect and the explanation sounds counter-intuitive. So, one way to illustrate is with a real example and here is one that has been created using a process simulation tool – virtual reality:

What do We Mean by Capacity?

I often hear the statement “Our problem is caused by lack of capacity?” and this is usually followed by a heated debate (i.e. an arugment) about how to get more resources to solve the “capacity problem”: The protagonists are usually Governance who start the debate by raising a safety or quality problem; Operations who are tasked to resolve the problem and Finance who are expected to pay.

But what are they talking about? What exactly is “Capacity”? The reason I ask is because the word is ambiguous – it has several meanings – and unless the precise meaning is made explicit then individuals may unconsciously assume different interpretations and crossed-wires, confusion and conflict will ensue.

From the perspective of a process there are at least two distinct meanings that must not be confused: one is flow capacity and the other is inventory capacity.  To give an example of the distinction consider your household plumbing system: the hot water tank has a capacity that is measured in the volume of the tank – e.g. in litres; the pipe that leads from the tank to your tap has a capacity that is measured by the flow through the pipe – e.g. in litres per minute.  These are clearly NOT the same; they are related by time: A 50 litre capacity tank connected to a 5 litre per minute capacity pipe will empty in 10 minutes. So when you are talking about “capacity” be sure to be explicit about which form you mean … volume or flow; static or dynamic; inventory or activity.  It will avoid a LOT of confusion!!

Is this just a Clash of Personality?

Have you ever have the experience of trying to work on a common challenge with a team member and it just feels like you are on different planets?  You are using the same language yet are not communicating – they go off at apparently random tangents while you are trying to get a decision; they deluge you with detail when you ask about the big picture; you get upset when their cold logic threatens to damage team unity. The list is endless.  If you experience this sort of confusion and frustration then you may be experiencing a personality clash – or to be more accurate a pyschological type mismatch.

Carl Jung described a theory of psychological types that was later developed into the Myers-Briggs Type Indictator (MBTI).  This extensively validated method classifies people into sixteen broad groups based on four dimensions that are indicated by a letter code. It is important to appreciate that there are no good/bad types or right/wrong types – each describes a mode of thinking: a model of how we gather information, make decisions and act on those decisions.  Everyone uses all the modes of thinking to some degree – we just prefer some more than others and so we get more practice with them.  The purpose of MBTI is not to “correct” someone elses psychologcial type – it is to gain a conscious and shared awareness of the effect of psychological types on interpersonal and team dynamics. For example, some tasks and challenges suit some psychological types better than others – they resonate – and when this happens these tasks are achieved more easily and with greater satisfaction.  “One’s meat is another’s poison” sums the idea up.  Just having insight into this dynamic is helpful because it offers new options to avoid frustrating, futile and wasteful conflict.  So if you are curious find out your MBTI – you can do it on line in a few minutes (for example http://www.personalitytest.net/types/index.htm) and with that knowledge you can learn what your psychological type implies.  Mine is INFJ …

Can We See a Story in the Data?

I often hear the comments “I cannot see the wood for the trees”, “I am drowning in an ocean of data” and “I cannot identify the cause of the problem”.  We have data, we know there is a problem and we sense there is a soluton; the gap seems to be using the data to find a solution to the problem.

Most quantitative data is presented as tables of columns and rows of numbers; and is indigestable by the majority of people.  Numbers are a recent invention on a biological timescale and we have not yet evolved to effortlessly process data presented in that format. We are visual animals and we have evolved to be very good at seeing patterns in pictures – because it was critical to survival.  Another recent invention is spoken language and, long before writing was invented, accumulated knowledge and wisdom was passed down by word of mouth as legends, myths and stories. Stories are general descriptions that suggest specific solutions. So why do we have such difficulty in extracting the story from the data? Perhaps it is because we use our ears to hear stories that are communicated in words and we use our eyes to see patterns in pictures.  Presenting quantitative data as streams of printed symbols just doesn’t work as well.  To see the story in the data we need to present it as a picture and then talk about what we perceive.

Here are some data – a series of numbers recorded over a period of time – what is the story?

47, 55, 40, 52, 55, 70, 60, 43, 51, 41, 73, 73, 79, 89, 83, 86, 78, 85, 71, 70

Here is the same data converted into a picture.  You can see the message in the data … something changed between measurement 10 and 11.  The chart does not tell us why it changed – it only tells us when it happened and sugegsts what to look for – anything that is capable of causing the effect we can see.  We now have a story and our curiosity is aroused. We want an explanation; we want to understand; we want to learn; and we want to improve.  (For source of data and image visit www.valuesystemdesign.com).

A picture can save a thousand words and ten thousand numbers!

Seeing the Voice of the Process

Welcome to the blog that is specifically focussed on the Science of Improvement – the growing body of knowledge about how to achieve improvement in any system or process both reliably and safely.