“Houston, we have a problem!”

The immortal words from Apollo 13 that alerted us to an evolving catastrophe …

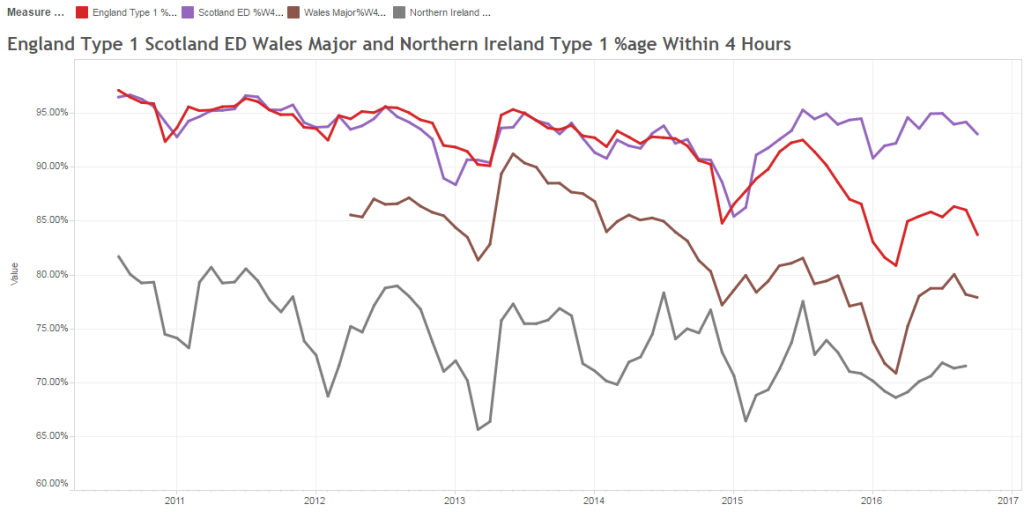
… and that is what we are seeing in the UK health and social care system … using the thermometer of A&E 4-hour performance. England is the red line.

uk_ae_runchart

The chart shows that this is not a sudden change, it has been developing over quite a long period of time … so why does it feel like an unpleasant surprise?


One reason may be that NHS England is using performance management techniques that were out of date in the 1980’s and are obsolete in the 2010’s!

Let me show you what I mean. This is a snapshot from the NHS England Board Minutes for November 2016.

nhse_rag_nov_2016
RAG stands for Red-Amber-Green and what we want to see on a Risk Assessment is Green for the most important stuff like safety, flow, quality and affordability.

We are not seeing that.  We are seeing Red/Amber for all of them. It is an evolving catastrophe.

A risk RAG chart is an obsolete performance management tool.

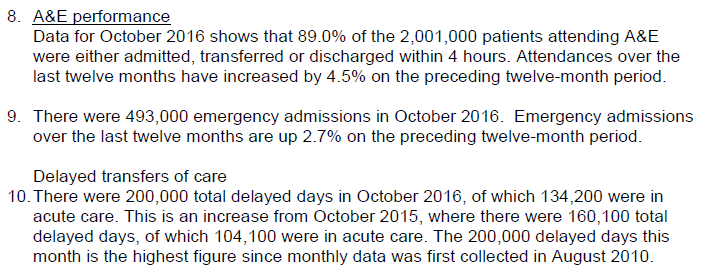
Here is another snippet …

nhse_ae_nov_2016

This demonstrates the usual mix of single point aggregates for the most recent month (October 2016); an arbitrary target (4 hours) used as a threshold to decide failure/not failure; two-point comparisons (October 2016 versus October 2015); and a sprinkling of ratios. Not a single time-series chart in sight. No pictures that tell a story.

Click here for the full document (which does also include some very sensible plans to maintain hospital flow through the bank holiday period).

The risk of this way of presenting system performance data is that it is a minefield of intuitive traps for the unwary.  Invisible pitfalls that can lead to invalid conclusions, unwise decisions, potentially ineffective and/or counter-productive actions, and failure to improve. These methods are risky and that is why they should be obsolete.

And if NHSE is using obsolete tools than what hope do CCGs and Trusts have?


Much better tools have been designed.  Tools that are used by organisations that are innovative, resilient, commercially successful and that deliver safety, on-time delivery, quality and value for money. At the same time.

And they are obsolete outside the NHS because in the competitive context of the dog-eat-dog real world, organisations do not survive if they do not innovate, improve and learn as fast as their competitors.  They do not have the luxury of being shielded from reality by having a central tax-funded monopoly!

And please do not misinterpret my message here; I am a 100% raving fan of the NHS ethos of “available to all and free at the point of delivery” and an NHS that is funded centrally and fairly. That is not my issue.

My issue is the continued use of obsolete performance management tools in the NHS.


Q: So what are the alternatives? What do the successful commercial organisations use instead?

A: System behaviour charts.

SBCs are pictures of how the system is behaving over time – pictures that tell a story – pictures that have meaning – pictures that we can use to diagnose, design and deliver a better outcome than the one we are heading towards.

Pictures like the A&E performance-over-time chart above.

Click here for more on how and why.


Therefore, if the DoH, NHSE, NHSI, STPs, CCGs and Trust Boards want to achieve their stated visions and missions then the writing-on-the-wall says that they will need to muster some humility and learn how successful organisations do this.

This is not a comfortable message to hear and it is easier to be defensive than receptive.

The NHS has to change if it wants to survive and continue serve the people who pay the salaries. And time is running out. Continuing as we are is not an option. Complaining and blaming are not options. Doing nothing is not an option.

Learning is the only option.

Anyone can learn to use system behaviour charts.  No one needs to rely on averages, two-point comparisons, ratios, targets, and the combination of failure-metrics and us-versus-them-benchmarking that leads to the chronic mediocrity trap.

And there is hope for those with enough hunger, humility and who are prepared to do the hard-work of developing their personal, team, department and organisational capability to use better management methods.


Apollo 13 is a true story.  The catastrophe was averted.  The astronauts were brought home safely.  The film retells the story of how that miracle was achieved. Perhaps watching the whole film would be somewhere to start, because it holds many valuable lessons for us all – lessons on how effective teams behave.

Politicial Purpose

count_this_vote_400_wht_9473The question that is foremost in the mind of a designer is “What is the purpose?”   It is a future-focussed question.  It is a question of intent and outcome. It raises the issues of worth and value.

Without a purpose it impossible to answer the question “Is what we have fit-for-purpose?

And without a clear purpose it is impossible for a fit-for-purpose design to be created and tested.

In the absence of a future-purpose all that remains are the present-problems.

Without a future-purpose we cannot be proactive; we can only be reactive.

And when we react to problems we generate divergence.  We observe heated discussions. We hear differences of opinion as to the causes and the solutions.  We smell the sadness, anger and fear. We taste the bitterness of cynicism. And we are touched to our core … but we are paralysed.  We cannot act because we cannot decide which is the safest direction to run to get away from the pain of the problems we have.


And when the inevitable catastrophe happens we look for somewhere and someone to place and attribute blame … and high on our target-list are politicians.


So the prickly question of politics comes up and we need to grasp that nettle and examine it with the forensic lens of the system designer and we ask “What is the purpose of a politician?”  What is the output of the political process? What is their intent? What is their worth? How productive are they? Do we get value for money?

They will often answer “Our purpose is to serve the public“.  But serve is a verb so it is a process and not a purpose … “To serve the public for what purpose?” we ask. “What outcome can we expect to get?” we ask. “And when can we expect to get it?

We want a service (a noun) and as voters and tax-payers we have customer rights to one!

On deeper reflection we see a political spectrum come into focus … with Public at one end and Private at the other.  A country generates wealth through commerce … transforming natural and human resources into goods and services. That is the Private part and it has a clear and countable measure of success: profit.  The Public part is the redistribution of some of that wealth for the benefit of all – the tax-paying public. Us.

Unfortunately the Public part does not have quite the same objective test of success: so we substitute a different countable metric: votes. So the objectively measurable outcome of a successful political process is the most votes.

But we are still talking about process … not purpose.  All we have learned so far is that the politicians who attract the most votes will earn for themselves a temporary mandate to strive to achieve their political purpose. Whatever that is.

So what do the public, the voters, the tax-payers (and remember whenever we buy something we pay tax) … the customers of this political process … actually get for their votes and cash?  Are they delighted, satisfied or disappointed? Are they getting value-for-money? Is the political process fit-for-purpose? And what is the purpose? Are we all clear about that?

And if we look at the current “crisis” in health and social care in England then I doubt that “delight” will feature high on the score-sheet for those who work in healthcare or for those that they serve. The patients. The long-suffering tax-paying public.


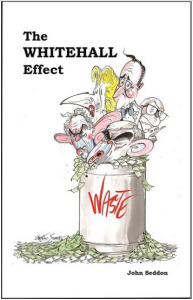
Are politicians effective? Are they delivering on their pledge to serve the public? What does the evidence show?  What does their portfolio of public service improvement projects reveal?  Welfare, healthcare, education, police, and so on.The_Whitehall_Effect

Well the actual evidence is rather disappointing … a long trail of very expensive taxpayer-funded public service improvement failures.

And for an up-to-date list of some of the “eye-wateringly”expensive public sector improvement train-wrecks just read The Whitehall Effect.

But lurid stories of public service improvement failures do not attract precious votes … so they are not aired and shared … and when they are exposed our tax-funded politicians show their true skills and real potential.

Rather than answering the questions they filter, distort and amplify the questions and fire them at each other.  And then fall over each other avoiding the finger-of-blame and at the same time create the next deceptively-plausible election manifesto.  Their food source is votes so they have to tickle the voters to cough them up. And they are consummate masters of that art.

Politicians sell dreams and serve disappointment.


So when the-most-plausible with the most votes earn the right to wield the ignition keys for the engine of our national economy they deflect future blame by seeking the guidance of experts. And the only place they can realistically look is into the private sector who, in manufacturing anyway, have done a much better job of understanding what their customers need and designing their processes to deliver it. On-time, first-time and every-time.

Politicians have learned to be wary of the advice of academics – they need something more pragmatic and proven.  And just look at the remarkable rise of the manufacturing phoenix of Jaguar-Land-Rover (JLR) from the politically embarrassing ashes of the British car industry. And just look at Amazon to see what information technology can deliver!

So the way forward is blindingly obvious … combine manufacturing methods with information technology and build a dumb-robot manned production-line for delivering low-cost public services via a cloud-based website and an outsourced mega-call-centre manned by standard-script-following low-paid operatives.


But here we hit a bit of a snag.

Designing a process to deliver a manufactured product for a profit is not the same as designing a system to deliver a service to the public.  Not by a long chalk.  Public services are an example of what is now known as a complex adaptive system (CAS).

And if we attempt to apply the mechanistic profit-focussed management mantras of “economy of scale” and “division of labour” and “standardisation of work” to the messy real-world of public service then we actually achieve precisely the opposite of what we intended. And the growing evidence is embarrassingly clear.

We all want safer, smoother, better, and more affordable public services … but that is not what we are experiencing.

Our voted-in politicians have unwittingly commissioned complicated non-adaptive systems that ensure we collectively fail.

And we collectively voted the politicians into power and we are collectively failing to hold them to account.

So the ball is squarely in our court.


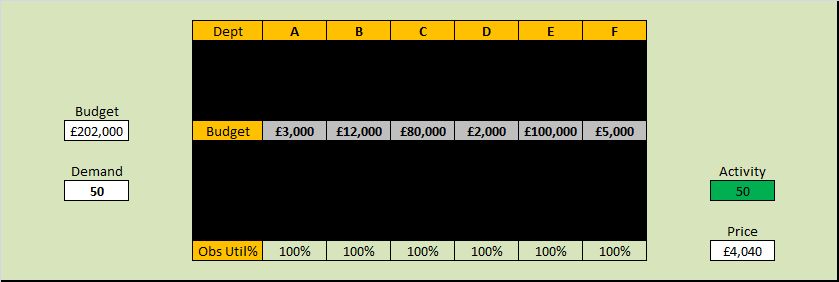
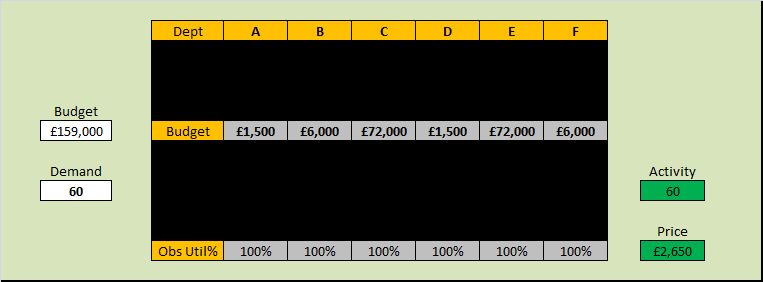
Below is a short video that illustrates what happens when politicians and civil servants attempt complex system design. It is called the “Save the NHS Game” and it was created by a surgeon who also happens to be a system designer.  The design purpose of the game is to raise awareness. The fundamental design flaw in this example is “financial fragmentation” which is the the use of specific budgets for each part of the system together with a generic, enforced, incremental cost-reduction policy (the shrinking budget).  See for yourself what happens …


In health care we are in the improvement business and to do that we start with a diagnosis … not a dream or a decision.

We study before we plan, and we plan before we do.

And we have one eye on the problem and one eye on the intended outcome … a healthier patient.  And we often frame improvement in the negative as a ‘we do not want a not sicker patient’ … physically or psychologically. Primum non nocere.  First do no harm.

And 99.9% of the time we do our best given the constraints of the system context that the voted-in politicians have created for us; and that their loyal civil servants have imposed on us.


Politicians are not designers … that is not their role.  Their part is to create and sell realistic dreams in return for votes.

Civil servants are not designers … that is not their role.  Their part is to enact the policy that the vote-seeking politicians cook up.

Doctors are not designers … that is not their role.  Their part is to make the best possible clinical decisions that will direct actions that lead, as quickly as possible, to healthier and happier patients.

So who is doing the complex adaptive system design?  Whose role is that?

And here we expose a gap.  No one.  For the simple reason that no one is trained to … so no one is tasked to.

But there is a group of people who are perfectly placed to create the context for developing this system design capability … the commissioners, the executive boards and the senior managers of our public services.

So that is where we might reasonably start … by inviting our leaders to learn about the science of complex adaptive system improvement-by-design.

And there are now quite a few people who can now teach this science … they are the ones who have done it and can demonstrate and describe their portfolios of successful and sustained public service improvement projects.

Would you vote for that?

Counter-Productivity

coffee_table_talk_PA_150_wht_6082The Webex icon bounced up and down on Bob’s task bar signalling that Leslie had just joined the weekly ISP coaching session.

<Leslie> Hi Bob. I have been so busy this week that I have not had time to consider a topic to explore.

<Bob> No problem Leslie, I have shelf full of topics we have not touched yet.  So shall we talk about counter-productivity?

<Leslie> Don’t you mean productivity … the fourth dimension of system improvement.

<Bob>They are related of course but we will approach the issue of productivity from a different angle. Rather like we did with safety. To improve safety we considered at the causes of un-safety and focussed our efforts there.

<Leslie> Ah yes, I see.  So to improve productivity we look at the causes of un-productivity … in other words counter-productive beliefs and behaviours that are manifest as system design flaws.

<Bob> Exactly. So remind me what the definition of a productivity metric is from your FISH course.

<Leslie> Productivity is the ratio of a stream metric and a stage metric.  Value-for-Money for example.

<Bob> Good.  So counter-productivity is also a ratio of a stream and a stage metric.

<Leslie> Um, I’m not sure I quite get that. Can you explain a bit more.

<Bob> OK. To explore deeper we need to be clear about how each metric relates to our intended outcome.  Remember in safety-by-design we count the number and severity of risks and harm because  as harm is going up then safety is going down.  So harm is an un-safety stream metric.

<Leslie> Ah! Yes I see.  So if we look at cycle-time, which is a stage metric; as cycle-time increases, the activity falls and productivity falls. So cycle-time is actually a counter-productivity metric.

<Bob>Excellent. You are getting the hang of the concept of counter-productivity.

<Leslie> And we need to be careful because productivity is a ratio so the numerator and denominator metrics work in opposite ways: increasing the magnitude of the numerator is equivalent to decreasing the magnitude of the denominator – the ratio increases.

<Bob> Indeed, there are many hazards with ratios as we have explored before. So let is consider a real and rather useful example.  Let us look at Little’s Law from the perspective of counter-productivity. Remind me of the definition of Little’s Law for a single step system.

<Leslie> Little’s Law is a mathematically proven law of flow physics which states that the average lead-time is the product of the average work-in-progress and the average cycle-time.

LT = WIP * CT

<Bob> Good and I am pleased to see that you have used cycle-time. We are considering a single stream, single stage, single step system.

<Leslie> Yes, I avoided using the unqualified term ‘activity’. I have learned that lesson the hard way too!

<Bob> So how do the terms in Little’s Law relate to streams, stages and systems?

<Leslie> Lead-time is a stream metric, cycle-time is a stage metric and work-in-progress is a …. h’mm. What it is? A stream metric or a stage metric?

<Bob>Or?

<Leslie>A system metric?  WIP is a system metric!

<Bob> Good. So now re-arrange Little’s Law as a productivity formula.

<Leslie> Work-in-Progress equals lead-time divided by cycle-time

WIP = LT / CT

<Bob> So is WIP a productivity or a counter-productivity metric?

<Leslie> H’mmm …. I will need to work this through logically and step-by-step. I do not trust my intuition on this flow stuff.

Increasing cycle-time is counter-productive because it implies activity is falling while costs are not.

But cycle-time is on the bottom of the ratio so it’s effect reverses.

So if lead-time stays the same and cycle-time increases then because it is on the bottom of the ratio that implies a more productive design. And at the same time work in progress must be falling. Urrgh! This is hurting my head.

<Bob> Good, keep going … you are nearly there.

<Leslie> So a falling WIP is a sign of increasing productivity.

<Bob> Good … and that implies?

<Leslie> WIP is a counter-productivity system metric!

<Bob> Well done. Your logic is flawless.

<Leslie> So that  is why we focus on WIP so much!  Whatever causes WIP to increase is counter-productive!

Ahhhh …. that makes complete sense.

Lo-WIP  designs are more productive than Hi-WIP designs.

<Bob> Bravo!  And translating this into financial metrics … it is because a big queue of waiting work incurs costs. Storage cost, maintenance cost, processing cost and so on. So WIP is a liability. It is not an asset!

<Leslie> But doesn’t that imply treating work-in-progress as an asset on the financial balance sheet is counter-productive?

<Bob> It does indeed.

<Leslie> Oh dear! That revelation is going to upset a lot of people in the accounting department!

<Bob> The painful reality is that  the Laws of Flow Physics are completely indifferent to what any of us believe or do not believe.

<Leslie> Wow!  I like this concept of counter-productivity … it really helps to expose some of our invalid assumptions that invisibly block improvement!

<Bob> So here is a question to ponder.  Is zero WIP desirable or even possible?

<Leslie> H’mmm.  I will have to think about that.  I know you would not have asked the question for no reason.

Sticks or Carrots?

boss_dangling_carrot_for_employee_anim_150_wht_13061[Beep Beep] Bob’s laptop signaled the arrival of Leslie to their regular Webex mentoring session. Bob picked up the phone and connected to the conference call.

<Bob> Hi Leslie, how are you today?

<Leslie> Great thanks Bob. I am sorry but that I do not have a red-hot burning issue to talk about today.

<Bob> OK – so your world is completely calm and orderly now. Excellent.

<Leslie> I wish! The reason is that I have been busy preparing for the monthly 1-2-1 with my boss.

<Bob> OK. So do you have a few minutes to talk about that?

<Leslie> What can I tell you about it?

<Bob> Can you just describe the purpose and the process for me?

<Leslie> OK. The purpose is improvement – for both the department and the individual. The process is that all departmental managers have an annual appraisal based on their monthly 1-2-1 chats and the performance scores for their departments are used to reward the top 15% and to ‘performance manage’ the bottom 15%.

<Bob> H’mmm.  What is the commonest emotion that is associated with this process?

<Leslie> I would say somewhere between severe anxiety and abject terror. No one looks forward to it. The annual appraisal feels like a lottery where the odds are stacked against you.

<Bob> Can you explain that a bit more for me?

<Leslie> Well, the most fear comes from being in the bottom 15% – the fear of being ‘handed your hat’ so to speak. Fortunately that fear motivates us to try harder and that usually saves us from the chopper because our performance improves.  The cost is the extra stress, working late and taking ‘stuff’ home.

<Bob> OK. And the anxiety?

<Leslie> Paradoxically that mostly comes from the top 15%. They are anxious to sustain their performance. Most do not and the Boss’s Golden Manager can crash spectacularly! We have seen it so often. It is almost as if being the Best carries a curse! So most of us try to stay in the middle of the pack where we do not stick out – a sort of safety in the herd strategy.  It is illogical I know because there is always a ‘top’ 15% and a ‘bottom’ 15%.

<Bob> You mentioned before that it feels like a lottery. How come?

<Leslie> Yes – it feels like a lottery but I know it has a rational scientific basis. Someone once showed me the ‘statistically significant evidence’ that proves it works.

<Bob> That what works exactly?

<Leslie> That sticks are more effective than carrots!

<Bob> Really! And what does the performance run charts look like – over the long term – say monthly over 2-3 years?

<Leslie> That is a really good question. They are surprisingly stable – well completely stable in fact. The wobble up and down of course but there is no sign of improvement over the long term – no trend. If anything it is the other way.

<Bob> So what is the rationale for maintaining the stick-is-better-than-the-carrot policy?

<Leslie> Ah! The message we are getting  is ‘as performance is not improving and sticks have been scientifically proven to be more effective than carrots then we will be using a bigger stick in future‘.

<Bob> Hence the atmosphere of fear and anxiety?

<Leslie> Exactly. But that is the way it must be I suppose.

<Bob> Actually it is not. This is an invalid design based on rubbish intuitive assumptions and statistical smoke-and-mirrors that creates unmeasurable emotional pain and destroys both people and organisations!

<Leslie> Wow! Bob! I have never heard you use language like that. You are usually so calm and reasonable. This must be really important!

 <Bob> It is – and for that reason I need to shock you out of your apathy  – and I can do that best by you proving it to yourself – scientifically – with a simple experiment. Are you up for that?

<Leslie> You betcha! This sounds like it is going to be interesting. I had better fasten my safety belt! The Nerve Curve awaits.


 The Stick-or-Carrot Experiment

<Bob> Here we go. You will need five coins, some squared-paper and a pencil. Coloured ones are even better.

<Leslie> OK. Does it matter what sort of coins?

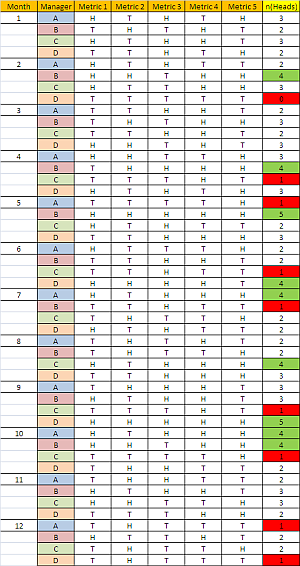
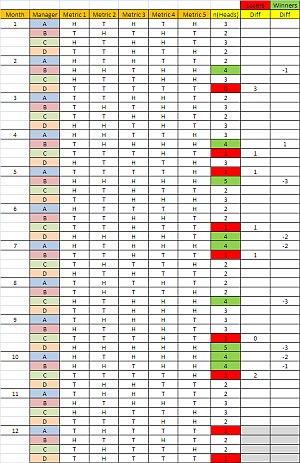
<Bob> No. Any will do. Imagine you have four managers called A,B,C and D respectively.  Each month the performance of their department is measured as the number of organisational targets that they are above average on. Above average is like throwing a ‘head’, below average is like throwing a ‘tail’. There are five targets – hence the coins

<Leslie>OK. That makes sense – and it feels better to use the measured average – we have demonstrated that arbitrary performance targets are dangers – especially when imposed blindly across all departments.

<Bob> Indeed. So can you design a score sheet to track the data for the experiment.

<Leslie>Give me a minute.  Will this suffice?

Stick_and_Carrot_Fig1<Bob> Perfect! Now simulate a month by tossing all five coins – once for each manager – and record the outcome of each as H to T , then tot up the number of heads for each manager.

<Leslie>  OK … here is what I got.

Stick_and_Carrot_Fig2<Bob>Good. Now repeat this 11 more times to give you the results for a whole year.  In the n(Heads) column colour the boxes that have scores of zero or one as red – these are the Losers. Then colour the boxes that have 4 or 5 as green – these are the Winners.

<Leslie>OK, that will take me a few minutes – do you want to get a coffee or something.

[Five minutes later]

Here you go. That gives 96 opportunities to win or lose and I counted 9 Losers and 9 Winners so just under 20% for each. The majority were in the unexceptional middle. The herd.

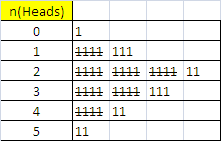
Stick_and_Carrot_Fig3<Bob> Excellent.  A useful way to visualise this is using a Tally chart. Just run down the column of n(Heads) and create the Tally chart as you go. This is one of the oldest forms of counting in existence. There are fossil records that show Tally charts being used thousands of years ago.

<Leslie> I think I understand what you mean. We do not wait until all the data is in then draw the chart, we update it as we go along – as the data comes in.

<Bob> Spot on!

<Leslie> Let me see. Wow! That is so cool!  I can see the pattern appearing almost magically – and the more data I have the clearer the pattern is.

 <Bob>Can you show me?

<Leslie> Here we go.

Stick_and_Carrot_Fig4<Bob> Good.  This is the expected picture. If you repeated this many times you would get the same general pattern with more 2 and 3 scores.

Now I want you to do an experiment.

Assume each manager that is classed as a Winner in one month is given a reward – a ‘pat on the back’ from their Boss. And each manager that is classed as a Loser is given a ‘written warning’. Now look for  the effect that this has.

<Leslie> But we are using coins – which means the outcome is just a matter of chance! It is a lottery.

<Bob> I know that and you know that but let us assume that the Boss believes that the monthly feedback has an effect. The experiment we are doing is to compare the effect of the carrot with the stick. The Boss wants to know which results in more improvement and to know that with scientific and statistical confidence!

<Leslie> OK. So what I will do is look at the score the following month for each manager that was either a Winner or a  Loser; work out the difference, and then calculate the average of those differences and compare them with each other. That feels suitably scientific!

<Bob> OK. What do you get.

<Leslie> Just a minute, I need to do this carefully. OK – here it is.

<Bob>Stick_and_Carrot_Fig5 Excellent.  Just eye-balling the ‘Measured improvement after feedback’ columns I would say the Losers have improved and the Winners have deteriorated!

<Leslie> Yes! And the Losers have improved by 1.29 on average and the Winners have deteriorated by 1.78 – and that is a big difference for such small sample. I am sure that with enough data this would be a statistically significant difference! So it is true, sticks work better than carrots!

<Bob>Not so fast. What you are seeing is a completely expected behaviour called “Regression to the Mean“. Remember we know that the score for each manager each month is the result of a game of chance, a coin toss, a lottery. So no amount of stick or carrot feedback is going to influence that.

<Leslie>But the data is saying there is a difference! And that feels like the experience we have – and why fear stalks the management corridors. This is really confusing!

<Bob>Remember that confusion arises from invalid or conflicting unconscious assumptions. There is a flaw in the statistical design of this experiment. The ‘obvious’ conclusion is invalid because of this flaw. And do not be too hard on yourself. The flaw eluded mathematicians for centuries. But now you know there is one can you find it?

<Leslie>OMG!  The use of the average to classify the managers into Winners or Losers is the flaw!  That is just a lottery. Who the managers are is irrelevant. This is just a demonstration of how chance works.

But that means … OMG!  If the conclusion is invalid then sticks are not better than carrots and we have been brain-washed for decades into accepting a performance management system that is invalid – and worse still is used to ‘scientifically’ justify systematic persecution! I can see now why you get so angry!

<Bob>Bravo Leslie.  We  need to check your understanding. Does that mean carrots are better than sticks?

<Leslie>No!  The conclusion is invalid because the assumptions are invalid and the design is fatally flawed. It does not matter what the conclusion actually is.

<Bob>Excellent. So what conclusion can you draw?

<Leslie>That this short-term carrot-or-stick feedback design for achieving improvement in a stable system  is both ineffective and emotionally damaging. In fact it could well be achieving precisely the opposite effect that it is intended to. It may be preventing improvement! But the story feels so plausible and the data appears to back it up. What is happening here is we are using statistical smoke-and-mirrors to justify what we have already decided – and only an true expert would spot the flaw! Once again our intuition has tricked us!

<Bob>Well done! And with this new insight – how would you do it differently?  What would be a better design?

<Leslie>That is a very good question. I am going to have to think about that – before my 1-2-1 tomorrow. I wonder what might happen if I show this demonstration to my Boss? Thanks Bob, as always … lots of food for thought.


The Seventh Flow

texting_a_friend_back_n_forth_150_wht_5352Bing Bong

Bob looked up from the report he was reading and saw the SMS was from Leslie, one of his Improvement Science Practitioners.

It said “Hi Bob, would you be able to offer me your perspective on another barrier to improvement that I have come up against.”

Bob thumbed a reply immediately “Hi Leslie. Happy to help. Free now if you would like to call. Bob

Ring Ring

<Bob> Hello, Bob here.

<Leslie> Hi Bob. Thank you for responding so quickly. Can I describe the problem?

<Bob> Hi Leslie – Yes, please do.

<Leslie> OK. The essence of it is that I have discovered that our current method of cash-flow control is preventing improvements in safety, quality, delivery and paradoxically in productivity too. I have tried to talk to the Finance department and all I get back is “We have always done it this way. That is what we are taught. It works. The rules are not negotiable and the problem is not Finance“. I am at a loss what to do.

<Bob> OK. Do not worry. This is a common issue that every ISP discovers at some point. What led you to your conclusion that the current methods are creating a barrier to change?

<Leslie> Well, the penny dropped when I started using the modelling tools you have shown me.  In particular when predicting the impact of process improvement-by-design changes on the financial performance of the system.

<Bob> OK. Can you be more specific?

<Leslie> Yes. The project was to design a new ambulatory diagnostic facility that will allow much more of the complex diagnostic work to be done on an outpatient basis.  I followed the 6M Design approach and looked first at the physical space design. We needed that to brief the architect.

<Bob> OK. What did that show?

<Leslie> It showed that the physical layout had a very significant impact on the flow in the process and that by getting all the pieces arranged in the right order we could create a physical design that felt spacious without actually requiring a lot of space. We called it the “Tardis Effect“. The most marked impact was on the size of the waiting areas – they were really small compared with what we have now which are much bigger and yet still feel cramped and chaotic.

<Bob> OK. So how does that physical space design link to the finance question?

<Leslie> Well, the obvious links were that the new design would have a smaller physical foot-print and at the same time give a higher throughput. It will cost less to build and will generate more activity than if we just copied the old design into a shiny new building.

<Bob> OK. I am sure that the Capital Allocation Committee and the Revenue Generation Committee will have been pleased with that outcome. What was the barrier?

<Leslie> Yes, you are correct. They were delighted because it left more in the Capital Pot for other equally worthy projects. The problem was not capital it was revenue.

<Bob> You said that activity was predicted to increase. What was the problem?

<Leslie>Yes – sorry, I was not clear – it was not the increased activity that was the problem – it was how to price the activity and  how to distribute the revenue generated. The Reference Cost Committee and Budget Allocation Committee were the problem.

<Bob> OK. What was the problem?

<Leslie> Well the estimates for the new operational budgets were basically the current budgets multiplied by the ratio of the future planned and historical actual activity. The rationale was that the major costs are people and consumables so the running costs should scale linearly with activity. They said the price should stay as it is now because the quality of the output is the same.

<Bob> OK. That does sound like a reasonable perspective. The variable costs will track with the activity if nothing else changes. Was it apportioning the overhead costs as part of the Reference Costing that was the problem?

<Leslie> No actually. We have not had that conversation yet. The problem was more fundamental. The problem is that the current budgets are wrong.

<Bob> Ah! That statement might come across as a bit of a challenge to the Finance Department. What was their reaction?

<Leslie> To para-phrase it was “We are just breaking even in the current financial year so the current budget must be correct. Please do not dabble in things that you clearly do not understand.”

<Bob> OK. You can see their point. How did you reply?

<Leslie> I tried to explain the concepts of the Cost-Of-The-Queue and how that cost was incurred by one part of the system with one budget but that the queue was created by a different part of the system with a different budget. I tried to explain that just because the budgets were 100% utilised does not mean that the budgets were optimal.

<Bob> How was that explanation received?

<Leslie> They did not seem to understand what I was getting at and kept saying “Inventory is an asset on the balance sheet. If profit is zero we must have planned our budgets perfectly. We cannot shift money between budgets within year if the budgets are already perfect. Any variation will average out. We have to stick to the financial plan and projections for the year. It works. The problem is not Finance – the problem is you.

<Bob> OK. Have you described the Seventh Flow and put it in context?

<Leslie> Arrrgh! No! Of course! That is how I should have approached it. Budgets are Cash-Inventories and what we need is Cash-Flow to where and when it is needed and in just the right amount according to the Principle of Parsimonious Pull. Thank you. I knew you would ask the crunch question. That has given me a fresh perspective on it. I will have another go.

<Bob> Let know how you get on. I am curious to hear the next instalment of the story.

<Leslie> Will do. Bye for now.

Drrrrrrrr

construction_blueprint_meeting_150_wht_10887Creating a productive and stable system design requires considering Seven Flows at the same time. The Seventh Flow is cash flow.

Cash is like energy – it is only doing useful work when it is flowing.

Energy is often described as two forms – potential energy and and kinetic energy.  The ‘doing’ happens when one form is being converted from potential to kinetic. Cash in the budget is like potential energy – sitting there ready to do some business.  Cash flow is like kinetic energy – it is the business.

The most versatile form of energy that we use is electrical energy. It is versatile because it can easily be converted into other forms – e.g. heat, light and movement. Since the late 1800’s our whole society has become highly dependent on electrical energy.  But electrical energy is tricky to store and even now our battery technology is pretty feeble. So, if we want to store energy we use a different form – chemical energy.  Gas, oil and coal – the fossil fuels – are all ancient stores of chemical energy that were originally derived from sunlight captured by vast carboniferous forests over millions of years. These carbon-rich fossil fuels are convenient to store near where they are needed, and when they are needed. But fossil fuels have a number of drawbacks: One is that they release their stored carbon when they are “burned”.  Another is that they are not renewable.  So, in the future we will need to develop better ways to capture, transport, use and store the energy from the Sun that will flow in glorious abundance for millions of years to come.

Plants discovered millions of years ago how to do this sunlight-to-chemical energy conversion and that biological legacy is built into every cell in every plant on the planet. Animals just do the reverse trick – they convert chemical-to-electrical. Every cell in every animal on the planet is a microscopic electrical generator that “burns” chemical fuel – carbohydrate. The other products are carbon dioxide and water. Plants use sunlight to recycle and store the carbon dioxide. It is a resilient and sustainable design.

plant_growing_anim_150_wht_9902Plants seemingly have it easy – the sunlight comes to them – they just sunbathe all day!  The animals have to work a bit harder – they have to move about gathering their chemical fuel. Some animals just feed on plants, others feed on other animals, and we do a bit of both. This food-gathering is a more complicated affair – and it creates a problem. Animals need a constant supply of energy – so they have to carry a store of chemical fuel around with them. That store is heavy so it needs energy to move it about.  Herbivors can be bigger and less intelligent because their food does not run away.  Carnivors need to be more agile; both physically and mentally. A balance is required. A big enough fuel store but not too big.  So, some animals have evolved additional strategies. Animals have become very good at not wasting energy – because the more that is wasted the more food that is needed and the greater the risk of getting eaten or getting too weak to catch the next meal.

To illustrate how amazing animals are at energy conservation we just need to look at an animal structure like the heart. The heart is there to pump blood around. Blood carries chemical nutrients and waste from one “department” of the body to another – just like ships, rail, roads and planes carry stuff around the world.

cardiogram_heart_working_150_wht_5747Blood is a sticky, viscous fluid that requires considerable energy to pump around the body and, because it is pumped continuously by the heart, even a small improvement in the energy efficiency of the circulation design has a big long-term cumulative effect. The flow of blood to any part of the body must match the requirements of that part.  If the blood flow to your brain slows down for even few seconds the brain cannot work properly and you lose consciousness – it is called “fainting”.

If the flow of blood to the brain is stopped for just a few minutes then the brain cells actually die. That is called a “stroke”. Our brains use a lot of electrical energy to do their job and our brain cells do not have big stores of fuel – so they need constant re-supply. And our brains are electrically active all the time – even when we are sleeping.

Other parts of the body are similar. Muscles for instance. The difference is that the supply of blood that muscles need is very variable – it is low when resting and goes up with exercise. It has been estimated that the change in blood flow for a muscle can be 30 fold!  That variation creates a design problem for the body because we need to maintain the blood flow to brain at all times but we only want blood to be flowing to the muscles in just the amount that they need, where they need it and when they need it. And we want to minimise the energy required to pump the blood at all times. How then is the total and differential allocation of blood flow decided and controlled?  It is certainly not a conscious process.

stick_figure_turning_valve_150_wht_8583The answer is that the brain and the muscles control their own flow. It is called autoregulation.  They open the tap when needed and just as importantly they close the tap when not needed. It is called the Principle of Parsimonious Pull. The brain directs which muscles are active but it does not direct the blood supply that they need. They are left to do that themselves.

So, if we equate blood-flow and energy-flow to cash-flow then we arrive at a surprising conclusion. The optimal design, the most energy and cash efficient, is where the separate parts of the system continuously determine the energy/cash flow required for them to operate effectively. They control the supply. They autoregulate their cash-flow. They pull only what they need when they need it.

BUT

For this to work then every part of the system needs to have a collaborative and parsimonious pull-design philosophy – one that wastes as little energy and cash as possible.  Minimum waste of energy requires careful design – it is called ergonomic design. Minimum waste of cash requires careful design – it is called economic design.

business_figures_accusing_anim_150_wht_9821Many socioeconomic systems are fragmented and have parts that behave in a “greedy” manner and that compete with each other for resources. It is a dog-eat-dog design. They would use whatever resources they can get for fear of being starved. Greed is Good. Collaboration is Weak.  In such a competitive situation a rigid-budget design is a requirement because it helps prevent one part selfishly and blindly destabilising the whole system for all. The problem is that this rigid financial design blocks change so it blocks improvement.

This means that greedy, competitive, selfish systems are unable to self-improve.

So, when the world changes too much and their survival depends on change then they risk becoming extinct just as the dinosaurs did.

red_arrow_down_crash_400_wht_2751Many will challenge this assertion by saying “But competition drives up performance“.  Actually, it is not as simple as that. Competition will weed out the weakest who “die” and remove themselves from the equation – apparently increasing the average. What actually drives improvement is customer choice. Organisations that are able to self-improve will create higher-quality and lower-cost products and in a globally-connected-economy the customers will vote with their wallets. The greedy and selfish competition lags behind.

So, to ensure survival in a global economy the Seventh Flow cannot be rigidly restricted by annually allocated departmental budgets. It is a dinosaur design.

And there is no difference between public and private organisations. The laws of cash-flow physics are universal.

How then is the cash flow controlled?

The “trick” is to design a monitoring and feedback component into the system design. This is called the Sixth Flow – and it must be designed so that just the right amount of cash is pulled to the just the right places and at just the right time and for just as long as needed to maximise the revenue.  The rest of the design – First Flow to Fifth Flow ensure the total amount of cash needed is a minimum.  All Seven Flows are needed.

So the essential ingredient for financial stability and survival is Sixth and Seventh Flow Design capability. That skill has another name – it is called Value Stream Accounting which is a component of complex adaptive systems engineering (CASE).

What? Never heard of Value Stream Accounting?

Maybe that is just another Error of Omission?

Curing Chronic Carveoutosis

pin_marker_lighting_up_150_wht_6683Last week the Ray Of Hope briefly illuminated a very common system design disease called carveoutosis.  This week the RoH will tarry a little longer to illuminate an example that reveals the value of diagnosing and treating this endemic process ailment.

Do you remember the days when we used to have to visit the Central Post Office in our lunch hour to access a quality-of-life-critical service that only a Central Post Office could provide – like getting a new road tax disc for our car?  On walking through the impressive Victorian entrances of these stalwart high street institutions our primary challenge was to decide which queue to join.

In front of each gleaming mahogony, brass and glass counter was a queue of waiting customers. Behind was the Post Office operative. We knew from experience that to be in-and-out before our lunch hour expired required deep understanding of the ways of people and processes – and a savvy selection.  Some queues were longer than others. Was that because there was a particularly slow operative behind that counter? Or was it because there was a particularly complex postal problem being processed? Or was it because the customers who had been waiting longer had identified that queue was fast flowing and had defected to it from their more torpid streams? We know that size is not a reliable indicator of speed or quality.figure_juggling_time_150_wht_4437

The social pressure is now mounting … we must choose … dithering is a sign of weakness … and swapping queues later is another abhorrent behaviour. So we employ our most trusted heuristic – we join the end of the shortest queue. Sometimes it is a good choice, sometimes not so good!  But intuitively it feels like the best option.

Of course  if we choose wisely and we succeed in leap-frogging our fellow customers then we can swagger (just a bit) on the way out. And if not we can scowl and mutter oaths at others who (by sheer luck) leap frog us. The Post Office Game is fertile soil for the Aint’ It Awful game which we play when we arrive back at work.

single_file_line_PA_150_wht_3113But those days are past and now we are more likely to encounter a single-queue when we are forced by necessity to embark on a midday shopping sortie. As we enter we see the path of the snake thoughtfully marked out with rope barriers or with shelves hopefully stacked with just-what-we-need bargains to stock up on as we drift past.  We are processed FIFO (first-in-first-out) which is fairer-for-all and avoids the challenge of the dreaded choice-of-queue. But the single-queue snake brings a new challenge: when we reach the head of the snake we must identify which operative has become available first – and quickly!

Because if we falter then we will incur the shame of the finger-wagging or the flashing red neon arrow that is easily visible to the whole snake; and a painful jab in the ribs from the impatient snaker behind us; and a chorus of tuts from the tail of the snake. So as we frantically scan left and right along the line of bullet-proof glass cells looking for clues of imminent availability we run the risk of developing acute vertigo or a painful repetitive-strain neck injury!

stick_figure_sitting_confused_150_wht_2587So is the single-queue design better?  Do we actually wait less time, the same time or more time? Do we pay a fair price for fair-for-all queue design? The answer is not intuitively obvious because when we are forced to join a lone and long queue it goes against our gut instinct. We feel the urge to push.

The short answer is “Yes”.  A single-queue feeding tasks to parallel-servers is actually a better design. And if we ask the Queue Theorists then they will dazzle us with complex equations that prove it is a better design – in theory.  But the scary-maths does not help us to understand how it is a better design. Most of us are not able to convert equations into experience; academic rhetoric into pragmatic reality. We need to see it with our own eyes to know it and understand it. Because we know that reality is messier than theory.    

And if it is a better design then just how much better is it?

To illustrate the potential advantage of a single-queue design we need to push the competing candiates to their performance limits and then measure the difference. We need a real example and some real data. We are Improvementologists! 

First we need to map our Post Office process – and that reveals that we have a single step process – just the counter. That is about as simple as a process gets. Our map also shows that we have a row of counters of which five are manned by fully trained Post Office service operatives.

stick_figure_run_clock_150_wht_7094Now we can measure our process and when we do that we find that we get an average of 30 customers per hour walking in the entrance and and average of 30 cusomers an hour walking out. Flow-out equals flow-in. Activity equals demand. And the average flow is one every 2 minutes. So far so good. We then observe our five operatives and we find that the average time from starting to serve one customer to starting to serve the next is 10 minutes. We know from our IS training that this is the cycle time. Good.

So we do a quick napkin calculation to check and that the numbers make sense: our system of five operatives working in parallel, each with an average cycle time of 10 minutes can collectively process a customer on average every 2 minutes – that is 30 per hour on average. So it appears we have just enough capacity to keep up with the flow of work  – we are at the limit of efficiency.  Good.

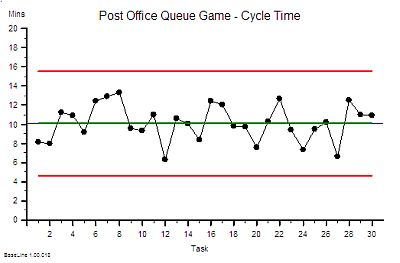
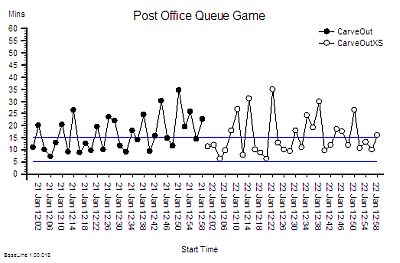
CarveOut_00We also notice that there is variation in the cycle time from customer to customer – so we plot our individual measurements asa time-series chart. There does not seem to be an obvious pattern – it looks random – and BaseLine says that it is statistically stable. Our chart tells us that a range of 5 to 15 minutes is a reasonable expectation to set.

We also observe that there is always a queue of waiting customers somewhere – and although the queues fluctuate in size and location they are always there.

 So there is always a wait for some customers. A variable wait; an unpredictable wait. And that is a concern for us because when the queues are too numerous and too long then we see customers get agitated, look at their watches, shrug their shoulders and leave – taking their custom and our income with them and no doubt telling all their friends of their poor experience. Long queues and long waits are bad for business.

And we do not want zero queues either because if there is no queue and our operatives run out of work then they become under-utilised and our system efficiency and productivity falls.  That means we are incurring a cost but not generating an income. No queues and idle resources are bad for business too.

And we do not want a mixture of quick queues and slow queues because that causes complaints and conflict.  A high-conflict customer complaint experience is bad for business too! 

What we want is a design that creates small and stable queues; ones that are just big enough to keep our operatives busy and our customers not waiting too long.

So which is the better design and how much better is it? Five-queues or a single-queue? Carve-out or no-carve-out?

To find the answer we decide to conduct a week-long series of experiments on our system and use real data to reveal the answer. We choose the time from a customer arriving to the same customer leaving as our measure of quality and performance – and we know that the best we can expect is somewhere between 5 and 15 minutes.  We know from our IS training that is called the Lead Time.

time_moving_fast_150_wht_10108On day #1 we arrange our Post Office with five queues – clearly roped out – one for each manned counter.  We know from our mapping and measuring that customers do not arrive in a steady stream and we fear that may confound our experiment so we arrange to admit only one of our loyal and willing customers every 2 minutes. We also advise our loyal and willing customers which queue they must join before they enter to avoid the customer choice challenges.  We decide which queue using a random number generator – we toss a dice until we get a number between 1 and 5.  We record the time the customer enters on a slip of paper and we ask the customer to give it to the operative and we instruct our service operatives to record the time they completed their work on the same slip and keep it for us to analyse later. We run the experiment for only 1 hour so that we have a sample of 30 slips and then we collect the slips,  calculate the difference between the arrival and departure times and plot them on a time-series chart in the order of arrival.

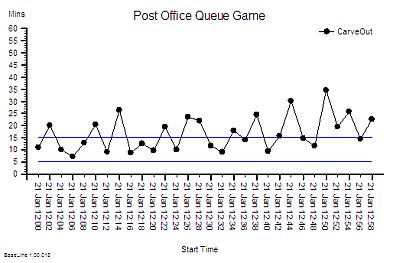
CarveOut_01This is what we found.  Given that the time at the counter is an average of 10 minutes then some of these lead times seem quite long. Some customers spend more time waiting than being served. And we sense that the performance is getting worse over time.

So for the next experiment we decide to open a sixth counter and to rope off a sixth queue. We expect that increasing capacity will reduce waiting time and we confidently expect the performance to improve.

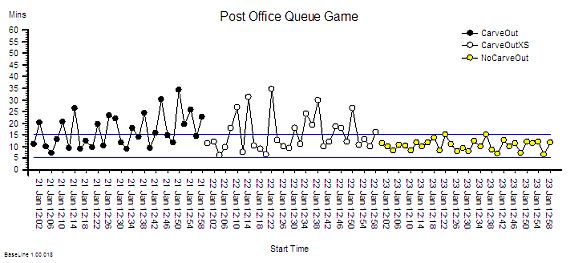
On day #2 we run our experiment again, letting customers in one every 2 minutes as before and this time we use all the numbers on the dice to decide which queue to direct each customer to.  At the end of the hour we collect the slips, calculate the lead times and plot the data – on the same chart.

CarveOut_02This is what we see.

It does not look much better and that is big surprise!

The wide variation from customer to customer looks about the same but with the Eye of Optimism we get a sense that the overall performance looks a bit more stable.

So we conclude that adding capacity (and cost) may make a small difference.

But then we remember that we still only served 30 customers – which means that our income stayed the same while our cost increased by 20%. That is definitely NOT good for business: it is not goiug to look good in a business case “possible marginally better quality and 20% increase in cost and therefore price!”

So on day #3 we change the layout. This time we go back to five counters but we re-arrange the ropes to create a single-queue so the customer at the front can be ‘pulled’ to the first available counter. Everything else stays the same – one customer arriving every 2 minutes, the dice, the slips of paper, everything.  At the end of the hour we collect the slips, do our sums and plot our chart.

CarveOut_03And this is what we get! The improvement is dramatic. Both the average and the variation has fallen – especially the variation. But surely this cannot be right. The improvement is too good to be true. We check our data again. Yes, our customers arrived and departed on average one every 2 minutes as before; and all our operatives did the work in an average of 10 minutes just as before. And we had the exactly the same capacity as we had on day #1. And we finished on time. It is correct. We are gobsmaked. It is like a magic wand has been waved over our process. We never would have predicted  that just moving the ropes around to could have such a big impact.  The Queue Theorists were correct after all!

But wait a minute! We are delivering a much better customer experience in terms of waiting time and at the same cost. So could we do even better with six counters open? What will happen if we keep the single-queue design and open the sixth desk?  Before it made little difference but now we doubt our ability to guess what will happen. Our intuition seems to keep tricking us. We are losing our confidence in predicting what the impact will be. We are in counter-intuitive land! We need to run the experiment for real.

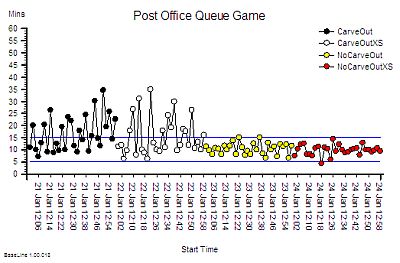
So on day #4 we keep the single-queue and we open six desks. We await the data eagerly.

CarveOut_04And this is what happened. Increasing the capacity by 20% has made virtually no difference – again. So we now have two pieces of evidence that say – adding extra capacity did not make a difference to waiting times. The variation looks a bit less though but it is marginal.

It was changing the Queue Design that made the difference! And that change cost nothing. Rien. Nada. Zippo!

That will look much better in our report but now we have to face the emotional discomfort of having to re-evaluate one of our deepest held assumptions.

Reality is telling us that we are delivering a better quality experience using exactly the same resources and it cost nothing to achieve. Higher quality did NOT cost more. In fact we can see that with a carve-out design when we added capacity we just increased the cost we did NOT improve quality. Wow!  That is a shock. Everything we have been led to believe seems to be flawed.

Our senior managers are not going to like this message at all! We will be challening their dogma directly. And they do not like that. Oh dear! 

Now we can see how much better a no-carveout single-queue pull-design can work; and now we can explain why single-queue designs  are used; and now we can show others our experiment and our data and if they do not believe us they can repeat the experiment themselves.  And we can see that it does not need a real Post Office – a pad of Post It® Notes, a few stopwatches and some willing helpers is all we need.

And even though we have seen it with our own eyes we still struggle to explain how the single-queue design works better. What actually happens? And we still have that niggling feeling that the performance on day #1 was unstable.  We need to do some more exploring.

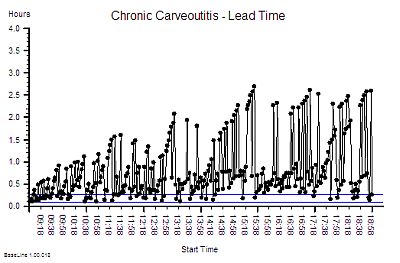
So we run the day#1 experiment again – the five queues – but this time we run it for a whole day, not just an hour.

CarveOut_06

Ah ha!   Our hunch was right.  It is an unstable design. Over time the variation gets bigger and bigger.

But how can that happen?

Then we remember. We told the customers that they could not choose the shortest queue or change queue after they had joined it.  In effect we said “do not look at the other queues“.

And that happens all the time on our systems when we jealously hide performance data from each other! If we are seen to have a smaller queue we get given extra work by the management or told to slow down by the union rep!  

So what do we do now?  All we are doing is trying to improve the service and all we seem to be achieving is annoying more and more people.

What if we apply a maximum waiting time target, say of 1 hour, and allow customers to jump to the front of their queue if they are at risk if breaching the target? That will smooth out spikes and give everyone a fair chance. Customers will understand. It is intuitively obvious and common sense. But our intuition has tricked us before … 

So we run the experiment again and this time we tell our customers that if they wait 50 minutes then they can jump to the front of their queue. They appreciate this because they now have a upper limit on the time they will wait.  

CarveOut_07And this is what we observe. It looks better than before, at least initially, and then it goes pear-shaped.

All we have done with our ‘carve-out and-expedite-the-long-waiters’ design is to defer the inevitable – the crunch. We cannot keep our promise. By the end everyone is pushing to the frontof the queue. It is a riot!  

And there is more. Look at the lead time for the last few customers – two hours. Not only have they waited a long time, but we have had to stay open for two hours longer. That is a BIG cost pessure in overtime payments.

So, whatever way we look at it: a single-queue design is better.  And no one loses out! The customers have a short and predictable waiting time; the operatives are kept occupied and go home on time; and the executives bask in the reflected glory of the excellent customer feedback.  It is a Three Wins® design.

Seeing is believing – and we now know that it is worth diagnosing and treating carveoutosis.

And the only thing left to do is to explain is how a single-queue design works better. It is not obvious is it? 

puzzle_lightbulb_build_PA_150_wht_4587And the best way to do that is to play the Post Office Game and see what actually happens. 

A big light-bulb moment awaits!


Update: My little Sylvanian friends have tried the Post Office Game and kindly sent me this video of the before  Sylvanian Post Office Before and the after Sylvanian Post Office After. They say they now know how the single-queue design works better. 


Look Out For The Time Trap!

There is a common system ailment which every Improvement Scientist needs to know how to manage.

In fact, it is probably the commonest.

The Symptoms: Disappointingly long waiting times and all resources running flat out.

The Diagnosis?  90%+ of managers say “It is obvious – lack of capacity!”.

The Treatment? 90%+ of managers say “It is obvious – more capacity!!”

Intuitively obvious maybe – but unfortunately these are incorrect answers. Which implies that 90%+ of managers do not understand how their systems work. That is a bit of a worry.  Lament not though – misunderstanding is a treatable symptom of an endemic system disease called agnosia (=not knowing).

The correct answer is “I do not yet have enough information to make a diagnosis“.

This answer is more helpful than it looks because it prompts four other questions:

Q1. “What other possible system diagnoses are there that could cause this pattern of symptoms?”
Q2. “What do I need to know to distinguish these system diagnoses?”
Q3. “How would I treat the different ones?”
Q4. “What is the risk of making the wrong system diagnosis and applying the wrong treatment?”


Before we start on this list we need to set out a few ground rules that will protect us from more intuitive errors (see last week).

The first Rule is this:

Rule #1: Data without context is meaningless.

For example 130  is a number – it is data. 130 what? 130 mmHg. Ah ha! The “mmHg” is the units – it means millimetres of mercury and it tells us this data is a pressure. But what, where, when,who, how and why? We need more context.

“The systolic blood pressure measured in the left arm of Joe Bloggs, a 52 year old male, using an Omron M2 oscillometric manometer on Saturday 20th October 2012 at 09:00 is 130 mmHg”.

The extra context makes the data much more informative. The data has become information.

To understand what the information actually means requires some prior knowledge. We need to know what “systolic” means and what an “oscillometric manometer” is and the relevance of the “52 year old male”.  This ability to extract meaning from information has two parts – the ability to recognise the language – the syntax; and the ability to understand the concepts that the words are just labels for; the semantics.

To use this deeper understanding to make a wise decision to do something (or not) requires something else. Exploring that would  distract us from our current purpose. The point is made.

Rule #1: Data without context is meaningless.

In fact it is worse than meaningless – it is dangerous. And it is dangerous because when the context is missing we rarely stop and ask for it – we rush ahead and fill the context gaps with assumptions. We fill the context gaps with beliefs, prejudices, gossip, intuitive leaps, and sometimes even plain guesses.

This is dangerous – because the same data in a different context may have a completely different meaning.

To illustrate.  If we change one word in the context – if we change “systolic” to “diastolic” then the whole meaning changes from one of likely normality that probably needs no action; to one of serious abnormality that definitely does.  If we missed that critical word out then we are in danger of assuming that the data is systolic blood pressure – because that is the most likely given the number.  And we run the risk of missing a common, potentially fatal and completely treatable disease called Stage 2 hypertension.

There is a second rule that we must always apply when using data from systems. It is this:

Rule #2: Plot time-series data as a chart – a system behaviour chart (SBC).

The reason for the second rule is because the first question we always ask about any system must be “Is our system stable?”

Q: What do we mean by the word “stable”? What is the concept that this word is a label for?

A: Stable means predictable-within-limits.

Q: What limits?

A: The limits of natural variation over time.

Q: What does that mean?

A: Let me show you.
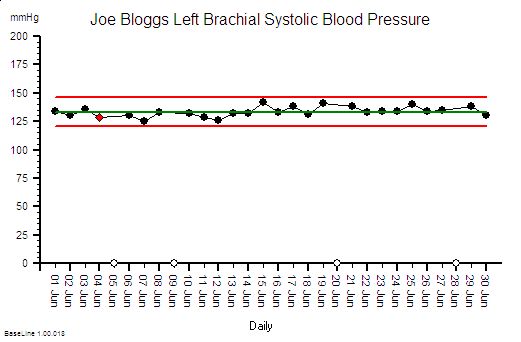
Joe Bloggs is disciplined. He measures his blood pressure almost every day and he plots the data on a chart together with some context .  The chart shows that his systolic blood pressure is stable. That does not mean that it is constant – it does vary from day to day. But over time a pattern emerges from which Joe Bloggs can see that, based on past behaviour, there is a range within which future behaviour is predicted to fall.  And Joe Bloggs has drawn these limits on his chart as two red lines and he has called them expectation lines. These are the limits of natural variation over time of his systolic blood pressure.

If one day he measured his blood pressure and it fell outside that expectation range  then he would say “I didn’t expect that!” and he could investigate further. Perhaps he made an error in the measurement? Perhaps something else has changed that could explain the unexpected result. Perhaps it is higher than expected because he is under a lot of emotional stress a work? Perhaps it is lower than expected because he is relaxing on holiday?

His chart does not tell him the cause – it just flags when to ask more “What might have caused that?” questions.

If you arrive at a hospital in an ambulance as an emergency then the first two questions the emergency care team will need to know the answer to are “How sick are you?” and “How stable are you?”. If you are sick and getting sicker then the first task is to stabilise you, and that process is called resuscitation.  There is no time to waste.


So how is all this relevant to the common pattern of symptoms from our sick system: disappointingly long waiting times and resources running flat out?

Using Rule#1 and Rule#2:  To start to establish the diagnosis we need to add the context to the data and then plot our waiting time information as a time series chart and ask the “Is our system stable?” question.
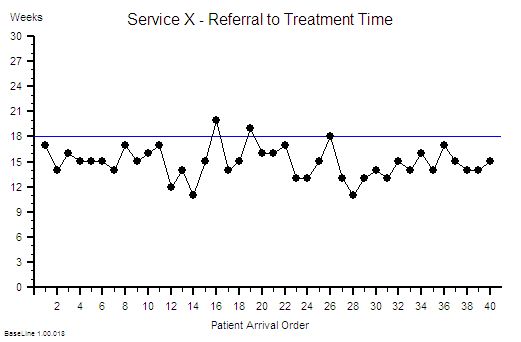
Suppose we do that and this is what we see. The context is that we are measuring the Referral-to-Treatment Time (RTT) for consecutive patients referred to a single service called X. We only know the actual RTT when the treatment happens and we want to be able to set the expectation for new patients when they are referred  – because we know that if patients know what to expect then they are less likely to be disappointed – so we plot our retrospective RTT information in the order of referral.  With the Mark I Eyeball Test (i.e. look at the chart) we form the subjective impression that our system is stable. It is delivering a predictable-within-limits RTT with an average of about 15 weeks and an expected range of about 10 to 20 weeks.

So far so good.

Unfortunately, the purchaser of our service has set a maximum limit for RTT of 18 weeks – a key performance indicator (KPI) target – and they have decided to “motivate” us by withholding payment for every patient that we do not deliver on time. We can now see from our chart that failures to meet the RTT target are expected, so to avoid the inevitable loss of income we have to come up with an improvement plan. Our jobs will depend on it!

Now we have a problem – because when we look at the resources that are delivering the service they are running flat out – 100% utilisation. They have no spare flow-capacity to do the extra work needed to reduce the waiting list. Efficiency drives and exhortation have got us this far but cannot take us any further. We conclude that our only option is “more capacity”. But we cannot afford it because we are operating very close to the edge. We are a not-for-profit organisation. The budgets are tight as a tick. Every penny is being spent. So spending more here will mean spending less somewhere else. And that will cause a big argument.

So the only obvious option left to us is to change the system – and the easiest thing to do is to monitor the waiting time closely on a patient-by-patient basis and if any patient starts to get close to the RTT Target then we bump them up the list so that they get priority. Obvious!

WARNING: We are now treating the symptoms before we have diagnosed the underlying disease!

In medicine that is a dangerous strategy.  Symptoms are often not-specific.  Different diseases can cause the same symptoms.  An early morning headache can be caused by a hangover after a long night on the town – it can also (much less commonly) be caused by a brain tumour. The risks are different and the treatment is different. Get that diagnosis wrong and disappointment will follow.  Do I need a hole in the head or will a paracetamol be enough?


Back to our list of questions.

What else can cause the same pattern of symptoms of a stable and disappointingly long waiting time and resources running at 100% utilisation?

There are several other process diseases that cause this symptom pattern and none of them are caused by lack of capacity.

Which is annoying because it challenges our assumption that this pattern is always caused by lack of capacity. Yes – that can sometimes be the cause – but not always.

But before we explore what these other system diseases are we need to understand why our current belief is so entrenched.

One reason is because we have learned, from experience, that if we throw flow-capacity at the problem then the waiting time will come down. When we do “waiting list initiatives” for example.  So if adding flow-capacity reduces the waiting time then the cause must be lack of capacity? Intuitively obvious.

Intuitively obvious it may be – but incorrect too.  We have been tricked again. This is flawed causal logic. It is called the illusion of causality.

To illustrate. If a patient complains of a headache and we give them paracetamol then the headache will usually get better.  That does not mean that the cause of headaches is a paracetamol deficiency.  The headache could be caused by lots of things and the response to treatment does not reliably tell us which possible cause is the actual cause. And by suppressing the symptoms we run the risk of missing the actual diagnosis while at the same time deluding ourselves that we are doing a good job.

If a system complains of  long waiting times and we add flow-capacity then the long waiting time will usually get better. That does not mean that the cause of long waiting time is lack of flow-capacity.  The long waiting time could be caused by lots of things. The response to treatment does not reliably tell us which possible cause is the actual cause – so by suppressing the symptoms we run the risk of missing the diagnosis while at the same time deluding ourselves that we are doing a good job.

The similarity is not a co-incidence. All systems behave in similar ways. Similar counter-intuitive ways.


So what other system diseases can cause a stable and disappointingly long waiting time and high resource utilisation?

The commonest system disease that is associated with these symptoms is a time trap – and they have nothing to do with capacity or flow.

They are part of the operational policy design of the system. And we actually design time traps into our systems deliberately! Oops!

We create a time trap when we deliberately delay doing something that we could do immediately – perhaps to give the impression that we are very busy or even overworked!  We create a time trap whenever we deferring until later something we could do today.

If the task does not seem important or urgent for us then it is a candidate for delaying with a time trap.

Unfortunately it may be very important and urgent for someone else – and a delay could be expensive for them.

Creating time traps gives us a sense of power – and it is for that reason they are much loved by bureaucrats.

To illustrate how time traps cause these symptoms consider the following scenario:

Suppose I have just enough resource-capacity to keep up with demand and flow is smooth and fault-free.  My resources are 100% utilised;  the flow-in equals the flow-out; and my waiting time is stable.  If I then add a time trap to my design then the waiting time will increase but over the long term nothing else will change: the flow-in,  the flow-out,  the resource-capacity, the cost and the utilisation of the resources will all remain stable.  I have increased waiting time without adding or removing capacity. So lack of resource-capacity is not always the cause of a longer waiting time.

This new insight creates a new problem; a BIG problem.

Suppose we are measuring flow-in (demand) and flow-out (activity) and time from-start-to-finish (lead time) and the resource usage (utilisation) and we are obeying Rule#1 and Rule#2 and plotting our data with its context as system behaviour charts.  If we have a time trap in our system then none of these charts will tell us that a time-trap is the cause of a longer-than-necessary lead time.

Aw Shucks!

And that is the primary reason why most systems are infested with time traps. The commonly reported performance metrics we use do not tell us that they are there.  We cannot improve what we cannot see.

Well actually the system behaviour charts do hold the clues we need – but we need to understand how systems work in order to know how to use the charts to make the time trap diagnosis.

Q: Why bother though?

A: Simple. It costs nothing to remove a time trap.  We just design it out of the process. Our flow-in will stay the same; our flow-out will stay the same; the capacity we need will stay the same; the cost will stay the same; the revenue will stay the same but the lead-time will fall.

Q: So how does that help me reduce my costs? That is what I’m being nailed to the floor with as well!

A: If a second process requires the output of the process that has a hidden time trap then the cost of the queue in the second process is the indirect cost of the time trap.  This is why time traps are such a fertile cause of excess cost – because they are hidden and because their impact is felt in a different part of the system – and usually in a different budget.

To illustrate. Suppose that 60 patients per day are discharged from our hospital and each one requires a prescription of to-take-out (TTO) medications to be completed before they can leave.  Suppose that there is a time trap in this drug dispensing and delivery process. The time trap is a policy where a porter is scheduled to collect and distribute all the prescriptions at 5 pm. The porter is busy for the whole day and this policy ensures that all the prescriptions for the day are ready before the porter arrives at 5 pm.  Suppose we get the event data from our electronic prescribing system (EPS) and we plot it as a system behaviour chart and it shows most of the sixty prescriptions are generated over a four hour period between 11 am and 3 pm. These prescriptions are delivered on paper (by our busy porter) and the pharmacy guarantees to complete each one within two hours of receipt although most take less than 30 minutes to complete. What is the cost of this one-delivery-per-day-porter-policy time trap? Suppose our hospital has 500 beds and the total annual expense is £182 million – that is £0.5 million per day.  So sixty patients are waiting for between 2 and 5 hours longer than necessary, because of the porter-policy-time-trap, and this adds up to about 5 bed-days per day – that is the cost of 5 beds – 1% of the total cost – about £1.8 million.  So the time trap is, indirectly, costing us the equivalent of £1.8 million per annum.  It would be much more cost-effective for the system to have a dedicated porter working from 12 am to 5 pm doing nothing else but delivering dispensed TTOs as soon as they are ready!  And assuming that there are no other time traps in the decision-to-discharge process;  such as the time trap created by batching all the TTO prescriptions to the end of the morning ward round; and the time trap created by the batch of delivered TTOs waiting for the nurses to distribute them to the queue of waiting patients!


Q: So how do we nail the diagnosis of a time trap and how do we differentiate it from a Batch or a Bottleneck or Carveout?

A: To learn how to do that will require a bit more explanation of the physics of processes.

And anyway if I just told you the answer you would know how but might not understand why it is the answer. Knowledge and understanding are not the same thing. Wise decisions do not follow from just knowledge – they require understanding. Especially when trying to make wise decisions in unfamiliar scenarios.

It is said that if we are shown we will understand 10%; if we can do we will understand 50%; and if we are able to teach then we will understand 90%.

So instead of showing how instead I will offer a hint. The first step of the path to knowing how and understanding why is in the following essay:

A Study of the Relative Value of Different Time-series Charts for Proactive Process Monitoring. JOIS 2012;3:1-18

Click here to visit JOIS

Iconoclasts and Iconoblasts

The human body is an amazing self-repairing system. It does this by being able to detect damage and to repair just the damaged part while still continuing to function. One visible example of this is how it repairs a broken bone. The skeleton is the hard, jointed framework that protects and supports the soft bits. Some of the soft bits, the muscles, both stablise and move this framework of bones. Together they form the musculoskeletal system that gives us the power to move ourselves.  So when, by accident, we break a bone how do we repair the damage?  The secret is in the microscopic structure of the bone. Bone is not like concrete, solid and inert, it is a living tissue. Two of the microsopic cells that live in the bone are the osteoclasts and the osteoblasts (osteo- is Greek for “bone”; -clast is Greek for “break” and -blast is Greek for “germ” in the sense of something that grows).  Osteoclasts dissolve the old bone and osteoblasts deposit new bone – so when they work together they can create bone, remodel bone, and repair bone. It is humbling when we consider that millions of microscopic cells are able to coordinate this continuous, dynamic, adaptive, reparative behaviour with no central command-and-control system, no decision makers, no designers, no blue-prints, no project managers. How is this biological miracle achieved? We are not sure – but we know that there must be a process.

Organisations are systems that face a similar challenge. They have relatively rigid operational and cultural structures of roles, responsibilities, lines of accountability, rules, regulations, values, beliefs, attitudes and behaviours.  These formal and informal structures are the conceptual “bones” of the organisation – the structure that enables the organisation to function.  Organisations also need to grow and to develop – which means that their virtual bones need to be remodelled continuously. Occasionally organisations have accidents – and their bones break – and sometimes the breaks are deliberate: it is called “re-structuring”.

There are people within organisations that have the same role as the osteoblast in the body. These people are called iconoclasts and what they do is dissolve dogma. They break up the rigid rules and regulations that create the corporate equivalent of concrete – but they are selective. Iconoclasts are sensitive to stress and to strain and they only dissolve the cultural concrete where it is getting in the way of improvement. That is where dogma is blocking innovation.  Iconoclasts question the status quo, and at the same time explain how it is causing a problem, offer alternatives, and predict the benefits of the innovation. Iconoclasts are not skeptics or cynics – they prepare the ground for change – they are facilitators.

There is a second group people who we could call the iconoblasts. They are the ones who create the new rules, the new designs, the new recipes, the new processes, the new operating standards – and they work alongside the iconoclasts to ensure the structure remains strong and stable as it evolves. The iconoblasts are called Improvement Scientists.

Improvement Scientists are like builders – they use the raw materials of ideas, experience, knowledge, understanding, creativity and enthusiasm and assemble them into new organisational structures.  In doing so they fully accept that one day these structures will in turn be dismantled and rebuilt. That is the way of improvement.  The dogma is relative and temporary rather than absolute and permanent. And the faster the structures can be disassembled and reassembled the more agile the organisation becomes and the more able it is to survive change.

So how are the iconoclasts and iconoblasts coordinated? Can they also work effectively and efficiently without a command-and-control system? If millions if microscopic cells in our bones can achieve it then maybe the individuals within organisations can do it too. We just need to understand what makes an iconoclast and an iconoblast and effective partnership and an essential part of an organisation.

Productivity Improvement Science

Very often there is a requirement to improve the productivity of a process and operational managers are usually measured and rewarded for how well they do that. Their primary focus is neither safety nor quality – it is productivity – because that is their job.

For-profit organisations see improved productivity as a path to increased profit. Not-for-profit organisations see improved productivity as a path to being able to grow through re-investment of savings.  The goal may be different but the path is the same – productivity improvement.

First we need to define what we mean by productivity: it is the ratio of a system output to a system input. There are many input and output metrics to choose from and a convenient one to use is the ratio of revenue to expenses for a defined period of time.  Any change that increases this ratio represents an improvement in productivity on this purely financial dimension and we know that this financial data is measured. We just need to look at the bank statement.

There are two ways to approach productivity improvement: by considering the forces that help productivity and the forces that hinder it. This force-field metaphor was described by the psychologist Kurt Lewin (1890-1947) and has been developed and applied extensively and successfully in many organisations and many scenarios in the context of change management.

Improvement results from either strengthening helpers or weakening hinderers or both – and experience shows that it is often quicker and easier to focus attention on the hinderers because that leads to both more improvement and to less stress in the system. Usually it is just a matter of alignment. Two strong forces in opposition results in high stress and low motion; but in alignment creates low stress and high acceleration.

So what hinders productivity?

Well, anything that reduces or delays workflow will reduce or delay revenue and therefore hinder productivity. Anything that increases resource requirement will increase cost and therefore hinder productivity. So looking for something that causes both and either removing or realigning it will have a Win-Win impact on productivity!

A common factor that reduces and delays workflow is the design of the process – in particular a design that has a lot of sequential steps performed by different people in different departments. The handoffs between the steps are a rich source of time-traps and bottlenecks and these both delay and limit the flow.  A common factor that increases resource requirement is making mistakes because errors generate extra work – to detect and to correct.  And there is a link between fragmentation and errors: in a multi-step process there are more opportunities for errors – particularly at the handoffs between steps.

So the most useful way to improve the productivity of a process is to simplify it by combining several, small, separate steps into single large ones.

A good example of this can be found in healthcare – and specifically in the outpatient department.

Traditionally visits to outpatients are defined as “new” – which implies the first visit for a particular problem – and “review” which implies the second and subsequent visits.  The first phase is the diagnostic work and this often requires special tests or investigations to be performed (such as blood tests, imaging, etc) which are usually done by different departments using specialised equipment and skills. The design of departmental work schedules requires a patient to visit on a separate occasion to a different department for each test. Each of these separate visits incurs a delay and a risk of a number of errors – the commonest of which is a failure to attend for the test on the appointed day and time. Such did-not-attend or DNA rates are surprisingly high – and values of 10% are typical in the NHS.

The cumulative productivity hindering effect of this multi-visit diagnostic process design is large.  Suppose there are three steps: New-Test-Review and each step has a 10% DNA rate and a 4 week wait. The quickest that a patient could complete the process is 12 weeks and the chance of getting through right first time (the yield) is about 90% x 90% x 90% = 73% which implies that 27% extra resource is needed to correct the failures.  Most attempts to improve productivity focus on forcing down the DNA rate – usually with limited success. A more effective approach is to redesign process by combining the three New-Test-Review steps into one visit.  Exactly the same resources are needed to do the work as before but now the minimum time would be 4 weeks, the right-first-time yield would increase to 90% and the extra resources required to manage the two handoffs, the two queues, and the two sources of DNAs would be unnecessary.  The result is a significant improvement in productivity at no cost.  It is also an improvement in the quality of the patient experience but that is a unintended bonus.

So if the solution is that obvious and that beneficial then why are we not doing this everywhere? The answer is that we do in some areas – in particular where quality and urgency is important such as fast-track one-stop clinics for suspected cancer. However – we are not doing it as widely as we could and one reason for that is a hidden hinderer: the way that the productivity is estimated in the business case and measured in the the day-to-day business.

Typically process productivity is estimated using the calculated unit price of the product or service. The unit price is arrived at by adding up the unit costs of the steps and adding an allocation of the overhead costs (how overhead is allocated is subject to a lot of heated debate by accountants!). The unit price is then multiplied by expected activity to get expected revenue and divided by the total cost (or budget) to get the productivity measure.  This approach is widely taught and used and is certainly better than guessing but it has a number of drawbacks. Firstly, it does not take into account the effects of the handoffs and the queues between the steps and secondly it drives step-optimisation behaviour. A departmental operational manager who is responsible and accountable for one step in the process will focus their attention on driving down costs and pushing up utilisation of their step because that is what they are performance managed on. This in itself is not wrong – but it can become counter-productive when it is done in isolation and independently of the other steps in the process.  Unfortunately our traditional management accounting methods do not prevent this unintentional productivity hindering behaviour – and very often they actually promote it – literally!

This insight is not new – it has been recognised by some for a long time – so we might ask ourselves why this is still the case? This is a very good question that opens another “can of worms” which for the sake of brevity will be deferred to a later conversation.

So, when applying Improvement Science in the domain of financial productivity improvement then the design of both the process and of the productivity modelling-and-monitoring method may need addressing at the same time.  Unfortunately this does not seem to be common knowledge and this insight may explain why productivity improvements do not happen more often – especially in publically funded not-for-profit service organisations such as the NHS.

All Aboard for the Ride of Our Lives!

In 1825 the world changed when the Age of Rail was born with the opening of the Darlington-to-Stockton line and the demonstration that a self-powered mobile steam engine could pull more trucks of coal than a team of horses.

This launched the industrial revolution into a new phase by improving the capability to transport heavy loads over long distances more conveniently, reliably, quickly, and cheaply than could canals or roads.

Within 25 years the country was criss-crossed by thousands of miles of railway track and thousands more miles were rapidly spreading across the world. We take it for granted now but this almost overnight success was the result of over 100 years of painful innovation and improvement. Iron rail tracks had been in use for a long time – particularly in quarries and ports. Newcomen’s atmospheric steam engine had been pumping water out of mines since 1712; James Watt and Matthew Boulton had patented their improved separate condenser static steam engine in 1775; and Richard Trevethick had built a self-propelled high pressure steam engine called “Puffing Devil” in 1801. So why did it take so long for the idea to take off? The answer was quite simple – it needed the lure of big profits to attract the entrepreneurs who had the necessary influence and cash to make it happen at scale and pace.  The replacement of windmills and watermills by static steam engines had already allowed factories to be built anywhere – rather than limiting them to the tops of windy hills and the sides of fast flowing rivers. But it was not until the industrial revolution had achieved sufficient momentum that road and canal transport became a serious constraint to further growth of industry, wealth and the British Empire.

But not everyone was happy with the impact that mechanisation brought – the Luddites were the skilled craftsmen who opposed the use of mechanised looms that could be operated by lower-skilled and therefore cheaper labour.  They were crushed in 1812 by political forces more powerful than they were – and the term “luddite” is now used for anyone who blindly opposes change from a position self-protection.

Only 140 years later it was all over for the birthplace of the Rail Age – the steam locomotive was relegated to the museums when Dr Richard Beeching , the efficiency-focussed Technical Director of ICI, published his reports that led to the cost-improvement-programme (CIP) that reorganised the railways and led to the loss of 70,000 jobs, hundreds of small “unprofitable” stations and 1000’s of miles of track.  And the reason for the collapse of the railways was that roads had leap-frogged both canals and railways because the “internal combustion engine” proved a smaller, lighter, more powerful, cheaper and more flexible alternative to steam or horses.

It is of historical interest that Henry Ford developed the production line to mass produce automobiles at a price that a factory worker could afford – and Toyoda invented a self-stopping mechanised loom that improved productivity dramatically by preventing damaged cloth being produced if a thread broke by accident. The historical links come together because Toyoda sold the patents to his self-stopping loom to fund the creation of the Toyota Motor Company which used Henry Ford’s production-line design and integrated the Toyoda self-monitoring, stopping and continuous improvement philosophy.

It was not until twenty years after British Rail was created that Japan emerged as an industrial superpower by demonstrating that it had learned how to improve both quality and reduce cost much more effectively than the “complacent” Europe and America. The tables were turned and this time it was the West that had to learn – and quickly.  Unfortunately not quickly enough. Other developing countries seized the opportunity that mass mechanisation, customisation and a large, low-expectation, low-cost workforce offered. They now produce manufactured goods at prices that European and American companies cannot compete with. Made in Britain has become Made in China.

The lesson of history has been repeated many times – innovations are like seeds that germinate but do not disseminate until the context is just right – then they grow, flower, seed and spread – and are themselves eventually relegated to museums by the innovations that they spawned.

Improvement Science has been in existence for a long time in various forms, and it is now finding more favourable soil to grow as traditional reactive and incremental improvement methods run out of steam when confronted with complex system problems. Wicked problems such as a world population that is growing larger and older at the same time as our reserves of non-renewable natural resources are dwindling.

The promise that Improvement Science offers is the ability to avoid the boom-to-bust economic roller-coaster that devastates communities twice – on the rise and again on the fall. Improvement Science offers an approach that allows sensible and sustainable changes to be planned, implemented and then progressively improved.

So what do we want to do? Watch from the sidelines and hope, or leap aboard and help?

And remember what happened to the Luddites!

Steps, Streams, Silos and Swamps.

The late Steve Jobs created a world class company called Apple – which is now the largest and most successful technology company – eclipsing Microsoft.  The secret of the success of Apple is laid out in Steve Jobs biography – and can be stated in one word. Design.

Apple designs, develops and delivers great products and services  – ones that people want to own and to use.  That makes them cool. What is even more impressive is that Steve Jobs has done this in more than once and has reinvented more than one market: Apple Computers and the graphical personal computer;  Pixar and animated films; and Apple again with digital music, electronic publishing; and mobile phones.

The common themes are digital technology and end-to-end seamless integrated design of chips, devices, software, services and shops. Full vertical integration rather like Henry Ford’s verically integrated iron-ore to finished cars production line.  The Steve Jobs design paradigm is simplicity. It is much more difficult to design simplicity than to evolve complexity and his reputation was formidable. He was a uncompromising perfectionist who sacrificed feelings on the alter of design perfection. His view of the world was binary – it was either great or crap – meaning it was either moving towards perfection or away from it.

What Steve Jobs created was a design stream out of which must-have products and services flowed – and he did it by seeing all the steps as part of one system and aligned with one purpose.  He did not allow physical or psychological silos to form and he did this by challenging anything and everything.  Many could not work in this environment and left, many others thrived and delivered far beyond what they believed they could do.

Other companies were swamps. Toxic emotional waste swamps of silos, politics and turf wars.  Apple computers itself when through a phase when Steve Jobs was “ejected” and without its spiritual leader the company slipped downhill. He was enticed back and Apple was reborn and went on to create the iMac, iPod, iTunes, iPhone, iPad and now iCloud. Revolutioning the world of digital commnication.

The image above is a satellite view of a delta – a complex network of interconnected streams created by a river making its way to the sea through a swamp.  The structure of the delta is constantly changing and evolving so it is easy to get lost it in, to get caught in a dead-end, or stuck in the mud. Only travel by small boat is possible and that is often both ineffective and inefficient.

Many organistions are improvement science swamps. The stream of innovative ideas gets fragmented by the myriad of everchanging channels; caught in political dead-ends; and stuck in the mud of bureaucracy.  Only small, skillfully steered ideas will trickle  through – but this trickle is not enough to keep the swamp from silting up. Eventually the resistance to change reaches a critical level and the improvement stream is forced to change course – diverting the flow of change away from the swamp – and marooning the stick-in-the-muds to slowly sink and expire in the bureaucratic gloop that they spawned.

Steve Jobs’ legacy to us is a lesson. To create a system that continues to deliver and delight we need to start by learning how to design the steps, then to design the streams of steps to link seamlessly, and finally to design the system of streams to synergise as sophisticated simplicity.

Improvement cannot be left to chance in the blind hope that excellence will evolve spontaneously. Evolution is both ineffective and inefficient and is more likely to lead to dissipated and extravagant complexity than aligned and elegant simplicity.

Improvement is a science that sits at the cross-roads of humanity and technology.

Single Sell System

In the pursuit of improvement it must be remembered that the system must remain viable: better but dead is not the intended outcome.  Viability of socioeconomic systems implies that money is flowing to where it is needed, when it is needed and in the amounts that are needed.

Money is like energy – it only does worthwhile work when it is moving: so the design of more effective money-streams is a critical part of socioeconomic system improvement.

But this is not easy or obvious because the devil is in the detail and complexity grows quicklyand obscures the picture. This lack of clear picture creates the temptation to clean, analyse, simplify and conceptualise and very often leads to analysis-paralysis and then over-simplification.

There is a useful metaphor for this challenge.

Biological systems use energy rather than money and the process of improvement has a different name – it is called evolution. Each of us is an evolution experiment. The viability requirement is the same though – the success of the experiment is measured by our viability. Do our genes and memes survive after we have gone?

It is only in recent times that the mechanism of this biological system has become better understood. It was not until the 19th Century that we realised that complex organisms were made of reproducing cells; and later that there were rules that governed how inherited characteristics passed from generation to generation; and that the vehicle of transmission was a chemical code molecule called DNA that is present in every copy of every cell capable of reproduction.

We learned that our chemical blueprint is stored in the nucleus of every cell (the dark spots in the picture of cells) and this led to the concept that the nucleus worked like a “brain” that issues chemical orders to the cell in the form of a very similar molecule called RNA.  This cellular command-and-control model is unfortunately more a projection of the rhetoric of society than the reality of the situation. The nucleus is not a “brain” – it is a gonad. The “brain” of a cell is the surface membrane – the sensitive interface between outside and inside; where the “sensor” molecules in the outer cell membrane connect to “effector” molecules on the inside.  Cells think with their skin – and their behaviour is guided by their  internal content and external context. Nature and nurture working as a system.

Cells have evolved to collaborate. Rogue cells that become “mentally” unstable and that break away, start to divide, and spread in an uncollaborative and selfish fashion threaten the viability of the whole: they are called malignant. The threat of malignant behaviour to long term viability is so great that we have evolved sophisticated mechanisms to detect and correct malignant behaviour. The fact that cancer is still a problem is because our malignancy defense mechanisms are not 100% effective. 

This realisation of the importance of the cell has led to a focus of medical research on understand how individual cells “sense”, “think”, “act” and “communicate” and has led to great leaps in our understanding of how multi-celled systems called animals and plants work; how they can go awry; and what can be done to prevent and correct these cellular niggles.  We are even learning how to “fix” bits of the the chemical blueprint to correct our chemical software glitches. We are no where near being able to design a cell from scratch though. We simply do not understand enough about how it works.

In comparison, the “single-sell” in an economic system could be considered to be a step in a process – the point where the stream and the silo meet – where expenses are converted to revenue for example.  I will wantonly bend the rules of grammar and use the word “sell” to distinguish it visually from “cell”. So before trying to understand the complex emergent behaviour of a multi-selled economic system we first need to understand better one sell works. How does work flow and time flow and money flow combined at the single sell?

When we do so we learn that the “economic mechanism” of a single sell can be described completely because it is a manfestation of the Laws of Physics – just as the mechanism of the weather can be describe using a small number of equations that combine to describe the flow, pressure, density, temperature etc of the atmospheric gases.  Our simplest single-selled economic system is described by a set of equations – there are about twenty of them in fact.

So, trying to work out in our heads how even a single sell in an economic system will behave amounts to mentally managing twenty simultanous equations – which is a bit of a problem because we’re not very good at that mental maths trick. The best we can do is to learn the patterns in the interdependent behaviour of the outputs of the equations; to recognise what they imply; and then how to use that understanding to craft wiser decisions.

No wonder the design of a viable socioeconomic multi-selled system seems to be eluding even the brightest economic minds at the moment!  It is a complicated system which exhibits complex behaviour.  Is there a better approach?  Our vastly more complex biological counterparts called “organisms” seem to have discovered one. So what can we learn from them?

One lesson might be that is is a good design to detect and correct malignant behaviour early; the unilateral, selfish, uncollaborative behaviour that multiplies, spreads, and becomes painful, incurable then lethal.

First we need to raise awareness and recognition of it … only then can we challenge and contain its toxic legacy.   

Design-for-Productivity

One tangible output of process or system design exercise is a blueprint.

This is the set of Policies that define how the design is built and how it is operated so that it delivers the specified performance.

These are just like the blueprints for an architectural design, the latter being the tangible structure, the former being the intangible function.

A computer system has the same two interdependent components that must be co-designed at the same time: the hardware and the software.


The functional design of a system is manifest as the Seven Flows and one of these is Cash Flow, because if the cash does not flow to the right place at the right time in the right amount then the whole system can fail to meet its design requirement. That is one reason why we need accountants – to manage the money flow – so a critical component of the system design is the Budget Policy.

We employ accountants to police the Cash Flow Policies because that is what they are trained to do and that is what they are good at doing – they are the Guardians of the Cash.

Providing flow-capacity requires providing resource-capacity, which requires providing resource-time; and because resource-time-costs-money then the flow-capacity design is intimately linked to the budget design.

This raises some important questions:
Q: Who designs the budget policy?
Q: Is the budget design done as part of the system design?
Q: Are our accountants trained in system design?

The challenge for all organisations is to find ways to improve productivity, to provide more for the same in a not-for-profit organisation, or to deliver a healthy return on investment in the for-profit arena (and remember our pensions are dependent on our future collective productivity).

To achieve the maximum cash flow (i.e. revenue) at the minimum cash cost (i.e. expense) then both the flow scheduling policy and the resource capacity policy must be co-designed to deliver the maximum productivity performance.


If we have a single-step process it is relatively easy to estimate both the costs and the budget to generate the required activity and revenue; but how do we scale this up to the more realistic situation when the flow of work crosses many departments – each of which does different work and has different skills, resources and budgets?

Q: Does it matter that these departments and budgets are managed independently?
Q: If we optimise the performance of each department separately will we get the optimum overall system performance?

Our intuition suggests that to maximise the productivity of the whole system we need to maximise the productivity of the parts.  Yes – that is clearly necessary – but is it sufficient?


To answer this question we will consider a process where the stream flows though several separate steps – separate in the sense that that they have separate budgets – but not separate in that they are linked by the same flow.

The separate budgets are allocated from the total revenue generated by the outflow of the process. For the purposes of this exercise we will assume the goal is zero profit and we just need to calculate the price that needs to be charged the “customer” for us to break even.

The internal reports produced for each of our departments for each time period are:
1. Activity – the amount of work completed in the period.
2. Expenses – the cost of the resources made available in the period – the budget.
3. Utilisation – the ratio of the time spent using resources to the total time the resources were available.

We know that the theoretical maximum utilisation of resources is 100% and this can only be achieved when there is zero-variation. This is impossible in the real world but we will assume it is achievable for the purpose of this example.

There are three questions we need answers to:
Q1: What is the lowest price we can achieve and meet the required demand?
Q2: Will optimising each step independently step give us this lowest price?
Q3: How do we design our budgets to deliver maximum productivity?


To explore these questions let us play with a real example.

Let us assume we have a single stream of work that crosses six separate departments labelled A-F in that sequence. The department budgets have been allocated based on historical activity and utilisation and our required activity of 50 jobs per time period. We have already worked hard to remove all the errors, variation and “waste” within each department and we have achieved 100% observed utilisation of all our resources. We are very proud of our high effectiveness and our high efficiency.

Our current not-for-profit price is £202,000/50 = £4,040 and because our observed utilisation of resources at each step is 100% we conclude this is the most efficient design and that this is the lowest possible price.

Unfortunately our celebration is short-lived because the market for our product is growing bigger and more competitive and our market research department reports that to retain our market share we need to deliver 20% more activity at 80% of the current price!

A quick calculation shows that our productivity must increase by 50% (New Activity/New Price = 120%/80% = 150%) but as we already have a utilisation of 100% then this challenge looks hopelessly impossible.  To increase activity by 20% will require increasing flow-capacity by 20% which will imply a 20% increase in costs so a 20% increase in budget – just to maintain the current price.  If we no longer have customers who want to pay our current price then we are in trouble.

Fortunately our conclusion is incorrect – and it is incorrect because we are not using the data available to co-design the system such that cash flow and work flow are aligned.  And we do not do that because we have not learned how to design-for-productivity.  We are not even aware that this is possible.  It is, and it is called Value Stream Accounting.

The blacked out boxes in the table above hid the data that we need to do this – an we do not know what they are. Yet.

But if we apply the theory, techniques and tools of system design, and we use the data that is already available then we get this result …

 We can see that the total budget is less, the budget allocations are different, the activity is 20% up and the zero-profit price is 34% less – which is a 83% increase in productivity!

More than enough to stay in business.

Yet the observed resource utilisation is still 100%  and that is counter-intuitive and is a very surprising discovery for many. It is however the reality.

And it is important to be reminded that the work itself has not changed – the ONLY change here is the budget policy design – in other words the resource capacity available at each stage.  A zero-cost policy change.

The example answers our first two questions:
A1. We now have a price that meets our customers needs, offers worthwhile work, and we stay in business.
A2. We have disproved our assumption that 100% utilisation at each step implies maximum productivity.

Our third question “How to do it?” requires learning the tools, techniques and theory of System Engineering and Design.  It is not difficult and it is not intuitively obvious – if it were we would all be doing it.

Want to satisfy your curiosity?
Want to see how this was done?
Want to learn how to do it yourself?

You can do that here.


For more posts like this please vote here.
For more information please subscribe here.

What Is The Cost Of Reality?

It is often assumed that “high quality costs more” and there is certainly ample evidence to support this assertion: dinner in a high quality restaurant commands a high price. The usual justifications for the assumption are (a) quality ingredients and quality skills cost more to provide; and (b) if people want a high quality product or service that is in relatively short supply then it commands a higher price – the Law of Supply and Demand.  Together this creates a self-regulating system – it costs more to produce and so long as enough customers are prepared to pay the higher price the system works.  So what is the problem? The problem is that the model is incorrect. The assumption is incorrect.  Higher quality does not always cost more – it usually costs less. Convinced?  No. Of course not. To be convinced we need hard, rational evidence that disproves our assumption. OK. Here is the evidence.

Suppose we have a simple process that has been designed to deliver the Perfect Service – 100% quality, on time, first time and every time – 100% dependable and 100% predictable. We choose a Service for our example because the product is intangible and we cannot store it in a warehouse – so it must be produced as it is consumed.

To measure the Cost of Quality we first need to work out the minimum price we would need to charge to stay in business – the sum of all our costs divided by the number we produce: our Minimum Viable Price. When we examine our Perfect Service we find that it has three parts – Part 1 is the administrative work: receiving customers; scheduling the work; arranging for the necessary resources to be available; collecting the payment; having meetings; writing reports and so on. The list of expenses seems endless. It is the necessary work of management – but it is not what adds value for the customer. Part 3 is the work that actually adds the value – it is the part the customer wants – the Service that they are prepared to pay for. So what is Part 2 work? This is where our customers wait for their value – the queue. Each of the three parts will consume resources either directly or indirectly – each has a cost – and we want Part 3 to represent most of the cost; Part 2 the least and Part 1 somewhere in between. That feels realistic and reasonable. And in our Perfect Service there is no delay between the arrival of a customer and starting the value work; so there is  no queue; so no work in progress waiting to start, so the cost of Part 2 is zero.  

The second step is to work out the cost of our Perfect Service – and we could use algebra and equations to do that but we won’t because the language of abstract mathematics excludes too many people from the conversation – let us just pick some realistic numbers to play with and see what we discover. Let us assume Part 1 requires a total of 30 mins of work that uses resources which cost £12 per hour; and let us assume Part 3 requires 30 mins of work that uses resources which cost £60 per hour; and let us assume Part 2 uses resources that cost £6 per hour (if we were to need them). We can now work out the Minimum Viable Price for our Perfect Service:

Part 1 work: 30 mins @ £12 per hour = £6
Part 2 work:  = £0
Part 3 work: 30 mins at £60 per hour = £30
Total: £36 per customer.

Our Perfect Service has been designed to deliver at the rate of demand which is one job every 30 mins and this means that the Part 1 and Part 3 resources are working continuously at 100% utilisation. There is no waste, no waiting, and no wobble. This is our Perfect Service and £36 per job is our Minimum Viable Price.         

The third step is to tarnish our Perfect Service to make it more realistic – and then to do whatever is necessary to counter the necessary imperfections so that we still produce 100% quality. To the outside world the quality of the service has not changed but it is no longer perfect – they need to wait a bit longer, and they may need to pay a bit more. Quality costs remember!  The question is – how much longer and how much more? If we can work that out and compare it with our Minimim Viable Price we will get a measure of the Cost of Reality.

We know that variation is always present in real systems – so let the first Dose of Reality be the variation in the time it takes to do the value work. What effect does this have?  This apparently simple question is surprisingly difficult to answer in our heads – and we have chosen not to use “scarymatics” so let us run an empirical experiment and see what happens. We could do that with the real system, or we could do it on a model of the system.  As our Perfect Service is so simple we can use a model. There are lots of ways to do this simulation and the technique used in this example is called discrete event simulation (DES)  and I used a process simulation tool called CPS (www.SAASoft.com).

Let us see what happens when we add some random variation to the time it takes to do the Part 3 value work – the flow will not change, the average time will not change, we will just add some random noise – but not too much – something realistic like 10% say.

The chart shows the time from start to finish for each customer and to see the impact of adding the variation the first 48 customers are served by our Perfect Service and then we switch to the Realistic Service. See what happens – the time in the process increases then sort of stabilises. This means we must have created a queue (i.e. Part 2 work) and that will require space to store and capacity to clear. When we get the costs in we work out our new minimum viable price it comes out, in this case, to be £43.42 per task. That is an increase of over 20% and it gives us a measure of the Cost of the Variation. If we repeat the exercise many times we get a similar answer, not the same every time because the variation is random, but it is always an extra cost. It is never less that the perfect proce and it does not average out to zero. This may sound counter-intuitive until we understand the reason: when we add variation we need a bit of a queue to ensure there is always work for Part 3 to do; and that queue will form spontaneously when customers take longer than average. If there is no queue and a customer requires less than average time then the Part 3 resource will be idle for some of the time. That idle time cannot be stored and used later: time is not money.  So what happens is that a queue forms spontaneously, so long as there is space for it,  and it ensures there is always just enough work waiting to be done. It is a self-regulating system – the queue is called a buffer.

Let us see what happens when we take our Perfect Process and add a different form of variation – random errors. To prevent the error leaving the system and affecting our output quality we will repeat the work. If the errors are random and rare then the chance of getting it wrong twice for the same customer will be small so the rework will be a rough measure of the internal process quality. For a fair comparison let us use the same degree of variation as before – 10% of the Part 3 have an error and need to be reworked – which in our example means work going to the back of the queue.

Again, to see the effect of the change, the first 48 tasks are from the Perfect System and after that we introduce a 10% chance of a task failing the quality standard and needing to be reworked: in this example 5 tasks failed, which is the expected rate. The effect on the start to finish time is very different from before – the time for the reworked tasks are clearly longer as we would expect, but the time for the other tasks gets longer too. It implies that a Part 2 queue is building up and after each error we can see that the queue grows – and after a delay.  This is counter-intuitive. Why is this happening? It is because in our Perfect Service we had 100% utiliation – there was just enough capacity to do the work when it was done right-first-time, so if we make errors and we create extra demand and extra load, it will exceed our capacity; we have created a bottleneck and the queue will form and it will cointinue to grow as long as errors are made.  This queue needs space to store and capacity to clear. How much though? Well, in this example, when we add up all these extra costs we get a new minimum price of £62.81 – that is a massive 74% increase!  Wow! It looks like errors create much bigger problem for us than variation. There is another important learning point – random cycle-time variation is self-regulating and inherently stable; random errors are not self-regulating and they create inherently unstable processes.

Our empirical experiment has demonstrated three principles of process design for minimising the Cost of Reality:

1. Eliminate sources of errors by designing error-proofed right-first-time processes that prevent errors happening.
2. Ensure there is enough spare capacity at every stage to allow recovery from the inevitable random errors.
3. Ensure that all the steps can flow uninterrupted by allowing enough buffer space for the critical steps.

With these Three Principles of cost-effective design in mind we can now predict what will happen if we combine a not-for-profit process, with a rising demand, with a rising expectation, with a falling budget, and with an inspect-and-rework process design: we predict everyone will be unhappy. We will all be miserable because the only way to stay in budget is to cut the lower priority value work and reinvest the savings in the rising cost of checking and rework for the higher priority jobs. But we have a  problem – our activity will fall, so our revenue will fall, and despite the cost cutting the budget still doesn’t balance because of the increasing cost of inspection and rework – and we enter the death spiral of finanical decline.

The only way to avoid this fatal financial tailspin is to replace the inspection-and-rework habit with a right-first-time design; before it is too late. And to do that we need to learn how to design and deliver right-first-time processes.

Charts created using BaseLine

The Crime of Metric Abuse

We live in a world that is increasingly intolerant of errors – we want everything to be right all the time – and if it is not then someone must have erred with deliberate intent so they need to be named, blamed and shamed! We set safety standards and tough targets; we measure and check; and we expose and correct anyone who is non-conformant. We accept that is the price we must pay for a Perfect World … Yes? Unfortunately the answer is No. We are deluded. We are all habitual criminals. We are all guilty of committing a crime against humanity – the Crime of Metric Abuse. And we are blissfully ignorant of it so it comes as a big shock when we learn the reality of our unconscious complicity.

You might want to sit down for the next bit.

First we need to set the scene:
1. Sustained improvement requires actions that result in irreversible and beneficial changes to the structure and function of the system.
2. These actions require making wise decisions – effective decisions.
3. These actions require using resources well – efficient processes.
4. Making wise decisions requires that we use our system metrics correctly.
5. Understanding what correct use is means recognising incorrect use – abuse awareness.

When we commit the Crime of Metric Abuse, even unconsciously, we make poor decisions. If we act on those decisions we get an outcome that we do not intend and do not want – we make an error.  Unfortunately, more efficiency does not compensate for less effectiveness – if fact it makes it worse. Efficiency amplifies Effectiveness – “Doing the wrong thing right makes it wronger not righter” as Russell Ackoff succinctly puts it.  Paradoxically our inefficient and bureaucratic systems may be our only defence against our ineffective and potentially dangerous decision making – so before we strip out the bureaucracy and strive for efficiency we had better be sure we are making effective decisions and that means exposing and treating our nasty habit for Metric Abuse.

Metric Abuse manifests in many forms – and there are two that when combined create a particularly virulent addiction – Abuse of Ratios and Abuse of Targets. First let us talk about the Abuse of Ratios.

A ratio is one number divided by another – which sounds innocent enough – and ratios are very useful so what is the danger? The danger is that by combining two numbers to create one we throw away some information. This is not a good idea when making the best possible decision means squeezing every last drop of understanding our of our information. To unconsciously throw away useful information amounts to incompetence; to consciously throw away useful information is negligence because we could and should know better.

Here is a time-series chart of a process metric presented as a ratio. This is productivity – the ratio of an output to an input – and it shows that our productivity is stable over time.  We started OK and we finished OK and we congratulate ourselves for our good management – yes? Well, maybe and maybe not.  Suppose we are measuring the Quality of the output and the Cost of the input; then calculating our Value-For-Money productivity from the ratio; and then only share this derived metric. What if quality and cost are changing over time in the same direction and by the same rate? The productivity ratio will not change.


Suppose the raw data we used to calculate our ratio was as shown in the two charts of measured Ouput Quality and measured Input Cost  – we can see immediately that, although our ratio is telling us everything is stable, our system is actually changing over time – it is unstable and therefore it is unpredictable. Systems that are unstable have a nasty habit of finding barriers to further change and when they do they have a habit of crashing, suddenly, unpredictably and spectacularly. If you take your eyes of the white line when driving and drift off course you may suddenly discover a barrier – the crash barrier for example, or worse still an on-coming vehicle! The apparent stability indicated by a ratio is an illusion or rather a delusion. We delude ourselves that we are OK – in reality we may be on a collision course with catastrophe. 

But increasing quality is what we want surely? Yes – it is what we want – but at what cost? If we use the strategy of quality-by-inspection and add extra checking to detect errors and extra capacity to fix the errors we find then we will incur higher costs. This is the story that these Quality and Cost charts are showing.  To stay in business the extra cost must be passed on to our customers in the price we charge: and we have all been brainwashed from birth to expect to pay more for better quality. But what happens when the rising price hits our customers finanical constraint?  We are no longer able to afford the better quality so we settle for the lower quality but affordable alternative.  What happens then to the company that has invested in quality by inspection? It loses customers which means it loses revenue which is bad for its financial health – and to survive it starts cutting prices, cutting corners, cutting costs, cutting staff and eventually – cutting its own throat! The delusional productivity ratio has hidden the real problem until a sudden and unpredictable drop in revenue and profit provides a reality check – by which time it is too late. Of course if all our competitors are committing the same crime of metric abuse and suffering from the same delusion we may survive a bit longer in the toxic mediocrity swamp – but if a new competitor who is not deluded by ratios and who learns how to provide consistently higher quality at a consistently lower price – then we are in big trouble: our customers leave and our end is swift and without mercy. Competition cannot bring controlled improvement while the Abuse of Ratios remains rife and unchallenged.

Now let us talk about the second Metric Abuse, the Abuse of Targets.

The blue line on the Productivity chart is the Target Productivity. As leaders and managers we have bee brainwashed with the mantra that “you get what you measure” and with this belief we commit the crime of Target Abuse when we set an arbitrary target and use it to decide when to reward and when to punish. We compound our second crime when we connect our arbitrary target to our accounting clock and post periodic praise when we are above target and periodic pain when we are below. We magnify the crime if we have a quality-by-inspection strategy because we create an internal quality-cost tradeoff that generates conflict between our governance goal and our finance goal: the result is a festering and acrimonious stalemate. Our quality-by-inspection strategy paradoxically prevents improvement in productivity and we learn to accept the inevitable oscillation between good and bad and eventually may even convince ourselves that this is the best and the only way.  With this life-limiting-belief deeply embedded in our collective unconsciousness, the more enthusiastically this quality-by-inspection design is enforced the more fear, frustration and failures it generates – until trust is eroded to the point that when the system hits a problem – morale collapses, errors increase, checks are overwhelmed, rework capacity is swamped, quality slumps and costs escalate. Productivity nose-dives and both customers and staff jump into the lifeboats to avoid going down with the ship!  

The use of delusional ratios and arbitrary targets (DRATs) is a dangerous and addictive behaviour and should be made a criminal offense punishable by Law because it is both destructive and unnecessary.

With painful awareness of the problem a path to a solution starts to form:

1. Share the numerator, the denominator and the ratio data as time series charts.
2. Only put requirement specifications on the numerator and denominator charts.
3. Outlaw quality-by-inspection and replace with quality-by-design-and-improvement.  

Metric Abuse is a Crime. DRATs are a dangerous addiction. DRATs kill Motivation. DRATs Kill Organisations.

Charts created using BaseLine

Do You Have A Miserable Job?

If you feel miserable at work and do not know what to do then then take heart because you could be suffering from a treatable organisational disease called CRAP (cynically resistant arrogant pessimism).

To achieve a healthier work-life then it is useful to understand the root cause of CRAP and the rationale of how to diagnose and treat it.

Organisations have three interdependent dimensions of performance: value, time and money.  All organisations require both the people and the processes to be working in synergy to reliably deliver value-for-money over time.  To create a productive system it is necessary to understand the relationships between  value, money and time. Money is easier because it is tangible and durable; value is harder because it is intangible and transient. This means that the focus of attention is usually on the money – and it is often assumed that if the money is OK then the value must be OK too.  This assumption is incorrect.

Value and money are interdependent but have different “rates of change”  and can operate in different “directions”.  A common example is when a dip in financial performance triggers an urgent “drive” to improve the “bottom line”.  Reactive revenue generation and cost cutting results in a small, quick, and tangible improvement on the money dimension but at the same time sets off a large, slow, and intangible deterioration on the value dimension.  Money, time and  value are interdependent and the inevitable outcome is a later and larger deterioration in the money – as illustrated in the doodle. If only money is measured the deteriorating value is not detected, and by the time the money starts to falter the momentum of the falling value is so great that even heroic efforts to recover are futile. As the money starts to fall the value falls even further and even faster – the lose-lose-lose spiral of organisational failure is now underway.

People who demonstrate in their attitude and behaviour that they are miserable at work provide the cardinal sign of falling system value. A miserable, sceptical and cynical employee poisons the emotional atmosphere for everyone around them. Misery is both defective and infective.  The primary cause of a miserable job is the behaviour exhibited by people in positions of authority – and the more the focus is only on money the more misery their behaviour generates.

Fortunately there is an antidote; a way to break out of the vicious tail spin – measure both value and money, focus on improving value and observe the positive effect on the money.  The critical behaviour is to actively test the emotional temperature and to take action to keep it moving in a positive direction.  “The Three Signs of a Miserable Job” by Patrick Lencioni tells a story of how an experienced executive learns that the three things a successful managerial leader must do to achieve system health are:
1) ensure employees know their unique place, role and value in the whole system;
2) ensure employees can consciously connect their work with a worthwhile system goal; and
3) ensure employees can objectively measure how they are doing.

Miserable jobs are those where the people feel anonymous, where people feel their work is valueless, and where people feel that they get no feedback from their seniors, peers or juniors. And it does not matter if it is the cleaner or the chief executive – everyone needs a role, a goal and to know all their interdependencies.

We do not have to endure a Miserable Job – we all have the power to transform it into Worthwhile Work.

Deming’s “System of Profound Knowledge”

W. Edwards Deming (1900-1993) is sometimes referred to as the Father of Quality. He made such a significant contribution to Japan’s burgeoning post-war reputation for innovative high-quality products, and the rapid development of their economic power, that he is regarded as having made more of a difference than any other individual not of Japanese heritage.

Though best known as a statistician and economist, he was initially educated as an electrical engineer and mathematical physicist. To me however he was more of a social scientist – interested in the science of improvement and the creation of value for customers. A lifelong learner, in his later years (1) he became fascinated by epistemology – the processes by which knowledge is created – and this led him into wanting to know more about the psychology of human behaviour and its underlying motivations.

In his nineties he put his whole life of learning into one model – his System of Profound Knowledge (SoPK). What follows is my brief take on each of the four elements of the SoPK and how they fit together.

THE PSYCHOLOGY OF HUMAN BEHAVIOUR
Everyone is different, and we all SEE things differently. We then DO things based on how we see things – and we GET results – of some kind. Over time we shore up our own particular view of the world – some call this a “paradigm” – our own particular world view – multiple loops of DO-GET-SEE (2) are self-reinforcing and as our sense making becomes increasingly fixed we BEHAVE – BECOME – BELIEVE. The trouble is we each to some extent get divorced from reality, or at least how most others see it – in extreme cases we might even get classified by some people as “insane” – indeed the clinical definition of insanity is doing the same things whilst expecting different results.

THE ACQUISITION OF KNOWLEDGE
So when we DO things it would be helpful if we could do them as little experiments that test our sense of what works and what is real. Even better we might get others to help us interpret the results from the benefit of their particular world view/ paradigm. Did you study science at school? If so you might recognize that learning in this way by experimentation is the “scientific method” in action. Through these cycles of learning knowledge gets continually refined and builds. It is also where improvement comes from and how reality evolves. Deming referred to this as the PLAN-DO-STUDY-ACT Cycle (1) – personally i prefer the words in this adjacent diagram. For me the cycle is as much about good mental health as acquiring knowledge, because effective learning (3) keeps individuals and organizations connected to reality and in control of their lives.

UNDERSTANDING VARIATION
The origins of PDSA lie with Walter Shewhart (4) who in 1925 – invented it to help people in organizations methodically and continually inquire into what is happening. He observed that when workers or managers make changes in their working practices so that their processes run better, the results vary, and that this variation often fools them. So he invented a tool for collecting numbers in real time so that each process can be listened in to as a “system” – much like a doctor uses a stethoscope to collect data and interpret how their patient’s system is behaving, by asking what might be contributing to – actually causing – the system’s outcomes. Shewhart named the tool Statistical Process Control – three words, each of which for many people are an instant turn-off. This means they miss his critical insight that there are two distinct types of variation – noise and signal, and that whilst all systems contain noise, only some contain signals – which if present can be taken to be assignable causes of systemic behaviour. Indeed to make it more palatable the tool might better be referred to as a “system behaviour chart”. It is meant to be interpreted like a doctor or nurse interprets the vital sign graph on the end of a patient’s bed i.e. to decide what action if any to take and when. Here is an example that has been created in BaseLine© which is specifically designed to offer the agnostic direct access to the power of Shewhart’s thinking. (5).

THINKING SYSTEMICALLY
What is meant by the word “system”? It means all the parts connected and interrelated as a whole (3). It is often helpful to get representatives of the various stakeholder groups to map the system – with its parts, the flows and the connections – so they can see how different people make sense of say.. their family system, their work system, a particular process of interest.. indeed any system of any kind that feels important to them. The map shown here is one used that might be used generically by manufacturers to help them investigate the separate causal sources of systemic variation – from the Suppliers of Inputs received, to the Processes that convert those inputs into Outputs, which can then be received by Customers – all made possible by vital support processes. This map (1) was taught by Deming in 1950 to Japan’s leaders. When making sense of their own particular systemic context others may prefer a different kind of map, but why? How come others prefer to make sense of things in their own way? To answer this Peter Senge (3) in his own equivalent to the SoPK says you need 5 distinct disciplines: the ability to think systemically, to learn as a team, to create a shared vision, to understand how our mental models get ingrained, and lastly “personal mastery” … which takes me back to where I started.

Aware that he was at the end of his life of learning, Deming bequeathed his System of Profound Knowledge to us so that we might continue his work. Personally, I love the SoPK because it is so complete. It is hard however to keep such a model, complete and as a whole, continually in the front of our minds – such that everything we think and do can be viewed as a fractal of that elegant whole. Indeed as a system, the system of profound knowledge is seriously – even fatally – undermined if any single part is missing ..

• Without understanding the causes of human behaviour we have no empathy for other people’s worldviews, other value systems. Without empathy our ability to manage change is fundamentally impaired.

• Without being good at experimentation and turning our experience into Knowledge – the very essence of science – we threaten our very mental health.

• Without understanding variation we are all too easily deluded – ask any magician (6). We spin our own reality. In ignoring or falsely interpreting data we are even “wilfully blind” (7). Baseline© for example is designed to help people make more of their time-series data – a window onto the system that their data is representing – using its inherent variation to gain an enhanced sense of what’s actually happened, as well as what’s really happening, and what if things stay the same is most likely to happen.

• Without being able to see how things are connected – as a whole system – and seeing the uniqueness of our own particular context, moment to moment, we miss the importance of our maps – and those of others – for good sense-making. We therefore miss the sharing of our individual realities, and with it the potential to spot what really causes outcomes – which neatly takes us back to the need for empathy and for understanding the psychology of human behaviour.

For me the challenge is to be continually striving for that sense of the SoPK – as a complete whole – and by doing this to see how I might grow my influence in the world.

Julian Simcox

References

1. Deming W.E – The New Economics – 1993
2. Covey S.R. – The 7 habits of Highly Effective People – 1989
3. Senge P. M. – The Fifth Discipline: the art and practice of the learning organization – 1990
4. Wheeler D.J. & Poling S.R.– Building Continual Improvement – 1998
5. BaseLine© is available via www.threewinsacademy.co.uk.
6. Macknik S, et al – Sleights of Mind – What the neuroscience of magic reveals about our brains – 2011.
7. Heffernan M. – Wilfully Blind – 2011

Do Bosses need Hugs too?

The foundation on which Improvement Science is built is invisible – or rather intangible – and without this foundation the whole construction is unstable and unsustainable.  Rather like an iceberg – mostly under the surface with only a small part that is visible and measurable – and that small visible part is called Performance.

What is underneath?  To push our Performance through the surface so that it gets noticed we know we must synergise the People with the Processes but there is more to it than just that. The deepest part of the foundation, the part that provides the core strength and stability, is our Paradigm – our set of unconscious  beliefs, values, attitudes and habits that comprises our psycho-gyro-scope: our stabiliser. 

Our Paradigm creates inertia: the tendency to keep going in the same direction even when the winds of change have shifted permamantly and are blowing us off course.  Paradigms resist change – and for good reason – inertia is a useful thing when there are minor bumps on the journey and we need to avoid stalling at each one. Inertia becomes a less useful thing when we meet an immovable object such as a Law of Physics – because if we hit one of these then Reality will provide us with some painful feedback. Inertia is also less useful when we have stopped and have no momentum,  because it takes a bigger push for a longer time to get us moving again.

An elephant has a lot of inertia because it is big – and perhaps this is the reason why we refer to  attitudes and beliefs that represent resistance to change as Elephants in the Room.  The ringleader of a herd of organisational elephants is an elephant called Distrust which is the offspring an elephant called Discounting who in turn was born of an elephant called Disrespect.  We see this in organisationswhen we display and cultivate a disrepectful attitudes towards our peers, reports workers and our seniors. The old time-worn and cracked “us-versus-them” record.

So let us break into the cycle and push the Elephant called Distrust into spotlight – what is our alternative. Respect -> Acknowledgement -> Trust.   It doesn’t make any difference who you are: the most valuable form of respect is feedback:  Honest, Unbiassed and Genuine (HUG).  So if we regularly experience the Elephant called Distrust making a Toxic Swamp in our organisations and we feel discounted and disrespected then part of the reason may be that we are not giving ourselves enough HUGs. And that means the bosses too.

Is a Queue an Asset or a Liability?

Many believe that a queue is a good thing.

To a supplier a queue is tangible evidence that there is demand for their product or service and reassurance that their resources will not sit idle, waiting for work and consuming profit rather than creating it.  To a customer a queue is tangible evidence that the product or service is in demand and therefore must be worth having. They may have to wait but the wait will be worth it.  Both suppliers and customers unconsciously collude in the Great Deception and even give it a name – “The Law of Supply and Demand”. By doing so they unwittingly open the door for charlatans and tricksters who deliberately create and maintain queues to make themselves appear more worthy or efficient than they really are.

Even though we all know this intuitively we seem unable to do anything about it. “That is just the way it is” we say with a shrug of resignation. But it does not have to be so – there is a path out of this dead end.

Let us look at this problem from a different perspective. Is a product actually any better because we have waited to get it? No. A longer wait does not increase the quality of the product or service and may indeed impair it.  So, if  a queue does not increase quality does it reduce the cost?  The answer again is “No”. A queue always increases the cost and often in many ways.  Exactly how much the cost increases by depends on what is on the queue, where the queue is, and how long it is. This may sound counter-intitutive and didactic so I need to explain in a bit more detail the reason this statement is an inevitable consequence of the Laws of Physics.

Suppose the queue comprises perishable goods; goods that require constant maintenance; goods that command a fixed price when they leave the queue; goods that are required to be held in a container of limited capacity with fixed overhead costs (i.e. costs that are fixed irrespective of how full the container is).  Patients in a hospital or passengers on an aeroplane are typical examples because the patient/passenger is deprived of their ability to look after themselves; they are totally dependent on others for supplying all their basic needs; and they are perishable in the sense that a patient cannot wait forever for treatment and an aeroplane cannot fly around forever waiting to land. A queue of patients waiting to leave hospital or an aeroplane full of passsengers circling to land at an airport represents an expensive queue – the queue has a cost – and the bigger the queue is and the longer it persists the greater the cost.

So how does a queue form in the first place? The answer is: when the flow in exceeds the flow out. The instant that happens the queue starts to grow bigger.  When flow in is less than flow out the queue is getting smaller – but we cannot have a negative queue – so when the flow out exceeds the flow in AND the size of the queue reaches zero the system suddenly changes behaviour – the work dries up and the resources become idle.  This creates a different cost – the cost of idle resources consuming money but not producing revenue. So a queue/work costs and no queue/no work costs too.  The least cost situation is when the work arrives at exactly the same rate that it can be done: there is no waiting by anyone – no queue and no idle resources.  Note however that this does not imply that the work has to arrive at a constant rate – only that rate at which the work arrives matches the rate at which it is done – it is the difference between the two that should be zero at all times. And where we have several steps – the flow must be the same through all steps of the stream at all times.  Remember the second condition for minimum cost – the size of the queue must be zero as well – this is the zero inventory goal of the “perfect process”.

So, if any deviation from this perfect balance of flow creates some form of cost, why do we ever tolerate queues? The reason is that the perfect world above implies that it is possible to predict the flow in and the flow out with complete accuracy and reliabilty.  We all know from experience that this is impossible: there is always some degree of  natural variation which is unpredictable and which we often call “noise” or “chaos”. For that single reason the lowest cost (not zero cost) situation is when there is just enough breathing space for a queue to wax and wane – smoothing out the unpredictable variation between inflow and outflow. This healthy queue is called a buffer.

The less “noise” the less breathing space is needed and the closer you can get to zero queue cost.

So, given this logical explanation it might surprise you to learn that most of the flow variation we observe in real processes is neither natural nor unpredictable – we deliberately and persistently inject predictable flow variation into our processes.  This unnatural variation is created by own policies – for example, accumulating DIY jobs until there are enough to justify doing them.   The reason we do this is because we have been bamboozled into believing it is a good thing for the financial health of our system. We have been beguiled by the accountants – the Money Magicians.  Actually that is not precise enough – the accountants themselves  are the innocent messengers – the deception comes from the Accounting Policies.  The major niggle is one convention that has become ossified into Accounting Practice – the convention that a queue of work waiting to be finished or sold represents an asset – sort of frozen-for-now-cash that can be thawed out or “liquidated” when the product is sold.  This convention is not incorrect it is just incomplete because, as we have demonstrated, every queue incurs a cost.  In accountant-speak a cost is called a liability and unfortunately this queue-cost-liability is never included in the accounts and this makes a very, very, big difference to the outcome. To assess the financial health of an organisation at a point in time an accountant will use a balance sheet to subtract the liabilities from the assets and come up with a number that is called equity. If that number is zero or negative then the business is financially dead – the technical name is bankruptcy and no accountant likes to utter the B word.  Denial is not a reliable long term buisness strategy and if our Accounting Policies do not include the cost of the queue as a liability on the balance sheet then our finanical reports will be a distortion of reality and will present the business as healthier than it really is.  This is an Error of Omission and has grave negative consequences.  One of which is that it can create a sense of complacency, a blindness to the early warning signs of financial illness and reactive rather than proactive behaviour. The problem is compounded when a large and complex organisation is split into smaller, simpler mini-businesses that all suffer from the same financial blindspot. It becomes even more difficult to see the problem when everyone is making the same error of omission and when it is easier to blame someone else for the inevitable problems that ensue.

We all know from experience that prevention is better than cure and we also know that the future is not predictable with certainty: so in addition to prevention we need vigilence, prompt action, decisive action and appropriate action at the earliest detectable sign of a significant deterioration. Complacency is not a reliable long term survival strategy.

So what is the way forward? Dispense with the accountants? NO! You need them – they are very good at what they do – it is just that what they are doing is not exactly what we all need them to be doing – and that is because the Accounting Policies that they diligently enforce are incomplete.  A safer strategy would be for us to set our accountants the task of learning how to count the cost of a queue and to include that in our internal finanical reporting. The quality of business decisions based on financial data will improve and that is good for everyone – the business, the customers and the reputation of the Accounting Profession. Win-win-win.

The question was “Is a queue and asset or a liability?” The answer is “Both”.

More than the Sum or Less?

It is often assumed that if you combine world-class individuals into a team you will get a world-class team.

Meredith Belbin showed 30 years ago that you do not and it was a big shock at the time!

So, if world class individuals are not enough, what are the necessary and sufficient conditions for a world-class team?

The late Russell Ackoff described it perfectly – he said that if you take the best parts of all the available cars and put them together you do not get the best car – you do not even get a car. The parts are necessary but they are not sufficient – how the parts connect to each other and how they influence each other is more important.  These interdependencies are part of the system – and to understand a system requires understanding both the parts and their relationships.

A car is a mechanical system; the human body is a biological system; and a team is a social system. So to create a high performance, healthy, world class team requires that both the individuals and their relationships with each other are aligned and resonant.

When the parts are aligned we get more than the sum of the parts; and when they are not we get less.

If we were to define intelligence quotient as “an ability to understand and solve novel problems” then the capability of a team to solve novel problems is the collective intelligence.  Experience suggests that a group can appear to be less intelligent than any of the individual members.  The problem here is with the relationships between the parts – and the term that is often applied is “dysfunctional”.

The root cause is almost always distrustful attitudes which lead from disrespectful prejudices and that lead to discounting behaviour.  We learn these prejudices, attitudes and behaviours from each other and we reinforce them with years of practice.  But if they are learned then they can be un-learned. It is simple in theory, and it is possible in practice, but it is not easy.

So if we want to (dis)solve complex, novel problems thenwe need world-class problem solving teams; and to transform our 3rd class dysfunctional teams we must first learn to challenge respectfully our disrespectful behaviour.

The elephant is in the room!

How Do We Measure the Cost of Waste?

There is a saying in Yorkshire “Where there’s muck there’s brass” which means that muck or waste is expensive to create and to clean up. 

Improvement science provides the theory, techniques and tools to reduce the cost of waste and to re-invest the savings in further improvement.  But how much does waste cost us? How much can we expect to release to re-invest?  The answer is deceptively simple to work out and decidedly alarming when we do.

We start with the conventional measurement of cost – the expenses – be they materials, direct labour, indirect labour, whatever. We just add up all the costs for a period of time to give the total spend – let us call that the stage cost. The next step requires some new thinking – it requires looking from the perspective of the job or customer – and following the path backwards from the intended outcome, recording what was done, how much resource-time and material it required and how much that required work actually cost.  This is what one satisfied customer is prepared to pay for; so let us call this the required stream cost. We now just multiply the output or activity for the period of time by the required stream cost and we will call that the total stream cost. We now just compare the stage cost and the stream cost – the difference is the cost of waste – the cost of all the resources consumed that did not contribute to the intended outcome. The difference is usually large; the stream cost is typically only 20%-50% of the stage cost!

This may sound unbelieveable but it is true – and the only way to prove it to go and observe the process and do the calculation – just looking at our conventional finanical reports will not give us the answer.  Once we do this simple experiment we will see the opportunity that Improvement Science offers – to reduce the cost of waste in a planned and predictable manner.

But if we are not prepared to challenge our assumptions by testing them against reality then we will deny ourselves that opportunity. The choice is ours.

One of the commonest assumptions we make is called the Flaw of Averages: the assumption that it is always valid to use averages when developing business cases. This assumption is incorrect.  But it is not immediately obvious why it is incorrect and the explanation sounds counter-intuitive. So, one way to illustrate is with a real example and here is one that has been created using a process simulation tool – virtual reality:

Delusional Ratios and Arbitrary Targets

This week a friend of mine shared an interesting story.

They were told that their recent performance data showed that performance was improving. “That sounds good” they thought as they started to look at the data which was presented as a table of numbers, one number per time period, as a percentage ratio, and colour coded red, amber or green. The last number in the sequence was green; the previous ones were either red or amber. “See! Our performance has improved and is now acceptable“.

But it did not feel quite right to my friend who did not want to dampen the celebration without good reason, so enquired further “What is the ratio measuring exactly?” “H’mm, let me check, the number of failures divided by the number of customer requests.”  “And what does the red, amber and green signify?” “Oh that’s easy, whether we are above, near or below our target.” “And how was the target set and by whom?” “Um, I don’t know how it was set, we were just told what the target is and the consequences if we don’t meet it.” “And what are the consequences?” No answer – just a finger-across-the-throat gesture.  “Can I see the raw data used to calculate this ratio?” “Eh? I think so, but no one has ever asked us for that before.

My friend could now see the origin of his niggle of doubt.  The raw data showed that the number of customer requests was falling progressively over time while the number of successful requests was not changing.  They were calculating failures from the difference between demand and activity and then dividing the result by the demand to give a percentage that was intended to show their performance. And then setting an arbitrary target for acceptability.

The raw data told a very different story – their customers were going elsewhere – which meant their future income was progressively walking away.  They were blind to it; their ratio was deluding them.

And by setting an arbitrary target for this “delusional ratio” implied that so long as they were “in the green” they didn’t need to do anything, they could sit back and relax. They could not see the nasty surprise coming.

This story led me to wonder how many organsiations get into trouble by following delusional ratios linked to arbitrary targets? How many never see the storm coming until it is too late to avoid it?  Where do these delusional ratios and arbitrary targets come from?  Do they have a valid and useful purpose? And if so, how do we know when to use a ratio or a target and when not to?

It also gave me a new acronym – D.R.A.T. – which seems rather appropriate.

Improvement costs more doesn’t it?

We all know the phrase “you get what you pay for” and we all know from experience that higher quality goods and services cost more. So, it follows that if we improve the quality of our product or service then we are always going to have to charge our customers more for it. But is that always the case?

If we add extra value to the product then it is likely that it will cost us more to do that and we may have to pass that cost on; but improvement often comes from removing something that was preventing a higher quality output.

When we remove something our costs are likely to go down and this reduction in cost can be passed on to the customer. Unfortunately the idea that lower costs mean lower quality is also deeply engrained into our thinking – so if a supplier offers what appears to be higher quality at a lower price we get suspicious. There must be a catch or a trick.

So, to avoid disappointing your customers when you make an improvement by removing an impediment to quality – just increase the price a bit.  That way your costs go down, the price goes up, the customers expectation is met and everyone is happy; your customers and especially your accountant! It can’t be that easy surely. There must be catch?