System Dynamics

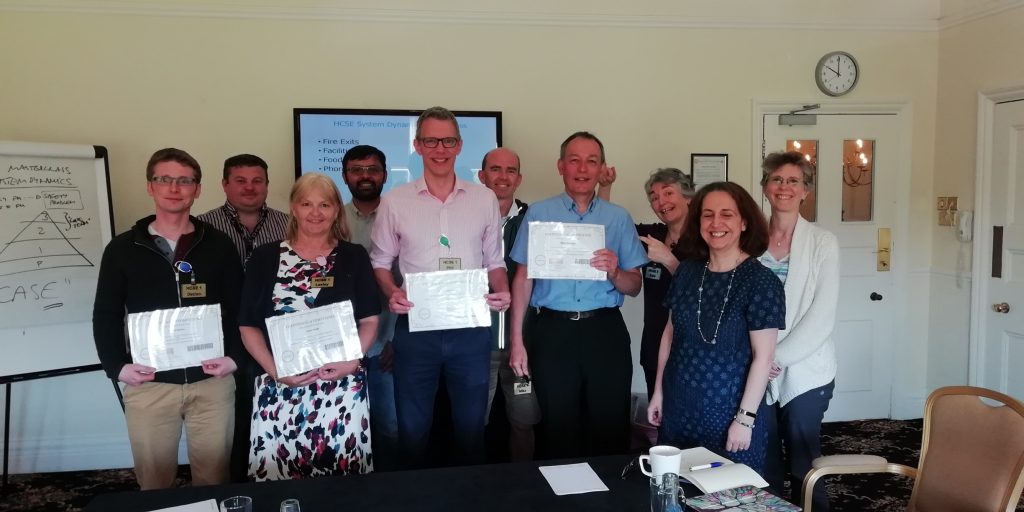
On Thursday we had a very enjoyable and educational day.  I say “we” because there were eleven of us learning together.

There was Declan, Chris, Lesley, Imran, Phil, Pete, Mike, Kate, Samar and Ellen and me (behind the camera).  Some are holding their long-overdue HCSE Level-1 Certificates and Badges that were awarded just before the photo was taken.

The theme for the day was System Dynamics which is a tried-and-tested approach for developing a deep understanding of how a complex adaptive system (CAS) actually works.  A health care system is a complex adaptive system.

The originator of system dynamics is Jay Wright Forrester who developed it around the end of WW2 (i.e. about 80 years ago) and who later moved to MIT.  Peter Senge, author of The Fifth Discipline was part of the same group as was Donella Meadows who wrote Limits to Growth.  Their dream was much bigger – global health – i.e. the whole planet not just the human passengers!  It is still a hot topic [pun intended].


The purpose of the day was to introduce the team of apprentice health care system engineers (HCSEs) to the principles of system dynamics and to some of its amazing visualisation and prediction techniques and tools.

The tangible output we wanted was an Excel-based simulation model that we could use to solve a notoriously persistent health care service management problem …

How to plan the number of new and review appointment slots needed to deliver a safe, efficient, effective and affordable chronic disease service?

So, with our purpose in mind, the problem clearly stated, and a blank design canvas we got stuck in; and we used the HCSE improvement-by-design framework that everyone was already familiar with.

We made lots of progress, learned lots of cool stuff, and had lots of fun.

We didn’t quite get to the final product but that was OK because it was a very tough design assignment.  We got 80% of the way there though which is pretty good in one day from a standing start.  The last 20% can now be done by the HCSEs themselves.

We were all exhausted at the end.  We had worked hard.  It was a good day.


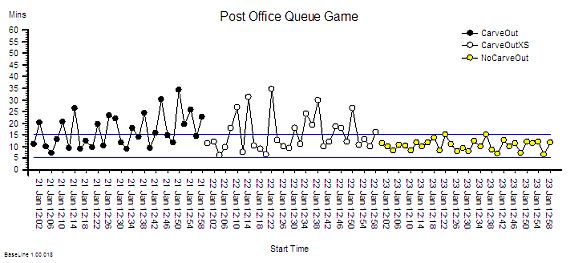
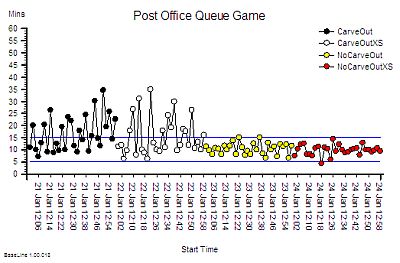
And I am already looking forward to the next HCSE Masterclass that will be in about six weeks time.  This one will address another chronic, endemic, systemic health care system “disease” called carveoutosis multiforme fulminans.

The Strangeness of LoS

It had been some time since Bob and Leslie had chatted so an email from the blue was a welcome distraction from a complex data analysis task.

<Bob> Hi Leslie, great to hear from you. I was beginning to think you had lost interest in health care improvement-by-design.

<Leslie> Hi Bob, not at all.  Rather the opposite.  I’ve been very busy using everything that I’ve learned so far.  It’s applications are endless, but I have hit a problem that I have been unable to solve, and it is driving me nuts!

<Bob> OK. That sounds encouraging and interesting.  Would you be able to outline this thorny problem and I will help if I can.

<Leslie> Thanks Bob.  It relates to a big issue that my organisation is stuck with – managing urgent admissions.  The problem is that very often there is no bed available, but there is no predictability to that.  It feels like a lottery; a quality and safety lottery.  The clinicians are clamoring for “more beds” but the commissioners are saying “there is no more money“.  So the focus has turned to reducing length of stay.

<Bob> OK.  A focus on length of stay sounds reasonable.  Reducing that can free up enough beds to provide the necessary space-capacity resilience to dramatically improve the service quality.  So long as you don’t then close all the “empty” beds to save money, or fall into the trap of believing that 85% average bed occupancy is the “optimum”.

<Leslie> Yes, I know.  We have explored all of these topics before.  That is not the problem.

<Bob> OK. What is the problem?

<Leslie> The problem is demonstrating objectively that the length-of-stay reduction experiments are having a beneficial impact.  The data seems to say they they are, and the senior managers are trumpeting the success, but the people on the ground say they are not. We have hit a stalemate.


<Bob> Ah ha!  That old chestnut.  So, can I first ask what happens to the patients who cannot get a bed urgently?

<Leslie> Good question.  We have mapped and measured that.  What happens is the most urgent admission failures spill over to commercial service providers, who charge a fee-per-case and we have no choice but to pay it.  The Director of Finance is going mental!  The less urgent admission failures just wait on queue-in-the-community until a bed becomes available.  They are the ones who are complaining the most, so the Director of Governance is also going mental.  The Director of Operations is caught in the cross-fire and the Chief Executive and Chair are doing their best to calm frayed tempers and to referee the increasingly toxic arguments.

<Bob> OK.  I can see why a “Reduce Length of Stay Initiative” would tick everyone’s Nice If box.  So, the data analysts are saying “the length of stay has come down since the Initiative was launched” but the teams on the ground are saying “it feels the same to us … the beds are still full and we still cannot admit patients“.

<Leslie> Yes, that is exactly it.  And everyone has come to the conclusion that demand must have increased so it is pointless to attempt to reduce length of stay because when we do that it just sucks in more work.  They are feeling increasingly helpless and hopeless.

<Bob> OK.  Well, the “chronic backlog of unmet need” issue is certainly possible, but your data will show if admissions have gone up.

<Leslie> I know, and as far as I can see they have not.

<Bob> OK.  So I’m guessing that the next explanation is that “the data is wonky“.

<Leslie> Yup.  Spot on.  So, to counter that the Information Department has embarked on a massive push on data collection and quality control and they are adamant that the data is complete and clean.

<Bob> OK.  So what is your diagnosis?

<Leslie> I don’t have one, that’s why I emailed you.  I’m stuck.


<Bob> OK.  We need a diagnosis, and that means we need to take a “history” and “examine” the process.  Can you tell me the outline of the RLoS Initiative.

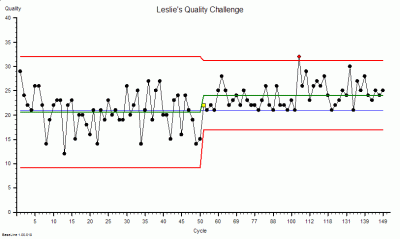
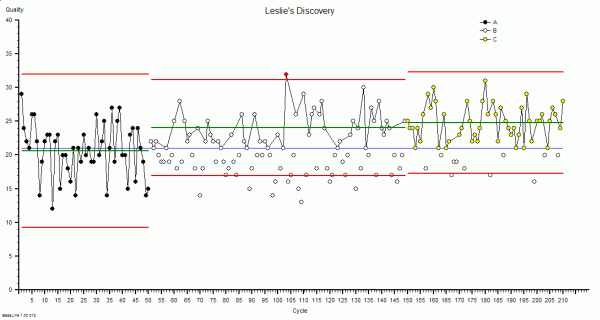
<Leslie> We knew that we would need a baseline to measure from so we got the historical admission and discharge data and plotted a Diagnostic Vitals Chart®.  I have learned something from my HCSE training!  Then we planned the implementation of a visual feedback tool that would show ward staff which patients were delayed so that they could focus on “unblocking” the bottlenecks.  We then planned to measure the impact of the intervention for three months, and then we planned to compare the average length of stay before and after the RLoS Intervention with a big enough data set to give us an accurate estimate of the averages.  The data showed a very obvious improvement, a highly statistically significant one.

<Bob> OK.  It sounds like you have avoided the usual trap of just relying on subjective feedback, and now have a different problem because your objective and subjective feedback are in disagreement.

<Leslie> Yes.  And I have to say, getting stuck like this has rather dented my confidence.

<Bob> Fear not Leslie.  I said this is an “old chestnut” and I can say with 100% confidence that you already have what you need in your T4 kit bag?

<Leslie>Tee-Four?

<Bob> Sorry, a new abbreviation. It stands for “theory, techniques, tools and training“.

<Leslie> Phew!  That is very reassuring to hear, but it does not tell me what to do next.

<Bob> You are an engineer now Leslie, so you need to don the hard-hat of Improvement-by-Design.  Start with your Needs Analysis.


<Leslie> OK.  I need a trustworthy tool that will tell me if the planned intervention has has a significant impact on length of stay, for better or worse or not at all.  And I need it to tell me that quickly so I can decide what to do next.

<Bob> Good.  Now list all the things that you currently have that you feel you can trust.

<Leslie> I do actually trust that the Information team collect, store, verify and clean the raw data – they are really passionate about it.  And I do trust that the front line teams are giving accurate subjective feedback – I work with them and they are just as passionate.  And I do trust the systems engineering “T4” kit bag – it has proven itself again-and-again.

<Bob> Good, and I say that because you have everything you need to solve this, and it sounds like the data analysis part of the process is a good place to focus.

<Leslie> That was my conclusion too.  And I have looked at the process, and I can’t see a flaw. It is driving me nuts!

<Bob> OK.  Let us take a different tack.  Have you thought about designing the tool you need from scratch?

<Leslie> No. I’ve been using the ones I already have, and assume that I must be using them incorrectly, but I can’t see where I’m going wrong.

<Bob> Ah!  Then, I think it would be a good idea to run each of your tools through a verification test and check that they are fit-4-purpose in this specific context.

<Leslie> OK. That sounds like something I haven’t covered before.

<Bob> I know.  Designing verification test-rigs is part of the Level 2 training.  I think you have demonstrated that you are ready to take the next step up the HCSE learning curve.

<Leslie> Do you mean I can learn how to design and build my own tools?  Special tools for specific tasks?

<Bob> Yup.  All the techniques and tools that you are using now had to be specified, designed, built, verified, and validated. That is why you can trust them to be fit-4-purpose.

<Leslie> Wooohooo! I knew it was a good idea to give you a call.  Let’s get started.


[Postscript] And Leslie, together with the other stakeholders, went on to design the tool that they needed and to use the available data to dissolve the stalemate.  And once everyone was on the same page again they were able to work collaboratively to resolve the flow problems, and to improve the safety, flow, quality and affordability of their service.  Oh, and to know for sure that they had improved it.

Notably Absent

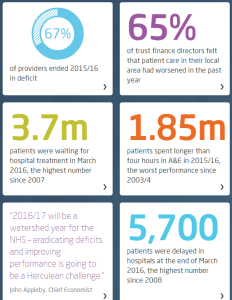
KingsFund_Quality_Report_May_2016This week the King’s Fund published their Quality Monitoring Report for the NHS, and it makes depressing reading.

These highlights are a snapshot.

The website has some excellent interactive time-series charts that transform the deluge of data the NHS pumps out into pictures that tell a shameful story.

On almost all reported dimensions, things are getting worse and getting worse faster.

Which I do not believe is the intention.

But it is clearly the impact of the last 20 years of health and social care policy.


What is more worrying is the data that is notably absent from the King’s Fund QMR.

The first omission is outcome: How well did the NHS deliver on its intended purpose?  It is stated at the top of the NHS England web site …

NHSE_Purpose

And lets us be very clear here: dying, waiting, complaining, and over-spending are not measures of what we want: health and quality success metrics.  They are a measures of what we do not want; they are failure metrics.

The fanatical focus on failure is part of the hyper-competitive, risk-averse medical mindset:

primum non nocere (first do no harm),

and as a patient I am reassured to hear that but is no harm all I can expect?

What about:

tunc mederi (then do some healing)


And where is the data on dying in the Kings Fund QMR?

It seems to be notably absent.

And I would say that is a quality issue because it is something that patients are anxious about.  And that may be because they are given so much ‘open information’ about what might go wrong, not what should go right.


And you might think that sharp, objective data on dying would be easy to collect and to share.  After all, it is not conveniently fuzzy and subjective like satisfaction.

It is indeed mandatory to collect hospital mortality data, but sharing it seems to be a bit more of a problem.

The fear-of-failure fanaticism extends there too.  In the wake of humiliating, historical, catastrophic failures like Mid Staffs, all hospitals are monitored, measured and compared. And the negative deviants are named, shamed and blamed … in the hope that improvement might follow.

And to do the bench-marking we need to compare apples with apples; not peaches with lemons.  So we need to process the raw data to make it fair to compare; to ensure that factors known to be associated with higher risk of death are taken into account. Factors like age, urgency, co-morbidity and primary diagnosis.  Factors that are outside the circle-of-control of the hospitals themselves.

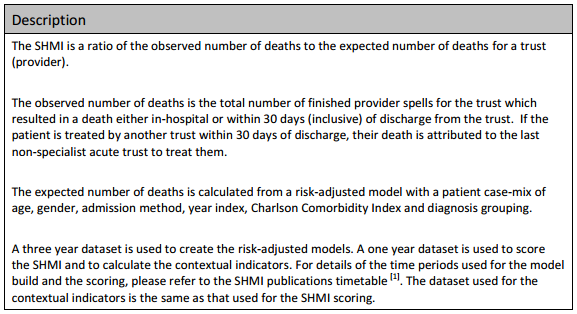
And there is an army of academics, statisticians, data processors, and analysts out there to help. The fruit of their hard work and dedication is called SHMI … the Summary Hospital Mortality Index.

SHMI_Specification

Now, the most interesting paragraph is the third one which outlines what raw data is fed in to building the risk-adjusted model.  The first four are objective, the last two are more subjective, especially the diagnosis grouping one.

The importance of this distinction comes down to human nature: if a hospital is failing on its SHMI then it has two options:
(a) to improve its policies and processes to improve outcomes, or
(b) to manipulate the diagnosis group data to reduce the SHMI score.

And the latter is much easier to do, it is called up-coding, and basically it involves camping at the pessimistic end of the diagnostic spectrum. And we are very comfortable with doing that in health care. We favour the Black Hat.

And when our patients do better than our pessimistically-biased prediction, then our SHMI score improves and we look better on the NHS funnel plot.

We do not have to do anything at all about actually improving the outcomes of the service we provide, which is handy because we cannot do that. We do not measure it!


And what might be notably absent from the data fed in to the SHMI risk-model?  Data that is objective and easy to measure.  Data such as length of stay (LOS) for example?

Is there a statistical reason that LOS is omitted? Not really. Any relevant metric is a contender for pumping into a risk-adjustment model.  And we all know that the sicker we are, the longer we stay in hospital, and the less likely we are to come out unharmed (or at all).  And avoidable errors create delays and complications that imply more risk, more work and longer length of stay. Irrespective of the illness we arrived with.

So why has LOS been omitted from SHMI?

The reason may be more political than statistical.

We know that the risk of death increases with infirmity and age.

We know that if we put frail elderly patients into a hospital bed for a few days then they will decondition and become more frail, require more time in hospital, are more likely to need a transfer of care to somewhere other than home, are more susceptible to harm, and more likely to die.

So why is LOS not in the risk-of-death SHMI model?

And it is not in the King’s Fund QR report either.

Nor is the amount of cash being pumped in to keep the HMS NHS afloat each month.

All notably absent!

The Cost of Chaos

british_pound_money_three_bundled_stack_400_wht_2425This week I conducted an experiment – on myself.

I set myself the challenge of measuring the cost of chaos, and it was tougher than I anticipated it would be.

It is easy enough to grasp the concept that fire-fighting to maintain patient safety amidst the chaos of healthcare would cost more in terms of tears and time …

… but it is tricky to translate that concept into hard numbers; i.e. cash.


Chaos is an emergent property of a system.  Safety, delivery, quality and cost are also emergent properties of a system. We can measure cost, our finance departments are very good at that. We can measure quality – we just ask “How did your experience match your expectation”.  We can measure delivery – we have created a whole industry of access target monitoring.  And we can measure safety by checking for things we do not want – near misses and never events.

But while we can feel the chaos we do not have an easy way to measure it. And it is hard to improve something that we cannot measure.


So the experiment was to see if I could create some chaos, then if I could calm it, and then if I could measure the cost of the two designs – the chaotic one and the calm one.  The difference, I reasoned, would be the cost of the chaos.

And to do that I needed a typical chunk of a healthcare system: like an A&E department where the relationship between safety, flow, quality and productivity is rather important (and has been a hot topic for a long time).

But I could not experiment on a real A&E department … so I experimented on a simplified but realistic model of one. A simulation.

What I discovered came as a BIG surprise, or more accurately a sequence of big surprises!

  1. First I discovered that it is rather easy to create a design that generates chaos and danger.  All I needed to do was to assume I understood how the system worked and then use some averaged historical data to configure my model.  I could do this on paper or I could use a spreadsheet to do the sums for me.
  2. Then I discovered that I could calm the chaos by reactively adding lots of extra capacity in terms of time (i.e. more staff) and space (i.e. more cubicles).  The downside of this approach was that my costs sky-rocketed; but at least I had restored safety and calm and I had eliminated the fire-fighting.  Everyone was happy … except the people expected to foot the bill. The finance director, the commissioners, the government and the tax-payer.
  3. Then I got a really big surprise!  My safe-but-expensive design was horribly inefficient.  All my expensive resources were now running at rather low utilisation.  Was that the cost of the chaos I was seeing? But when I trimmed the capacity and costs the chaos and danger reappeared.  So was I stuck between a rock and a hard place?
  4. Then I got a really, really big surprise!!  I hypothesised that the root cause might be the fact that the parts of my system were designed to work independently, and I was curious to see what happened when they worked interdependently. In synergy. And when I changed my design to work that way the chaos and danger did not reappear and the efficiency improved. A lot.
  5. And the biggest surprise of all was how difficult this was to do in my head; and how easy it was to do when I used the theory, techniques and tools of Improvement-by-Design.

So if you are curious to learn more … I have written up the full account of the experiment with rationale, methods, results, conclusions and references and I have published it here.

Politicial Purpose

count_this_vote_400_wht_9473The question that is foremost in the mind of a designer is “What is the purpose?”   It is a future-focussed question.  It is a question of intent and outcome. It raises the issues of worth and value.

Without a purpose it impossible to answer the question “Is what we have fit-for-purpose?

And without a clear purpose it is impossible for a fit-for-purpose design to be created and tested.

In the absence of a future-purpose all that remains are the present-problems.

Without a future-purpose we cannot be proactive; we can only be reactive.

And when we react to problems we generate divergence.  We observe heated discussions. We hear differences of opinion as to the causes and the solutions.  We smell the sadness, anger and fear. We taste the bitterness of cynicism. And we are touched to our core … but we are paralysed.  We cannot act because we cannot decide which is the safest direction to run to get away from the pain of the problems we have.


And when the inevitable catastrophe happens we look for somewhere and someone to place and attribute blame … and high on our target-list are politicians.


So the prickly question of politics comes up and we need to grasp that nettle and examine it with the forensic lens of the system designer and we ask “What is the purpose of a politician?”  What is the output of the political process? What is their intent? What is their worth? How productive are they? Do we get value for money?

They will often answer “Our purpose is to serve the public“.  But serve is a verb so it is a process and not a purpose … “To serve the public for what purpose?” we ask. “What outcome can we expect to get?” we ask. “And when can we expect to get it?

We want a service (a noun) and as voters and tax-payers we have customer rights to one!

On deeper reflection we see a political spectrum come into focus … with Public at one end and Private at the other.  A country generates wealth through commerce … transforming natural and human resources into goods and services. That is the Private part and it has a clear and countable measure of success: profit.  The Public part is the redistribution of some of that wealth for the benefit of all – the tax-paying public. Us.

Unfortunately the Public part does not have quite the same objective test of success: so we substitute a different countable metric: votes. So the objectively measurable outcome of a successful political process is the most votes.

But we are still talking about process … not purpose.  All we have learned so far is that the politicians who attract the most votes will earn for themselves a temporary mandate to strive to achieve their political purpose. Whatever that is.

So what do the public, the voters, the tax-payers (and remember whenever we buy something we pay tax) … the customers of this political process … actually get for their votes and cash?  Are they delighted, satisfied or disappointed? Are they getting value-for-money? Is the political process fit-for-purpose? And what is the purpose? Are we all clear about that?

And if we look at the current “crisis” in health and social care in England then I doubt that “delight” will feature high on the score-sheet for those who work in healthcare or for those that they serve. The patients. The long-suffering tax-paying public.


Are politicians effective? Are they delivering on their pledge to serve the public? What does the evidence show?  What does their portfolio of public service improvement projects reveal?  Welfare, healthcare, education, police, and so on.The_Whitehall_Effect

Well the actual evidence is rather disappointing … a long trail of very expensive taxpayer-funded public service improvement failures.

And for an up-to-date list of some of the “eye-wateringly”expensive public sector improvement train-wrecks just read The Whitehall Effect.

But lurid stories of public service improvement failures do not attract precious votes … so they are not aired and shared … and when they are exposed our tax-funded politicians show their true skills and real potential.

Rather than answering the questions they filter, distort and amplify the questions and fire them at each other.  And then fall over each other avoiding the finger-of-blame and at the same time create the next deceptively-plausible election manifesto.  Their food source is votes so they have to tickle the voters to cough them up. And they are consummate masters of that art.

Politicians sell dreams and serve disappointment.


So when the-most-plausible with the most votes earn the right to wield the ignition keys for the engine of our national economy they deflect future blame by seeking the guidance of experts. And the only place they can realistically look is into the private sector who, in manufacturing anyway, have done a much better job of understanding what their customers need and designing their processes to deliver it. On-time, first-time and every-time.

Politicians have learned to be wary of the advice of academics – they need something more pragmatic and proven.  And just look at the remarkable rise of the manufacturing phoenix of Jaguar-Land-Rover (JLR) from the politically embarrassing ashes of the British car industry. And just look at Amazon to see what information technology can deliver!

So the way forward is blindingly obvious … combine manufacturing methods with information technology and build a dumb-robot manned production-line for delivering low-cost public services via a cloud-based website and an outsourced mega-call-centre manned by standard-script-following low-paid operatives.


But here we hit a bit of a snag.

Designing a process to deliver a manufactured product for a profit is not the same as designing a system to deliver a service to the public.  Not by a long chalk.  Public services are an example of what is now known as a complex adaptive system (CAS).

And if we attempt to apply the mechanistic profit-focussed management mantras of “economy of scale” and “division of labour” and “standardisation of work” to the messy real-world of public service then we actually achieve precisely the opposite of what we intended. And the growing evidence is embarrassingly clear.

We all want safer, smoother, better, and more affordable public services … but that is not what we are experiencing.

Our voted-in politicians have unwittingly commissioned complicated non-adaptive systems that ensure we collectively fail.

And we collectively voted the politicians into power and we are collectively failing to hold them to account.

So the ball is squarely in our court.


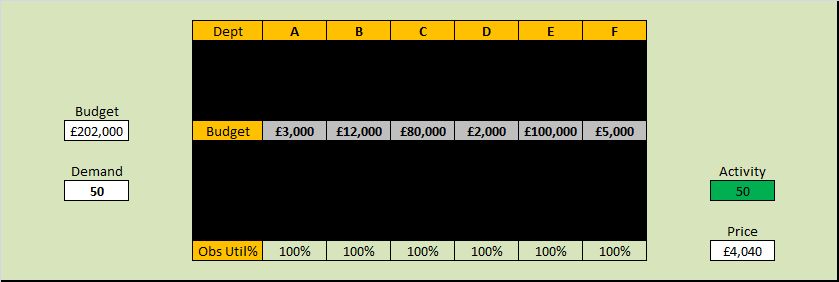
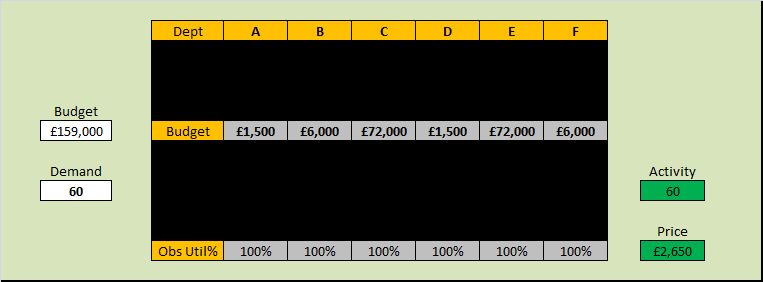
Below is a short video that illustrates what happens when politicians and civil servants attempt complex system design. It is called the “Save the NHS Game” and it was created by a surgeon who also happens to be a system designer.  The design purpose of the game is to raise awareness. The fundamental design flaw in this example is “financial fragmentation” which is the the use of specific budgets for each part of the system together with a generic, enforced, incremental cost-reduction policy (the shrinking budget).  See for yourself what happens …


In health care we are in the improvement business and to do that we start with a diagnosis … not a dream or a decision.

We study before we plan, and we plan before we do.

And we have one eye on the problem and one eye on the intended outcome … a healthier patient.  And we often frame improvement in the negative as a ‘we do not want a not sicker patient’ … physically or psychologically. Primum non nocere.  First do no harm.

And 99.9% of the time we do our best given the constraints of the system context that the voted-in politicians have created for us; and that their loyal civil servants have imposed on us.


Politicians are not designers … that is not their role.  Their part is to create and sell realistic dreams in return for votes.

Civil servants are not designers … that is not their role.  Their part is to enact the policy that the vote-seeking politicians cook up.

Doctors are not designers … that is not their role.  Their part is to make the best possible clinical decisions that will direct actions that lead, as quickly as possible, to healthier and happier patients.

So who is doing the complex adaptive system design?  Whose role is that?

And here we expose a gap.  No one.  For the simple reason that no one is trained to … so no one is tasked to.

But there is a group of people who are perfectly placed to create the context for developing this system design capability … the commissioners, the executive boards and the senior managers of our public services.

So that is where we might reasonably start … by inviting our leaders to learn about the science of complex adaptive system improvement-by-design.

And there are now quite a few people who can now teach this science … they are the ones who have done it and can demonstrate and describe their portfolios of successful and sustained public service improvement projects.

Would you vote for that?

Righteous Indignation

NHS_Legal_CostsThis heading in the the newspaper today caught my eye.

Reading the rest of the story triggered a strong emotional response: anger.

My inner chimp was not happy. Not happy at all.

So I took my chimp for a walk and we had a long chat and this is the story that emerged.

The first trigger was the eye-watering fact that the NHS is facing something like a £26 billion litigation cost.  That is about a quarter of the total NHS annual budget!

The second was the fact that the litigation bill has increased by over £3 billion in the last year alone.

The third was that the extra money will just fall into a bottomless pit – the pockets of legal experts – not to where it is intended, to support overworked and demoralised front-line NHS staff. GPs, nurses, AHPs, consultants … the ones that deliver care.

That is why my chimp was so upset.  And it sounded like righteous indignation rather than irrational fear.


So what is the root cause of this massive bill? A more litigious society? Ambulance chasing lawyers trying to make a living? Dishonest people trying to make a quick buck out of a tax-funded system that cannot defend itself?

And what is the plan to reduce this cost?

Well in the article there are three parts to this:
“apologise and learn when you’re wrong,  explain and vigorously defend when we’re right, view court as a last resort.”

This sounds very plausible but to achieve it requires knowing when we are wrong or right.

How do we know?


Generally we all think we are right until we are proved wrong.

It is the way our brains are wired. We are more sure about our ‘rightness’ than the evidence suggests is justified. We are naturally optimistic about our view of ourselves.

So to be proved wrong is emotionally painful and to do it we need:
1) To make a mistake.
2) For that mistake to lead to psychological or physical harm.
3) For the harm to be identified.
4) For the cause of the harm to be traced back to the mistake we made.
5) For the evidence to be used to hold us to account, (to apologise and learn).

And that is all hunky-dory when we are individually inept and we make avoidable mistakes.

But what happens when the harm is the outcome of a combination of actions that individually are harmless but which together are not?  What if the contributory actions are sensible and are enforced as policies that we dutifully follow to the letter?

Who is held to account?  Who needs to apologise? Who needs to learn?  Someone? Anyone? Everyone? No one?

The person who wrote the policy?  The person who commissioned the policy to be written? The person who administers the policy? The person who follows the policy?

How can that happen if the policies are individually harmless but collectively lethal?


The error here is one of a different sort.

It is called an ‘error of omission’.  The harm is caused by what we did not do.  And notice the ‘we’.

What we did not do is to check the impact on others of the policies that we write for ourselves.

Example:

The governance department of a large hospital designs safety policies that if not followed lead to disciplinary action and possible dismissal.  That sounds like a reasonable way to weed out the ‘bad apples’ and the policies are adhered to.

At the same time the operations department designs flow policies (such as maximum waiting time targets and minimum resource utilisation) that if not followed lead to disciplinary action and possible dismissal.  That also sounds like a reasonable way to weed out the layabouts whose idleness cause queues and delays and the policies are adhered to.

And at the same time the finance department designs fiscal policies (such as fixed budgets and cost improvement targets) that if not followed lead to disciplinary action and possible dismissal. Again, that sounds like a reasonable way to weed out money wasters and the policies are adhered to.

What is the combined effect? The multiple safety checks take more time to complete, which puts extra workload on resources and forces up utilisation. As the budget ceiling is lowered the financial and operational pressures build, the system heats up, stress increases, corners are cut, errors slip through the safety checks. More safety checks are added and the already over-worked staff are forced into an impossible position.  Chaos ensues … more mistakes are made … patients are harmed and justifiably seek compensation by litigation.  Everyone loses (except perhaps the lawyers).


So why was my inner chimp really so unhappy?

Because none of this is necessary. This scenario is avoidable.

Reducing the pain of complaints and the cost of litigation requires setting realistic expectations to avoid disappointment and it requires not creating harm in the first place.

That implies creating healthcare systems that are inherently safe, not made not-unsafe by inspection-and-correction.

And it implies measuring and sharing intended and actual outcomes not  just compliance with policies and rates of failure to meet arbitrary and conflicting targets.

So if that is all possible and all that is required then why are we not doing it?

Simple. We never learned how. We never knew it is possible.

Counter-Productivity

coffee_table_talk_PA_150_wht_6082The Webex icon bounced up and down on Bob’s task bar signalling that Leslie had just joined the weekly ISP coaching session.

<Leslie> Hi Bob. I have been so busy this week that I have not had time to consider a topic to explore.

<Bob> No problem Leslie, I have shelf full of topics we have not touched yet.  So shall we talk about counter-productivity?

<Leslie> Don’t you mean productivity … the fourth dimension of system improvement.

<Bob>They are related of course but we will approach the issue of productivity from a different angle. Rather like we did with safety. To improve safety we considered at the causes of un-safety and focussed our efforts there.

<Leslie> Ah yes, I see.  So to improve productivity we look at the causes of un-productivity … in other words counter-productive beliefs and behaviours that are manifest as system design flaws.

<Bob> Exactly. So remind me what the definition of a productivity metric is from your FISH course.

<Leslie> Productivity is the ratio of a stream metric and a stage metric.  Value-for-Money for example.

<Bob> Good.  So counter-productivity is also a ratio of a stream and a stage metric.

<Leslie> Um, I’m not sure I quite get that. Can you explain a bit more.

<Bob> OK. To explore deeper we need to be clear about how each metric relates to our intended outcome.  Remember in safety-by-design we count the number and severity of risks and harm because  as harm is going up then safety is going down.  So harm is an un-safety stream metric.

<Leslie> Ah! Yes I see.  So if we look at cycle-time, which is a stage metric; as cycle-time increases, the activity falls and productivity falls. So cycle-time is actually a counter-productivity metric.

<Bob>Excellent. You are getting the hang of the concept of counter-productivity.

<Leslie> And we need to be careful because productivity is a ratio so the numerator and denominator metrics work in opposite ways: increasing the magnitude of the numerator is equivalent to decreasing the magnitude of the denominator – the ratio increases.

<Bob> Indeed, there are many hazards with ratios as we have explored before. So let is consider a real and rather useful example.  Let us look at Little’s Law from the perspective of counter-productivity. Remind me of the definition of Little’s Law for a single step system.

<Leslie> Little’s Law is a mathematically proven law of flow physics which states that the average lead-time is the product of the average work-in-progress and the average cycle-time.

LT = WIP * CT

<Bob> Good and I am pleased to see that you have used cycle-time. We are considering a single stream, single stage, single step system.

<Leslie> Yes, I avoided using the unqualified term ‘activity’. I have learned that lesson the hard way too!

<Bob> So how do the terms in Little’s Law relate to streams, stages and systems?

<Leslie> Lead-time is a stream metric, cycle-time is a stage metric and work-in-progress is a …. h’mm. What it is? A stream metric or a stage metric?

<Bob>Or?

<Leslie>A system metric?  WIP is a system metric!

<Bob> Good. So now re-arrange Little’s Law as a productivity formula.

<Leslie> Work-in-Progress equals lead-time divided by cycle-time

WIP = LT / CT

<Bob> So is WIP a productivity or a counter-productivity metric?

<Leslie> H’mmm …. I will need to work this through logically and step-by-step. I do not trust my intuition on this flow stuff.

Increasing cycle-time is counter-productive because it implies activity is falling while costs are not.

But cycle-time is on the bottom of the ratio so it’s effect reverses.

So if lead-time stays the same and cycle-time increases then because it is on the bottom of the ratio that implies a more productive design. And at the same time work in progress must be falling. Urrgh! This is hurting my head.

<Bob> Good, keep going … you are nearly there.

<Leslie> So a falling WIP is a sign of increasing productivity.

<Bob> Good … and that implies?

<Leslie> WIP is a counter-productivity system metric!

<Bob> Well done. Your logic is flawless.

<Leslie> So that  is why we focus on WIP so much!  Whatever causes WIP to increase is counter-productive!

Ahhhh …. that makes complete sense.

Lo-WIP  designs are more productive than Hi-WIP designs.

<Bob> Bravo!  And translating this into financial metrics … it is because a big queue of waiting work incurs costs. Storage cost, maintenance cost, processing cost and so on. So WIP is a liability. It is not an asset!

<Leslie> But doesn’t that imply treating work-in-progress as an asset on the financial balance sheet is counter-productive?

<Bob> It does indeed.

<Leslie> Oh dear! That revelation is going to upset a lot of people in the accounting department!

<Bob> The painful reality is that  the Laws of Flow Physics are completely indifferent to what any of us believe or do not believe.

<Leslie> Wow!  I like this concept of counter-productivity … it really helps to expose some of our invalid assumptions that invisibly block improvement!

<Bob> So here is a question to ponder.  Is zero WIP desirable or even possible?

<Leslie> H’mmm.  I will have to think about that.  I know you would not have asked the question for no reason.

Economy-of-Scale vs Economy-of-Flow

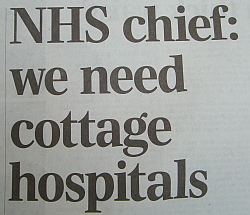
We_Need_Small_HospitalsThis was an interesting headline to see on the front page of a newspaper yesterday!

The Top Man of the NHS is openly challenging the current Centralisation-is-The-Only-Way-Forward Mantra;  and for good reason.

Mass centralisation is poor system design – very poor.

Q: So what is driving the centralisation agenda?

A: Money.

Or to be more precise – rather simplistic thinking about money.

The misguided money logic goes like this:

1. Resources (such as highly trained doctors, nurses and AHPs) cost a lot of money to provide.
[Yes].

2. So we want all these resources to be fully-utilised to get value-for-money.
[No, not all – just the most expensive].

3. So we will gather all the most expensive resources into one place to get the Economy-of-Scale.
[No, not all the most expensive – just the most specialised]

4. And we will suck /push all the work through these super-hubs to keep our expensive specialist resources busy all the time.
[No, what about the growing population of older folks who just need a bit of expert healthcare support, quickly, and close to home?]

This flawed logic confuses two complementary ways to achieve higher system productivity/economy/value-for-money without  sacrificing safety:

Economies of Scale (EoS) and Economies of Flow (EoF).

Of the two the EoF is the more important because by using EoF principles we can increase productivity in huge leaps at almost no cost; and without causing harm and disappointment. EoS are always destructive.

But that is impossible. You are talking rubbish … because if it were possible we would be doing it!

It is not impossible and we are doing it … but not at scale and pace in healthcare … and the reason for that is we are not trained in Economy-of-Flow methods.

And those who are trained and who have have experienced the effects of EoF would not do it any other way.

Example:

In a recent EoF exercise an ISP (Improvement Science Practitioner) helped a surgical team to increase their operating theatre productivity by 30% overnight at no cost.  The productivity improvement was measured and sustained for most of the last year. [it did dip a bit when the waiting list evaporated because of the higher throughput, and again after some meddlesome middle management madness was triggered by end-of-financial-year target chasing].  The team achieved the improvement using Economy of Flow principles and by re-designing some historical scheduling policies. The new policies  were less antagonistic. They were designed to line the ducks up and as a result the flow improved.


So the specific issue of  Super Hospitals vs Small Hospitals is actually an Economy of Flow design challenge.

But there is another critical factor to take into account.

Specialisation.

Medicine has become super-specialised for a simple reason: it is believed that to get ‘good enough’ at something you have to have a lot of practice. And to get the practice you have to have high volumes of the same stuff – so you need to specialise and then to sort undifferentiated work into separate ‘speciologist’ streams or sequence the work through separate speciologist stages.

Generalists are relegated to second-class-citizen status; mere tripe-skimmers and sign-posters.

Specialisation is certainly one way to get ‘good enough’ at doing something … but it is not the only way.

Another way to learn the key-essentials from someone who already knows (and can teach) and then to continuously improve using feedback on what works and what does not – feedback from everywhere.

This second approach is actually a much more effective and efficient way to develop expertise – but we have not been taught this way.  We have only learned the scrape-the-burned-toast-by-suck-and-see method.

We need to experience another way.

We need to experience rapid acquisition of expertise!

And being able to gain expertise quickly means that we can become expert generalists.

There is good evidence that the broader our skill-set the more resilient we are to change, and the more innovative we are when faced with novel challenges.

In the Navy of the 1800’s sailors were “Jacks of All Trades and Master of One” because if only one person knew how to navigate and they got shot or died of scurvy the whole ship was doomed.  Survival required resilience and that meant multi-skilled teams who were good enough at everything to keep the ship afloat – literally.


Specialisation has another big drawback – it is very expensive and on many dimensions. Not just Finance.

Example:

Suppose we have six-step process and we have specialised to the point where an individual can only do one step to the required level of performance (safety/flow/quality/productivity).  The minimum number of people we need is six and the process only flows when we have all six people. Our minimum costs are high and they do not scale with flow.

If any one of the six are not there then the whole process stops. There is no flow.  So queues build up and smooth flow is sacrificed.

Out system behaves in an unstable and chaotic feast-or-famine manner and rapidly shifting priorities create what is technically called ‘thrashing’.

And the special-six do not like the constant battering.

And the special-six have the power to individually hold the whole system to ransom – they do not even need to agree.

And then we aggravate the problem by paying them the high salary that it is independent of how much they collectively achieve.

We now have the perfect recipe for a bigger problem!  A bunch of grumpy, highly-paid specialists who blame each other for the chaos and who incessantly clamour for ‘more resources’ at every step.

This is not financially viable and so creates the drive for economy-of-scale thinking in which to get us ‘flow resilience’ we need more than one specialist at each of the six steps so that if one is on holiday or off sick then the process can still flow.  Let us call these tribes of ‘speciologists’ there own names and budgets, and now we need to put all these departments somewhere – so we will need a big hospital to fit them in – along with the queues of waiting work that they need.

Now we make an even bigger design blunder.  We assume the ‘efficiency’ of our system is the same as the average utilisation of all the departments – so we trim budgets until everyone’s utilisation is high; and we suck any-old work in to ensure there is always something to do to keep everyone busy.

And in so doing we sacrifice all our Economy of Flow opportunities and we then scratch our heads and wonder why our total costs and queues are escalating,  safety and quality are falling, the chaos continues, and our tribes of highly-paid specialists are as grumpy as ever they were!   It must be an impossible-to-solve problem!


Now contrast that with having a pool of generalists – all of whom are multi-skilled and can do any of the six steps to the required level of expertise.  A pool of generalists is a much more resilient-flow design.

And the key phrase here is ‘to the required level of expertise‘.

That is how to achieve Economy-of-Flow on a small scale without compromising either safety or quality.

Yes, there is still a need for a super-level of expertise to tackle the small number of complex problems – but that expertise is better delivered as a collective-expertise to an individual problem-focused process.  That is a completely different design.

Designing and delivering a system that that can achieve the synergy of the pool-of-generalists and team-of-specialists model requires addressing a key error of omission first: we are not trained how to do this.

We are not trained in Complex-Adaptive-System Improvement-by-Design.

So that is where we must start.


The Speed of Trust

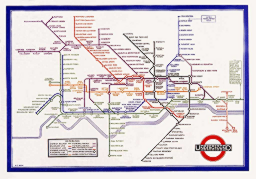
London_UndergroundSystems are built from intersecting streams of work called processes.

This iconic image of the London Underground shows a system map – a set of intersecting transport streams.

Each stream links a sequence of independent steps – in this case the individual stations.  Each step is a system in itself – it has a set of inner streams.

For a system to exhibit stable and acceptable behaviour the steps must be in synergy – literally ‘together work’. The steps also need to be in synchrony – literally ‘same time’. And to do that they need to be aligned to a common purpose.  In the case of a transport system the design purpose is to get from A to B safety, quickly, in comfort and at an affordable cost.

In large socioeconomic systems called ‘organisations’ the steps represent groups of people with special knowledge and skills that collectively create the desired product or service.  This creates an inevitable need for ‘handoffs’ as partially completed work flows through the system along streams from one step to another. Each step contributes to the output. It is like a series of baton passes in a relay race.

This creates the requirement for a critical design ingredient: trust.

Each step needs to be able to trust the others to do their part:  right-first-time and on-time.  All the steps are directly or indirectly interdependent.  If any one of them is ‘untrustworthy’ then the whole system will suffer to some degree. If too many generate dis-trust then the system may fail and can literally fall apart. Trust is like social glue.

So a critical part of people-system design is the development and the maintenance of trust-bonds.

And it does not happen by accident. It takes active effort. It requires design.

We are social animals. Our default behaviour is to trust. We learn distrust by experiencing repeated disappointments. We are not born cynical – we learn that behaviour.

The default behaviour for inanimate systems is disorder – and it has a fancy name – it is called ‘entropy’. There is a Law of Physics that says that ‘the average entropy of a system will increase over time‘. The critical word is ‘average’.

So, if we are not aware of this and we omit to pay attention to the hand-offs between the steps we will observe increasing disorder which leads to repeated disappointments and erosion of trust. Our natural reaction then is ‘self-protect’ which implies ‘check-and-reject’ and ‘check and correct’. This adds complexity and bureaucracy and may prevent further decline – which is good – but it comes at a cost – quite literally.

Eventually an equilibrium will be achieved where our system performance is limited by the amount of check-and-correct bureaucracy we can afford.  This is called a ‘mediocrity trap’ and it is very resilient – which means resistant to change in any direction.


To escape from the mediocrity trap we need to break into the self-reinforcing check-and-reject loop and we do that by developing a design that challenges ‘trust eroding behaviour’.  The strategy is to develop a skill called  ‘smart trust’.

To appreciate what smart trust is we need to view trust as a spectrum: not as a yes/no option.

At one end is ‘nonspecific distrust’ – otherwise known as ‘cynical behaviour’. At the other end is ‘blind trust’ – otherwise  known and ‘gullible behaviour’.  Neither of these are what we need.

In the middle is the zone of smart trust that spans healthy scepticism  through to healthy optimism.  What we need is to maintain a balance between the two – not to eliminate them. This is because some people are ‘glass-half-empty’ types and some are ‘glass-half-full’. And both views have a value.

The action required to develop smart trust is to respectfully challenge every part of the organisation to demonstrate ‘trustworthiness’ using evidence.  Rhetoric is not enough. Politicians always score very low on ‘most trusted people’ surveys.

The first phase of this smart trust development is for steps to demonstrate trustworthiness to themselves using their own evidence, and then to share this with the steps immediately upstream and downstream of them.

So what evidence is needed?

SFQP1Safety comes first. If a step cannot be trusted to be safe then that is the first priority. Safe systems need to be designed to be safe.

Flow comes second. If the streams do not flow smoothly then we experience turbulence and chaos which increases stress,  the risk of harm and creates disappointment for everyone. Smooth flow is the result of careful  flow design.

Third is Quality which means ‘setting and meeting realistic expectations‘.  This cannot happen in an unsafe, chaotic system.  Quality builds on Flow which builds on Safety. Quality is a design goal – an output – a purpose.

Fourth is Productivity (or profitability) and that does not automatically follow from the other three as some QI Zealots might have us believe. It is possible to have a safe, smooth, high quality design that is unaffordable.  Productivity needs to be designed too.  An unsafe, chaotic, low quality design is always more expensive.  Always. Safe, smooth and reliable can be highly productive and profitable – if designed to be.

So whatever the driver for improvement the sequence of questions is the same for every step in the system: “How can I demonstrate evidence of trustworthiness for Safety, then Flow, then Quality and then Productivity?”

And when that happens improvement will take off like a rocket. That is the Speed of Trust.  That is Improvement Science in Action.

The Seventh Flow

texting_a_friend_back_n_forth_150_wht_5352Bing Bong

Bob looked up from the report he was reading and saw the SMS was from Leslie, one of his Improvement Science Practitioners.

It said “Hi Bob, would you be able to offer me your perspective on another barrier to improvement that I have come up against.”

Bob thumbed a reply immediately “Hi Leslie. Happy to help. Free now if you would like to call. Bob

Ring Ring

<Bob> Hello, Bob here.

<Leslie> Hi Bob. Thank you for responding so quickly. Can I describe the problem?

<Bob> Hi Leslie – Yes, please do.

<Leslie> OK. The essence of it is that I have discovered that our current method of cash-flow control is preventing improvements in safety, quality, delivery and paradoxically in productivity too. I have tried to talk to the Finance department and all I get back is “We have always done it this way. That is what we are taught. It works. The rules are not negotiable and the problem is not Finance“. I am at a loss what to do.

<Bob> OK. Do not worry. This is a common issue that every ISP discovers at some point. What led you to your conclusion that the current methods are creating a barrier to change?

<Leslie> Well, the penny dropped when I started using the modelling tools you have shown me.  In particular when predicting the impact of process improvement-by-design changes on the financial performance of the system.

<Bob> OK. Can you be more specific?

<Leslie> Yes. The project was to design a new ambulatory diagnostic facility that will allow much more of the complex diagnostic work to be done on an outpatient basis.  I followed the 6M Design approach and looked first at the physical space design. We needed that to brief the architect.

<Bob> OK. What did that show?

<Leslie> It showed that the physical layout had a very significant impact on the flow in the process and that by getting all the pieces arranged in the right order we could create a physical design that felt spacious without actually requiring a lot of space. We called it the “Tardis Effect“. The most marked impact was on the size of the waiting areas – they were really small compared with what we have now which are much bigger and yet still feel cramped and chaotic.

<Bob> OK. So how does that physical space design link to the finance question?

<Leslie> Well, the obvious links were that the new design would have a smaller physical foot-print and at the same time give a higher throughput. It will cost less to build and will generate more activity than if we just copied the old design into a shiny new building.

<Bob> OK. I am sure that the Capital Allocation Committee and the Revenue Generation Committee will have been pleased with that outcome. What was the barrier?

<Leslie> Yes, you are correct. They were delighted because it left more in the Capital Pot for other equally worthy projects. The problem was not capital it was revenue.

<Bob> You said that activity was predicted to increase. What was the problem?

<Leslie>Yes – sorry, I was not clear – it was not the increased activity that was the problem – it was how to price the activity and  how to distribute the revenue generated. The Reference Cost Committee and Budget Allocation Committee were the problem.

<Bob> OK. What was the problem?

<Leslie> Well the estimates for the new operational budgets were basically the current budgets multiplied by the ratio of the future planned and historical actual activity. The rationale was that the major costs are people and consumables so the running costs should scale linearly with activity. They said the price should stay as it is now because the quality of the output is the same.

<Bob> OK. That does sound like a reasonable perspective. The variable costs will track with the activity if nothing else changes. Was it apportioning the overhead costs as part of the Reference Costing that was the problem?

<Leslie> No actually. We have not had that conversation yet. The problem was more fundamental. The problem is that the current budgets are wrong.

<Bob> Ah! That statement might come across as a bit of a challenge to the Finance Department. What was their reaction?

<Leslie> To para-phrase it was “We are just breaking even in the current financial year so the current budget must be correct. Please do not dabble in things that you clearly do not understand.”

<Bob> OK. You can see their point. How did you reply?

<Leslie> I tried to explain the concepts of the Cost-Of-The-Queue and how that cost was incurred by one part of the system with one budget but that the queue was created by a different part of the system with a different budget. I tried to explain that just because the budgets were 100% utilised does not mean that the budgets were optimal.

<Bob> How was that explanation received?

<Leslie> They did not seem to understand what I was getting at and kept saying “Inventory is an asset on the balance sheet. If profit is zero we must have planned our budgets perfectly. We cannot shift money between budgets within year if the budgets are already perfect. Any variation will average out. We have to stick to the financial plan and projections for the year. It works. The problem is not Finance – the problem is you.

<Bob> OK. Have you described the Seventh Flow and put it in context?

<Leslie> Arrrgh! No! Of course! That is how I should have approached it. Budgets are Cash-Inventories and what we need is Cash-Flow to where and when it is needed and in just the right amount according to the Principle of Parsimonious Pull. Thank you. I knew you would ask the crunch question. That has given me a fresh perspective on it. I will have another go.

<Bob> Let know how you get on. I am curious to hear the next instalment of the story.

<Leslie> Will do. Bye for now.

Drrrrrrrr

construction_blueprint_meeting_150_wht_10887Creating a productive and stable system design requires considering Seven Flows at the same time. The Seventh Flow is cash flow.

Cash is like energy – it is only doing useful work when it is flowing.

Energy is often described as two forms – potential energy and and kinetic energy.  The ‘doing’ happens when one form is being converted from potential to kinetic. Cash in the budget is like potential energy – sitting there ready to do some business.  Cash flow is like kinetic energy – it is the business.

The most versatile form of energy that we use is electrical energy. It is versatile because it can easily be converted into other forms – e.g. heat, light and movement. Since the late 1800’s our whole society has become highly dependent on electrical energy.  But electrical energy is tricky to store and even now our battery technology is pretty feeble. So, if we want to store energy we use a different form – chemical energy.  Gas, oil and coal – the fossil fuels – are all ancient stores of chemical energy that were originally derived from sunlight captured by vast carboniferous forests over millions of years. These carbon-rich fossil fuels are convenient to store near where they are needed, and when they are needed. But fossil fuels have a number of drawbacks: One is that they release their stored carbon when they are “burned”.  Another is that they are not renewable.  So, in the future we will need to develop better ways to capture, transport, use and store the energy from the Sun that will flow in glorious abundance for millions of years to come.

Plants discovered millions of years ago how to do this sunlight-to-chemical energy conversion and that biological legacy is built into every cell in every plant on the planet. Animals just do the reverse trick – they convert chemical-to-electrical. Every cell in every animal on the planet is a microscopic electrical generator that “burns” chemical fuel – carbohydrate. The other products are carbon dioxide and water. Plants use sunlight to recycle and store the carbon dioxide. It is a resilient and sustainable design.

plant_growing_anim_150_wht_9902Plants seemingly have it easy – the sunlight comes to them – they just sunbathe all day!  The animals have to work a bit harder – they have to move about gathering their chemical fuel. Some animals just feed on plants, others feed on other animals, and we do a bit of both. This food-gathering is a more complicated affair – and it creates a problem. Animals need a constant supply of energy – so they have to carry a store of chemical fuel around with them. That store is heavy so it needs energy to move it about.  Herbivors can be bigger and less intelligent because their food does not run away.  Carnivors need to be more agile; both physically and mentally. A balance is required. A big enough fuel store but not too big.  So, some animals have evolved additional strategies. Animals have become very good at not wasting energy – because the more that is wasted the more food that is needed and the greater the risk of getting eaten or getting too weak to catch the next meal.

To illustrate how amazing animals are at energy conservation we just need to look at an animal structure like the heart. The heart is there to pump blood around. Blood carries chemical nutrients and waste from one “department” of the body to another – just like ships, rail, roads and planes carry stuff around the world.

cardiogram_heart_working_150_wht_5747Blood is a sticky, viscous fluid that requires considerable energy to pump around the body and, because it is pumped continuously by the heart, even a small improvement in the energy efficiency of the circulation design has a big long-term cumulative effect. The flow of blood to any part of the body must match the requirements of that part.  If the blood flow to your brain slows down for even few seconds the brain cannot work properly and you lose consciousness – it is called “fainting”.

If the flow of blood to the brain is stopped for just a few minutes then the brain cells actually die. That is called a “stroke”. Our brains use a lot of electrical energy to do their job and our brain cells do not have big stores of fuel – so they need constant re-supply. And our brains are electrically active all the time – even when we are sleeping.

Other parts of the body are similar. Muscles for instance. The difference is that the supply of blood that muscles need is very variable – it is low when resting and goes up with exercise. It has been estimated that the change in blood flow for a muscle can be 30 fold!  That variation creates a design problem for the body because we need to maintain the blood flow to brain at all times but we only want blood to be flowing to the muscles in just the amount that they need, where they need it and when they need it. And we want to minimise the energy required to pump the blood at all times. How then is the total and differential allocation of blood flow decided and controlled?  It is certainly not a conscious process.

stick_figure_turning_valve_150_wht_8583The answer is that the brain and the muscles control their own flow. It is called autoregulation.  They open the tap when needed and just as importantly they close the tap when not needed. It is called the Principle of Parsimonious Pull. The brain directs which muscles are active but it does not direct the blood supply that they need. They are left to do that themselves.

So, if we equate blood-flow and energy-flow to cash-flow then we arrive at a surprising conclusion. The optimal design, the most energy and cash efficient, is where the separate parts of the system continuously determine the energy/cash flow required for them to operate effectively. They control the supply. They autoregulate their cash-flow. They pull only what they need when they need it.

BUT

For this to work then every part of the system needs to have a collaborative and parsimonious pull-design philosophy – one that wastes as little energy and cash as possible.  Minimum waste of energy requires careful design – it is called ergonomic design. Minimum waste of cash requires careful design – it is called economic design.

business_figures_accusing_anim_150_wht_9821Many socioeconomic systems are fragmented and have parts that behave in a “greedy” manner and that compete with each other for resources. It is a dog-eat-dog design. They would use whatever resources they can get for fear of being starved. Greed is Good. Collaboration is Weak.  In such a competitive situation a rigid-budget design is a requirement because it helps prevent one part selfishly and blindly destabilising the whole system for all. The problem is that this rigid financial design blocks change so it blocks improvement.

This means that greedy, competitive, selfish systems are unable to self-improve.

So, when the world changes too much and their survival depends on change then they risk becoming extinct just as the dinosaurs did.

red_arrow_down_crash_400_wht_2751Many will challenge this assertion by saying “But competition drives up performance“.  Actually, it is not as simple as that. Competition will weed out the weakest who “die” and remove themselves from the equation – apparently increasing the average. What actually drives improvement is customer choice. Organisations that are able to self-improve will create higher-quality and lower-cost products and in a globally-connected-economy the customers will vote with their wallets. The greedy and selfish competition lags behind.

So, to ensure survival in a global economy the Seventh Flow cannot be rigidly restricted by annually allocated departmental budgets. It is a dinosaur design.

And there is no difference between public and private organisations. The laws of cash-flow physics are universal.

How then is the cash flow controlled?

The “trick” is to design a monitoring and feedback component into the system design. This is called the Sixth Flow – and it must be designed so that just the right amount of cash is pulled to the just the right places and at just the right time and for just as long as needed to maximise the revenue.  The rest of the design – First Flow to Fifth Flow ensure the total amount of cash needed is a minimum.  All Seven Flows are needed.

So the essential ingredient for financial stability and survival is Sixth and Seventh Flow Design capability. That skill has another name – it is called Value Stream Accounting which is a component of complex adaptive systems engineering (CASE).

What? Never heard of Value Stream Accounting?

Maybe that is just another Error of Omission?

Creep-Crack-Crunch

The current crisis of confidence in the NHS has all the hallmarks of a classic system behaviour called creep-crack-crunch.

The first obvious crunch may feel like a sudden shock but it is usually not a complete surprise and it is actually one of a series of cracks that are leading up to a BIG CRUNCH. These cracks are an early warning sign of pressure building up in parts of the system and causing localised failures. These cracks weaken the whole system. The underlying cause is called creep.

SanFrancisco_PostEarthquake

Earthquakes are a perfect example of this phenomemon. Geological time scales are measured in thousands of years and we now know that the surface of the earth is a dynamic structure with vast contient-sized plates of solid rock floating on a liquid core of molten magma. Over millions of years the continents have moved huge distances and the world we see today on our satellite images is just a single frame in a multi-billion year geological video.  That is the geological creep bit. The cracks first appear at the edges of these tectonic plates where they smash into each other, grind past each other or are pulled apart from each other.  The geological hot-spots are marked out on our global map by lofty mountain ranges, fissured earthquake zones, and deep mid-ocean trenches. And we know that when a geological crunch arrives it happens in a blink of the geological eye.

The panorama above shows the devastation of San Francisco caused by the 1906 earthquake. San Francisco is built on the San Andreas Fault – the junction between the Pacific plate and the North American plate. The dramatic volcanic eruption in Iceland in 2010 came and went in a matter of weeks but the irreversible disruption it caused for global air traffic will be felt for years. The undersea earthquakes that caused the devastating tsunamis in 2006 and 2011 lasted only a few minutes; the deadly shock waves crossed an ocean in a matter of hours; and when they arrived the silent killer wiped out whole shoreside communities in seconds. Tens of thousands of lives were lost and the social after-shocks of that geological-crunch will be felt for decades.

These are natural disasters. We have little or no influence over them. Human-engineered disasters are a different matter – and they are just as deadly.

The NHS is an example. We are all painfully aware of the recent crisis of confidence triggered by the Francis Report. Many could see the cracks appearing and tried to blow their warning whistles but with little effect – they were silenced with legal gagging clauses and the opening cracks were papered over. It was only after the crunch that we finally acknowledged what we already knew and we started to search for the creep. Remorse and revenge does not bring back those who have been lost.  We need to focus on the future and not just point at the past.

UK_PopulationPyramid_2013Socio-economic systems evolve at a pace that is measured in years. So when a social crunch happens it is necessary to look back several decades for the tell-tale symptoms of creep and the early signs of cracks appearing.

Two objective measures of a socio-economic system are population and expenditure.

Population is people-in-progress; and national expenditure is the flow of the cash required to keep the people-in-progress watered, fed, clothed, housed, healthy and occupied.

The diagram above is called a population pyramid and it shows the distribution by gender and age of the UK population in 2013. The wobbles tell a story. It does rather look like the profile of a bushy-eyebrowed, big-nosed, pointy-chinned old couple standing back-to-back and maybe there is a hidden message for us there?

The “eyebrow” between ages 67 and 62 is the increase in births that happened 62 to 67 years ago: betwee 1946 and 1951. The post WWII baby boom.  The “nose” of 42-52 year olds are the “children of the 60’s” which was a period of rapid economic growth and new optimism. The “upper lip” at 32-42 correlates with the 1970’s that was a period of stagnant growth,  high inflation, strikes, civil unrest and the dark threat of global thermonuclear war. This “stagflation” is now believed to have been triggered by political meddling in the Middle-East that led to the 1974 OPEC oil crisis and culminated in the “winter of discontent” in 1979.  The “chin” signals there was another population expansion in the 1980s when optimism returned (SALT-II was signed in 1979) and the economy was growing again. Then the “neck” contraction in the 1990’s after the 1987 Black Monday global stock market crash.  Perhaps the new optimism of the Third Millenium led to the “chest” expansion but the financial crisis that followed the sub-prime bubble to burst in 2008 has yet to show its impact on the population chart. This static chart only tells part of the story – the animated chart reveals a significant secondary expansion of the 20-30 year old age group over the last decade. This cannot have been caused by births and is evidence of immigration of a large number of young couples – probably from the expanding Europe Union.

If this “yo-yo” population pattern is repeated then the current economic downturn will be followed by a contraction at the birth end of the spectrum and possibly also net emigration. And that is a big worry because each population wave takes a 100 years to propagate through the system. The most economically productive population – the  20-60 year olds  – are the ones who pay the care bills for the rest. So having a population curve with lots of wobbles in it causes long term socio-economic instability.

Using this big-picture long-timescale perspective; evidence of an NHS safety and quality crunch; silenced voices of cracks being papered-over; let us look for the historical evidence of the creep.

Nowadays the data we need is literally at our fingertips – and there is a vast ocean of it to swim around in – and to drown in if we are not careful.  The Office of National Statistics (ONS) is a rich mine of UK socioeconomic data – it is the source of the histogram above.  The trick is to find the nuggets of knowledge in the haystack of facts and then to convert the tables of numbers into something that is a bit more digestible and meaningful. This is what Russ Ackoff descibes as the difference between Data and Information. The data-to-information conversion needs context.

Rule #1: Data without context is meaningless – and is at best worthless and at worse is dangerous.

boxes_connected_PA_150_wht_2762With respect to the NHS there is a Minotaur’s Labyrinth of data warehouses – it is fragmented but it is out there – in cyberspace. The Department of Health publishes some on public sites but it is a bit thin on context so it can be difficult to extract the meaning.

Relying on our memories to provide the necessary context is fraught with problems. Memories are subject to a whole range of distortions, deletions, denials and delusions.  The NHS has been in existence since 1948 and there are not many people who can personally remember the whole story with objective clarity.  Fortunately cyberspace again provides some of what we need and with a few minutes of surfing we can discover something like a website that chronicles the history of the NHS in decades from its creation in 1948 – http://www.nhshistory.net/ – created and maintained by one person and a goldmine of valuable context. The decade that is of particular interest is 1998-2007 – Chapter 6

With just some data and some context it is possible to pull together the outline of the bigger picture of the decade that led up to the Mid Staffordshire healthcare quality crunch.

We will look at this as a NHS system evolving over time within its broader UK context. Here is the time-series chart of the population of England – the source of the demand on the NHS.

Population_of_England_1984-2010This shows a significant and steady increase in population – 12% overall between 1984 an 2012.

This aggregate hides a 9% increase in the under 65 population and 29% growth in the over 65 age group.

This is hard evidence of demographic creep – a ticking health and social care time bomb. And the curve is getting steeper. The pressure is building.

The next bit of the map we need is a measure of the flow through hospitals – the activity – and this data is available as the annual HES (Hospital Episodes Statistics) reports.  The full reports are hundreds of pages of fine detail but the headline summaries contain enough for our present purpose.

NHS_HES_Admissions_1997-2011

The time- series chart shows a steady increase in hospital admissions. Drilling into the summaries revealed that just over a third are emergency admissions and the rest are planned or maternity.

In the decade from 1998 to 2008 there was a 25% increase in hospital activity. This means more work for someone – but how much more and who for?

But does it imply more NHS beds?

Beds require wards, buildings and infrastructure – but it is the staff that deliver the health care. The bed is just a means of storage.  One measure of capacity and cost is the number of staffed beds available to be filled.  But this like measuring the number of spaces in a car park – it does not say much about flow – it is a just measure of maximum possible work in progress – the available space to hold the queue of patients who are somewhere between admission and discharge.

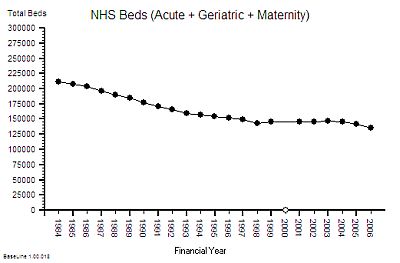
Here is the time series chart of the number of NHS beds from 1984 to 2006. The was a big fall in the number of beds in the decade after 1984 [Why was that?]

NHS_Beds_1984-2006

Between 1997 and 2007 there was about a 10% fall in the number of beds. The NHS patient warehouse was getting smaller.

But the activity – the flow – grew by 25% over the same time period: so the Laws Of Physics say that the flow must have been faster.

The average length of stay must have been falling.

This insight has another implication – fewer beds must mean smaller hospitals and lower costs – yes?  After all everyone seems to equate beds-to-cost; more-beds-cost-more less-beds-cost-less. It sounds reasonable. But higher flow means more demand and more workload so that would require more staff – and that means higher costs. So which is it? Less, the same or more cost?

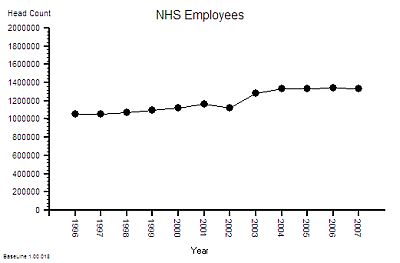
NHS_Employees_1996_2007The published data says that staff headcount  went up by 25% – which correlates with the increase in activity. That makes sense.

And it looks like it “jumped” up in 2003 so something must have triggered that. More cash pumped into the system perhaps? Was that the effect of the Wanless Report?

But what type of staff? Doctors? Nurses? Admin and Clerical? Managers?  The European Working Time Directive (EWTD) forced junior doctors hours down and prompted an expansion of consultants to take on the displaced service work. There was also a gradual move towards specialisation and multi-disciplinary teams. What impact would that have on cost? Higher most likely. The system is getting more complex.

Of course not all costs have the same impact on the system. About 4% of staff are classified as “management” and it is this group that are responsible for strategic and tactical planning. Managers plan the work – workers work the plan.  The cost and efficiency of the management component of the system is not as useful a metric as the effectiveness of its collective decision making. Unfortuately there does not appear to be any published data on management decision making qualty and effectiveness. So we cannot estimate cost-effectiveness. Perhaps that is because it is not as easy to measure effectiveness as it is to count admissions, discharges, head counts, costs and deaths. Some things that count cannot easily be counted. The 4% number is also meaningless. The human head represents about 4% of the bodyweight of an adult person – and we all know that it is not the size of our heads that is important it is the effectiveness of the decisions that it makes which really counts!  Effectiveness, efficiency and costs are not the same thing.

Back to the story. The number of beds went down by 10% and number of staff went up by 25% which means that the staff-per-bed ratio went up by nearly 40%.  Does this mean that each bed has become 25% more productive or 40% more productive or less productive? [What exactly do we mean by “productivity”?]

To answer that we need to know what the beds produced – the discharges from hospital and not just the total number, we need the “last discharges” that signal the end of an episode of hospital care.

NHS_LastDischarges_1998-2011The time-series chart of last-discharges shows the same pattern as the admissions: as we would expect.

This output has two components – patients who leave alive and those who do not.

So what happened to the number of deaths per year over this period of time?

That data is also published annually in the Hospital Episode Statistics (HES) summaries.

This is what it shows ….

NHS_Absolute_Deaths_1998-2011The absolute hospital mortality is reducing over time – but not steadily. It went up and down between 2000 and 2005 – and has continued on a downward trend since then.

And to put this into context – the UK annual mortality is about 600,000 per year. That means that only about 40% of deaths happen in hospitals. UK annual mortality is falling and births are rising so the population is growing bigger and older.  [My head is now starting to ache trying to juggle all these numbers and pictures in it].

This is not the whole story though – if the absolute hospital activity is going up and the absolute hospital mortality is going down then this raw mortality number may not be telling the whole picture. To correct for those effects we need the ratio – the Hospital Mortality Ratio (HMR).

NHS_HospitalMortalityRatio_1998-2011This is the result of combining these two metrics – a 40% reduction in the hospital mortality ratio.

Does this mean that NHS hospitals are getting safer over time?

This observed behaviour can be caused by hospitals getting safer – it can also be caused by hospitals doing more low-risk work that creates a dilution effect. We would need to dig deeper to find out which. But that will distract us from telling the story.

Back to productivity.

The other part of the productivity equation is cost.

So what about NHS costs?  A bigger, older population, more activity, more staff, and better outcomes will all cost more taxpayer cash, surely! But how much more?  The activity and head count has gone up by 25% so has cost gone up by the same amount?

NHS_Annual_SpendThis is the time-series chart of the cost per year of the NHS and because buying power changes over time it has been adjusted using the Consumer Price Index using 2009 as the reference year – so the historical cost is roughly comparable with current prices.

The cost has gone up by 100% in one decade!  That is a lot more than 25%.

The published financial data for 2006-2010 shows that the proportion of NHS spending that goes to hospitals is about 50% and this has been relatively stable over that period – so it is reasonable to say that the increase in cash flowing to hospitals has been about 100% too.

So if the cost of hospitals is going up faster than the output then productivity is falling – and in this case it works out as a 37% drop in productivity (25% increase in activity for 100% increase in cost = 37% fall in productivity).

So the available data which anyone with a computer, an internet connection, and some curiosity can get; and with bit of spreadsheet noggin can turn into pictures shows that over the decade of growth that led up to the the Mid Staffs crunch we had:

1. A slightly bigger population; and a
2. significantly older population; and a
3. 25% increase in NHS hospital activity; and a
4. 10% fall in NHS beds; and a
5. 25% increase in NHS staff; which gives a
6. 40% increase in staff-per-bed ratio; an an
7. 8% reduction in absolute hospital mortality; which gives a
8. 40% reduction in relative hospital mortality; and a
9. 100% increase in NHS  hospital cost; which gives a
10. 37% fall drop in “hospital productivity”.

An experienced Improvement Scientist knows that a system that has been left to evolve by creep-crack-and-crunch can be re-designed to deliver higher quality and higher flow at lower total cost.

The safety creep at Mid-Staffs is now there for all to see. A crack has appeared in our confidence in the NHS – and raises a couple of crunch questions:

Where Has All The Extra Money Gone?

 How Will We Avoid The BIG CRUNCH?

The huge increase in NHS funding over the last decade was the recommendation of the Wanless Report but the impact of implementing the recommendations has never been fully explored. Healthcare is a service system that is designed to deliver two intangible products – health and care. So the major cost is staff-time – particularly the clinical staff.  A 25% increase in head count and a 100% increase in cost implies that the heads are getting more expensive.  Either a higher proportion of more expensive clinically trained and registered staff, or more pay for the existing staff or both.  The evidence shows that about 50% of NHS Staff are doctors and nurses and over the last decade there has been a bigger increase in the number of doctors than nurses. Added to that the Agenda for Change programme effectively increased the total wage bill and the new contracts for GPs and Consultants added more upward wage pressure.  This is cost creep and it adds up over time. The Kings Fund looked at the impact in 2006 and suggested that, in that year alone, 72% of the additional money was sucked up by bigger wage bills and other cost-pressures! The previous year they estimated 87% of the “new money” had disappeared hte same way. The extra cash is gushing though the cracks in the bottom of the fiscal bucket that had been clumsily papered-over. And these are recurring revenue costs so they add up over time into a future financial crunch.  The biggest one may be yet to come – the generous final-salary pensions that public-sector employees enjoy!

So it is even more important that the increasingly expensive clinical staff are not being forced to spend their time doing work that has no direct or indirect benefit to patients.

Trying to do a good job in a poorly designed system is both frustrating and demotivating – and the outcome can be a cynical attitude of “I only work here to pay the bills“. But as public sector wages go up and private sector pensions evaporate the cynics are stuck in a miserable job that they cannot afford to give up. And their negative behaviour poisons the whole pool. That is the long term cumulative cultural and financial cost of poor NHS process design. That is the outcome of not investing earlier in developing an Improvement Science capability.

The good news is that the time-series charts illustrate that the NHS is behaving like any other complex, adaptive, human-engineered value system. This means that the theory, techniques and tools of Improvement Science and value system design can be applied to answer these questions. It means that the root causes of the excessive costs can be diagnosed and selectively removed without compromising safety and quality. It means that the savings can be wisely re-invested to improve the resilience of some parts and to provide capacity in other parts to absorb the expected increases in demand that are coming down the population pipe.

This is Improvement Science. It is a learnable skill.

18/03/2013: Update

The question “Where Has The Money Gone?” has now been asked at the Public Accounts Committee


Robert Francis QC

press_on_screen_anim_150_wht_7028Today is an important day.

The Robert Francis QC Report and recommendations from the Mid-Staffordshire Hospital Crisis has been published – and it is a sobering read.  The emotions that just the executive summary evoked in me were sadness, shame and anger.  Sadness for the patients, relatives, and staff who have been irreversibly damaged; shame that the clinical professionals turned a blind-eye; and anger that the root cause has still not been exposed to public scrutiny.

Click here to get a copy of the RFQC Report Executive Summary.

Click here to see the video of RFQC describing his findings. 

The root cause is ignorance at all levels of the NHS.  Not stupidity. Not malevolence. Just ignorance.

Ignorance of what is possible and ignorance of how to achieve it.

RFQC rightly focusses his recommendations on putting patients at the centre of healthcare and on making those paid to deliver care accountable for the outcomes.  Disappointingly, the report is notably thin on the financial dimension other than saying that financial targets took priority over safety and quality.  He is correct. They did. But the report does not say that this is unnecessary – it just says “in future put safety before finance” and in so doing he does not challenge the belief that we are playing a zero-sum-game. The  assumotion that higher-quality-always-costs-more.

This assumption is wrong and can easily be disproved.

A system that has been designed to deliver safety-and-quality-on-time-first-time-and-every-time costs less. And it costs less because the cost of errors, checking, rework, queues, investigation, compensation, inspectors, correctors, fixers, chasers, and all the other expensive-high-level-hot-air-generation-machinery that overburdens the NHS and that RFQC has pointed squarely at is unnecessary.  He says “simplify” which is a step in the right direction. The goal is to render it irrelevent.

The ignorance is ignorance of how to design a healthcare system that works right-first-time. The fact that the Francis Report even exists and is pointing its uncomfortable fingers-of-evidence at every level of the NHS from ward to government is tangible proof of this collective ignorance of system design.

And the good news is that this collective ignorance is also unnecessary … because the knowledge of how to design safe-and-affordable systems already exists. We just have to learn how. I call it 6M Design® – but  the label is irrelevent – the knowledge exists and the evidence that it works exists.

So here are some of the RFQC recommendations viewed though a 6M Design® lens:       

1.131 Compliance with the fundamental standards should be policed by reference to developing the CQC’s outcomes into a specification of indicators and metrics by which it intends to monitor compliance. These indicators should, where possible, be produced by the National Institute for Health and Clinical Excellence (NICE) in the form of evidence-based procedures and practice which provide a practical means of compliance and of measuring compliance with fundamental standards.

This is the safety-and-quality outcome specification for a healthcare system design – the required outcome presented as a relevent metric in time-series format and qualified by context.  Only a stable outcome can be compared with a reference standard to assess the system capability. An unstable outcome metric requires inquiry to understand the root cause and an appropriate action to restore stability. A stable but incapable outcome performance requires redesign to achieve both stability and capability. And if  the terms used above are unfamiliar then that is further evidence of system-design-ignorance.   
 
1.132 The procedures and metrics produced by NICE should include evidence-based tools for establishing the staffing needs of each service. These measures need to be readily understood and accepted by the public and healthcare professionals.

This is the capacity-and-cost specification of any healthcare system design – the financial envelope within which the system must operate. The system capacity design works backwards from this constraint in the manner of “We have this much resource – what design of our system is capable of delivering the required safety and quality outcome with this capacity?”  The essence of this challenge is to identify the components of poor (i.e. wasteful) design in the existing systems and remove or replace them with less wasteful designs that achieve the same or better quality outcomes. This is not impossible but it does require system diagnostic and design capability. If the NHS had enough of those skills then the Francis Report would not exist.

1.133 Adoption of these practices, or at least their equivalent, is likely to help ensure patients’ safety. Where NICE is unable to produce relevant procedures, metrics or guidance, assistance could be sought and commissioned from the Royal Colleges or other third-party organisations, as felt appropriate by the CQC, in establishing these procedures and practices to assist compliance with the fundamental standards.

How to implement evidence-based research in the messy real world is the Elephant in the Room. It is possible but it requires techniques and tools that fall outside the traditional research and audit framework – or rather that sit between research and audit. This is where Improvement Science sits. The fact that the Report only mentions evidence-based practice and audit implies that the NHS is still ignorant of this gap and what fills it – and so it appears is RFQC.   

1.136 Information needs to be used effectively by regulators and other stakeholders in the system wherever possible by use of shared databases. Regulators should ensure that they use the valuable information contained in complaints and many other sources. The CQC’s quality risk profile is a valuable tool, but it is not a substitute for active regulatory oversight by inspectors, and is not intended to be.

Databases store data. Sharing databases will share data. Data is not information. Information requires data and the context for that data.  Furthermore having been informed does not imply either knowledge or understanding. So in addition to sharing information, the capability to convert information-into-decision is also required. And the decisions we want are called “wise decisions” which are those that result in actions and inactions that lead inevitably to the intended outcome.  The knowledge of how to do this exists but the NHS seems ignorant of it. So the challenge is one of education not of yet more investigation.

1.137 Inspection should remain the central method for monitoring compliance with fundamental standards. A specialist cadre of hospital inspectors should be established, and consideration needs to be given to collaborative inspections with other agencies and a greater exploitation of peer review techniques.

This is audit. This is the sixth stage of a 6M Design® – the Maintain step.  Inspectors need to know what they are looking for, the errors of commission and the errors of omission;  and to know what those errors imply and what to do to identify and correct the root cause of these errors when discovered. The first cadre of inspectors will need to be fully trained in healthcare systems design and healthcare systems improvement – in short – they need to be Healthcare Improvementologists. And they too will need to be subject to the same framework of accreditation, and accountability as those who work in the system they are inspecting.  This will be one of the greatest of the challenges. The fact that the Francis report exists implies that we do not have such a cadre. Who will train, accredit and inspect the inspectors? Who has proven themselves competent in reality (not rhetorically)?

1.163 Responsibility for driving improvement in the quality of service should therefore rest with the commissioners through their commissioning arrangements. Commissioners should promote improvement by requiring compliance with enhanced standards that demand more of the provider than the fundamental standards.

This means that commissioners will need to understand what improvement requires and to include that expectation in their commissioning contracts. This challenge is even geater that the creation of a “cadre of inspectors”. What is required is a “generation of competent commissioners” who are also experienced and who have demonstrated competence in healthcare system design. The Commissioners-of-the-Future will need to be experienced healthcare improvementologists.

The NHS is sick – very sick. The medicine it needs to restore its health and vitality does exist – and it will not taste very nice – but to withold an effective treatment for an serious illness on that basis is clinical negligence.

It is time for the NHS to look in the mirror and take the strong medicine. The effect is quick – it will start to feel better almost immediately. 

To deliver safety and quality and quickly and affordably is possible – and if you do not believe that then you will need to muster the humility to ask to have the how demonstrated.

6MDesign


Curing Chronic Carveoutosis

pin_marker_lighting_up_150_wht_6683Last week the Ray Of Hope briefly illuminated a very common system design disease called carveoutosis.  This week the RoH will tarry a little longer to illuminate an example that reveals the value of diagnosing and treating this endemic process ailment.

Do you remember the days when we used to have to visit the Central Post Office in our lunch hour to access a quality-of-life-critical service that only a Central Post Office could provide – like getting a new road tax disc for our car?  On walking through the impressive Victorian entrances of these stalwart high street institutions our primary challenge was to decide which queue to join.

In front of each gleaming mahogony, brass and glass counter was a queue of waiting customers. Behind was the Post Office operative. We knew from experience that to be in-and-out before our lunch hour expired required deep understanding of the ways of people and processes – and a savvy selection.  Some queues were longer than others. Was that because there was a particularly slow operative behind that counter? Or was it because there was a particularly complex postal problem being processed? Or was it because the customers who had been waiting longer had identified that queue was fast flowing and had defected to it from their more torpid streams? We know that size is not a reliable indicator of speed or quality.figure_juggling_time_150_wht_4437

The social pressure is now mounting … we must choose … dithering is a sign of weakness … and swapping queues later is another abhorrent behaviour. So we employ our most trusted heuristic – we join the end of the shortest queue. Sometimes it is a good choice, sometimes not so good!  But intuitively it feels like the best option.

Of course  if we choose wisely and we succeed in leap-frogging our fellow customers then we can swagger (just a bit) on the way out. And if not we can scowl and mutter oaths at others who (by sheer luck) leap frog us. The Post Office Game is fertile soil for the Aint’ It Awful game which we play when we arrive back at work.

single_file_line_PA_150_wht_3113But those days are past and now we are more likely to encounter a single-queue when we are forced by necessity to embark on a midday shopping sortie. As we enter we see the path of the snake thoughtfully marked out with rope barriers or with shelves hopefully stacked with just-what-we-need bargains to stock up on as we drift past.  We are processed FIFO (first-in-first-out) which is fairer-for-all and avoids the challenge of the dreaded choice-of-queue. But the single-queue snake brings a new challenge: when we reach the head of the snake we must identify which operative has become available first – and quickly!

Because if we falter then we will incur the shame of the finger-wagging or the flashing red neon arrow that is easily visible to the whole snake; and a painful jab in the ribs from the impatient snaker behind us; and a chorus of tuts from the tail of the snake. So as we frantically scan left and right along the line of bullet-proof glass cells looking for clues of imminent availability we run the risk of developing acute vertigo or a painful repetitive-strain neck injury!

stick_figure_sitting_confused_150_wht_2587So is the single-queue design better?  Do we actually wait less time, the same time or more time? Do we pay a fair price for fair-for-all queue design? The answer is not intuitively obvious because when we are forced to join a lone and long queue it goes against our gut instinct. We feel the urge to push.

The short answer is “Yes”.  A single-queue feeding tasks to parallel-servers is actually a better design. And if we ask the Queue Theorists then they will dazzle us with complex equations that prove it is a better design – in theory.  But the scary-maths does not help us to understand how it is a better design. Most of us are not able to convert equations into experience; academic rhetoric into pragmatic reality. We need to see it with our own eyes to know it and understand it. Because we know that reality is messier than theory.    

And if it is a better design then just how much better is it?

To illustrate the potential advantage of a single-queue design we need to push the competing candiates to their performance limits and then measure the difference. We need a real example and some real data. We are Improvementologists! 

First we need to map our Post Office process – and that reveals that we have a single step process – just the counter. That is about as simple as a process gets. Our map also shows that we have a row of counters of which five are manned by fully trained Post Office service operatives.

stick_figure_run_clock_150_wht_7094Now we can measure our process and when we do that we find that we get an average of 30 customers per hour walking in the entrance and and average of 30 cusomers an hour walking out. Flow-out equals flow-in. Activity equals demand. And the average flow is one every 2 minutes. So far so good. We then observe our five operatives and we find that the average time from starting to serve one customer to starting to serve the next is 10 minutes. We know from our IS training that this is the cycle time. Good.

So we do a quick napkin calculation to check and that the numbers make sense: our system of five operatives working in parallel, each with an average cycle time of 10 minutes can collectively process a customer on average every 2 minutes – that is 30 per hour on average. So it appears we have just enough capacity to keep up with the flow of work  – we are at the limit of efficiency.  Good.

CarveOut_00We also notice that there is variation in the cycle time from customer to customer – so we plot our individual measurements asa time-series chart. There does not seem to be an obvious pattern – it looks random – and BaseLine says that it is statistically stable. Our chart tells us that a range of 5 to 15 minutes is a reasonable expectation to set.

We also observe that there is always a queue of waiting customers somewhere – and although the queues fluctuate in size and location they are always there.

 So there is always a wait for some customers. A variable wait; an unpredictable wait. And that is a concern for us because when the queues are too numerous and too long then we see customers get agitated, look at their watches, shrug their shoulders and leave – taking their custom and our income with them and no doubt telling all their friends of their poor experience. Long queues and long waits are bad for business.

And we do not want zero queues either because if there is no queue and our operatives run out of work then they become under-utilised and our system efficiency and productivity falls.  That means we are incurring a cost but not generating an income. No queues and idle resources are bad for business too.

And we do not want a mixture of quick queues and slow queues because that causes complaints and conflict.  A high-conflict customer complaint experience is bad for business too! 

What we want is a design that creates small and stable queues; ones that are just big enough to keep our operatives busy and our customers not waiting too long.

So which is the better design and how much better is it? Five-queues or a single-queue? Carve-out or no-carve-out?

To find the answer we decide to conduct a week-long series of experiments on our system and use real data to reveal the answer. We choose the time from a customer arriving to the same customer leaving as our measure of quality and performance – and we know that the best we can expect is somewhere between 5 and 15 minutes.  We know from our IS training that is called the Lead Time.

time_moving_fast_150_wht_10108On day #1 we arrange our Post Office with five queues – clearly roped out – one for each manned counter.  We know from our mapping and measuring that customers do not arrive in a steady stream and we fear that may confound our experiment so we arrange to admit only one of our loyal and willing customers every 2 minutes. We also advise our loyal and willing customers which queue they must join before they enter to avoid the customer choice challenges.  We decide which queue using a random number generator – we toss a dice until we get a number between 1 and 5.  We record the time the customer enters on a slip of paper and we ask the customer to give it to the operative and we instruct our service operatives to record the time they completed their work on the same slip and keep it for us to analyse later. We run the experiment for only 1 hour so that we have a sample of 30 slips and then we collect the slips,  calculate the difference between the arrival and departure times and plot them on a time-series chart in the order of arrival.

CarveOut_01This is what we found.  Given that the time at the counter is an average of 10 minutes then some of these lead times seem quite long. Some customers spend more time waiting than being served. And we sense that the performance is getting worse over time.

So for the next experiment we decide to open a sixth counter and to rope off a sixth queue. We expect that increasing capacity will reduce waiting time and we confidently expect the performance to improve.

On day #2 we run our experiment again, letting customers in one every 2 minutes as before and this time we use all the numbers on the dice to decide which queue to direct each customer to.  At the end of the hour we collect the slips, calculate the lead times and plot the data – on the same chart.

CarveOut_02This is what we see.

It does not look much better and that is big surprise!

The wide variation from customer to customer looks about the same but with the Eye of Optimism we get a sense that the overall performance looks a bit more stable.

So we conclude that adding capacity (and cost) may make a small difference.

But then we remember that we still only served 30 customers – which means that our income stayed the same while our cost increased by 20%. That is definitely NOT good for business: it is not goiug to look good in a business case “possible marginally better quality and 20% increase in cost and therefore price!”

So on day #3 we change the layout. This time we go back to five counters but we re-arrange the ropes to create a single-queue so the customer at the front can be ‘pulled’ to the first available counter. Everything else stays the same – one customer arriving every 2 minutes, the dice, the slips of paper, everything.  At the end of the hour we collect the slips, do our sums and plot our chart.

CarveOut_03And this is what we get! The improvement is dramatic. Both the average and the variation has fallen – especially the variation. But surely this cannot be right. The improvement is too good to be true. We check our data again. Yes, our customers arrived and departed on average one every 2 minutes as before; and all our operatives did the work in an average of 10 minutes just as before. And we had the exactly the same capacity as we had on day #1. And we finished on time. It is correct. We are gobsmaked. It is like a magic wand has been waved over our process. We never would have predicted  that just moving the ropes around to could have such a big impact.  The Queue Theorists were correct after all!

But wait a minute! We are delivering a much better customer experience in terms of waiting time and at the same cost. So could we do even better with six counters open? What will happen if we keep the single-queue design and open the sixth desk?  Before it made little difference but now we doubt our ability to guess what will happen. Our intuition seems to keep tricking us. We are losing our confidence in predicting what the impact will be. We are in counter-intuitive land! We need to run the experiment for real.

So on day #4 we keep the single-queue and we open six desks. We await the data eagerly.

CarveOut_04And this is what happened. Increasing the capacity by 20% has made virtually no difference – again. So we now have two pieces of evidence that say – adding extra capacity did not make a difference to waiting times. The variation looks a bit less though but it is marginal.

It was changing the Queue Design that made the difference! And that change cost nothing. Rien. Nada. Zippo!

That will look much better in our report but now we have to face the emotional discomfort of having to re-evaluate one of our deepest held assumptions.

Reality is telling us that we are delivering a better quality experience using exactly the same resources and it cost nothing to achieve. Higher quality did NOT cost more. In fact we can see that with a carve-out design when we added capacity we just increased the cost we did NOT improve quality. Wow!  That is a shock. Everything we have been led to believe seems to be flawed.

Our senior managers are not going to like this message at all! We will be challening their dogma directly. And they do not like that. Oh dear! 

Now we can see how much better a no-carveout single-queue pull-design can work; and now we can explain why single-queue designs  are used; and now we can show others our experiment and our data and if they do not believe us they can repeat the experiment themselves.  And we can see that it does not need a real Post Office – a pad of Post It® Notes, a few stopwatches and some willing helpers is all we need.

And even though we have seen it with our own eyes we still struggle to explain how the single-queue design works better. What actually happens? And we still have that niggling feeling that the performance on day #1 was unstable.  We need to do some more exploring.

So we run the day#1 experiment again – the five queues – but this time we run it for a whole day, not just an hour.

CarveOut_06

Ah ha!   Our hunch was right.  It is an unstable design. Over time the variation gets bigger and bigger.

But how can that happen?

Then we remember. We told the customers that they could not choose the shortest queue or change queue after they had joined it.  In effect we said “do not look at the other queues“.

And that happens all the time on our systems when we jealously hide performance data from each other! If we are seen to have a smaller queue we get given extra work by the management or told to slow down by the union rep!  

So what do we do now?  All we are doing is trying to improve the service and all we seem to be achieving is annoying more and more people.

What if we apply a maximum waiting time target, say of 1 hour, and allow customers to jump to the front of their queue if they are at risk if breaching the target? That will smooth out spikes and give everyone a fair chance. Customers will understand. It is intuitively obvious and common sense. But our intuition has tricked us before … 

So we run the experiment again and this time we tell our customers that if they wait 50 minutes then they can jump to the front of their queue. They appreciate this because they now have a upper limit on the time they will wait.  

CarveOut_07And this is what we observe. It looks better than before, at least initially, and then it goes pear-shaped.

All we have done with our ‘carve-out and-expedite-the-long-waiters’ design is to defer the inevitable – the crunch. We cannot keep our promise. By the end everyone is pushing to the frontof the queue. It is a riot!  

And there is more. Look at the lead time for the last few customers – two hours. Not only have they waited a long time, but we have had to stay open for two hours longer. That is a BIG cost pessure in overtime payments.

So, whatever way we look at it: a single-queue design is better.  And no one loses out! The customers have a short and predictable waiting time; the operatives are kept occupied and go home on time; and the executives bask in the reflected glory of the excellent customer feedback.  It is a Three Wins® design.

Seeing is believing – and we now know that it is worth diagnosing and treating carveoutosis.

And the only thing left to do is to explain is how a single-queue design works better. It is not obvious is it? 

puzzle_lightbulb_build_PA_150_wht_4587And the best way to do that is to play the Post Office Game and see what actually happens. 

A big light-bulb moment awaits!


Update: My little Sylvanian friends have tried the Post Office Game and kindly sent me this video of the before  Sylvanian Post Office Before and the after Sylvanian Post Office After. They say they now know how the single-queue design works better. 


Defusing Trust Eroders – Part III

<Bing Bong>

laptop_mail_PA_150_wht_2109Leslie’s computer heralded the arrival of yet another email!  They were coming in faster and faster – now that the word had got out on the grapevine about Improvementology

Leslie glanced at the sender. It was from Bob. That was a surprise. Bob had never emailed out-of-the-blue before.  Leslie was too impatient to wait until later to read the email.

<Dear Leslie, could I trouble you to ask your advice on something. It is not urgent.  A ten minute chat on the phone would be all I need. If that is OK please let me know a good time is and I will ring you. Bob>

Leslie was consumed with curiosity. What could Bob possibly want advice on? It was Leslie who sought advice from Bob – not the other way around.

Leslie could not wait and emailed back immediately that it was OK to talk now.

<Ring Ring>

Hello Bob, what a pleasant surprise! I am very curious to know what you need my advice about.

? Thank you Leslie.  What I would like your counsel on is how to engage in learning the science of improvement.

Wow!  That is a surprising question. I am really confused now. You helped me to learn this new thinking and now you are asking me to teach you?

? Yes. On the surface it seems counter-intuitive. It is a genuine request though. I need to learn and understand what works for you and what does not.

OK. I think I am getting an idea of what you are asking.  But I am only just getting grips with the basics. I do not know how to engage others yet and I certainly would not be able to teach anyone!

? I must apologise. I was not clear in my request. I need to understand how you engaged yourself in learning. I only provided the germ of the idea – it was you who added what was needed for it to develop into something tangible and valuable for you.  I need to understand how that happened.

Ahhhh! I see what you mean. Yes. Let me think. Would it help if I describe my current mental metaphor?

? That sounds like an excellent plan.

OK. Well your phrase ‘germ of an idea’ was a trigger. I see the science of improvement as a seed of information that grows into a sturdy tree of understanding.  Just like the ‘tiny acorn into the mighty oak’ concept.  Using that seed-to-tree metaphor helped me to appreciate that the seed is necessary but it is not sufficient. There are other things that are needed too. Soil, water, air, sunlight, and protection from hazards and predators.

I then realised that the seed-to-tree metaphor goes deeper.  One insight that I had was when I realised that the first few leaves are critical to success – because they provide the ongoing energy and food to support the growth of more leaves, and the twigs, branches, trunk, and roots that support the leaves and supply them with water and nutrients.  I see the tree as synergistic system that has a common purpose: to become big enough and stable enough to be able to survive the inevitable ups-and-downs of reality. To weather the winter storms and survive the summer droughts.

plant_metaphor_240x135It seemed to me that the first leaf needed to be labelled ‘safety’ because in our industry if we damage our customers or our staff we do not get a second chance!  The next leaf to grow is labelled ‘quality’ and that means quality-by-design.  Doing the right thing and doing it right first time without needing inspection-and-correction. The safety and quality leaves provide the resources needed to grow the next leaf which I labelled ‘delivery’.  Getting the work done in time, on time, every time.  Together these three leaves support the growth of the fourth – ‘economy’ which means using only what is necessaryand also having just enough reserve to ride over the inevitable rocks and ruts in the road of reality.

I then reflected on what the water and the sunshine would represent when applying improvement science in the real world.

It occurred to me that the water in the tree is like money in a real system.  It is required for both growth and health; it must flow to where it is needed, when it is needed and as much as needed. Too little will prevent growth, and too much water at the wrong time and wrong place is just as unhealthy.  I did some reading about the biology of trees and I learned that the water is pulled up the tree! The ‘suck’ is created by the water evaporating from the leaves. The plant does not have a committee that decides where the available water should go! It is a simple self-adjusting system.  

The sunshine for the tree is like feedback for people. In a plant the suns energy provides the motive force for the whole system.  In our organisations we call it motivation and the feedback loop is critical to success. Keeping people in the dark about what is required and how they are doing is demotivating.  Healthy organisations are feedback-fuelled!

? Yes. I see the picture in my mind clearly. That is a powerful metaphor. How did it help overcome the natural resistance to change?

Well using the 6M Design method and taking the ‘sturdy tree of understanding’ as the objective of the seed-to-tree process I then considered what the possible ways it could fail – the failure modes and effects analysis method that you taught me.

? OK. Yes I see how that approach would help – approaching the problem from the far side of the invisible barrier. What insights did that lead to?

poison_faucet_150_wht_9860Well it highlighted that just having enough water and enough sunshine was not sufficient – it had to be clean water and the right sort of sunshine.  The quality is as critical as the quantity. A toxic environment will kill tender new shoots of improvement long before they can get established.  Cynicism is like cyanide! Non-specific cost cutting is like blindly wielding a pair of sharp secateurs. Ignoring the competition from wasteful weeds and political predators is a guaranteed recipe-for-failure too.       

This metaphor really helped because it allowed me to draw up a checklist of necessary conditions for successful growth of knowledge and understanding.  Rather like the shopping list that a gardener might have. Viable seeds, fertile soil, clean water, enough sunlight, and protection from threats and hazards, especially in the early stages. And patience. Growing from seed takes time. Not all seeds will germinate. Not all seeds can thrive in the context our gardener is able to create.  And the harsher the elements the fewer the types of seed that have any chance of survival. The conditions select the successful seeds. Deserts select plants that hoard water so the desert remains a desert. If money is too tight the miserly will thrive at the expense of the charitable – and money remains hoarded and fought over as the organisation withers. And the timing is crucial – the seeds need to be planted at the right time in the cycle of change.  Too early and they cannot germinateg, too late and they do not have time to become strong enough to survive in the real world.    

? Yes. I see. The deeper you dig into your seeds-to-trees metaphor the more insightful it becomes.

Bob, you just said something really profound then that has unlocked something for me.

? Did I? What was it?

RainForestYou said ‘seeds-to-trees’.  Up until you said that I was unconsciously limiting myself to one-seed-to-one-tree. Of course! If it works for the individual it can work for the collective.  Woods and forests are collectives. The best example I can think of is a tropical rainforest.  With ample water and sunshine the plant-collective creates a synergistic system that has endured millions of years of global climate change. And one of the striking features of the tropical rain forest is the diversity of species. It is as if that diversity is an important part of the design. Competition is ever present though – all the trees compete for sunlight – but it is healthy competition. Trees do not succeed individually by hunting each other down. And the diversity seems to be an important component of healthy competition too. It is as if they are in a shared race to the sun and their differences are an asset rather than a liability. If all the trees were the same the forest would be at greater risk of all making the same biological blunder and suddenly becoming extinct if their environment changes unpredictably.  Uniformity only seems to work in harsh conditions.

? That is a profound observation Leslie. I had not consciously made that distinction.

So have I answered your question? Have I helped you? It has certainly helped me by being asked to putting my thoughts into words. I see it clearer too now.

? Yes. You are a good teacher. I believe others will resonate with your seeds-to-trees metaphor just as I have.

Thank you Bob. I believe I am beginning to understand something you said in a previous conversation – “the teacher is the person who learns the most”.  I am going to test our seeds-to-trees metaphor on the real world! And I will feedback what I learn – because in doing that I will amplify and clarify my own learning.

? Thank you Leslie. I look forward to learning with you.


Defusing Trust Eroders – Part I

Defusing Trust Eroders – Part II


The Six Dice Game

<Ring Ring><Ring Ring>

?Hello, you are through to the Improvement Science Helpline. How can we help?

This is Leslie, one of your FISH apprentices.  Could I speak to Bob – my ISP coach?

?Yes, Bob is free. I will connect you now.

<Ring Ring><Ring Ring>

?Hello Leslie, Bob here. How can I help?

Hi Bob, I have a problem that I do not feel my Foundation training has equipped me to solve. Can I talk it through with you?

?Of course. Can you outline the context for me?

Yes. The context is a department that is delivering an acceptable quality-of-service and is delivering on-time but is failing financially. As you know we are all being forced to adopt austerity measures and I am concerned that if their budget is cut then they will fail on delivery and may start cutting corners and then fail on quality too.  We need a win-win-win outcome and I do not know where to start with this one.

?OK – are you using the 6M Design method?

Yes – of course!

?OK – have you done The 4N Chart for the customer of their service?

Yes – it was their customers who asked me if I could help and that is what I used to get the context.

?OK – have you done The 4N Chart for the department?

Yes. And that is where my major concerns come from. They feel under extreme pressure; they feel they are working flat out just to maintain the current level of quality and on-time delivery; they feel undervalued and frustrated that their requests for more resources are refused; they feel demoralized; demotivated and scared that their service may be ‘outsourced’. On the positive side they feel that they work well as a team and are willing to learn. I do not know what to do next.

?OK. Do not panic. This sounds like a very common and treatable system illness.  It is a stream design problem which may be the reason your Foundation training feels insufficient. Would you like to see how a Practitioner would approach this?

Yes please!

?OK. Have you mapped their internal process?

Yes. It is a six-step process for each job. Each step has different requirements and are done by different people with different skills. In the past they had a problem with poor service quality so extra safety and quality checks were imposed by the Governance department.  Now the quality of each step is measured on a 1-6 scale and the quality of the whole process is the sum of the individual steps so is measured on a scale of 6 to 36. They now have been given a minimum quality target of 21 to achieve for every job. How they achieve that is not specified – it was left up to them.

?OK – do they record their quality measurement data?

Yes – I have their report.

?OK – how is the information presented?

As an average for the previous month which is reported up to the Quality Performance Committee.

?OK – what was the average for last month?

Their results were 24 – so they do not have an issue delivering the required quality. The problem is the costs they are incurring and they are being labelled by others as ‘inefficient’. Especially the departments who are in budget and are annoyed that this department keeps getting ‘bailed out’.

?OK. One issue here is the quality reporting process is not alerting you to the real issue. It sounds from what you say that you have fallen into the Flaw of Averages trap.

I don’t understand. What is the Flaw of Averages trap?

?The answer to your question will become clear. The finance issue is a symptom – an effect – it is unlikely to be the cause. When did this finance issue appear?

Just after the Safety and Quality Review. They needed to employ more agency staff to do the extra work created by having to meet the new Minimum Quality target.

?OK. I need to ask you a personal question. Do you believe that improving quality always costs more?

I have to say that I am coming to that conclusion. Our Governance and Finance departments are always arguing about it. Governance state ‘a minimum standard of safety and quality is not optional’ and finance say ‘but we are going out of business’. They are at loggerheads. The departments get caught in the cross-fire.

?OK. We will need to use reality to demonstrate that this belief is incorrect. Rhetoric alone does not work. If it did then we would not be having this conversation. Do you have the raw data from which the averages are calculated?

Yes. We have the data. The quality inspectors are very thorough!

?OK – can you plot the quality scores for the last fifty jobs as a BaseLine chart?

Yes – give me a second. The average is 24 as I said.

?OK – is the process stable?

Yes – there is only one flag for the fifty. I know from my FISH training that is not a cause for alarm.

?OK – what is the process capability?

I am sorry – I don’t know what you mean by that?

?My apologies. I forgot that you have not completed the Practitioner training yet. The capability is the range between the red lines on the chart.

Um – the lower line is at 17 and the upper line is at 31.

?OK – how many points lie below the target of 21.

None of course. They are meeting their Minimum Quality target. The issue is not quality – it is money.

There was a pause.  Leslie knew from experience that when Bob paused there was a surprise coming.

?Can you email me your chart?

A cold-shiver went down Leslie’s back. What was the problem here? Bob had never asked to see the data before.

Sure. I will send it now.  The recent fifty is on the right, the data on the left is from after the quality inspectors went in and before the the Minimum Quality target was imposed. This is the chart that Governance has been using as evidence to justify their existence because they are claiming the credit for improving the quality.

?OK – thanks. I have got it – let me see.  Oh dear.

Leslie was shocked. She had never heard Bob use language like ‘Oh dear’.

There was another pause.

?Leslie, what is the context for this data? What does the X-axis represent?

Leslie looked at the chart again – more closely this time. Then she saw what Bob was getting at. There were fifty points in the first group, and about the same number in the second group. That was not the interesting part. In the first group the X-axis went up to 50 in regular steps of five; in the second group it went from 50 to just over 149 and was no longer regularly spaced. Eventually she replied.

Bob, that is a really good question. My guess it is that this is the quality of the completed work.

?It is unwise to guess. It is better to go and see reality.

You are right. I knew that. It is drummed into us during the Foundation training! I will go and ask. Can I call you back?

?Of course. I will email you my direct number.


[reveal heading=”Click here to read the rest of the story“]


<Ring Ring><Ring Ring>

?Hello, Bob here.

Bob – it is Leslie. I am  so excited! I have discovered something amazing.

?Hello Leslie. That is good to hear. Can you tell me what you have discovered?

I have discovered that better quality does not always cost more.

?That is a good discovery. Can you prove it with data?

Yes I can!  I am emailing you the chart now.

?OK – I am looking at your chart. Can you explain to me what you have discovered?

Yes. When I went to see for myself I saw that when a job failed the Minimum Quality check at the end then the whole job had to be re-done because there was no time to investigate and correct the causes of the failure.  The people doing the work said that they were helpless victims of errors that were made upstream of them – and they could not predict from one job to the next what the error would be. They said it felt like quality was a lottery and that they were just firefighting all the time. They knew that just repeating the work was not solving the problem but they had no other choice because they were under enormous pressure to deliver on-time as well. The only solution they could see is was to get more resources but their requests were being refused by Finance on the grounds that there is no more money. They felt completely trapped.

?OK. Can you describe what you did?

Yes. I saw immediately that there were so many sources of errors that it would be impossible for me to tackle them all. So I used the tool that I had learned in the Foundation training: the Niggle-o-Gram. That focussed us and led to a surprisingly simple, quick, zero-cost process design change. We deliberately did not remove the Inspection-and-Correction policy because we needed to know what the impact of the change would be. Oh, and we did one other thing that challenged the current methods. We plotted both the successes and the failures on the BaseLine chart so we could see both the the quality and the work done on one chart.  And we updated the chart every day and posted it chart on the notice board so everyone in the department could see the effect of the change that they had designed. It worked like magic! They have already slashed their agency staff costs, the whole department feels calmer and they are still delivering on-time. And best of all they now feel that they have the energy and time to start looking at the next niggle. Thank you so much! Now I see how the tools and techniques I learned in FISH school are so powerful and now I understand better the reason we learned them first.

?Well done Leslie. You have taken an important step to becoming a fully fledged Improvement Science Practitioner. There are many more but you have learned some critical lessons in this challenge.


This scenario is fictional but realistic.

And it has been designed so that it can be replicated easily using a simple game that requires only pencil, paper and some dice.

If you do not have some dice handy then you can use this little program that simulates rolling six dice.

The Six Digital Dice program (for PC only).

Instructions
1. Prepare a piece of A4 squared paper with the Y-axis marked from zero to 40 and the X-axis from 1 to 80.
2. Roll six dice and record the score on each (or one die six times) – then calculate the total.
3. Plot the total on your graph. Left-to-right in time order. Link the dots with lines.
4. After 25 dots look at the chart. It should resemble the leftmost data in the charts above.
5. Now draw a horizontal line at 21. This is the Minimum Quality Target.
6. Keep rolling the dice – six per cycle, adding the totals to the right of your previous data.

But this time if the total is less than 21 then repeat the cycle of six dice rolls until the score is 21 or more. Record on your chart the output of all the cycles – not just the acceptable ones.

7. Keep going until you have 25 acceptable outcomes. As long as it takes.

Now count how many cycles you needed to complete in order to get 25 acceptable outcomes.  You should find that it is about twice as many as before you “imposed” the Inspect-and-Correct QI policy.

This illustrates the problem of an Inspection-and-Correction design for quality improvement.  It does improve the quality of the output – but at a higher cost.  We are treating the symptoms and ignoring the disease.

The internal design of the process is unchanged – and it is still generating mistakes.

How much quality improvement you get and how much it costs you is determined by the design of the underlying process – which has not changed. There is a Law of Diminishing returns here – and a risk.

The risk is that if quality improves as the result of applying a quality target then it encourages the Governance thumbscrews to be tightened further and forces the people further into cross-fire between Governance and Finance.

The other negative consequence of the Inspection-and-Correction approach is that it increases both the average and the variation in lead time which also fuels the calls for more targets, more sticks, calls for  more resources and pushes costs up even further.

The lesson from this simple reality check seems clear.

The better strategy for improving quality is to design the root causes of errors out of the processes  because then we will get improved quality and improved delivery and improved productivity and we will discover that we have improved safety as well.

The Six Dice Game is a simpler version of the famous Red Bead Game that W Edwards Deming used to explain why the arbitrary-target-driven-stick-and-carrot style of management creates more problems than it solves.

The illusion of short-term gain but the reality of long-term pain.

And if you would like to see and hear Deming talking about the science of improvement there is a video of him speaking in 1984. He is at the bottom of the page.  Click here.

[/reveal]

The F Word

There is an F-word that organisations do not like to use – except maybe in conspiratorial corridor conversations.

What word might that be? What are good candidates for it?

Finance perhaps?

Certainly a word that many people do not want to utter – especially when the financial picture is not looking very rosy. And when the word finance is mentioned in meetings there is usually a groan of anguish. So yes, finance is a good candidate – but it is not the F-word.

Failure maybe?

Yes – definitely a word that is rarely uttered openly. The concept of failure is just not acceptable. Organisations must succeed, sustain and grow. Talk of failure is for losers not for winners. To talk about failure is tempting fate. So yes, another excellent candidate – but it is not the F-word.

OK – what about Fear?

That is definitely something no one likes to admit to.  Especially leaders. They are expected to be fearless. Fear is a sign of weakness! Once you start letting the fear take over then panic starts to set in – then rash decisions follow then you are really on the slippery slope. Your organisation fragments into warring factions and your fate is sealed. That must be the F-word!

Nope.  It is another very worthy candidate but it is not the F-word.


[reveal heading=”Click here to reveal the F-word“]


The dreaded F-word is Feedback.

We do not like feedback.  We do not like asking for it. We do not like giving it. We do not like talking about it. Our systems seem to be specifically designed to exclude it. Potentially useful feedback information is kept secret, confidential, for-our-eyes only.  And if it is shared it is emasculated and anonymized.

And the brave souls who are prepared to grasp the nettle – the 360 Feedback Zealots – are forced to cloak feedback with secrecy and confidentiality. We are expected to ask  for feedback, to take it on the chin, but not to know who or where it came from. So to ease the pain of anonymous feedback we are allowed to choose our accusers. So we choose those who we think will not point out our blindspot. Which renders the whole exercise worthless.

And when we actually want feedback we extract it mercilessly – like extracting blood from a reluctant stone. And if you do not believe me then consider this question: Have you ever been to a training course where your ‘certificate of attendance’ was with-held until you had completed the feedback form? The trainers do this for good reason. We just hate giving feedback. Any feedback. Positive or negative. So if they do not extract it from us before we leave they do not get any.

Unfortunately by extracting feedback from us under coercion is like acquiring a confession under torture – it distorts the message and renders it worthless.

What is the problem here?  What are we scared of?


We all know the answer to the question.  We just do not want to point at the elephant in the room.

We are all terrified of discovering that we have the organisational equivalent of body-odour. Something deeply unpleasant about our behaviour that we are blissfully unaware of but that everyone else can see as plain as day. Our behaviour blindspot. The thing we would cringe with embarrassment about if we knew. We are social animals – not solitary ones. We need on feedback yet we fear it too.

We lack the courage and humility to face our fear so we resort to denial. We avoid feedback like the plague. Feedback becomes the F-word.

But where did we learn this feedback phobia?

Maybe we remember the playground taunts from the Bullies and their Sychophants? From the poisonous Queen-Bees and their Wannabees?  Maybe we tried to protect ourselves with incantations that our well-meaning parents taught us. Spells like “Sticks and stones may break my bones but names will never hurt me“.  But being called names does hurt. Deeply. And it hurts because we are terrified that there might be some truth in the taunt.

Maybe we learned to turn a blind-eye and a deaf-ear; to cross the street at the first sign of trouble; to turn the other cheek? Maybe we just learned to adopt the Victim role? Maybe we were taught to fight back? To win at any cost? Maybe we were not taught how to defuse the school yard psycho-games right at the start?  Maybe our parents and teachers did not know how to teach us? Maybe they did not know themselves?  Maybe the ‘innocent’ schoolyard games are actually much more sinister?  Maybe we carry them with us as habitual behaviours into adult life and into our organisations? And maybe the bullies and Queen-Bees learned something too? Maybe they learned that they could get away with it? Maybe they got to like the Persecutor role and its seductive musk of power? If so then then maybe the very last thing the Bullies and Queen-Bees will want to do is to encourage open, honest feedback – especially about their behaviour. Maybe that is the root cause of the conspiracy of silence? Maybe?

But what is the big deal here?

The ‘big deal’ is that this cultural conspiracy of silence is toxic.  It is toxic to trust. It is toxic to teams. It is toxic to morale.  It is toxic to motivation. It is toxic to innovation. It is toxic to improvement. It is so toxic that it kills organisations – from the inside. Slowly.

Ouch! That feels uncomfortably realistic. So what is the problem again – exactly?

The problem is a deliberate error of omission – the active avoidance of feedback.

So ….. if it were that – how would we prove that is the root cause? Eh?

By correcting the error of omission and then observing what happens.


And this is where it gets dangerous for leaders. They are skating on politically thin ice and they know it.

Subjective feedback is very emotive.  If we ask ten people for their feedback on us we will get ten different replies – because no two people perceive the world (and therefore us) the same way.  So which is ‘right’? Which opinions do we take heed of and which ones do we discount? It is a psycho-socio-political minefield. So no wonder we avoid stepping onto the cultural barbed-wire!

There is an alternative.  Stick to reality and avoid rhetoric. Stick to facts and avoid feelings. Feed back the facts of how the organisational system is behaving to everyone in the organisation.

And the easiest way to do that is with three time-series charts that are updated and shared at regular and frequent intervals.

First – the count of safety and quality failure near-misses for each interval – for at least 50 intervals.

Second – the delivery time of our product or service for each customer over the same time period.

Third – the revenue generated and the cost incurred for each interval for the same 50 intervals.

No ratios, no targets, no balanced scorecard.

Just the three charts that paint the big picture of reality. And it might not be a very pretty picture.

But why at least 50 intervals?

So we can see the long term and short term variation over time. We need both … because …

Our Safety Chart shows that near misses keep happening despite all the burden of inspection and correction.

Our Delivery Chart shows that our performance is distorted by targets and the Horned Gaussian stalks us.

Our Viability Chart shows that our costs are increasing as we pay dearly for past mistakes and our revenue is decreasing as our customers protect their purses and their persons by staying away.

That is the not-so-good news.

The good news is that as soon as we have a multi-dimensional-frequent-feedback loop installed we will start to see improvement. It happens like magic. And the feedback accelerates the improvement.

And the news gets better.

To make best use of this frequent feedback we just need to include in our Constant Purpose – to improve safety, delivery and viability. And then the final step is to link the role of every person in the organisation to that single win-win-win goal. So that everyone can see how they contribute and how their job is worthwhile.

Shared Goals, Clear Roles and Frequent Feedback.

And if you resonate with this message then you will resonate with “The Three Signs of  Miserable Job” by Patrick Lencioni.

And if you want to improve your feedback-ability then a really simple and effective feedback tool is The 4N Chart

And please share your feedback.

[/reveal]

The Three R’s

Processes are like people – they get poorly – sometimes very poorly.

Poorly processes present with symptoms. Symptoms such as criticism, complaints, and even catastrophes.

Poorly processes show signs. Signs such as fear, queues and deficits.

So when a process gets very poorly what do we do?

We follow the Three R’s

1-Resuscitate
2-Review
3-Repair

Resuscitate means to stabilize the process so that it is not getting sicker.

Review means to quickly and accurately diagnose the root cause of the process sickness.

Repair means to make changes that will return the process to a healthy and stable state.

So the concept of ‘stability’ is fundamental and we need to understand what that means in practice.

Stability means ‘predictable within limits’. It is not the same as ‘constant’. Constant is stable but stable is not necessarily constant.

Predictable implies time – so any measure of process health must be presented as time-series data.

We are now getting close to a working definition of stability: “a useful metric of system performance that is predictable within limits over time”.

So what is a ‘useful metric’?

There will be at least three useful metrics for every system: a quality metric, a time metric and a money metric.

Quality is subjective. Money is objective. Time is both.

Time is the one to start with – because it is the easiest to measure.

And if we treat our system as a ‘black box’ then from the outside there are three inter-dependent time-related metrics. These are external process metrics (EPMs) – sometimes called Key Performance Indicators (KPIs).

Flow in – also called demand
Flow out – also called activity
Delivery time – which is the time a task spends inside our system – also called the lead time.

But this is all starting to sound like rather dry, conceptual, academic mumbo-jumbo … so let us add a bit of realism and drama – let us tell this as a story …

[reveal heading=”Click here to reveal the story …“] 


Picture yourself as the manager of a service that is poorly. Very poorly. You are getting a constant barrage of criticism and complaints and the occasional catastrophe. Your service is struggling to meet the required delivery time performance. Your service is struggling to stay in budget – let alone meet future cost improvement targets. Your life is a constant fire-fight and you are getting very tired and depressed. Nothing you try seems to make any difference. You are starting to think that anything is better than this – even unemployment! But you have a family to support and jobs are hard to come by in austere times so jumping is not an option. There is no way out. You feel you are going under. You feel are drowning. You feel terrified and helpless!

In desperation you type “Management fire-fighting” into your web search box and among the list of hits you see “Process Improvement Emergency Service”.  That looks hopeful. The link takes you to a website and a phone number. What have you got to lose? You dial the number.

It rings twice and a calm voice answers.

?“You are through to the Process Improvement Emergency Service – what is the nature of the process emergency?”

“Um – my service feels like it is on fire and I am drowning!”

The calm voice continues in a reassuring tone.

?“OK. Have you got a minute to answer three questions?”

“Yes – just about”.

?“OK. First question: Is your service safe?”

“Yes – for now. We have had some catastrophes but have put in lots of extra safety policies and checks which seems to be working. But they are creating a lot of extra work and pushing up our costs and even then we still have lots of criticism and complaints.”

?“OK. Second question: Is your service financially viable?”

“Yes, but not for long. Last year we just broke even, this year we are projecting a big deficit. The cost of maintaining safety is ‘killing’ us.”

?“OK. Third question: Is your service delivering on time?”

“Mostly but not all of the time, and that is what is causing us the most pain. We keep getting beaten up for missing our targets.  We constantly ask, argue and plead for more capacity and all we get back is ‘that is your problem and your job to fix – there is no more money’. The system feels chaotic. There seems to be no rhyme nor reason to when we have a good day or a bad day. All we can hope to do is to spot the jobs that are about to slip through the net in time; to expedite them; and to just avoid failing the target. We are fire-fighting all of the time and it is not getting better. In fact it feels like it is getting worse. And no one seems to be able to do anything other than blame each other.”

There is a short pause then the calm voice continues.

?“OK. Do not panic. We can help – and you need to do exactly what we say to put the fire out. Are you willing to do that?”

“I do not have any other options! That is why I am calling.”

The calm voice replied without hesitation. 

?“We all always have the option of walking away from the fire. We all need to be prepared to exercise that option at any time. To be able to help then you will need to understand that and you will need to commit to tackling the fire. Are you willing to commit to that?”

You are surprised and strangely reassured by the clarity and confidence of this response and you take a moment to compose yourself.

“I see. Yes, I agree that I do not need to get toasted personally and I understand that you cannot parachute in to rescue me. I do not want to run away from my responsibility – I will tackle the fire.”

?“OK. First we need to know how stable your process is on the delivery time dimension. Do you have historical data on demand, activity and delivery time?”

“Hey! Data is one thing I do have – I am drowning in the stuff! RAG charts that blink at me like evil demons! None of it seems to help though – the more data I get sent the more confused I become!”

?“OK. Do not panic.  The data you need is very specific. We need the start and finish events for the most recent one hundred completed jobs. Do you have that?”

“Yes – I have it right here on a spreadsheet – do I send the data to you to analyse?”

?“There is no need to do that. I will talk you through how to do it.”

“You mean I can do it now?”

?“Yes – it will only take a few minutes.”

“OK, I am ready – I have the spreadsheet open – what do I do?”

?“Step 1. Arrange the start and finish events into two columns with a start and finish event for each task on each row.

You copy and paste the data you need into a new worksheet. 

“OK – done that”.

?“Step 2. Sort the two columns into ascending order using the start event.”

“OK – that is easy”.

?“Step 3. Create a third column and for each row calculate the difference between the start and the finish event for that task. Please label it ‘Lead Time’”.

“OK – do you want me to calculate the average Lead Time next?”

There was a pause. Then the calm voice continued but with a slight tinge of irritation.

?“That will not help. First we need to see if your system is unstable. We need to avoid the Flaw of Averages trap. Please follow the instructions exactly. Are you OK with that?”

This response was a surprise and you are starting to feel a bit confused.    

“Yes – sorry. What is the next step?”

?“Step 4: Plot a graph. Put the Lead Time on the vertical axis and the start time on the horizontal axis”.

“OK – done that.”

?“Step 5: Please describe what you see?”

“Um – it looks to me like a cave full of stalagtites. The top is almost flat, there are some spikes, but the bottom is all jagged.”

?“OK. Step 6: Does the pattern on the left-side and on the right-side look similar?”

“Yes – it does not seem to be rising or falling over time. Do you want me to plot the smoothed average over time or a trend line? They are options on the spreadsheet software. I do that use all the time!”

The calm voice paused then continued with the irritated overtone again.

?“No. There is no value is doing that. Please stay with me here. A linear regression line is meaningless on a time series chart. You may be feeling a bit confused. It is common to feel confused at this point but the fog will clear soon. Are you OK to continue?”

An odd feeling starts to grow in you: a mixture of anger, sadness and excitement. You find yourself muttering “But I spent my own hard-earned cash on that expensive MBA where I learned how to do linear regression and data smoothing because I was told it would be good for my career progression!”

?“I am sorry I did not catch that? Could you repeat it for me?”

“Um – sorry. I was talking to myself. Can we proceed to the next step?”

?”OK. From what you say it sounds as if your process is stable – for now. That is good.  It means that you do not need to Resuscitate your process and we can move to the Review phase and start to look for the cause of the pain. Are you OK to continue?”

An uncomfortable feeling is starting to form – one that you cannot quite put your finger on.

“Yes – please”. 

?Step 7: What is the value of the Lead Time at the ‘cave roof’?”

“Um – about 42”

?“OK – Step 8: What is your delivery time target?”

“42”

?“OK – Step 9: How is your delivery time performance measured?”

“By the percentage of tasks that are delivered late each month. Our target is better than 95%. If we fail any month then we are named-and-shamed at the monthly performance review meeting and we have to explain why and what we are going to do about it. If we succeed then we are spared the ritual humiliation and we are rewarded by watching others else being mauled instead. There is always someone in the firing line and attendance at the meeting is not optional!”

You also wanted to say that the data you submit is not always completely accurate and that you often expedite tasks just to avoid missing the target – in full knowkedge that the work had not been competed to the required standard. But you hold that back. Someone might be listening.

There was a pause. Then the calm voice continued with no hint of surprise. 

?“OK. Step 10. The most likely diagnosis here is a DRAT. You have probably developed a Gaussian Horn that is creating the emotional pain and that is fuelling the fire-fighting. Do not panic. This is a common and curable process illness.”

You look at the clock. The conversation has taken only a few minutes. Your feeling of panic is starting to fade and a sense of relief and curiosity is growing. Who are these people?

“Can you tell me more about a DRAT? I am not familiar with that term.”

?“Yes.  Do you have two minutes to continue the conversation?”

“Yes indeed! You have my complete attention for as long as you need. The emails can wait.”

The calm voice continues.

?“OK. I may need to put you on hold or call you back if another emergency call comes in. Are you OK with that?”

“You mean I am not the only person feeling like this?”

?“You are not the only person feeling like this. The process improvement emergency service, or PIES as we call it, receives dozens of calls like this every day – from organisations of every size and type.”

“Wow! And what is the outcome?”

There was a pause. Then the calm voice continued with an unmistakeable hint of pride.

?“We have a 100% success rate to date – for those who commit. You can look at our performance charts and the client feedback on the website.”

“I certainly will! So can you explain what a DRAT is?” 

And as you ask this you are thinking to yourself ‘I wonder what happened to those who did not commit?’ 

The calm voice interrupts your train of thought with a well-practiced explanation.

?“DRAT stands for Delusional Ratio and Arbitrary Target. It is a very common management reaction to unintended negative outcomes such as customer complaints. The concept of metric-ratios-and-performance-specifications is not wrong; it is just applied indiscriminately. Using DRATs can drive short-term improvements but over a longer time-scale they always make the problem worse.”

One thought is now reverberating in your mind. “I knew that! I just could not explain why I felt so uneasy about how my service was being measured.” And now you have a new feeling growing – anger.  You control the urge to swear and instead you ask:

“And what is a Horned Gaussian?”

The calm voice was expecting this question.

?“It is easier to demonstrate than to explain. Do you still have your spreadsheet open and do you know how to draw a histogram?”

“Yes – what do I need to plot?”

?“Use the Lead Time data and set up ten bins in the range 0 to 50 with equal intervals. Please describe what you see”.

It takes you only a few seconds to do this.  You draw lots of histograms – most of them very colourful but meaningless. No one seems to mind though.

“OK. The histogram shows a sort of heap with a big spike on the right hand side – at 42.”

The calm voice continued – this time with a sense of satisfaction.

?“OK. You are looking at the Horned Gaussian. The hump is the Gaussian and the spike is the Horn. It is a sign that your complex adaptive system behaviour is being distorted by the DRAT. It is the Horn that causes the pain and the perpetual fire-fighting. It is the DRAT that causes the Horn.”

“Is it possible to remove the Horn and put out the fire?”

?“Yes.”

This is what you wanted to hear and you cannot help cutting to the closure question.

“Good. How long does that take and what does it involve?”

The calm voice was clearly expecting this question too.

?“The Gaussian Horn is a non-specific reaction – it is an effect – it is not the cause. To remove it and to ensure it does not come back requires treating the root cause. The DRAT is not the root cause – it is also a knee-jerk reaction to the symptoms – the complaints. Treating the symptoms requires learning how to diagnose the specific root cause of the lead time performance failure. There are many possible contributors to lead time and you need to know which are present because if you get the diagnosis wrong you will make an unwise decision, take the wrong action and exacerbate the problem.”

Something goes ‘click’ in your head and suddently your fog of confusion evaporates. It is like someone just switched a light on.

“Ah Ha! You have just explained why nothing we try seems to work for long – if at all.  How long does it take to learn how to diagnose and treat the specific root causes?”

The calm voice was expecting this question and seemed to switch to the next part of the script.

?“It depends on how committed the learner is and how much unlearning they have to do in the process. Our experience is that it takes a few hours of focussed effort over a few weeks. It is rather like learning any new skill. Guidance, practice and feedback are needed. Just about anyone can learn how to do it – but paradoxically it takes longer for the more experienced and, can I say, cynical managers. We believe they have more unlearning to do.”

You are now feeling a growing sense of urgency and excitement.

“So it is not something we can do now on the phone?”

?“No. This conversation is just the first step.”

You are eager now – sitting forward on the edge of your chair and completely focussed.

“OK. What is the next step?”

There is a pause. You sense that the calm voice is reviewing the conversation and coming to a decision.

?“Before I can answer your question I need to ask you something. I need to ask you how you are feeling.”

That was not the question you expected! You are not used to talking about your feelings – especially to a complete stranger on the phone – yet strangely you do not sense that you are being judged. You have is a growing feeling of trust in the calm voice.

You pause, collect your thoughts and attempt to put your feelings into words. 

“Er – well – a mixture of feelings actually – and they changed over time. First I had a feeling of surprise that this seems so familiar and straightforward to you; then a sense of resistance to the idea that my problem is fixable; and then a sense of confusion because what you have shown me challenges everything I have been taught; and then a feeling distrust that there must be a catch and then a feeling of fear of embarassement if I do not spot the trick. Then when I put my natural skepticism to one side and considered the possibility as real then there was a feeling of anger that I was not taught any of this before; and then a feeling of sadness for the years of wasted time and frustration from battling something I could not explain.  Eventually I started to started to feel that my cherished impossibility belief was being shaken to its roots. And then I felt a growing sense of curiosity, optimism and even excitement that is also tinged with a feeling of fear of disappointment and of having my hopes dashed – again.”

There was a pause – as if the calm voice was digesting this hearty meal of feelings. Then the calm voice stated:

?“You are experiencing the Nerve Curve. It is normal and expected. It is a healthy sign. It means that the healing process has already started. You are part of your system. You feel what it feels – it feels what you do. The sequence of negative feelings: the shock, denial, anger, sadness, depression and fear will subside with time and the positive feelings of confidence, curiosity and excitement will replace them. Do not worry. This is normal and it takes time. I can now suggest the next step.”

You now feel like you have just stepped off an emotional rollercoaster – scary yet exhilarating at the same time. A sense of relief sweeps over you. You have shared your private emotional pain with a stranger on the phone and the world did not end! There is hope.

“What is the next step?”

This time there was no pause.

?“To commit to learning how to diagnose and treat your process illnesses yourself.”

“You mean you do not sell me an expensive training course or send me a sharp-suited expert who will come tell me what to do and charge me a small fortune?”

There is an almost sarcastic tone to your reply that you regret as soon as you have spoken.

Another pause.  An uncomfortably long one this time. You sense the calm voice knows that you know the answer to your own question and is waiting for you to answer it yourself.

You answer your own question.  

“OK. I guess not. Sorry for that. Yes – I am definitely up for learning how! What do I need to do.”

?“Just email us. The address is on the website. We will outline the learning process. It is neither difficult nor expensive.”

The way this reply was delivered – calmly and matter-of-factly – was reassuring but it also promoted a new niggle – a flash of fear.

“How long have I got to learn this?”

This time the calm voice had an unmistakable sense of urgency that sent a cold prickles down your spine.

?”Delay will add no value. You are being stalked by the Horned Gaussian. This means your system is on the edge of a catastrophe cliff. It could tip over any time. You cannot afford to relax. You must maintain all your current defenses. It is a learning-by-doing process. The sooner you start to learn-by-doing the sooner the fire starts to fade and the sooner you move away from the edge of the cliff.”       

“OK – I understand – and I do not know why I did not seek help a long time ago.”

The calm voice replied simply.

?”Many people find seeking help difficult. Especially senior people”.

Sensing that the conversation is coming to an end you feel compelled to ask:

“I am curious. Where do the DRATs come from?”

?“Curiosity is a healthy attitude to nurture. We believe that DRATs originated in finance departments – where they were originally called Fiscal Averages, Ratios and Targets.  At some time in the past they were sucked into operations and governance departments by a knowledge vacuum created by an unintended error of omission.”

You are not quite sure what this unfamiliar language means and you sense that you have strayed outside the scope of the “emergency script” but the phrase ‘error of omission sounds interesting’ and pricks your curiosity. You ask: 

“What was the error of omission?”

?“We believe it was not investing in learning how to design complex adaptive value systems to deliver capable win-win-win performance. Not investing in learning the Science of Improvement.”

“I am not sure I understand everything you have said.”

?“That is OK. Do not worry. You will. We look forward to your email.  My name is Bob by the way.”

“Thank you so much Bob. I feel better just having talked to someone who understands what I am going through and I am grateful to learn that there is a way out of this dark pit of despair. I will look at the website and send the email immediately.”

?”I am happy to have been of assistance.”

[/reveal]

A Recipe for Improvement PIE.

Most of us are realists. We have to solve problems in the real world so we prefer real examples and step-by-step how-to-do recipes.

A minority of us are theorists and are more comfortable with abstract models and solving rhetorical problems.

Many of these Improvement Science blog articles debate abstract concepts – because I am a strong iNtuitor by nature. Most realists are Sensors – so by popular request here is a “how-to-do” recipe for a Productivity Improvement Exercise (PIE)

Step 1 – Define Productivity.

There are many definitions we could choose because productivity means the results delivered divided by the resources used.  We could use any of the three currencies – quality, time or money – but the easiest is money. And that is because it is easier to measure and we have well established department for doing it – Finance – the guardians of the money.  There are two other departments who may need to be involved – Governance (the guardians of the safety) and Operations (the guardians of the delivery).

So the definition we will use is productivity = revenue generated divided cost incurred.

Step 2 – Draw a map of the process we want to make more productive.

This means creating a picture of the parts and their relationships to each other – in particular what the steps in the process are; who does what, where and when; what is done in parallel and what is done in sequence; what feeds into what and what depends on what. The output of this step is a diagram with boxes and arrows and annotations – called a process map. It tells us at a glance how complex our process is – the number of boxes and the number of arrows.  The simpler the process the easier it is to demonstrate a productivity improvement quickly and unambiguously.

Step 3 – Decide the objective metrics that will tell us our productivity.

We have chosen a finanical measure of productivity so we need to measure revenue and cost over time – and our Finance department do that already so we do not need to do anything new. We just ask them for the data. It will probably come as a monthly report because that is how Finance processes are designed – the calendar month accounting cycle is not negotiable.

We will also need some internal process metrics (IPMs) that will link to the end of month productivity report values because we need to be observing our process more often than monthly. Weekly, daily or even task-by-task may be necessary – and our monthly finance reports will not meet that time-granularity requirement.

These internal process metrics will be time metrics.

Start with objective metrics and avoid the subjective ones at this stage. They are necessary but they come later.

Step 4 – Measure the process.

There are three essential measures we usually need for each step in the process: A measure of quality, a measure of time and a measure of cost.  For the purposes of this example we will simplify by making three assumptions. Quality is 100% (no mistakes) and Predictability is 100% (no variation) and Necessity is 100% (no worthless steps). This means that we are considering a simplified and theoretical situation but we are novices and we need to start with the wood and not get lost in the trees.

The 100% Quality means that we do not need to worry about Governance for the purposes of this basic recipe.

The 100% Predictability means that we can use averages – so long as we are careful.

The 100% Necessity means that we must have all the steps in there or the process will not work.

The best way to measure the process is to observe it and record the events as they happen. There is no place for rhetoric here. Only reality is acceptable. And avoid computers getting in the way of the measurement. The place for computers is to assist the analysis – and only later may they be used to assist the maintenance – after the improvement has been achieved.

Many attempts at productivity improvement fail at this point – because there is a strong belief that the more computers we add the better. Experience shows the opposite is usually the case – adding computers adds complexity, cost and the opportunity for errors – so beware.

Step 5 – Identify the Constraint Step.

The meaning of the term constraint in this context is very specific – it means the step that controls the flow in the whole process.  The critical word here is flow. We need to identify the current flow constraint.

A tap or valve on a pipe is a good example of a flow constraint – we adjust the tap to control the flow in the whole pipe. It makes no difference how long or fat the pipe is or where the tap is, begining, middle or end. (So long as the pipe is not too long or too narrow or the fluid too gloopy because if they are then the pipe will become the flow constraint and we do not want that).

The way to identify the constraint in the system is to look at the time measurements. The step that shows the same flow as the output is the constraint step. (And remember we are using the simplified example of no errors and no variation – in real life there is a bit more to identifying the constraint step).

Step 6 – Identify the ideal place for the Constraint Step.

This is the critical-to-success step in the PIE recipe. Get this wrong and it will not work.

This step requires two pieces of measurement data for each step – the time data and the cost data. So the Operational team and the Finance team will need to collaborate here. Tricky I know but if we want improved productivity then there is no alternative.

Lots of productivity improvement initiatives fall at the Sixth Fence – so beware.  If our Finance and Operations departments are at war then we should not consider even starting the race. It will only make the bad situation even worse!

If they are able to maintain an adult and respectful face-to-face conversation then we can proceed.

The time measure for each step we need is called the cycle time – which is the time interval from starting one task to being ready to start the next one. Please note this is a precise definition and it should be used exactly as defined.

The money measure for each step we need is the fully absorbed cost of time of providing the resource.  Your Finance department will understand that – they are Masters of FACTs!

The magic number we need to identify the Ideal Constraint is the product of the Cycle Time and the FACT – the step with the highest magic number should be the constraint step. It should control the flow in the whole process. (In reality there is a bit more to it than this but I am trying hard to stay out of the trees).

Step 7 – Design the capacity so that the Ideal Constraint is the Actual Constraint.

We are using a precise definition of the term capacity here – the amount of resource-time available – not just the number of resources available. Again this is a precise definition and should be used as defined.

The capacity design sequence  means adding and removing capacity to and from steps so that the constraint moves to where we want it.

The sequence  is:
7a) Set the capacity of the Ideal Constraint so it is capable of delivering the required activity and revenue.
7b) Increase the capacity of the all the other steps so that the Ideal Constraint actually controls the flow.
7c) Reduce the capacity of each step in turn, a click at a time until it becomes the constraint then back off one click.

Step 8 – Model your whole design to predict the expected productivity improvement.

This is critical because we are not interested in suck-it-and-see incremental improvement. We need to be able to decide if the expected benefit is worth the effort before we authorise and action any changes.  And we will be asked for a business case. That necessity is not negotiable either.

Lots of productivity improvement projects try to dodge this particularly thorny fence behind a smoke screen of a plausible looking business case that is more fiction than fact. This happens when any of Steps 2 to 7 are omitted or done incorrectly.  What we need here is a model and if we are not prepared to learn how to build one then we should not start. It may only need a simple model – but it will need one. Intuition is too unreliable.

A model is defined as a simplified representation of reality used for making predictions.

All models are approximations of reality. That is OK.

The art of modeling is to define the questions the model needs to be designed to answer (and the precision and accuracy needed) and then design, build and test the model so that it is just simple enough and no simpler. Adding unnecessary complexity is difficult, time consuming, error prone and expensive. Using a computer model when a simple pen-and-paper model would suffice is a good example of over-complicating the recipe!

Many productivity improvement projects that get this far still fall at this fence.  There is a belief that modeling can only be done by Marvins with brains the size of planets. This is incorrect.  There is also a belief that just using a spreadsheet or modelling software is all that is needed. This is incorrect too. Competent modelling requires tools and training – and experience because it is as much art as science.

Step 9 – Modify your system as per the tested design.

Once you have demonstrated how the proposed design will deliver a valuable increase in productivity then get on with it.

Not by imposing it as a fait accompli – but by sharing the story along with the rationale, real data, explanation and results. Ask for balanced, reasoned and respectful feedback. The question to ask is “Can you think of any reasons why this would not work?” Very often the reply is “It all looks OK in theory but I bet it won’t work in practice but I can’t explain why”. This is an emotional reaction which may have some basis in fact. It may also just be habitual skepticism/cynicism. Further debate is usually  worthless – the only way to know for sure is by doing the experiment. As an experiment – as a small-scale and time-limited pilot. Set the date and do it. Waiting and debating will add no value. The proof of the pie is in the eating.

Step 10 – Measure and maintain your system productivity.

Keep measuring the same metrics that you need to calculate productivity and in addition monitor the old constraint step and the new constraint steps like a hawk – capturing their time metrics for every task – and tracking what you see against what the model predicted you should see.

The correct tool to use here is a system behaviour chart for each constraint metric.  The before-the-change data is the baseline from which improvement is measured over time;  and with a dot plotted for each task in real time and made visible to all the stakeholders. This is the voice of the process (VoP).

A review after three months with a retrospective financial analysis will not be enough. The feedback needs to be immediate. The voice of the process will dictate if and when to celebrate. (There is a bit more to this step too and the trees are clamoring for attention but we must stay out of the wood a bit longer).

And after the charts-on-the-wall have revealed the expected improvement has actually happened; and after the skeptics have deleted their ‘we told you so’ emails; and after the cynics have slunk off to sulk; and after the celebration party is over; and after the fame and glory has been snatched by the non-participants – after all of that expected change management stuff has happened …. there is a bit more work to do.

And that is to establish the new higher productivity design as business-as-usual which means tearing up all the old policies and writing new ones: New Policies that capture the New Reality. Bin the out-of-date rubbish.

This is an essential step because culture changes slowly.  If this step is omitted then out-of-date beliefs, attitudes, habits and behaviours will start to diffuse back in, poison the pond, and undo all the good work.  The New Policies are the reference – but they alone will not ensure the improvement is maintained. What is also needed is a PFL – a performance feedback loop.

And we have already demonstrated what that needs to be – the tactical system behaviour charts for the Intended Constraint step.

The finanical productivity metric is the strategic output and is reported monthly – as a system behaviour chart! Just comparing this month with last month is meaningless.  The tactical SBCs for the constraint step must be maintained continuously by the people who own the constraint step – because they control the productivity of the whole process.  They are the guardians of the productivity improvement and their SBCs are the Early Warning System (EWS).

If the tactical SBCs set off an alarm then investigate the root cause immediately – and address it. If they do not then leave it alone and do not meddle.

This is the simplified version of the recipe. The essential framework.

Reality is messier. More complicated. More fun!

Reality throws in lots of rusty spanners so we do also need to understand how to manage the complexity; the unnecessary steps; the errors; the meddlers; and the inevitable variation.  It is possible (though not trivial) to design real systems to deliver much higher productivity by using the framework above and by mastering a number of other tools and techniques.  And for that to succeed the Governance, Operations and Finance functions need to collaborate closely with the People and the Process – initially with guidance from an experienced and competent Improvement Scientist. But only initially. This is a learnable skill. And it takes practice to master – so start with easy ones and work up.

If any of these bits are missing or are dysfunctional the recipe will not work. So that is the first nettle the Executive must grasp. Get everyone who is necessary on the same bus going in the same direction – and show the cynics the exit. Skeptics are OK – they will counter-balance the Optimists. Cynics add no value and are a liability.

What you may have noticed is that 8 of the 10 steps happen before any change is made. 80% of the effort is in the design – only 20% is in the doing.

If we get the design wrong the the doing will be an ineffective and inefficient waste of effort, time and money.


The best complement to real Improvement PIE is a FISH course.


Look Out For The Time Trap!

There is a common system ailment which every Improvement Scientist needs to know how to manage.

In fact, it is probably the commonest.

The Symptoms: Disappointingly long waiting times and all resources running flat out.

The Diagnosis?  90%+ of managers say “It is obvious – lack of capacity!”.

The Treatment? 90%+ of managers say “It is obvious – more capacity!!”

Intuitively obvious maybe – but unfortunately these are incorrect answers. Which implies that 90%+ of managers do not understand how their systems work. That is a bit of a worry.  Lament not though – misunderstanding is a treatable symptom of an endemic system disease called agnosia (=not knowing).

The correct answer is “I do not yet have enough information to make a diagnosis“.

This answer is more helpful than it looks because it prompts four other questions:

Q1. “What other possible system diagnoses are there that could cause this pattern of symptoms?”
Q2. “What do I need to know to distinguish these system diagnoses?”
Q3. “How would I treat the different ones?”
Q4. “What is the risk of making the wrong system diagnosis and applying the wrong treatment?”


Before we start on this list we need to set out a few ground rules that will protect us from more intuitive errors (see last week).

The first Rule is this:

Rule #1: Data without context is meaningless.

For example 130  is a number – it is data. 130 what? 130 mmHg. Ah ha! The “mmHg” is the units – it means millimetres of mercury and it tells us this data is a pressure. But what, where, when,who, how and why? We need more context.

“The systolic blood pressure measured in the left arm of Joe Bloggs, a 52 year old male, using an Omron M2 oscillometric manometer on Saturday 20th October 2012 at 09:00 is 130 mmHg”.

The extra context makes the data much more informative. The data has become information.

To understand what the information actually means requires some prior knowledge. We need to know what “systolic” means and what an “oscillometric manometer” is and the relevance of the “52 year old male”.  This ability to extract meaning from information has two parts – the ability to recognise the language – the syntax; and the ability to understand the concepts that the words are just labels for; the semantics.

To use this deeper understanding to make a wise decision to do something (or not) requires something else. Exploring that would  distract us from our current purpose. The point is made.

Rule #1: Data without context is meaningless.

In fact it is worse than meaningless – it is dangerous. And it is dangerous because when the context is missing we rarely stop and ask for it – we rush ahead and fill the context gaps with assumptions. We fill the context gaps with beliefs, prejudices, gossip, intuitive leaps, and sometimes even plain guesses.

This is dangerous – because the same data in a different context may have a completely different meaning.

To illustrate.  If we change one word in the context – if we change “systolic” to “diastolic” then the whole meaning changes from one of likely normality that probably needs no action; to one of serious abnormality that definitely does.  If we missed that critical word out then we are in danger of assuming that the data is systolic blood pressure – because that is the most likely given the number.  And we run the risk of missing a common, potentially fatal and completely treatable disease called Stage 2 hypertension.

There is a second rule that we must always apply when using data from systems. It is this:

Rule #2: Plot time-series data as a chart – a system behaviour chart (SBC).

The reason for the second rule is because the first question we always ask about any system must be “Is our system stable?”

Q: What do we mean by the word “stable”? What is the concept that this word is a label for?

A: Stable means predictable-within-limits.

Q: What limits?

A: The limits of natural variation over time.

Q: What does that mean?

A: Let me show you.

Joe Bloggs is disciplined. He measures his blood pressure almost every day and he plots the data on a chart together with some context .  The chart shows that his systolic blood pressure is stable. That does not mean that it is constant – it does vary from day to day. But over time a pattern emerges from which Joe Bloggs can see that, based on past behaviour, there is a range within which future behaviour is predicted to fall.  And Joe Bloggs has drawn these limits on his chart as two red lines and he has called them expectation lines. These are the limits of natural variation over time of his systolic blood pressure.

If one day he measured his blood pressure and it fell outside that expectation range  then he would say “I didn’t expect that!” and he could investigate further. Perhaps he made an error in the measurement? Perhaps something else has changed that could explain the unexpected result. Perhaps it is higher than expected because he is under a lot of emotional stress a work? Perhaps it is lower than expected because he is relaxing on holiday?

His chart does not tell him the cause – it just flags when to ask more “What might have caused that?” questions.

If you arrive at a hospital in an ambulance as an emergency then the first two questions the emergency care team will need to know the answer to are “How sick are you?” and “How stable are you?”. If you are sick and getting sicker then the first task is to stabilise you, and that process is called resuscitation.  There is no time to waste.


So how is all this relevant to the common pattern of symptoms from our sick system: disappointingly long waiting times and resources running flat out?

Using Rule#1 and Rule#2:  To start to establish the diagnosis we need to add the context to the data and then plot our waiting time information as a time series chart and ask the “Is our system stable?” question.

Suppose we do that and this is what we see. The context is that we are measuring the Referral-to-Treatment Time (RTT) for consecutive patients referred to a single service called X. We only know the actual RTT when the treatment happens and we want to be able to set the expectation for new patients when they are referred  – because we know that if patients know what to expect then they are less likely to be disappointed – so we plot our retrospective RTT information in the order of referral.  With the Mark I Eyeball Test (i.e. look at the chart) we form the subjective impression that our system is stable. It is delivering a predictable-within-limits RTT with an average of about 15 weeks and an expected range of about 10 to 20 weeks.

So far so good.

Unfortunately, the purchaser of our service has set a maximum limit for RTT of 18 weeks – a key performance indicator (KPI) target – and they have decided to “motivate” us by withholding payment for every patient that we do not deliver on time. We can now see from our chart that failures to meet the RTT target are expected, so to avoid the inevitable loss of income we have to come up with an improvement plan. Our jobs will depend on it!

Now we have a problem – because when we look at the resources that are delivering the service they are running flat out – 100% utilisation. They have no spare flow-capacity to do the extra work needed to reduce the waiting list. Efficiency drives and exhortation have got us this far but cannot take us any further. We conclude that our only option is “more capacity”. But we cannot afford it because we are operating very close to the edge. We are a not-for-profit organisation. The budgets are tight as a tick. Every penny is being spent. So spending more here will mean spending less somewhere else. And that will cause a big argument.

So the only obvious option left to us is to change the system – and the easiest thing to do is to monitor the waiting time closely on a patient-by-patient basis and if any patient starts to get close to the RTT Target then we bump them up the list so that they get priority. Obvious!

WARNING: We are now treating the symptoms before we have diagnosed the underlying disease!

In medicine that is a dangerous strategy.  Symptoms are often not-specific.  Different diseases can cause the same symptoms.  An early morning headache can be caused by a hangover after a long night on the town – it can also (much less commonly) be caused by a brain tumour. The risks are different and the treatment is different. Get that diagnosis wrong and disappointment will follow.  Do I need a hole in the head or will a paracetamol be enough?


Back to our list of questions.

What else can cause the same pattern of symptoms of a stable and disappointingly long waiting time and resources running at 100% utilisation?

There are several other process diseases that cause this symptom pattern and none of them are caused by lack of capacity.

Which is annoying because it challenges our assumption that this pattern is always caused by lack of capacity. Yes – that can sometimes be the cause – but not always.

But before we explore what these other system diseases are we need to understand why our current belief is so entrenched.

One reason is because we have learned, from experience, that if we throw flow-capacity at the problem then the waiting time will come down. When we do “waiting list initiatives” for example.  So if adding flow-capacity reduces the waiting time then the cause must be lack of capacity? Intuitively obvious.

Intuitively obvious it may be – but incorrect too.  We have been tricked again. This is flawed causal logic. It is called the illusion of causality.

To illustrate. If a patient complains of a headache and we give them paracetamol then the headache will usually get better.  That does not mean that the cause of headaches is a paracetamol deficiency.  The headache could be caused by lots of things and the response to treatment does not reliably tell us which possible cause is the actual cause. And by suppressing the symptoms we run the risk of missing the actual diagnosis while at the same time deluding ourselves that we are doing a good job.

If a system complains of  long waiting times and we add flow-capacity then the long waiting time will usually get better. That does not mean that the cause of long waiting time is lack of flow-capacity.  The long waiting time could be caused by lots of things. The response to treatment does not reliably tell us which possible cause is the actual cause – so by suppressing the symptoms we run the risk of missing the diagnosis while at the same time deluding ourselves that we are doing a good job.

The similarity is not a co-incidence. All systems behave in similar ways. Similar counter-intuitive ways.


So what other system diseases can cause a stable and disappointingly long waiting time and high resource utilisation?

The commonest system disease that is associated with these symptoms is a time trap – and they have nothing to do with capacity or flow.

They are part of the operational policy design of the system. And we actually design time traps into our systems deliberately! Oops!

We create a time trap when we deliberately delay doing something that we could do immediately – perhaps to give the impression that we are very busy or even overworked!  We create a time trap whenever we deferring until later something we could do today.

If the task does not seem important or urgent for us then it is a candidate for delaying with a time trap.

Unfortunately it may be very important and urgent for someone else – and a delay could be expensive for them.

Creating time traps gives us a sense of power – and it is for that reason they are much loved by bureaucrats.

To illustrate how time traps cause these symptoms consider the following scenario:

Suppose I have just enough resource-capacity to keep up with demand and flow is smooth and fault-free.  My resources are 100% utilised;  the flow-in equals the flow-out; and my waiting time is stable.  If I then add a time trap to my design then the waiting time will increase but over the long term nothing else will change: the flow-in,  the flow-out,  the resource-capacity, the cost and the utilisation of the resources will all remain stable.  I have increased waiting time without adding or removing capacity. So lack of resource-capacity is not always the cause of a longer waiting time.

This new insight creates a new problem; a BIG problem.

Suppose we are measuring flow-in (demand) and flow-out (activity) and time from-start-to-finish (lead time) and the resource usage (utilisation) and we are obeying Rule#1 and Rule#2 and plotting our data with its context as system behaviour charts.  If we have a time trap in our system then none of these charts will tell us that a time-trap is the cause of a longer-than-necessary lead time.

Aw Shucks!

And that is the primary reason why most systems are infested with time traps. The commonly reported performance metrics we use do not tell us that they are there.  We cannot improve what we cannot see.

Well actually the system behaviour charts do hold the clues we need – but we need to understand how systems work in order to know how to use the charts to make the time trap diagnosis.

Q: Why bother though?

A: Simple. It costs nothing to remove a time trap.  We just design it out of the process. Our flow-in will stay the same; our flow-out will stay the same; the capacity we need will stay the same; the cost will stay the same; the revenue will stay the same but the lead-time will fall.

Q: So how does that help me reduce my costs? That is what I’m being nailed to the floor with as well!

A: If a second process requires the output of the process that has a hidden time trap then the cost of the queue in the second process is the indirect cost of the time trap.  This is why time traps are such a fertile cause of excess cost – because they are hidden and because their impact is felt in a different part of the system – and usually in a different budget.

To illustrate. Suppose that 60 patients per day are discharged from our hospital and each one requires a prescription of to-take-out (TTO) medications to be completed before they can leave.  Suppose that there is a time trap in this drug dispensing and delivery process. The time trap is a policy where a porter is scheduled to collect and distribute all the prescriptions at 5 pm. The porter is busy for the whole day and this policy ensures that all the prescriptions for the day are ready before the porter arrives at 5 pm.  Suppose we get the event data from our electronic prescribing system (EPS) and we plot it as a system behaviour chart and it shows most of the sixty prescriptions are generated over a four hour period between 11 am and 3 pm. These prescriptions are delivered on paper (by our busy porter) and the pharmacy guarantees to complete each one within two hours of receipt although most take less than 30 minutes to complete. What is the cost of this one-delivery-per-day-porter-policy time trap? Suppose our hospital has 500 beds and the total annual expense is £182 million – that is £0.5 million per day.  So sixty patients are waiting for between 2 and 5 hours longer than necessary, because of the porter-policy-time-trap, and this adds up to about 5 bed-days per day – that is the cost of 5 beds – 1% of the total cost – about £1.8 million.  So the time trap is, indirectly, costing us the equivalent of £1.8 million per annum.  It would be much more cost-effective for the system to have a dedicated porter working from 12 am to 5 pm doing nothing else but delivering dispensed TTOs as soon as they are ready!  And assuming that there are no other time traps in the decision-to-discharge process;  such as the time trap created by batching all the TTO prescriptions to the end of the morning ward round; and the time trap created by the batch of delivered TTOs waiting for the nurses to distribute them to the queue of waiting patients!


Q: So how do we nail the diagnosis of a time trap and how do we differentiate it from a Batch or a Bottleneck or Carveout?

A: To learn how to do that will require a bit more explanation of the physics of processes.

And anyway if I just told you the answer you would know how but might not understand why it is the answer. Knowledge and understanding are not the same thing. Wise decisions do not follow from just knowledge – they require understanding. Especially when trying to make wise decisions in unfamiliar scenarios.

It is said that if we are shown we will understand 10%; if we can do we will understand 50%; and if we are able to teach then we will understand 90%.

So instead of showing how instead I will offer a hint. The first step of the path to knowing how and understanding why is in the following essay:

A Study of the Relative Value of Different Time-series Charts for Proactive Process Monitoring. JOIS 2012;3:1-18

Click here to visit JOIS

Intuitive Counter

If it takes five machines five minutes to make five widgets how long does it take ten machines to make ten widgets?

If the answer “ten minutes” just popped into your head then your intuition is playing tricks on you. The correct answer is “five minutes“.

Let us try another.

If the lily leaves on the surface of a lake double in area every day and if it takes 48 days to cover the whole lake then how long did it take to cover half the lake?  Twenty four days? Nope. The correct answer is 47 days and once again our intuition has tricked us. It is obvious in hindsight though – just not so obvious before.

We all make thousands of unconscious, intuitive decisions every day so if we make unintended errors like this then they must be happening all the time and we do not realise. 

OK one more and really concentrate this time.

If we have a three-step sequential process and the chance of a significant safety error at each step is 10%, 30% and 20% respectively then what is the overall error rate for the process?  A: (10%+30%+20%) /3 = 60%/3 = 20%? Nope. Um 30%? Nope. What about 60%?  Nope. The answer is 49.6%. And it is not intuitively obvious how that is the correct answer.


When it comes to numbers, counting, and anything to do with chance and probability then our intuition is not a safe and reliable tool. But we rely on it all the time and we are not aware of the errors we are making. And it is not just numbers that our intuition trips us up over!


A lot of us are intuitive thinkers … about 40% in fact. The majority of leaders and executives are categorised as iNtuitors when measured using a standard psychological assessment tool. And remember – they are the ones making the Big Decisions that effect us all.  So if their intuition is tripping them up then their decisions are likely to be a bit suspect.

Fortunately there is a group of people who do not fall into these hidden cognitive counting traps so easily. They have Books of Rules of how to do numbers correctly – and they are called Accountants. When they have the same standard assessment a lot of them pop up at the other end of the iNtuitor dimension. They are called Sensors.   Not because they are sensitive (which of course they are) but because they rank reality more trustworthy than rhetoric. They trust what they see – the facts – the numbers.  And money is a number. And numbers  add up exactly so that everything is neat, tidy, and auditable down to the last penny. Ahhhh – Blisse is Balanced Books and Budgets.  


This is why the World is run by Accountants.  They nail our soft and fuzzy intuitive rhetoric onto the hard and precise fiscal reality.  And in so doing a big and important piece of the picture is lost. The fuzzy bit,


Intuitors have a very important role. They are able to think outside the Rule Book Box. They are comfortable working with fuzzy concepts and in abstract terms and their favourite sport is intuitive leaping. It is a high risk sport though because sometimes Reality reminds them that the Laws of Physics are not optional or subject to negotiation and innovation. Ouch!  But the iNtuitors ability to leap about conceptuallycomes in very handy when the World is changing unpredictably – because it allows the Books of Rules to be challenged and re-written as new discoveries are made. The first Rule is usually “Do not question the Rules” so those who follow Rules are not good at creating new ones. And those who write the rules are not good at sticking to them.

So, after enough painful encounters with Reality the iNtuitors find their comfort zones in board rooms, academia and politics – where they can avoid hard Reality and concentrate on soft Rhetoric. Here they can all have a different conceptual abstract mental model and can happily discuss, debate and argue with each other for eternity. Of course the rest of the Universe is spectacularly indifferent to board room, academic and political rhetoric – but the risk to the disinterested is when the influential iNtuitors impose their self-generated semi-delusional group-think on the Real World without a doing a Reality Check first.  The outcome is entirely predictable ….

And as the hot rhetoric meets cold reality the fog of disillusionment forms. 


So if we wish to embark on a Quest for Improvement then it is really helpful to know where on the iNtuitor-Sensor dimension each of us prefers to sit. Intuitors need Sensors to provide a reality check and Sensors need Intuitors to challenge the status quo.  We are not nailed to our psychological perches – we can shuffle up and down if need be – we do have a favourite spot though; our comfort zone.

To help answer the “Where am I on the NS dimension?” question here is a  Temperament Self-Assessment Tool that you can use. It is based on the Jungian, Myers-Briggs and Keirsey models. Just run the programme, answer the 72 questions and you will get your full 4-dimensional profile and your “centre” on each. Then jot down the results on a scrap of paper. 

There is a whole industry that has sprung up out these (and other) psychological assessment tools. They feed our fascination with knowing what makes us tick and the role of the psychoexpert is to de-mystify the assessments for us and to explain the patterns in the tea leaves (for a fee of course because it takes years of training to become a Demystifier). Disappointingly, my experience is that almost every person I have asked if they know their Myers-Briggs profile say “Oh yes, I did that years ago, it is SPQR or something like that but I have no idea what it means“.  Maybe they should ask for their Demystification Fee to be returned?

Anyway – here is the foundation level demystification guide to help you derive meaning from what is jotted on the scrap of paper.

First look at the N-S (iNtuitor-Sensor) dimension.  If you come out as N then look at the T-F (Thinking-Feeling) dimension – and together they will give an xNTx preference or an xNFx preference. People with these preferences are called Rationals and Idealists respectively.  If you prefer the S end of the N-S dimension then look at the J-P (Judging-Perceiving) result and this will give an xSxJ or xSxP preference. These are the Guardians and the Artisans.  Those are the Four Temperaments described by David Keirsey in “Please Understand Me II“. If you are near the middle of any of the dimensions then you will show a blend of temperaments. And please note – it is not an either-or category – it is a continuous spectrum.

How we actually manifest our innate personality preferences depends on our education, experiences and the exact context. This makes it a tricky to interpret the specific results for an individual – hence the Tribe of Demystificationists. And remember – these are not intelligence tests, and there are no good/bad or right/wrong answers. They are gifts – or rather gifts differing. 


So how does all this psychobabble help us as Improvement Scientists?

Much of Improvement Science is just about improving awareness and insight – so insight into ourselves is of value.  

Rationals (xNTx) are attracted to occupations that involve strategic thinking and making rational, evidence based decisions: such as engineers and executives. The Idealists (xNFx) are rarer, more sensitive, and attracted to occupations such as teaching, counselling, healing and being champions of good causes.  The Guardians (xSxJ) are particularly numerous and are attracted to occupations that form the stable bedrock of society – administrators, inspectors, supervisors, providers and protectors. They value the call-of-duty and sticking-to-the-rules for the good-of-all. Artisans (SPs) are the risk-takers and fun-makers; the promotors, the entertainers, the explorers, the dealers, the artists, the marketeers and the salespeople.

These are the Four Temperaments that form the basic framework of the sixteen Myers-Briggs polarities.  And this is not a new idea – it has been around for millenia – just re-emerging with different names in different paradigms. In the Renaissance the Galenic Paradigm held sway and they were called the Phlegmatics (NT), the Cholerics (NF), the Melancholics (SJ) and the Sangines (SP) – depending on which of the four body fluids were believed to be out of balance (phlegm, yellow bile, black bile or blood). So while the paradigms have changed, the empirical reality appears to have endured the ages.

The message for the Improvement Scientist is two-fold:

1. Know your own temperament and recognise the strengths and limitations of it. They all have a light and dark side.
2. Understand that the temperaments of groups of people can be both synergistic and antagonistic.

It is said that birds of a feather flock together and the collective behaviour of departments in large organisations tend to form around the temperament that suits that organisational function.  The character of the Finance department is usually very different to that of Operations, or Human Resources – and sparks can (and do) fly when they engage each other. No wonder chief executives have a short half-life and an effective one is worth its weight in gold! 

The interdepartmental discord that is commonly observed in large organisations follows more from ignorance (unawareness of the reality of a spectrum of innate temperaments) and arrogance (expecting everyone to think the same way as we do). Antagonism is not an inevitable consequence though – it is just the default outcome in the absence of awareness and effective leadership.

This knowledge highlights two skills that an effective Improvement Scientist needs to master:

1. Respectful Educator (drawing back the black curtain of ignorance) and
2. Respectful Challenger (using reality to illuminate holes in the rhetoric).

Intuitive counter or counter intuitive?

Structure Time to Fuel Improvement

The expected response to any suggestion of change is “Yes, but I am too busy – I do not have time.”

And the respondent is correct. They do not.

All their time is used just keeping their head above water or spinning the hamster wheel or whatever other metaphor they feel is appropriate.  We are at an impasse. A stalemate. We know change requires some investment of time and there is no spare time to invest so change cannot happen. Yes?  But that is not good enough – is it?

Well-intended experts proclaim that “I’m too busy” actually means “I have other things to do that are higher priority“. And by that we mean ” … that are a greater threat to my security and to what I care about“. So to get our engagement our well-intended expert pours emotional petrol on us and sets light to it. They show us dramatic video evidence of how our “can’t do” attitude and behaviour is part of the problem. We are the recalcitrant child who is standing in the way of  change and we need to have our face rubbed in our own cynical poo.

Now our platform is really burning. Inflamed is exactly what we are feeling – angry in fact. “Thanks-a-lot. Now #!*@ off!”   And our well-intentioned expert retreats – it is always the same. The Dinosaurs and the Dead Wood are clogging the way ahead.

Perhaps a different perspective might be more constructive.


It is not just how much time we have that is most important – it is how our time is structured.


Humans hate unstructured time. We like to be mentally active for all of our waking moments. 

To test this hypothesis try this demonstration of our human need to fill idle time with activity. When you next talk to someone you know well – at some point after they have finished telling you something just say nothing;  keep looking at them; and keep listening – and say nothing. For up to twenty seconds if necessary. Both you and they will feel an overwhelming urge to say something, anything – to fill the silence. It is called the “pregnant pause effect” and most people find even a gap of a second or two feels uncomfortable. Ten seconds would be almost unbearable. Hold your nerve and stay quiet. They will fill the gap.

This technique is used by cognitive behavioural therapists, counsellors and coaches to help us reveal stuff about ourselves to ourselves – and it works incredibly well. It is also used for less altrusitic purposes by some – so when you feel the pain of the pregnant pause just be aware of what might be going on and counter with a question.


If we have no imposed structure for our time then we will create one – because we feel better for it. We have a name for these time-structuring behaviours: habits, past-times and rituals. And they are very important to us because they reduce anxiety.

There is another name for a pre-meditated time-structure:  it is called a plan or a process design. Many people hate not having a plan – and to them any plan is better than none. So in the absence of an imposed alternative we habitually make do with time-wasting plans and poorly designed processes.  We feel busy because that is the purpose of our time-structuring behaviour – and we look busy too – which is also important. This has an important lesson for all improvement scientists: Using a measure of “business” such as utilisation as a measure of efficiency and productivity is almost meaningless. Utilisation does not distinguish between useful busi-ness and useless busi-ness.

We also time-structure our non-working lives. Reading a newspaper, doing the crossword, listening to the radio,  watching television, and web-browsing are all time-structuring behaviours.


This insight into our need for structured time leads to a rational way to release time for change and improvement – and that is to better structure some of our busy time.

A useful metaphor for a time-structure is a tangible structure – such as a building. Buildings have two parts – a supporting, load bearing, structural framework and the functional fittings that are attached to it. Often the structural framework is invisible in the final building – invisible but essential. That is why we need structural engineers. The same is true for time-structuring: the supporting form should be there but it should not not get in the way of the intended function. That is why we need process design engineers too. Good process design is invisible time-structuring.


One essential investment of time in all organisations is communication. Face-to-face talking, phone calls, SMS, emails, reports, meetings, presentations, webex and so on. We spend more time communicating with each other than doing anything else other than sleeping.  And more niggles are generated by poorly designed and delivered communication processes than everything else combined. By a long way.


As an example let us consider management meetings.

From a process design perspective mmany management meetings are both ineffective and inefficient. They are unproductive.  So why do we still have them?

One possibkle answer is because meetings have two other important purposes: first as a tool for social interaction, and second as a way to structure time.  It turns out that we dislike loneliness even more than idleness – and we can meet both needs at the same time by having a meeting. Productivity is not the primary purpose.


So when we do have to communicate effectively and efficiently in order to collectively resolve a real and urgent problem then we are ill prepared. And we know this. We know that as soon as Crisis Management Committees start to form then we are in really big trouble. What we want in a time of crisis is for someone to structure time for us. To tell us what to do.

And some believe that we unconsciously create crisis after crisis for just that purpose.


Recently I have been running an improvement experiment.  I have  been testing the assumption that we have to meet face-to-face to be effective. This has big implications for efficiency because I work in a multi-site organisation and to attend a meeting on another site implies travelling there and back. That travel takes one hour in each direction when all the separate parts are added together. It has two other costs. The financial cost of the fuel – which is a variable cost – if I do not travel then I do not incur the cost. And there is an emotional cost – I have to concentrate on driving and will use up some of my brain-fuel in doing so. There are three currencies – emotional, temporal and financial.

The experiment was a design change. I changed the design of the communication process from at-the-same-place-and-time to just at-the-same-time. I used an internet-based computer-to-computer link (rather like Skype or FaceTime but with some other useful tools like application sharing).

It worked much better than I expected.

There was the anticipated “we cannot do this because we do not have webcams and no budget for even pencils“. This was solved by buying webcams from the money saved by not burning petrol. The conversion rate was one webcam per four trips – and the webcam is a one off capital cost not a recurring revenue cost. This is accpiuntant-speak for “the actual cash released will fund the change“. No extra budget is required. And combine the fuel savings for everyone, and parking charges and the payback time is even shorter.

There were also the anticipated glitches as people got used to the unfamiliar technology (they did not practice of course because they were too busy) but the niggles go away with a few iterations.

So what were the other benefits?

Well one was the travel time saved – two hours per meeting – which was longer than the meeting! The released time cannot be stored and used later like the money can – it has to be reinvested immediately. I reinvested it in other improvement work. So the benefit was amplified.

Another was the brain-fuel saved from not having to drive – which I used to offset my cumuative brain-fuel deficit called chronic fatigue. The left over was re-invested in the improvement work. 100% recycled. Nothing was wasted.


The unexpected benefit was the biggest one.

The different communication design of a virtual meeting required a different form of meeting structure and discipline. It took a few iterations to realise this – then click – both effectiveness and efficiency jumped up. The time became even better structured, more productive and released even more time to reinvest. Wow!

And the whole thing funded itself.

The Frightening Cost Of Fear

The recurring theme this week has been safety and risk.

Specifically in a healthcare context. Most people are not aware just how risky our current healthcare systems are. Those who work in healthcare are much more aware of the dangers but they seem powerless to do much to make their systems safer for patients.


The shroud-waving  zealots who rant on about safety often use a very unhelpful quotation. They say “Every system is perfectly designed to deliver the performance it does“. The implication is that when the evidence shows that our healthcare systems are dangerous …. then …. we designed them to be dangerous.  The reaction from the audience is emotional and predictable “We did not intend this so do not try to pin the blame on us!”  The well-intentioned shroud-waving safety zealot loses whatever credibility they had and the collective swamp of cynicism and despair gets a bit deeper.


The warning-word here is design – because it has many meanings.  The design of a system can mean “what the system is” in the sense of a blueprint. The design of a system can also mean “how the blueprint was created”.  This process sense is the trap – because it implies intention.  Design needs a purpose – the intended outcome – so to say an unsafe system has been designed is to imply that it was intended to be unsafe. This is incorrect.

The message in the emotional backlash that our well-intended zealot provoked is “You said we intended bad things to happen which is not correct so if you are wrong on that fundamental belief then how can I trust anything else you say?“. This is the reason zealots lose credibility and actually make improvement less likely to happen.


The reality is not that the system was designed to be unsafe – it is that it was not designed not to be. The double negatives are intentional. The two statements are not the same.


The default way of the Universe is evolutionary (which is unintentional and reactive) and chaotic (which is unstable and unsafe). To design a system to be not-unsafe we need to understand Two Sciences – Design Science and Safety Science. Only then can we proactively and intentionally design safe, stable, and trustable systems.    If we do nothing and do not invest in mastering the Two Sciences then we will get the default outcome: unintended unsafety.  This is what the uncomfortable  evidence says we have.


So where does the Frightening Cost of Fear come in?

If our system is unintentionally and unpredictably unsafe then of course we will try to protect ourselves from the blame which inevitably will follow from disappointed customers.  We fear the blame partly because we know it is justified and partly because we feel powerless to avoid it. So we cover our backs. We invent and implement complex check-and-correct systems and we document everything we do so that we have the evidence in the inevitable event of a bad outcome and the backlash it unleashes. The evidence that proves we did our best; it shows we did what the safety zealots told us to do; it shows that we cannot be held responsible for the bad outcome.

Unfortunately this strategy does little to prevent bad outcomes. In fact it can have has exactly the opposite effect of what is intended. The added complexity and cost of our cover-my-back bureaucracy actually increases the stress and chaos and makes bad outcomes more likely to happen. It makes the system even less safe. It does not deflect the blame. It just demonstrates that we do not understand how to design a not-unsafe system.


And the financial cost of our fear is frighteningly high.

Studies have shown that over 60% of nursing time is spent on documentation – and about 70% of healthcare cost is on hospital nurse salaries. The maths is easy – at least 42% of total healthcare cost is spent on back-covering-blame-deflection-bureaucracy.

It gets worse though.

Those legal documents called clinical records need to be moved around and stored for a minimum of seven years. That is expensive. Converting them into an electronic format misses the point entirely. Finding the few shreds of valuable clinical information amidst the morass of back-covering-bureaucracy uses up valuable specialist time and has a high risk of failure. Inevitably the risk of decision errors increases – but this risk is unmeasured and is possibly unmeasurable. The frustration and fear it creates is very obvious though: to anyone willing to look.

The cost of correcting the Niggles that have been detected before they escalate to Not Agains, Near Misses and Never Events can itself account for half the workload. And the cost of clearing up the mess after the uncommon but inevitable disaster becomes built into the system too – as insurance premiums to pay for future litigation and compensation. It is no great surprise that we have unintentionally created a compensation culture! Patient expectation is rising.

Add all those costs up and it becomes plausible to suggest that the Cost of Fear could be a terrifying 80% of the total cost!


Of course we cannot just flick a switch and say “Right – let us train everyone in safe system design science“.  What would all the people who make a living from feeding on the present dung-heap do? What would the checkers and auditors and litigators and insurers do to earn a crust? Join the already swollen ranks of the unemployed?


If we step back and ask “Does the Cost of Fear principle apply to everything?” then we are faced with the uncomfortable conclusion that it most likely is.  So the cost of everything we buy will have a Cost of Fear component in it. We will not see it written down like that but it will be in there – it must be.

This leads us to a profound idea.  If we collectively invested in learning how to design not-unsafe systems then the cost of everything could fall. This means we would not need to work as many hours to earn enough to pay for what we need to live. We could all have less fear and stress. We could all have more time to do what we enjoy. We could all have both of these and be no worse off in terms of financial security.

This Win-Win-Win outcome feels counter-intuitive enough to deserve serious consideration.


So here are some other blog topics on the theme of Safety and Design:

Never Events, Near Misses, Not Agains and Nailing Niggles

The Safety Line in the Quality Sand

Safety By Design

Productivity Improvement Science

Very often there is a requirement to improve the productivity of a process and operational managers are usually measured and rewarded for how well they do that. Their primary focus is neither safety nor quality – it is productivity – because that is their job.

For-profit organisations see improved productivity as a path to increased profit. Not-for-profit organisations see improved productivity as a path to being able to grow through re-investment of savings.  The goal may be different but the path is the same – productivity improvement.

First we need to define what we mean by productivity: it is the ratio of a system output to a system input. There are many input and output metrics to choose from and a convenient one to use is the ratio of revenue to expenses for a defined period of time.  Any change that increases this ratio represents an improvement in productivity on this purely financial dimension and we know that this financial data is measured. We just need to look at the bank statement.

There are two ways to approach productivity improvement: by considering the forces that help productivity and the forces that hinder it. This force-field metaphor was described by the psychologist Kurt Lewin (1890-1947) and has been developed and applied extensively and successfully in many organisations and many scenarios in the context of change management.

Improvement results from either strengthening helpers or weakening hinderers or both – and experience shows that it is often quicker and easier to focus attention on the hinderers because that leads to both more improvement and to less stress in the system. Usually it is just a matter of alignment. Two strong forces in opposition results in high stress and low motion; but in alignment creates low stress and high acceleration.

So what hinders productivity?

Well, anything that reduces or delays workflow will reduce or delay revenue and therefore hinder productivity. Anything that increases resource requirement will increase cost and therefore hinder productivity. So looking for something that causes both and either removing or realigning it will have a Win-Win impact on productivity!

A common factor that reduces and delays workflow is the design of the process – in particular a design that has a lot of sequential steps performed by different people in different departments. The handoffs between the steps are a rich source of time-traps and bottlenecks and these both delay and limit the flow.  A common factor that increases resource requirement is making mistakes because errors generate extra work – to detect and to correct.  And there is a link between fragmentation and errors: in a multi-step process there are more opportunities for errors – particularly at the handoffs between steps.

So the most useful way to improve the productivity of a process is to simplify it by combining several, small, separate steps into single large ones.

A good example of this can be found in healthcare – and specifically in the outpatient department.

Traditionally visits to outpatients are defined as “new” – which implies the first visit for a particular problem – and “review” which implies the second and subsequent visits.  The first phase is the diagnostic work and this often requires special tests or investigations to be performed (such as blood tests, imaging, etc) which are usually done by different departments using specialised equipment and skills. The design of departmental work schedules requires a patient to visit on a separate occasion to a different department for each test. Each of these separate visits incurs a delay and a risk of a number of errors – the commonest of which is a failure to attend for the test on the appointed day and time. Such did-not-attend or DNA rates are surprisingly high – and values of 10% are typical in the NHS.

The cumulative productivity hindering effect of this multi-visit diagnostic process design is large.  Suppose there are three steps: New-Test-Review and each step has a 10% DNA rate and a 4 week wait. The quickest that a patient could complete the process is 12 weeks and the chance of getting through right first time (the yield) is about 90% x 90% x 90% = 73% which implies that 27% extra resource is needed to correct the failures.  Most attempts to improve productivity focus on forcing down the DNA rate – usually with limited success. A more effective approach is to redesign process by combining the three New-Test-Review steps into one visit.  Exactly the same resources are needed to do the work as before but now the minimum time would be 4 weeks, the right-first-time yield would increase to 90% and the extra resources required to manage the two handoffs, the two queues, and the two sources of DNAs would be unnecessary.  The result is a significant improvement in productivity at no cost.  It is also an improvement in the quality of the patient experience but that is a unintended bonus.

So if the solution is that obvious and that beneficial then why are we not doing this everywhere? The answer is that we do in some areas – in particular where quality and urgency is important such as fast-track one-stop clinics for suspected cancer. However – we are not doing it as widely as we could and one reason for that is a hidden hinderer: the way that the productivity is estimated in the business case and measured in the the day-to-day business.

Typically process productivity is estimated using the calculated unit price of the product or service. The unit price is arrived at by adding up the unit costs of the steps and adding an allocation of the overhead costs (how overhead is allocated is subject to a lot of heated debate by accountants!). The unit price is then multiplied by expected activity to get expected revenue and divided by the total cost (or budget) to get the productivity measure.  This approach is widely taught and used and is certainly better than guessing but it has a number of drawbacks. Firstly, it does not take into account the effects of the handoffs and the queues between the steps and secondly it drives step-optimisation behaviour. A departmental operational manager who is responsible and accountable for one step in the process will focus their attention on driving down costs and pushing up utilisation of their step because that is what they are performance managed on. This in itself is not wrong – but it can become counter-productive when it is done in isolation and independently of the other steps in the process.  Unfortunately our traditional management accounting methods do not prevent this unintentional productivity hindering behaviour – and very often they actually promote it – literally!

This insight is not new – it has been recognised by some for a long time – so we might ask ourselves why this is still the case? This is a very good question that opens another “can of worms” which for the sake of brevity will be deferred to a later conversation.

So, when applying Improvement Science in the domain of financial productivity improvement then the design of both the process and of the productivity modelling-and-monitoring method may need addressing at the same time.  Unfortunately this does not seem to be common knowledge and this insight may explain why productivity improvements do not happen more often – especially in publically funded not-for-profit service organisations such as the NHS.

All Aboard for the Ride of Our Lives!

In 1825 the world changed when the Age of Rail was born with the opening of the Darlington-to-Stockton line and the demonstration that a self-powered mobile steam engine could pull more trucks of coal than a team of horses.

This launched the industrial revolution into a new phase by improving the capability to transport heavy loads over long distances more conveniently, reliably, quickly, and cheaply than could canals or roads.

Within 25 years the country was criss-crossed by thousands of miles of railway track and thousands more miles were rapidly spreading across the world. We take it for granted now but this almost overnight success was the result of over 100 years of painful innovation and improvement. Iron rail tracks had been in use for a long time – particularly in quarries and ports. Newcomen’s atmospheric steam engine had been pumping water out of mines since 1712; James Watt and Matthew Boulton had patented their improved separate condenser static steam engine in 1775; and Richard Trevethick had built a self-propelled high pressure steam engine called “Puffing Devil” in 1801. So why did it take so long for the idea to take off? The answer was quite simple – it needed the lure of big profits to attract the entrepreneurs who had the necessary influence and cash to make it happen at scale and pace.  The replacement of windmills and watermills by static steam engines had already allowed factories to be built anywhere – rather than limiting them to the tops of windy hills and the sides of fast flowing rivers. But it was not until the industrial revolution had achieved sufficient momentum that road and canal transport became a serious constraint to further growth of industry, wealth and the British Empire.

But not everyone was happy with the impact that mechanisation brought – the Luddites were the skilled craftsmen who opposed the use of mechanised looms that could be operated by lower-skilled and therefore cheaper labour.  They were crushed in 1812 by political forces more powerful than they were – and the term “luddite” is now used for anyone who blindly opposes change from a position self-protection.

Only 140 years later it was all over for the birthplace of the Rail Age – the steam locomotive was relegated to the museums when Dr Richard Beeching , the efficiency-focussed Technical Director of ICI, published his reports that led to the cost-improvement-programme (CIP) that reorganised the railways and led to the loss of 70,000 jobs, hundreds of small “unprofitable” stations and 1000’s of miles of track.  And the reason for the collapse of the railways was that roads had leap-frogged both canals and railways because the “internal combustion engine” proved a smaller, lighter, more powerful, cheaper and more flexible alternative to steam or horses.

It is of historical interest that Henry Ford developed the production line to mass produce automobiles at a price that a factory worker could afford – and Toyoda invented a self-stopping mechanised loom that improved productivity dramatically by preventing damaged cloth being produced if a thread broke by accident. The historical links come together because Toyoda sold the patents to his self-stopping loom to fund the creation of the Toyota Motor Company which used Henry Ford’s production-line design and integrated the Toyoda self-monitoring, stopping and continuous improvement philosophy.

It was not until twenty years after British Rail was created that Japan emerged as an industrial superpower by demonstrating that it had learned how to improve both quality and reduce cost much more effectively than the “complacent” Europe and America. The tables were turned and this time it was the West that had to learn – and quickly.  Unfortunately not quickly enough. Other developing countries seized the opportunity that mass mechanisation, customisation and a large, low-expectation, low-cost workforce offered. They now produce manufactured goods at prices that European and American companies cannot compete with. Made in Britain has become Made in China.

The lesson of history has been repeated many times – innovations are like seeds that germinate but do not disseminate until the context is just right – then they grow, flower, seed and spread – and are themselves eventually relegated to museums by the innovations that they spawned.

Improvement Science has been in existence for a long time in various forms, and it is now finding more favourable soil to grow as traditional reactive and incremental improvement methods run out of steam when confronted with complex system problems. Wicked problems such as a world population that is growing larger and older at the same time as our reserves of non-renewable natural resources are dwindling.

The promise that Improvement Science offers is the ability to avoid the boom-to-bust economic roller-coaster that devastates communities twice – on the rise and again on the fall. Improvement Science offers an approach that allows sensible and sustainable changes to be planned, implemented and then progressively improved.

So what do we want to do? Watch from the sidelines and hope, or leap aboard and help?

And remember what happened to the Luddites!

The Bucket Brigade Fire Fighting Service

Fire-fighting is a behaviour that has a long history, and before Fireman Sam arrived on the scene we had the Bucket Brigade.  This was a people-intensive process designed to deliver water from the nearest pump, pond or river with as little risk, delay and effort as possible. The principle of a bucket-brigade is that a chain of people forms between the pump and the fire and they pass buckets in two directions – full ones from the pump to the fire and empty ones from the fire back to the pump.

A bucket brigade is useful metaphor for many processes and an Improvement Science Practitioner (ISP) can learn a lot from exploring its behaviour.

First of all the number of steps in the process or stream is fixed because it is determined by the distance between the pump and the fire. The time it takes for a Bucket Passer to pass a bucket to the next person is predictable  too and it is this cycle-time that determines the rate at which a bucket will move along the line. The fixed step-number and fixed cycle-time implies that the time it takes for a bucket to pass from one end of the line to the other is fixed too. It does not matter if the bucket is empty, half empty or full – the delivery time per bucket is consistent from bucket to bucket. The outflow however is not fixed – it is determined by how full each bucket is when it reaches the end of the line: empty buckets means zero flow, full buckets means maximum flow.

This implies that the process is behaving like a time-trap because the delivery time and the delivery volume (i.e. flow) are independent. Having bigger buckets or fuller buckets makes no difference to the time it takes to traverse the line but it does influence the outflow.

Most systems have many processes that are structured just like a bucket brigade: each step in the process contributes to completing the task before handing the part-completed task on to the next step.

The four dimensions of improvement are Safety, Flow, Quality and Productivity and we can see that, if we are not dropping buckets, then the safety, flow and quality are fixed by the design of the process. So what can we do to improve productivity?

Well, it is evident that the time it takes to do the hand-off adds to the cycle-time of each step. So along comes the Fire Service Finance Department who sees time-as-money and they work out that the unit cost of each step of the process could be reduced by accumulating the jobs at each stage and then handing them off as a batch – because the time-is-money and the cost of the hand-off can now be shared across several buckets. They conclude that the unit cost for the steps will come down and productivity will go up – simple maths and intuitively obvious in theory – but does it actually work in reality?

Q1: Does it reduce the number of Bucket Passers? No. We need just as many as we did before. What we are doing is replacing the smaller buckets with bigger ones – and that will require capital investment.  So when our Finance Department use the lower unit cost as justification then the bigger, more expensive buckets start to look like a good financial option – on paper. But looking at the wage bills we can see that they are the same as before so this raises a question: have the bigger buckets increased the flow or reduced the delivery time? We will need a tangible, positive and measurable  improvement in productivity to justify our capital investment.

To summarise: we have the same number of Bucket Passers working at the same cycle time so there is no improvement in how long it takes for the water to reach the fire from the pump! The delivery time is unchanged. And using bigger buckets implies that the pump needs to be able to work faster to fill them in one cycle of the process – but to minimise cost when we created the Fire Service we bought a pump with just enough average flow capacity and it cannot be made to increase its flow. So, equipped with a bigger bucket the first Bucket Passer has to wait longer for their bigger bucket to be filled before passing it on down the line.  This implies a longer cycle-time for the first step, and therefore also for every step in the chain. So the delivery-time will actually get longer and the flow will stay the same – on average. All we have appear to have achieved is a higher cost and longer delivery time – which is precisely the opposite of what we intended. Productivity has actually fallen!

In a state of  near-panic the Fire Service Finance Department decide to measure the utilisation of the Bucket Passers and discover that it has fallen which must mean that they have become lazy! So a Push Policy is imposed to make them work faster – the Service cannot afford financial inducements – and threats cost nothing. The result is that in their haste to avoid penalties the bigger, fuller, heavier buckets get fumbled and some of the precious water is lost – so less reaches the fire.  The yield of the process falls and now we have a more expensive, longer delivery time, lower flow process. Productivity has fallen even further and now the Bucket Passers and Accountants are at war. How much worse can it get?

Where did we go wrong?

We made an error of omission. We omitted to learn the basics of process design before attempting to improve the productivity of our time-trap dominated process!  Our error of omission led us to confuse the step, stage, stream and system and we incorrectly used stage metrics (unit cost and utilisation) in an attempt to improve system performance (productivity). The outcome was the exact opposite of what we intended; a line of unhappy Bucket Passers; a frustrated Finance Department and an angry Customer whose house burned down because our Fire Service did not deliver enough water on time. Lose-Lose-Lose.

Q1: Is it possible to improve the productivity of a time-trap design?

Q1: Yes, it is.

Q2: How do we avoid making the same error?

A2: Follow the FISH .

March Madness

Whether we like it or not we are driven by a triumvirate of celestial clocks. Our daily cycle is the result of the rotation of the Earth; the ebb and flow of the tides is caused by the interaction of the orbiting Moon and the spinning Earth; and the annual sequence of seasons is the outcome of the tilted Earth circling the Sun.  The other planets, stars and galaxies appear not to have much physical influence – despite what astrologists would have us believe. 

Hares are said to behave oddly in the month of March – as popularised by Lewis Carroll in Alice’s Adentures in Wonderland – but there is another form of March Madness that affects people – one that is not celestial and seasonal in origin – its cause is fiscal and financial. The madness that accompanies the end of the tax year.

This fiscal cycle is man-made and is arbitrary – it could just as well be any other month and does indeed differ from country to country – and the reason it is April 6th in the UK is because it is based on the ecclesiastical year which starts on March 25th but was shifted to April 6th when 11 days were lost on the adoption of the Gregorian calendar in 1752.  The driver of the fiscal cycle is taxation and the embodiment in Law of the requirement to present standard annual financial statements for the purpose of personal taxation.

The problem is that this system was designed for a time when the bean-counting bureaucracy was people-pen-paper based and to perform this onerous task more often than annually would have been counter-productive.  That is the upside. The downside is that an annual fiscal cycle shackled to a single date creates a feast-and-famine cash flow effect. The public coffers would have a shark-fin shaped wonga-in-progress chart!  And preparing for the end of the financial year creates multi-faceted March madness: annual cash hoarding leads to delayed investment decisions and underspent budgets being disposed of carelessly; short term tax minimisation strategies distort long term investment decisions and financial targets take precident over quality and delivery goals. Success or failure hinges on the the financial equivalent of threading the eye of a long needle with a bargepole. The annual fiscal policy distorts the behaviour of system and benefits nobody. 

It would be a better design for everyone if fiscal feedback was continuous – especially as the pace of change is quickening to the point that an annual financial planning cycle is painfully long . The good news is that there are elements of fiscal load levelling aleady: companies can choose a date for their annual returns; sales tax is charged continuosuly and collected quarterly; income tax is collected monthly or weekly. But with the ubiquitous digital computer the cost of the bureaucracy is now so low that the annual fiscal fiasco is technically unnecessary and it has become more of a liability than an asset.

What would be the advantages of scrapping it? Individuals could change their tax review date and interval to one that better suits them and this would spread the bureaucratic burden on the inland revenue over the year; the country would have a smoother tax revenue flow and less ]need to  borrow to fund public expenses; and publically funded organisations could budget on a trimester or even monthly basis and become more responsive to financial fluxes and changes in the system. It could be better for everyone – but it would require radical redesign. We are not equipped to do that – we would need to understand the principles of improvement science that relate to elimination of variation.

And what about the other annual cycle that plagues the population – the Education Niggle? This is the one that requires everyone with children of school age to be forced to take family holidays at the same time: Easter, Summer and Christmas – creating another batch-and-queue feast-and-famine cycle. This fiasco originated in the early 1800’s when educational reformers believed that continuous schooling was unhealthy and institutionalised when the Forster Elementary Education Act of 1870 provided partially state funded schools – especially for the poor – to provide a sufficient supply of educated workers for the burgeoning Industrial Revolution. Once the expectation of a long summer vacation was established it has been difficult to change.  More recent evidence shows that the loss of learning momentum has a detrimental effect on children not to mention the logistical problems created if both parents are working. Children are born all year round and have wide variation in their abilities and rate of learning and to impose an arbitrary educational cycle is clearly more for the convenience of the schools and teachers than aligned to the needs of children, their families or society.  As our required skills become more generic and knowledge focussed the need for effective and efficient continuous education has never been greater. Digital communication technology is revolutionising this whole sector and individually-tailored, integrated, life-long  learning and continuous assessment is now both feasible and more affordable.

And then there is healthcare!  Where do we start?

It is time to challenge and change our out-of-date no-longer-fit-for-purpose bureaucratic establishment designs – so there will be no shortage of opportunties or work for every competent and capable Improvement Scientist!

The Safety Line in the Quality Sand

Improvement Science is about getting better – and it is also about not getting worse.

These are not the same thing. Getting better requires dismantling barriers that block improvement. Not getting worse requires building barriers to block deterioration.

When things get tough and people start to panic it is common to see corners being cut and short-term quick fixes taking priority over long-term common sense.  The best defense against this self-defeating behaviour is the courage and discipline to say “This is our safety line in the quality sand and we do not cross it“.  This is not dogma it is discipline. Dogma is blind acceptance; discipline is applied wisdom.

Leaders show their mettle when times are difficult not when times are easy.  A leader who abandons their espoused principles when under pressure is a liability to themselves and to their teams and organisations.

The barrier that prevents descent into chaos is not the leader – it is the principle that there is a minimum level of acceptable quality – the line that will not be crossed. So when a decision needs to be made between safety and money the choice is not open to debate. Safety comes first.  

Only those who believe that higher quality always costs more will argue for compromise. So when the going gets tough those who question the Safety Line in the Quality Sand are the ones to challenge by respectfully reminding them of their own principles.

This challenge will require courage because they may be the ones in the seats of power.  But when leaders compromise their own principles they have sacrificed their credibility and have abdicated their power.

Single Sell System

In the pursuit of improvement it must be remembered that the system must remain viable: better but dead is not the intended outcome.  Viability of socioeconomic systems implies that money is flowing to where it is needed, when it is needed and in the amounts that are needed.
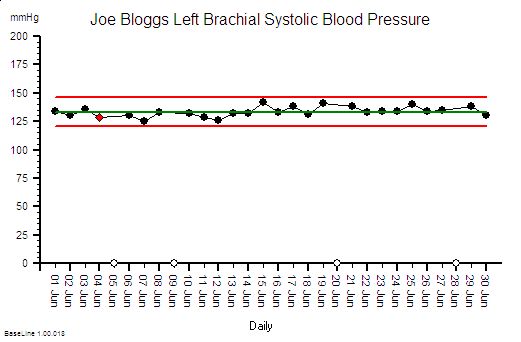
Money is like energy – it only does worthwhile work when it is moving: so the design of more effective money-streams is a critical part of socioeconomic system improvement.

But this is not easy or obvious because the devil is in the detail and complexity grows quicklyand obscures the picture. This lack of clear picture creates the temptation to clean, analyse, simplify and conceptualise and very often leads to analysis-paralysis and then over-simplification.

There is a useful metaphor for this challenge.

Biological systems use energy rather than money and the process of improvement has a different name – it is called evolution. Each of us is an evolution experiment. The viability requirement is the same though – the success of the experiment is measured by our viability. Do our genes and memes survive after we have gone?

It is only in recent times that the mechanism of this biological system has become better understood. It was not until the 19th Century that we realised that complex organisms were made of reproducing cells; and later that there were rules that governed how inherited characteristics passed from generation to generation; and that the vehicle of transmission was a chemical code molecule called DNA that is present in every copy of every cell capable of reproduction.

We learned that our chemical blueprint is stored in the nucleus of every cell (the dark spots in the picture of cells) and this led to the concept that the nucleus worked like a “brain” that issues chemical orders to the cell in the form of a very similar molecule called RNA.  This cellular command-and-control model is unfortunately more a projection of the rhetoric of society than the reality of the situation. The nucleus is not a “brain” – it is a gonad. The “brain” of a cell is the surface membrane – the sensitive interface between outside and inside; where the “sensor” molecules in the outer cell membrane connect to “effector” molecules on the inside.  Cells think with their skin – and their behaviour is guided by their  internal content and external context. Nature and nurture working as a system.

Cells have evolved to collaborate. Rogue cells that become “mentally” unstable and that break away, start to divide, and spread in an uncollaborative and selfish fashion threaten the viability of the whole: they are called malignant. The threat of malignant behaviour to long term viability is so great that we have evolved sophisticated mechanisms to detect and correct malignant behaviour. The fact that cancer is still a problem is because our malignancy defense mechanisms are not 100% effective. 

This realisation of the importance of the cell has led to a focus of medical research on understand how individual cells “sense”, “think”, “act” and “communicate” and has led to great leaps in our understanding of how multi-celled systems called animals and plants work; how they can go awry; and what can be done to prevent and correct these cellular niggles.  We are even learning how to “fix” bits of the the chemical blueprint to correct our chemical software glitches. We are no where near being able to design a cell from scratch though. We simply do not understand enough about how it works.

In comparison, the “single-sell” in an economic system could be considered to be a step in a process – the point where the stream and the silo meet – where expenses are converted to revenue for example.  I will wantonly bend the rules of grammar and use the word “sell” to distinguish it visually from “cell”. So before trying to understand the complex emergent behaviour of a multi-selled economic system we first need to understand better one sell works. How does work flow and time flow and money flow combined at the single sell?

When we do so we learn that the “economic mechanism” of a single sell can be described completely because it is a manfestation of the Laws of Physics – just as the mechanism of the weather can be describe using a small number of equations that combine to describe the flow, pressure, density, temperature etc of the atmospheric gases.  Our simplest single-selled economic system is described by a set of equations – there are about twenty of them in fact.

So, trying to work out in our heads how even a single sell in an economic system will behave amounts to mentally managing twenty simultanous equations – which is a bit of a problem because we’re not very good at that mental maths trick. The best we can do is to learn the patterns in the interdependent behaviour of the outputs of the equations; to recognise what they imply; and then how to use that understanding to craft wiser decisions.

No wonder the design of a viable socioeconomic multi-selled system seems to be eluding even the brightest economic minds at the moment!  It is a complicated system which exhibits complex behaviour.  Is there a better approach?  Our vastly more complex biological counterparts called “organisms” seem to have discovered one. So what can we learn from them?

One lesson might be that is is a good design to detect and correct malignant behaviour early; the unilateral, selfish, uncollaborative behaviour that multiplies, spreads, and becomes painful, incurable then lethal.

First we need to raise awareness and recognition of it … only then can we challenge and contain its toxic legacy.   

The Devil and the Detail

There are two directions from which we can approach an improvement challenge. From the bottom up – starting with the real details and distilling the principle later; and from the top down – starting with the conceptual principle and doing the detail later.  Neither is better than the other – both are needed.

As individuals we have an innate preference for real detail or conceptual principle – and our preference is manifest by the way we think, talk and behave – it is part of our personality.  It is useful to have insight into our own personality and to recognise that when other people approach a problem in a different way then we may experience a difference of opinion, a conflict of styles, and possibly arguments.  

One very well established model of personality type was proposed by Carl Gustav Jung who was a psychologist and who approached the subject from the perspective of understanding psychological “illness”.  Jung’s “Psychological Types” was used as the foundation of the life-work of Isabel Briggs Myers who was not a psychologist and who was looking from the direction of understanding psychological “normality”. In her book Gifts Differing – Understanding Personality Type (ISBN 978-0891-060741) she demonstrates using empirical data that there is not one normal or ideal type that we are all deviate from – rather that there is a set of stable types that each represents a “different gift”. By this she means that different personality types are suited to different tasks and when the type resonantes with the task it results in high-performance and is seen an asset or “strength” and when it does not it results in low performance and is seen as a liability or “weakness”.

One of the multiple dimensions of the Jungian and Myers-Briggs personality type model is the Sensor – iNtuitor dimension the S-N dimension. This dimension represents where we hold our reference model that provides us with data – data that we convert to information – and informationa the we use to derive decisions and actions.

A person who is naturally inclined to the Sensor end of the S-N dimension prefers to use Reality and Actuality as their reference – and they access it via their senses – sight, sound, touch, smell and taste. They are often detail and data focussed; they trust their senses and their conscious awareness; and they are more comfortable with routine and structure.  

A person who is naturally inclined to the iNtuitor end of the S-N dimension prefers to use Rhetoric and Possibility as their reference and their internal conceptual model that they access via their intuition. They are often principle and concept focussed and discount what their senses tell them in favour their intuition. Intuitors feel uncomfortable with routine and structure which they see as barriers to improvement.  

So when a Sensor and an iNtuitor are working together to solve a problem they are approaching it from two different directions and even when they have a common purpose, common values and a common objective it is very likely that conflict will occur if they are unaware of their different gifts

Gaining this awareness is a key to success because the synergy of the two approaches is greater than either working alone – the sum is greater than the parts – but only if there is awareness and mutual respect for the different gifts.  If there is no awareness and low mutual respect then the sum will be less than the parts and the problem will not be dissolvable.

In her research, Isabel Briggs Myers found that about 60% of high school students have a preference for S and 40% have a preference for N – but when the “academic high flyers”  were surveyed the ratio was S=17%  and N=83% – and there was no difference between males and females.  When she looked at the S-N distribution in different training courses she discovered that there were a higher proportion of S-types in Administrators (59%), Police (80%), and Finance (72%) and a higher proportion of N-types in Liberal Arts (59%), Engineering (65%), Science (83%), Fine Arts (91%), Occupational Therapy (66%), Art Education (87%), Counselor Education (85%), and Law (59%).  Her observation suggested that individuals select subjects based on their “different gifts” and this throws an interesting light on why traditional professions may come into conflict and perhaps why large organisations tend to form departments of “like-minded individuals”.  Departments with names like Finance, Operations and Governance  – or FOG.

This insight also offers an explanation for the conflict between “strategists” who tend to be N-types and who naturally gravitate to the “manager” part of an organisation and the “tacticians” who tend to be S-types and who naturally gravitate to the “worker” part of the same organisation.

It  has also been shown that conventional “intelligence tests” favour the N-types over the S-types and suggests why highly intelligent academics my perform very poorly when asked to apply their concepts and principles in the real world. Effective action requires pragmatists – but academics tend to congregate in academic instituitions – often disrespectfully labelled by pragmatists as “Ivory Towers”.      

Unfortunately this innate tendency to seek-like-types is counter-productive because it re-inforces the differences, exacerbates the communication barriers,  and leads to “tribal” and “disrespectful” and “trust eroding” behaviour, and to the “organisational silos” that are often evident.

Complex real-world problems cannot be solved this way because they require the synergy of the gifts – each part playing to its strength when the time is right.

The first step to know-how is self-awareness.

If you would like to know your Jungian/MBTI® type you can do so by getting the app: HERE

Argument-Free-Problem-Solving

I used to be puzzled when I reflected on the observation that we seem to be able to solve problems as individuals much more quickly and with greater certainty than we could as groups.

I used to believe that having many different perspectives of a problem would be an asset – but in reality it seems to be more of a liability.

Now when I receive an invitation to a meeting to discuss an issue of urgent importance my little heart sinks as I recall the endless hours of my limited life-time wasted in worthless, unproductive discussion.

But, not to be one to wallow in despair I have been busy applying the principles of Improvement Science to this ubiquitous and persistent niggle.  And I have discovered something called Argument Free Problem Solving (AFPS) – or rather that is my name for it because it does what it says on the tin – it solves problems without arguments.

The trick was to treat problem-solving as a process; to understand how we solve problems as individuals; what are the worthwhile bits; and how we scupper the process when we add-in more than one person; and then how to design-to-align the  problem-solving workflow so that it …. flows. So that it is effective and efficient.

The result is AFPS and I’ve been testing it out. Wow! Does it work or what!

I have also discovered that we do not need to create an artificial set of Rules or a Special Jargon – we can  apply the recipe to any situation in a very natural and unobtrusive way.  Just this week I have seen it work like magic several times: once in defusing what was looking like a big bust up looming; once t0 resolve a small niggle that had been magnified into a huge monster and a big battle – the smoke of which was obscuring the real win-win-win opportunity; and once in a collaborative process improvement exercise that demonstrated a 2000% improvement in system productivity – yes – two thousand percent!

So AFPS  has been added to the  Improvement Science treasure chest and (because I like to tease and have fun) I have hidden the key in cyberspace at coordinates  http://www.saasoft.com/moodle

Mwah ha ha ha – me hearties! 

Cutting The Cost Cake

We are in now in cost cake cutting times! We are being forced by financial reality to tighten the fiscal belt until our eyeballs water – and then more so.

The cost cake is a mixture of three ingredients – the worthwhile, the necessary, and the rest – the stuff that is worthless and not wanted – the worthless stuff, the unhealthy stuff, the waste.  But it costs just as much per morsel as the rest. And there is a problem – all three ingredients are mixed up together and our weighing scales can not say how much of each is in there – it just tells us the total weight and cost.

If we are forced to cut the cost of the cake we have to cut all three. Our cake gets smaller – not better – which means that we all go a bit hungrier. Or as is more likely – the hand that weilds the knife will cut themselves a full slice and someone else will starve.

Would it not be better if we could separate out the ingredients and see them for what the are – worthy (green), necessary (yellow) and the worthless waste (red) – and then use the knife to slice off the waste?  Then we could mix up what is left and share out a smaller but healthier meal.  We might even re-invest our savings in buying more of the better ingredients and bake ourselves a healthier cake. We would have a choice. 

If we translate this culinary metaphor into the real world then we will see the need for a way of separating and counting the cost of time spent on worthy, necessary and worthless work. If we can do that then we can remove just the worthless stuff and either reduce the cost or  reinvest the resource in something more worthwhile.

The problem we find when we try to do this is that our financial accounting systems do not work this way.

The closed door to a healthier future is staring us in the face – it is barn-door obvious – we just need to design our accounting methods so that they can do what we need them to do.

What are we waiting for?  Let us work together to find a way to open that closed door. It is in all of our interests! 


Three Blind Men and an Elephant

The Blind Men and the Elephant Story   – adapted from the poem by John Godfrey Saxe.

 “Three blind men were discussing exactly what they believed an elephant to be, since each had heard how strange the creature was, yet none had ever seen one before. So the blind men agreed to find an elephant and discover what the animal was really like. It did not take the blind men long to find an elephant at a nearby market. The first blind man approached the animal and felt the elephant’s firm flat side. “It seems to me that an elephant is just like a wall,” he said to his friends. The second blind man reached out and touched one of the elephant’s tusks. “No, this is round and smooth and sharp – an elephant is like a spear.” Intrigued, the third blind man stepped up to the elephant and touched its trunk. “Well, I can’t agree with either of you; I feel a squirming writhing thing – surely an elephant is just like a snake.” All three blind men continued to argue, based on their own individual experiences, as to what they thought an elephant was like. It was an argument that they were never able to resolve. Each of them was concerned only with their own experience. None of them could see the full picture, and none could appreciate any of the other points of view. Each man saw the elephant as something quite different, and while each blind man was correct they could not agree.”

The Elephant in this parable is the NHS and the three blind men are Governance, Operations and Finance. Each is blind because he does not see reality clearly – his perception is limited to assumptions and crippled by distorted data. The three blind men cannot agree because they do not share a common understanding of the system; its parts and its relationships. Each is looking at a multi-dimensional entity from one dimension only and for each there is no obvious way forward. So while they appear to be in conflict about the “how” they are paradoxically in agreement about the “why”. The outcome is a fruitless and wasteful series of acrimonious arguments, meaningless meetings and directionless discussions.  It is not until they declare their common purpose that their differences of opinion are seen in a realistic perspective and as an opportunity to share and to learn and to create an collective understanding that is greater than the sum of the parts.

Focus-on-the-Flow

One of the foundations of Improvement Science is visualisation – presenting data in a visual format that we find easy to assimilate quickly – as pictures.

We derive deeper understanding from observing how things are changing over time – that is the reality of our everyday experience.

And we gain even deeper understanding of how the world behaves by acting on it and observing the effect of our actions. This is how we all learned-by-doing from day-one. Most of what we know about people, processes and systems we learned long before we went to school.


When I was at school the educational diet was dominated by rote learning of historical facts and tried-and-tested recipes for solving tame problems. It was all OK – but it did not teach me anything about how to improve – that was left to me.

More significantly it taught me more about how not to improve – it taught me that the delivered dogma was not to be questioned. Questions that challenged my older-and-better teachers’ understanding of the world were definitely not welcome.

Young children ask “why?” a lot – but as we get older we stop asking that question – not because we have had our questions answered but because we get the unhelpful answer “just because.”

When we stop asking ourselves “why?” then we stop learning, we close the door to improvement of our understanding, and we close the door to new wisdom.


So to open the door again let us leverage our inborn ability to gain understanding from interacting with the world and observing the effect using moving pictures.

Unfortunately our biology limits us to our immediate space-and-time, so to broaden our scope we need to have a way of projecting a bigger space-scale and longer time-scale into the constraints imposed by the caveman wetware between our ears.

Something like a video game that is realistic enough to teach us something about the real world.

If we want to understand better how a health care system behaves so that we can make wiser decisions of what to do (and what not to do) to improve it then a real-time, interactive, healthcare system video game might be a useful tool.

So, with this design specification I have created one.

The goal of the game is to defeat the enemy – and the enemy is intangible – it is the dark cloak of ignorance – literally “not knowing”.

Not knowing how to improve; not knowing how to ask the “why?” question in a respectful way.  A way that consolidates what we understand and challenges what we do not.

And there is an example of the Health Care System Flow Game being played here.

Design-for-Productivity

One tangible output of process or system design exercise is a blueprint.

This is the set of Policies that define how the design is built and how it is operated so that it delivers the specified performance.

These are just like the blueprints for an architectural design, the latter being the tangible structure, the former being the intangible function.

A computer system has the same two interdependent components that must be co-designed at the same time: the hardware and the software.


The functional design of a system is manifest as the Seven Flows and one of these is Cash Flow, because if the cash does not flow to the right place at the right time in the right amount then the whole system can fail to meet its design requirement. That is one reason why we need accountants – to manage the money flow – so a critical component of the system design is the Budget Policy.

We employ accountants to police the Cash Flow Policies because that is what they are trained to do and that is what they are good at doing – they are the Guardians of the Cash.

Providing flow-capacity requires providing resource-capacity, which requires providing resource-time; and because resource-time-costs-money then the flow-capacity design is intimately linked to the budget design.

This raises some important questions:
Q: Who designs the budget policy?
Q: Is the budget design done as part of the system design?
Q: Are our accountants trained in system design?

The challenge for all organisations is to find ways to improve productivity, to provide more for the same in a not-for-profit organisation, or to deliver a healthy return on investment in the for-profit arena (and remember our pensions are dependent on our future collective productivity).

To achieve the maximum cash flow (i.e. revenue) at the minimum cash cost (i.e. expense) then both the flow scheduling policy and the resource capacity policy must be co-designed to deliver the maximum productivity performance.


If we have a single-step process it is relatively easy to estimate both the costs and the budget to generate the required activity and revenue; but how do we scale this up to the more realistic situation when the flow of work crosses many departments – each of which does different work and has different skills, resources and budgets?

Q: Does it matter that these departments and budgets are managed independently?
Q: If we optimise the performance of each department separately will we get the optimum overall system performance?

Our intuition suggests that to maximise the productivity of the whole system we need to maximise the productivity of the parts.  Yes – that is clearly necessary – but is it sufficient?


To answer this question we will consider a process where the stream flows though several separate steps – separate in the sense that that they have separate budgets – but not separate in that they are linked by the same flow.

The separate budgets are allocated from the total revenue generated by the outflow of the process. For the purposes of this exercise we will assume the goal is zero profit and we just need to calculate the price that needs to be charged the “customer” for us to break even.

The internal reports produced for each of our departments for each time period are:
1. Activity – the amount of work completed in the period.
2. Expenses – the cost of the resources made available in the period – the budget.
3. Utilisation – the ratio of the time spent using resources to the total time the resources were available.

We know that the theoretical maximum utilisation of resources is 100% and this can only be achieved when there is zero-variation. This is impossible in the real world but we will assume it is achievable for the purpose of this example.

There are three questions we need answers to:
Q1: What is the lowest price we can achieve and meet the required demand?
Q2: Will optimising each step independently step give us this lowest price?
Q3: How do we design our budgets to deliver maximum productivity?


To explore these questions let us play with a real example.

Let us assume we have a single stream of work that crosses six separate departments labelled A-F in that sequence. The department budgets have been allocated based on historical activity and utilisation and our required activity of 50 jobs per time period. We have already worked hard to remove all the errors, variation and “waste” within each department and we have achieved 100% observed utilisation of all our resources. We are very proud of our high effectiveness and our high efficiency.

Our current not-for-profit price is £202,000/50 = £4,040 and because our observed utilisation of resources at each step is 100% we conclude this is the most efficient design and that this is the lowest possible price.

Unfortunately our celebration is short-lived because the market for our product is growing bigger and more competitive and our market research department reports that to retain our market share we need to deliver 20% more activity at 80% of the current price!

A quick calculation shows that our productivity must increase by 50% (New Activity/New Price = 120%/80% = 150%) but as we already have a utilisation of 100% then this challenge looks hopelessly impossible.  To increase activity by 20% will require increasing flow-capacity by 20% which will imply a 20% increase in costs so a 20% increase in budget – just to maintain the current price.  If we no longer have customers who want to pay our current price then we are in trouble.

Fortunately our conclusion is incorrect – and it is incorrect because we are not using the data available to co-design the system such that cash flow and work flow are aligned.  And we do not do that because we have not learned how to design-for-productivity.  We are not even aware that this is possible.  It is, and it is called Value Stream Accounting.

The blacked out boxes in the table above hid the data that we need to do this – an we do not know what they are. Yet.

But if we apply the theory, techniques and tools of system design, and we use the data that is already available then we get this result …

 We can see that the total budget is less, the budget allocations are different, the activity is 20% up and the zero-profit price is 34% less – which is a 83% increase in productivity!

More than enough to stay in business.

Yet the observed resource utilisation is still 100%  and that is counter-intuitive and is a very surprising discovery for many. It is however the reality.

And it is important to be reminded that the work itself has not changed – the ONLY change here is the budget policy design – in other words the resource capacity available at each stage.  A zero-cost policy change.

The example answers our first two questions:
A1. We now have a price that meets our customers needs, offers worthwhile work, and we stay in business.
A2. We have disproved our assumption that 100% utilisation at each step implies maximum productivity.

Our third question “How to do it?” requires learning the tools, techniques and theory of System Engineering and Design.  It is not difficult and it is not intuitively obvious – if it were we would all be doing it.

Want to satisfy your curiosity?
Want to see how this was done?
Want to learn how to do it yourself?

You can do that here.


For more posts like this please vote here.
For more information please subscribe here.

What Is The Cost Of Reality?

It is often assumed that “high quality costs more” and there is certainly ample evidence to support this assertion: dinner in a high quality restaurant commands a high price. The usual justifications for the assumption are (a) quality ingredients and quality skills cost more to provide; and (b) if people want a high quality product or service that is in relatively short supply then it commands a higher price – the Law of Supply and Demand.  Together this creates a self-regulating system – it costs more to produce and so long as enough customers are prepared to pay the higher price the system works.  So what is the problem? The problem is that the model is incorrect. The assumption is incorrect.  Higher quality does not always cost more – it usually costs less. Convinced?  No. Of course not. To be convinced we need hard, rational evidence that disproves our assumption. OK. Here is the evidence.

Suppose we have a simple process that has been designed to deliver the Perfect Service – 100% quality, on time, first time and every time – 100% dependable and 100% predictable. We choose a Service for our example because the product is intangible and we cannot store it in a warehouse – so it must be produced as it is consumed.

To measure the Cost of Quality we first need to work out the minimum price we would need to charge to stay in business – the sum of all our costs divided by the number we produce: our Minimum Viable Price. When we examine our Perfect Service we find that it has three parts – Part 1 is the administrative work: receiving customers; scheduling the work; arranging for the necessary resources to be available; collecting the payment; having meetings; writing reports and so on. The list of expenses seems endless. It is the necessary work of management – but it is not what adds value for the customer. Part 3 is the work that actually adds the value – it is the part the customer wants – the Service that they are prepared to pay for. So what is Part 2 work? This is where our customers wait for their value – the queue. Each of the three parts will consume resources either directly or indirectly – each has a cost – and we want Part 3 to represent most of the cost; Part 2 the least and Part 1 somewhere in between. That feels realistic and reasonable. And in our Perfect Service there is no delay between the arrival of a customer and starting the value work; so there is  no queue; so no work in progress waiting to start, so the cost of Part 2 is zero.  

The second step is to work out the cost of our Perfect Service – and we could use algebra and equations to do that but we won’t because the language of abstract mathematics excludes too many people from the conversation – let us just pick some realistic numbers to play with and see what we discover. Let us assume Part 1 requires a total of 30 mins of work that uses resources which cost £12 per hour; and let us assume Part 3 requires 30 mins of work that uses resources which cost £60 per hour; and let us assume Part 2 uses resources that cost £6 per hour (if we were to need them). We can now work out the Minimum Viable Price for our Perfect Service:

Part 1 work: 30 mins @ £12 per hour = £6
Part 2 work:  = £0
Part 3 work: 30 mins at £60 per hour = £30
Total: £36 per customer.

Our Perfect Service has been designed to deliver at the rate of demand which is one job every 30 mins and this means that the Part 1 and Part 3 resources are working continuously at 100% utilisation. There is no waste, no waiting, and no wobble. This is our Perfect Service and £36 per job is our Minimum Viable Price.         

The third step is to tarnish our Perfect Service to make it more realistic – and then to do whatever is necessary to counter the necessary imperfections so that we still produce 100% quality. To the outside world the quality of the service has not changed but it is no longer perfect – they need to wait a bit longer, and they may need to pay a bit more. Quality costs remember!  The question is – how much longer and how much more? If we can work that out and compare it with our Minimim Viable Price we will get a measure of the Cost of Reality.

We know that variation is always present in real systems – so let the first Dose of Reality be the variation in the time it takes to do the value work. What effect does this have?  This apparently simple question is surprisingly difficult to answer in our heads – and we have chosen not to use “scarymatics” so let us run an empirical experiment and see what happens. We could do that with the real system, or we could do it on a model of the system.  As our Perfect Service is so simple we can use a model. There are lots of ways to do this simulation and the technique used in this example is called discrete event simulation (DES)  and I used a process simulation tool called CPS (www.SAASoft.com).

Let us see what happens when we add some random variation to the time it takes to do the Part 3 value work – the flow will not change, the average time will not change, we will just add some random noise – but not too much – something realistic like 10% say.

The chart shows the time from start to finish for each customer and to see the impact of adding the variation the first 48 customers are served by our Perfect Service and then we switch to the Realistic Service. See what happens – the time in the process increases then sort of stabilises. This means we must have created a queue (i.e. Part 2 work) and that will require space to store and capacity to clear. When we get the costs in we work out our new minimum viable price it comes out, in this case, to be £43.42 per task. That is an increase of over 20% and it gives us a measure of the Cost of the Variation. If we repeat the exercise many times we get a similar answer, not the same every time because the variation is random, but it is always an extra cost. It is never less that the perfect proce and it does not average out to zero. This may sound counter-intuitive until we understand the reason: when we add variation we need a bit of a queue to ensure there is always work for Part 3 to do; and that queue will form spontaneously when customers take longer than average. If there is no queue and a customer requires less than average time then the Part 3 resource will be idle for some of the time. That idle time cannot be stored and used later: time is not money.  So what happens is that a queue forms spontaneously, so long as there is space for it,  and it ensures there is always just enough work waiting to be done. It is a self-regulating system – the queue is called a buffer.

Let us see what happens when we take our Perfect Process and add a different form of variation – random errors. To prevent the error leaving the system and affecting our output quality we will repeat the work. If the errors are random and rare then the chance of getting it wrong twice for the same customer will be small so the rework will be a rough measure of the internal process quality. For a fair comparison let us use the same degree of variation as before – 10% of the Part 3 have an error and need to be reworked – which in our example means work going to the back of the queue.

Again, to see the effect of the change, the first 48 tasks are from the Perfect System and after that we introduce a 10% chance of a task failing the quality standard and needing to be reworked: in this example 5 tasks failed, which is the expected rate. The effect on the start to finish time is very different from before – the time for the reworked tasks are clearly longer as we would expect, but the time for the other tasks gets longer too. It implies that a Part 2 queue is building up and after each error we can see that the queue grows – and after a delay.  This is counter-intuitive. Why is this happening? It is because in our Perfect Service we had 100% utiliation – there was just enough capacity to do the work when it was done right-first-time, so if we make errors and we create extra demand and extra load, it will exceed our capacity; we have created a bottleneck and the queue will form and it will cointinue to grow as long as errors are made.  This queue needs space to store and capacity to clear. How much though? Well, in this example, when we add up all these extra costs we get a new minimum price of £62.81 – that is a massive 74% increase!  Wow! It looks like errors create much bigger problem for us than variation. There is another important learning point – random cycle-time variation is self-regulating and inherently stable; random errors are not self-regulating and they create inherently unstable processes.

Our empirical experiment has demonstrated three principles of process design for minimising the Cost of Reality:

1. Eliminate sources of errors by designing error-proofed right-first-time processes that prevent errors happening.
2. Ensure there is enough spare capacity at every stage to allow recovery from the inevitable random errors.
3. Ensure that all the steps can flow uninterrupted by allowing enough buffer space for the critical steps.

With these Three Principles of cost-effective design in mind we can now predict what will happen if we combine a not-for-profit process, with a rising demand, with a rising expectation, with a falling budget, and with an inspect-and-rework process design: we predict everyone will be unhappy. We will all be miserable because the only way to stay in budget is to cut the lower priority value work and reinvest the savings in the rising cost of checking and rework for the higher priority jobs. But we have a  problem – our activity will fall, so our revenue will fall, and despite the cost cutting the budget still doesn’t balance because of the increasing cost of inspection and rework – and we enter the death spiral of finanical decline.

The only way to avoid this fatal financial tailspin is to replace the inspection-and-rework habit with a right-first-time design; before it is too late. And to do that we need to learn how to design and deliver right-first-time processes.

Charts created using BaseLine

The Crime of Metric Abuse

We live in a world that is increasingly intolerant of errors – we want everything to be right all the time – and if it is not then someone must have erred with deliberate intent so they need to be named, blamed and shamed! We set safety standards and tough targets; we measure and check; and we expose and correct anyone who is non-conformant. We accept that is the price we must pay for a Perfect World … Yes? Unfortunately the answer is No. We are deluded. We are all habitual criminals. We are all guilty of committing a crime against humanity – the Crime of Metric Abuse. And we are blissfully ignorant of it so it comes as a big shock when we learn the reality of our unconscious complicity.

You might want to sit down for the next bit.

First we need to set the scene:
1. Sustained improvement requires actions that result in irreversible and beneficial changes to the structure and function of the system.
2. These actions require making wise decisions – effective decisions.
3. These actions require using resources well – efficient processes.
4. Making wise decisions requires that we use our system metrics correctly.
5. Understanding what correct use is means recognising incorrect use – abuse awareness.

When we commit the Crime of Metric Abuse, even unconsciously, we make poor decisions. If we act on those decisions we get an outcome that we do not intend and do not want – we make an error.  Unfortunately, more efficiency does not compensate for less effectiveness – if fact it makes it worse. Efficiency amplifies Effectiveness – “Doing the wrong thing right makes it wronger not righter” as Russell Ackoff succinctly puts it.  Paradoxically our inefficient and bureaucratic systems may be our only defence against our ineffective and potentially dangerous decision making – so before we strip out the bureaucracy and strive for efficiency we had better be sure we are making effective decisions and that means exposing and treating our nasty habit for Metric Abuse.

Metric Abuse manifests in many forms – and there are two that when combined create a particularly virulent addiction – Abuse of Ratios and Abuse of Targets. First let us talk about the Abuse of Ratios.

A ratio is one number divided by another – which sounds innocent enough – and ratios are very useful so what is the danger? The danger is that by combining two numbers to create one we throw away some information. This is not a good idea when making the best possible decision means squeezing every last drop of understanding our of our information. To unconsciously throw away useful information amounts to incompetence; to consciously throw away useful information is negligence because we could and should know better.

Here is a time-series chart of a process metric presented as a ratio. This is productivity – the ratio of an output to an input – and it shows that our productivity is stable over time.  We started OK and we finished OK and we congratulate ourselves for our good management – yes? Well, maybe and maybe not.  Suppose we are measuring the Quality of the output and the Cost of the input; then calculating our Value-For-Money productivity from the ratio; and then only share this derived metric. What if quality and cost are changing over time in the same direction and by the same rate? The productivity ratio will not change.


Suppose the raw data we used to calculate our ratio was as shown in the two charts of measured Ouput Quality and measured Input Cost  – we can see immediately that, although our ratio is telling us everything is stable, our system is actually changing over time – it is unstable and therefore it is unpredictable. Systems that are unstable have a nasty habit of finding barriers to further change and when they do they have a habit of crashing, suddenly, unpredictably and spectacularly. If you take your eyes of the white line when driving and drift off course you may suddenly discover a barrier – the crash barrier for example, or worse still an on-coming vehicle! The apparent stability indicated by a ratio is an illusion or rather a delusion. We delude ourselves that we are OK – in reality we may be on a collision course with catastrophe. 

But increasing quality is what we want surely? Yes – it is what we want – but at what cost? If we use the strategy of quality-by-inspection and add extra checking to detect errors and extra capacity to fix the errors we find then we will incur higher costs. This is the story that these Quality and Cost charts are showing.  To stay in business the extra cost must be passed on to our customers in the price we charge: and we have all been brainwashed from birth to expect to pay more for better quality. But what happens when the rising price hits our customers finanical constraint?  We are no longer able to afford the better quality so we settle for the lower quality but affordable alternative.  What happens then to the company that has invested in quality by inspection? It loses customers which means it loses revenue which is bad for its financial health – and to survive it starts cutting prices, cutting corners, cutting costs, cutting staff and eventually – cutting its own throat! The delusional productivity ratio has hidden the real problem until a sudden and unpredictable drop in revenue and profit provides a reality check – by which time it is too late. Of course if all our competitors are committing the same crime of metric abuse and suffering from the same delusion we may survive a bit longer in the toxic mediocrity swamp – but if a new competitor who is not deluded by ratios and who learns how to provide consistently higher quality at a consistently lower price – then we are in big trouble: our customers leave and our end is swift and without mercy. Competition cannot bring controlled improvement while the Abuse of Ratios remains rife and unchallenged.

Now let us talk about the second Metric Abuse, the Abuse of Targets.

The blue line on the Productivity chart is the Target Productivity. As leaders and managers we have bee brainwashed with the mantra that “you get what you measure” and with this belief we commit the crime of Target Abuse when we set an arbitrary target and use it to decide when to reward and when to punish. We compound our second crime when we connect our arbitrary target to our accounting clock and post periodic praise when we are above target and periodic pain when we are below. We magnify the crime if we have a quality-by-inspection strategy because we create an internal quality-cost tradeoff that generates conflict between our governance goal and our finance goal: the result is a festering and acrimonious stalemate. Our quality-by-inspection strategy paradoxically prevents improvement in productivity and we learn to accept the inevitable oscillation between good and bad and eventually may even convince ourselves that this is the best and the only way.  With this life-limiting-belief deeply embedded in our collective unconsciousness, the more enthusiastically this quality-by-inspection design is enforced the more fear, frustration and failures it generates – until trust is eroded to the point that when the system hits a problem – morale collapses, errors increase, checks are overwhelmed, rework capacity is swamped, quality slumps and costs escalate. Productivity nose-dives and both customers and staff jump into the lifeboats to avoid going down with the ship!  

The use of delusional ratios and arbitrary targets (DRATs) is a dangerous and addictive behaviour and should be made a criminal offense punishable by Law because it is both destructive and unnecessary.

With painful awareness of the problem a path to a solution starts to form:

1. Share the numerator, the denominator and the ratio data as time series charts.
2. Only put requirement specifications on the numerator and denominator charts.
3. Outlaw quality-by-inspection and replace with quality-by-design-and-improvement.  

Metric Abuse is a Crime. DRATs are a dangerous addiction. DRATs kill Motivation. DRATs Kill Organisations.

Charts created using BaseLine

The Seven Flows

Improvement Science is the knowledge and experience required to improve … but to improve what?

Improve safety, delivery, quality, and productivity?

Yes – ultimately – but they are the outputs. What has to be improved to achieve these improved outputs? That is a much more interesting question.

The simple answer is “flow”. But flow of what? That is an even better question!

Let us consider a real example. Suppose we want to improve the safety, quality, delivery and productivity of our healthcare system – which we do – what “flows” do we need to consider?

The flow of patients is the obvious one – the observable, tangible flow of people with health issues who arrive and leave healthcare facilities such as GP practices, outpatient departments, wards, theatres, accident units, nursing homes, chemists, etc.

What other flows?

Healthcare is a service with an intangible product that is produced and consumed at the same time – and in for those reasons it is very different from manufacturing. The interaction between the patients and the carers is where the value is added and this implies that “flow of carers” is critical too. Carers are people – no one had yet invented a machine that cares.

As soon as we have two flows that interact we have a new consideration – how do we ensure that they are coordinated so that they are able to interact at the same place, same time, in the right way and is the right amount?

The flows are linked – they are interdependent – we have a system of flows and we cannot just focus on one flow or ignore the inter-dependencies. OK, so far so good. What other flows do we need to consider?

Healthcare is a problem-solving process and it is reliant on data – so the flow of data is essential – some of this is clinical data and related to the practice of care, and some of it is operational data and related to the process of care. Data flow supports the patient and carer flows.

What else?

Solving problems has two stages – making decisions and taking actions – in healthcare the decision is called diagnosis and the action is called treatment. Both may involve the use of materials (e.g. consumables, paper, sheets, drugs, dressings, food, etc) and equipment (e.g. beds, CT scanners, instruments, waste bins etc). The provision of materials and equipment are flows that require data and people to support and coordinate as well.

So far we have flows of patients, people, data, materials and equipment and all the flows are interconnected. This is getting complicated!

Anything else?

The work has to be done in a suitable environment so the buildings and estate need to be provided. This may not seem like a flow but it is – it just has a longer time scale and is more jerky than the other flows – planning-building-using a new hospital has a time span of decades.

Are we finished yet? Is anything needed to support the these flows?

Yes – the flow that links them all is money. Money flowing in is called revenue and investment and money flowing out is called costs and dividends and so long as revenue equals or exceeds costs over the long term the system can function. Money is like energy – work only happens when it is flowing – and if the money doesn’t flow to the right part at the right time and in the right amount then the performance of the whole system can suffer – because all the parts and flows are interdependent.

So, we have Seven Flows – Patients, People, Data, Materials, Equipment, Estate and Money – and when considering any process or system improvement we must remain mindful of all Seven because they are interdependent.

And that is a challenge for us because our caveman brains are not designed to solve seven-dimensional time-dependent problems! We are OK with one dimension, struggle with two, really struggle with three and that is about it. We have to face the reality that we cannot do this in our heads – we need assistance – we need tools to help us handle the Seven Flows simultaneously.

Fortunately these tools exist – so we just need to learn how to use them – and that is what Improvement Science is all about.

Is a Queue an Asset or a Liability?

Many believe that a queue is a good thing.

To a supplier a queue is tangible evidence that there is demand for their product or service and reassurance that their resources will not sit idle, waiting for work and consuming profit rather than creating it.  To a customer a queue is tangible evidence that the product or service is in demand and therefore must be worth having. They may have to wait but the wait will be worth it.  Both suppliers and customers unconsciously collude in the Great Deception and even give it a name – “The Law of Supply and Demand”. By doing so they unwittingly open the door for charlatans and tricksters who deliberately create and maintain queues to make themselves appear more worthy or efficient than they really are.

Even though we all know this intuitively we seem unable to do anything about it. “That is just the way it is” we say with a shrug of resignation. But it does not have to be so – there is a path out of this dead end.

Let us look at this problem from a different perspective. Is a product actually any better because we have waited to get it? No. A longer wait does not increase the quality of the product or service and may indeed impair it.  So, if  a queue does not increase quality does it reduce the cost?  The answer again is “No”. A queue always increases the cost and often in many ways.  Exactly how much the cost increases by depends on what is on the queue, where the queue is, and how long it is. This may sound counter-intitutive and didactic so I need to explain in a bit more detail the reason this statement is an inevitable consequence of the Laws of Physics.

Suppose the queue comprises perishable goods; goods that require constant maintenance; goods that command a fixed price when they leave the queue; goods that are required to be held in a container of limited capacity with fixed overhead costs (i.e. costs that are fixed irrespective of how full the container is).  Patients in a hospital or passengers on an aeroplane are typical examples because the patient/passenger is deprived of their ability to look after themselves; they are totally dependent on others for supplying all their basic needs; and they are perishable in the sense that a patient cannot wait forever for treatment and an aeroplane cannot fly around forever waiting to land. A queue of patients waiting to leave hospital or an aeroplane full of passsengers circling to land at an airport represents an expensive queue – the queue has a cost – and the bigger the queue is and the longer it persists the greater the cost.

So how does a queue form in the first place? The answer is: when the flow in exceeds the flow out. The instant that happens the queue starts to grow bigger.  When flow in is less than flow out the queue is getting smaller – but we cannot have a negative queue – so when the flow out exceeds the flow in AND the size of the queue reaches zero the system suddenly changes behaviour – the work dries up and the resources become idle.  This creates a different cost – the cost of idle resources consuming money but not producing revenue. So a queue/work costs and no queue/no work costs too.  The least cost situation is when the work arrives at exactly the same rate that it can be done: there is no waiting by anyone – no queue and no idle resources.  Note however that this does not imply that the work has to arrive at a constant rate – only that rate at which the work arrives matches the rate at which it is done – it is the difference between the two that should be zero at all times. And where we have several steps – the flow must be the same through all steps of the stream at all times.  Remember the second condition for minimum cost – the size of the queue must be zero as well – this is the zero inventory goal of the “perfect process”.

So, if any deviation from this perfect balance of flow creates some form of cost, why do we ever tolerate queues? The reason is that the perfect world above implies that it is possible to predict the flow in and the flow out with complete accuracy and reliabilty.  We all know from experience that this is impossible: there is always some degree of  natural variation which is unpredictable and which we often call “noise” or “chaos”. For that single reason the lowest cost (not zero cost) situation is when there is just enough breathing space for a queue to wax and wane – smoothing out the unpredictable variation between inflow and outflow. This healthy queue is called a buffer.

The less “noise” the less breathing space is needed and the closer you can get to zero queue cost.

So, given this logical explanation it might surprise you to learn that most of the flow variation we observe in real processes is neither natural nor unpredictable – we deliberately and persistently inject predictable flow variation into our processes.  This unnatural variation is created by own policies – for example, accumulating DIY jobs until there are enough to justify doing them.   The reason we do this is because we have been bamboozled into believing it is a good thing for the financial health of our system. We have been beguiled by the accountants – the Money Magicians.  Actually that is not precise enough – the accountants themselves  are the innocent messengers – the deception comes from the Accounting Policies.  The major niggle is one convention that has become ossified into Accounting Practice – the convention that a queue of work waiting to be finished or sold represents an asset – sort of frozen-for-now-cash that can be thawed out or “liquidated” when the product is sold.  This convention is not incorrect it is just incomplete because, as we have demonstrated, every queue incurs a cost.  In accountant-speak a cost is called a liability and unfortunately this queue-cost-liability is never included in the accounts and this makes a very, very, big difference to the outcome. To assess the financial health of an organisation at a point in time an accountant will use a balance sheet to subtract the liabilities from the assets and come up with a number that is called equity. If that number is zero or negative then the business is financially dead – the technical name is bankruptcy and no accountant likes to utter the B word.  Denial is not a reliable long term buisness strategy and if our Accounting Policies do not include the cost of the queue as a liability on the balance sheet then our finanical reports will be a distortion of reality and will present the business as healthier than it really is.  This is an Error of Omission and has grave negative consequences.  One of which is that it can create a sense of complacency, a blindness to the early warning signs of financial illness and reactive rather than proactive behaviour. The problem is compounded when a large and complex organisation is split into smaller, simpler mini-businesses that all suffer from the same financial blindspot. It becomes even more difficult to see the problem when everyone is making the same error of omission and when it is easier to blame someone else for the inevitable problems that ensue.

We all know from experience that prevention is better than cure and we also know that the future is not predictable with certainty: so in addition to prevention we need vigilence, prompt action, decisive action and appropriate action at the earliest detectable sign of a significant deterioration. Complacency is not a reliable long term survival strategy.

So what is the way forward? Dispense with the accountants? NO! You need them – they are very good at what they do – it is just that what they are doing is not exactly what we all need them to be doing – and that is because the Accounting Policies that they diligently enforce are incomplete.  A safer strategy would be for us to set our accountants the task of learning how to count the cost of a queue and to include that in our internal finanical reporting. The quality of business decisions based on financial data will improve and that is good for everyone – the business, the customers and the reputation of the Accounting Profession. Win-win-win.

The question was “Is a queue and asset or a liability?” The answer is “Both”.

Does More Efficient equal More Productive?

It is often assumed that efficiency and productivity are the same thing – and this assumption leads to the conclusion that if we use our resources more efficiently then we will automatically be more productive. This is incorrect. The definition of productivity is the ratio of what we expect to get out divided by what we put in – and the important caveat to remember is that only the output which meets expectation is counted – only output that passes the required quality specification.

This caveat has two important implications:

1. Not all activity contributes to productivity. Failures do not.
2. To measure productivity we must define a quality specification.

Efficiency is how resources are used and is often presented as metric called utilisation – the ratio of how much time a resource was used to how much time a resource was available.  So, utilisation includes time spent by resources detecting and correcting avoidable errors.

Increasing utilisation does not always imply increasing productivity: It is possible to become more efficient and less productive by making, checking, detecting and fixing more errors.

For example, if we make more mistakes we will have more output that fails to meet the expected quality, our customers complain and productivity has gone down. Our standard reaction to this situation is to put pressure on ourselves to do more checking and to correct the erros we find – which implies that our utilisation has gone up but our productivity has remained down: we are doing more work to achieve the same outcome.

However, if we remove the cause of the mistakes then more output will meet the quality specification and productivity will go up (better outcome with same resources); and we also have have less re-work to do so utilisation goes down which means productivity goes up even further (remember: productivity = success out divided by effort in). Fixing the root case of errors delivers a double-productivity-improvement.

In the UK we have become a victim of our own success – we have a population that is living longer (hurray) and that will present a greater demand for medical care in the future – however the resources that are available to provide healthcare cannot increase at the same pace (boo) – so we have a problem looming that is not going to go away just by ignoring it. Our healthcare system needs to become more productive. It needs to deliver more care with the same cash – and that implies three requirements:
1. We need to specify our expectation of required quality.
2. We need to measure productivity so that we can measure improvement over time.
3. We need to diagnose the root-causes of errors rather than just treat their effects.

Improved productivity requires improved quality and lower costs – which is good because we want both!

How Do We Measure the Cost of Waste?

There is a saying in Yorkshire “Where there’s muck there’s brass” which means that muck or waste is expensive to create and to clean up. 

Improvement science provides the theory, techniques and tools to reduce the cost of waste and to re-invest the savings in further improvement.  But how much does waste cost us? How much can we expect to release to re-invest?  The answer is deceptively simple to work out and decidedly alarming when we do.

We start with the conventional measurement of cost – the expenses – be they materials, direct labour, indirect labour, whatever. We just add up all the costs for a period of time to give the total spend – let us call that the stage cost. The next step requires some new thinking – it requires looking from the perspective of the job or customer – and following the path backwards from the intended outcome, recording what was done, how much resource-time and material it required and how much that required work actually cost.  This is what one satisfied customer is prepared to pay for; so let us call this the required stream cost. We now just multiply the output or activity for the period of time by the required stream cost and we will call that the total stream cost. We now just compare the stage cost and the stream cost – the difference is the cost of waste – the cost of all the resources consumed that did not contribute to the intended outcome. The difference is usually large; the stream cost is typically only 20%-50% of the stage cost!

This may sound unbelieveable but it is true – and the only way to prove it to go and observe the process and do the calculation – just looking at our conventional finanical reports will not give us the answer.  Once we do this simple experiment we will see the opportunity that Improvement Science offers – to reduce the cost of waste in a planned and predictable manner.

But if we are not prepared to challenge our assumptions by testing them against reality then we will deny ourselves that opportunity. The choice is ours.

One of the commonest assumptions we make is called the Flaw of Averages: the assumption that it is always valid to use averages when developing business cases. This assumption is incorrect.  But it is not immediately obvious why it is incorrect and the explanation sounds counter-intuitive. So, one way to illustrate is with a real example and here is one that has been created using a process simulation tool – virtual reality: