Dr Hyde and Mr Jekyll

Dr Bill Hyde was already at the bar when Bob Jekyll arrived.

Bill and  Bob had first met at university and had become firm friends, but their careers had diverged and it was only by pure chance that their paths had crossed again recently.

They had arranged to meet up for a beer and to catch up on what had happened in the 25 years since they had enjoyed the “good old times” in the university bar.

<Dr Bill> Hi Bob, what can I get you? If I remember correctly it was anything resembling real ale. Will this “Black Sheep” do?

<Bob> Hi Bill, Perfect! I’ll get the nibbles. Plain nuts OK for you?

<Dr Bill> My favourite! So what are you up to now? What doors did your engineering degree open?

<Bob> Lots!  I’ve done all sorts – mechanical, electrical, software, hardware, process, all except civil engineering. And I love it. What I do now is a sort of synthesis of all of them.  And you? Where did your medical degree lead?

<Dr Bill> To my hearts desire, the wonderful Mrs Hyde, and of course to primary care. I am a GP. I always wanted to be a GP since I was knee-high to a grasshopper.

<Bob> Yes, you always had that “I’m going to save the world one patient at a time!” passion. That must be so rewarding! Helping people who are scared witless by the health horror stories that the media pump out.  I had a fright last year when I found a lump.  My GP was great, she confidently diagnosed a “hernia” and I was all sorted in a matter of weeks with a bit of nifty day case surgery. I was convinced my time had come. It just shows how damaging the fear of the unknown can be!

<Dr Bill> Being a GP is amazingly rewarding. I love my job. But …

<Bob> But what? Are you alright Bill? You suddenly look really depressed.

<Dr Bill> Sorry Bob. I don’t want to be a damp squib. It is good to see you again, and chat about the old days when we were teased about our names.  And it is great to hear that you are enjoying your work so much. I admit I am feeling low, and frankly I welcome the opportunity to talk to someone I know and trust who is not part of the health care system. If you know what I mean?

<Bob> I know exactly what you mean.  Well, I can certainly offer an ear, “a problem shared is a problem halved” as they say. I can’t promise to do any more than that, but feel free to tell me the story, from the beginning. No blood-and-guts gory details though please!

<Dr Bill> Ha! “Tell me the story from the beginning” is what I say to my patients. OK, here goes. I feel increasingly overwhelmed and I feel like I am drowning under a deluge of patients who are banging on the practice door for appointments to see me. My intuition tells me that the problem is not the people, it is the process, but I can’t seem to see through the fog of frustration and chaos to a clear way forward.

<Bob> OK. I confess I know nothing about how your system works, so can you give me a bit more context.

<Dr Bill> Sorry. Yes, of course. I am what is called a single-handed GP and I have a list of about 1500 registered patients and I am contracted to provide primary care for them. I don’t have to do that 24 x 7, the urgent stuff that happens in the evenings and weekends is diverted to services that are designed for that. I work Monday to Friday from 9 AM to 5 PM, and I am contracted to provide what is needed for my patients, and that means face-to-face appointments.

<Bob> OK. When you say “contracted” what does that mean exactly?

<Dr Bill> Basically, the St. Elsewhere’s® Practice is like a small business. It’s annual income is a fixed amount per year for each patient on the registration list, and I have to provide the primary care service for them from that pot of cash. And that includes all the costs, including my income, our practice nurse, and the amazing Mrs H. She is the practice receptionist, manager, administrator and all-round fixer-of-anything.

<Bob> Wow! What a great design. No need to spend money on marketing, research, new product development, or advertising! Just 100% pure service delivery of tried-and-tested medical know-how to a captive audience for a guaranteed income. I have commercial customers who would cut off their right arms for an offer like that!

<Dr Bill> Really? It doesn’t feel like that to me. It feels like the more I offer, the more the patients expect. The demand is a bottomless well of wants, but the income is capped and my time is finite!

<Bob> H’mm. Tell me more about the details of how the process works.

<Dr Bill> Basically, I am a problem-solving engine. Patients phone for an appointment, Mrs H books one, the patient comes at the appointed time, I see them, and I diagnose and treat the problem, or I refer on to a specialist if it’s more complicated. That’s basically it.

<Bob> OK. Sounds a lot simpler than 99% of the processes that I’m usually involved with. So what’s the problem?

<Dr Bill> I don’t have enough capacity! After all the appointments for the day are booked Mrs H has to say “Sorry, please try again tomorrow” to every patient who phones in after that.  The patients who can’t get an appointment are not very happy and some can get quite angry. They are anxious and frustrated and I fully understand how they feel. I feel the same.

<Bob> We will come back to what you mean by “capacity”. Can you outline for me exactly how a patient is expected to get an appointment?

<Dr Bill> We tell them to phone at 8 AM for an appointment, there is a fixed number of bookable appointments, and it is first-come-first-served.  That is the only way I can protect myself from being swamped and is the fairest solution for patients.  It wasn’t my idea; it is called Advanced Access. Each morning at 8 AM we switch on the phones and brace ourselves for the daily deluge.

<Bob> You must be pulling my leg! This design is a batch-and-queue phone-in appointment booking lottery!  I guess that is one definition of “fair”.  How many patients get an appointment on the first attempt?

<Dr Bill> Not many.  The appointments are usually all gone by 9 AM and a lot are to people who have been trying to get one for several days. When they do eventually get to see me they are usually grumpy and then spring the trump card “And while I’m here doctor I have a few other things that I’ve been saving up to ask you about“. I help if I can but more often than not I have to say, “I’m sorry, you’ll have to book another appointment!“.

<Bob> I’m not surprised you patients are grumpy. I would be too. And my recollection of seeing my GP with my scary lump wasn’t like that at all. I phoned at lunch time and got an appointment the same day. Maybe I was just lucky, or maybe my GP was as worried as me. But it all felt very calm. When I arrived there was only one other patient waiting, and I was in and out in less than ten minutes – and mightily reassured I can tell you! It felt like a high quality service that I could trust if-and-when I needed it, which fortunately is very infrequently.

<Dr Bill> I dream of being able to offer a service like that! I am prepared to bet you are registered with a group practice and you see whoever is available rather than your own GP. Single-handed GPs like me who offer the old fashioned personal service are a rarity, and I can see why. We must be suckers!

<Bob> OK, so I’m starting to get a sense of this now. Has it been like this for a long time?

<Dr Bill> Yes, it has. When I was younger I was more resilient and I did not mind going the extra mile.  But the pressure is relentless and maybe I’m just getting older and grumpier.  My real fear is I end up sounding like the burned-out cynics that I’ve heard at the local GP meetings; the ones who crow about how they are counting down the days to when they can retire and gloat.

<Bob> You’re the same age as me Bill so I don’t think either of us can use retirement as an exit route, and anyway, that’s not your style. You were never a quitter at university. Your motto was always “when the going gets tough the tough get going“.

<Dr Bill> Yeah I know. That’s why it feels so frustrating. I think I lost my mojo a long time back. Maybe I should just cave in and join up with the big group practice down the road, and accept the inevitable loss of the personal service. They said they would welcome me, and my list of 1500 patients, with open arms.

<Bob> OK. That would appear to be an option, or maybe a compromise, but I’m not sure we’ve exhausted all the other options yet.  Tell me, how do you decide how long a patient needs for you to solve their problem?

<Dr Bill> That’s easy. It is ten minutes. That is the time recommended in the Royal College Guidelines.

<Bob> Eh? All patients require exactly ten minutes?

<Dr Bill> No, of course not!  That is the average time that patients need.  The Royal College did a big survey and that was what most GPs said they needed.

<Bob> Please tell me if I have got this right.  You work 9-to-5, and you carve up your day into 10-minute time-slots called “appointments” and, assuming you are allowed time to have lunch and a pee, that would be six per hour for seven hours which is 42 appointments per day that can be booked?

<Dr Bill> No. That wouldn’t work because I have other stuff to do as well as see patients. There are only 25 bookable 10-minute appointments per day.

<Bob> OK, that makes more sense. So where does 25 come from?

<Dr Bill> Ah! That comes from a big national audit. For an average GP with and average  list of 1,500 patients, the average number of patients seeking an appointment per day was found to be 25, and our practice population is typical of the national average in terms of age and deprivation.  So I set the upper limit at 25. The workload is manageable but it seems to generate a lot of unhappy patients and I dare not increase the slots because I’d be overwhelmed with the extra workload and I’m barely coping now.  I feel stuck between a rock and a hard place!

<Bob> So you have set the maximum slot-capacity to the average demand?

<Dr Bill> Yes. That’s OK isn’t it? It will average out over time. That is what average means! But it doesn’t feel like that. The chaos and pressure never seems to go away.


There was a long pause while Bob mulls over what he had heard, sips his pint of Black Sheep and nibbles on the dwindling bowl of peanuts.  Eventually he speaks.


<Bob> Bill, I have some good news and some not-so-good news and then some more good news.

<Dr Bill> Oh dear, you sound just like me when I have to share the results of tests with one of my patients at their follow up appointment. You had better give me the “bad news sandwich”!

<Bob> OK. The first bit of good news is that this is a very common, and easily treatable flow problem.  The not-so-good news is that you will need to change some things.  The second bit of good news is that the changes will not cost anything and will work very quickly.

<Dr Bill> What! You cannot be serious!! Until ten minutes ago you said that you knew nothing about how my practice works and now you are telling me that there is a quick, easy, zero cost solution.  Forgive me for doubting your engineering know-how but I’ll need a bit more convincing than that!

<Bob> And I would too if I were in your position.  The clues to the diagnosis are in the story. You said the process problem was long-standing; you said that you set the maximum slot-capacity to the average demand; and you said that you have a fixed appointment time that was decided by a subjective consensus.  From an engineering perspective, this is a perfect recipe for generating chronic chaos, which is exactly the symptoms you are describing.

<Dr Bill> Is it? OMG. You said this is well understood and resolvable? So what do I do?

<Bob> Give me a minute.  You said the average demand is 25 per day. What sort of service would you like your patients to experience? Would “90% can expect a same day appointment on the first call” be good enough as a starter?

<Dr Bill> That would be game changing!  Mrs H would be over the moon to be able to say “Yes” that often. I would feel much less anxious too, because I know the current system is a potentially dangerous lottery. And my patients would be delighted and relieved to be able to see me that easily and quickly.

<Bob> OK. Let me work this out. Based on what you’ve said, some assumptions, and a bit of flow engineering know-how; you would need to offer up to 31 appointments per day.

<Dr Bill> What! That’s impossible!!! I told you it would be impossible! That would be another hour a day of face-to-face appointments. When would I do the other stuff? And how did you work that out anyway?

<Bob> I did not say they would have to all be 10-minute appointments, and I did not say you would expect to fill them all every day. I did however say you would have to change some things.  And I did say this is a well understood flow engineering problem.  It is called “resilience design“. That’s how I was able to work it out on the back of this Black Sheep beer mat.

<Dr Bill> H’mm. That is starting to sound a bit more reasonable. What things would I have to change? Specifically?

<Bob> I’m not sure what specifically yet.  I think in your language we would say “I have taken a history, and I have a differential diagnosis, so next I’ll need to examine the patient, and then maybe do some tests to establish the actual diagnosis and to design and decide the treatment plan“.

<Dr Bill> You are learning the medical lingo fast! What do I need to do first? Brace myself for the forensic rubber-gloved digital examination?

<Bob> Alas, not yet and certainly not here. Shall we start with the vital signs? Height, weight, pulse, blood pressure, and temperature? That’s what my GP did when I went with my scary lump.  The patient here is not you, it is your St. Elsewhere’s® Practice, and we will need to translate the medical-speak into engineering-speak.  So one thing you’ll need to learn is a bit of the lingua-franca of systems engineering.  By the way, that’s what I do now. I am a systems engineer, or maybe now a health care systems engineer?

<Dr Bill> Point me in the direction of the HCSE dictionary! The next round is on me. And the nuts!

<Bob> Excellent. I’ll have another Black Sheep and some of those chilli-coated ones. We have work to do.  Let me start by explaining what “capacity” actually means to an engineer. Buckle up. This ride might get a bit bumpy.


This story is fictional, but the subject matter is factual.

Bob’s diagnosis and recommendations are realistic and reasonable.

Chapter 1 of the HCSE dictionary can be found here.

And if you are a GP who recognises these “symptoms” then this may be of interest.

Whip or WIP?

smack_head_in_disappointment_150_wht_16653The NHS appears to be suffering from some form of obsessive-compulsive disorder.

OCD sufferers feel extreme anxiety in certain situations. Their feelings drive their behaviour which is to reduce the perceived cause of their feelings. It is a self-sustaining system because their perception is distorted and their actions are largely ineffective. So their anxiety is chronic.

Perfectionists demonstrate a degree of obsessive-compulsive behaviour too.


In the NHS the triggers are called ‘targets’ and usually take the form of failure metrics linked to arbitrary performance specifications.

The anxiety is the fear of failure and its unpleasant consequences: the name-shame-blame-game.


So a veritable industry has grown around ways to mitigate the fear. A very expensive and only partially effective industry.

Data is collected, cleaned, manipulated and uploaded to the Mothership (aka NHS England). There it is further manipulated, massaged and aggregated. Then the accumulated numbers are posted on-line, every month for anyone with a web-browser to scrutinise and anyone with an Excel spreadsheet to analyse.

An ocean of measurements is boiled and distilled into a few drops of highly concentrated and sanitized data and, in the process, most of the useful information is filtered out, deleted or distorted.


For example …

One of the failure metrics that sends a shiver of angst through a Chief Operating Officer (COO) is the failure to deliver the first definitive treatment for any patient within 18 weeks of referral from a generalist to a specialist.

The infamous and feared 18-week target.

Service providers, such as hospitals, are actually fined by their Clinical Commissioning Groups (CCGs) for failing to deliver-on-time. Yes, you heard that right … one NHS organisation financially penalises another NHS organisation for failing to deliver a result over which they have only partial control.

Service providers do not control how many patients are referred, or a myriad of other reasons that delay referred patients from attending appointments, tests and treatments. But the service providers are still accountable for the outcome of the whole process.

This ‘Perform-or-Pay-The-Price Policy‘ creates the perfect recipe for a lot of unhappiness for everyone … which is exactly what we hear and what we see.


So what distilled wisdom does the Mothership share? Here is a snapshot …

RTT_Data_Snapshot

Q1: How useful is this table of numbers in helping us to diagnose the root causes of long waits, and how does it help us to decide what to change in our design to deliver a shorter waiting time and more productive system?

A1: It is almost completely useless (in this format).


So what actually happens is that the focus of management attention is drawn to the part just before the speed camera takes the snapshot … the bit between 14 and 18 weeks.

Inside that narrow time-window we see a veritable frenzy of target-failure-avoiding behaviour.

Clinical priority is side-lined and management priority takes over.  This is a management emergency! After all, fines-for-failure are only going to make the already bad financial situation even worse!

The outcome of this fire-fighting is that the bigger picture is ignored. The focus is on the ‘whip’ … and avoiding it … because it hurts!


Message from the Mothership:    “Until morale improves the beatings will continue”.


The good news is that the undigestible data liquor does harbour some very useful insights.  All we need to do is to present it in a more palatable format … as pictures of system behaviour over time.

We need to use the data to calculate the work-in-progress (=WIP).

And then we need to plot the WIP in time-order so we can see how the whole system is behaving over time … how it is changing and evolving. It is a dynamic living thing, it has vitality.

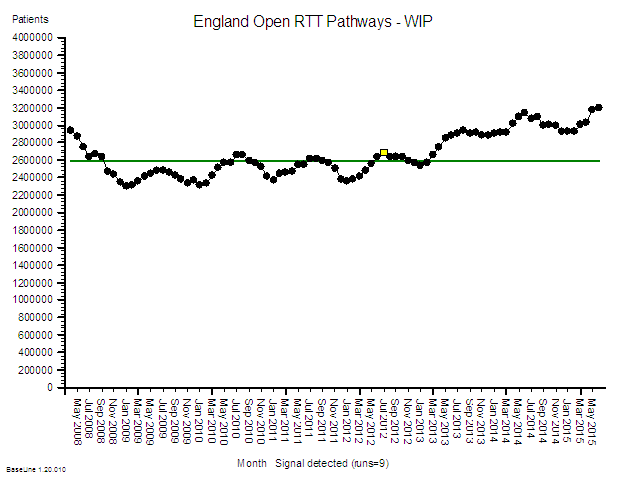
So here is the WIP chart using the distilled wisdom from the Mothership.

RTT_WIP_RunChart

And this picture does not require a highly trained data analyst or statistician to interpret it for us … a Mark I eyeball linked to 1.3 kg of wetware running ChimpOS 1.0 is enough … and if you are reading this then you must already have that hardware and software.

Two patterns are obvious:

1) A cyclical pattern that appears to have an annual frequency, a seasonal pattern. The WIP is higher in the summer than in the winter. Eh? What is causing that?

2) After an initial rapid fall in 2008 the average level was steady for 4 years … and then after March 2012 it started to rise. Eh? What is causing is that?

The purpose of a WIP chart is to stimulate questions such as:

Q1: What happened in March 2012 that might have triggered this change in system behaviour?

Q2: What other effects could this trigger have caused and is there evidence for them?


A1: In March 2012 the Health and Social Care Act 2012 became Law. In the summer of 2012 the shiny new and untested Clinical Commissioning Groups (CCGs) were authorised to take over the reins from the exiting Primary care Trusts (PCTs) and Strategic Health Authorities (SHAs). The vast £80bn annual pot of tax-payer cash was now in the hands of well-intended GPs who believed that they could do a better commissioning job than non-clinicians. The accountability for outcomes had been deftly delegated to the doctors.  And many of the new CCG managers were the same ones who had collected their redundancy checks when the old system was shut down. Now that sounds like a plausible system-wide change! A massive political experiment was underway and the NHS was the guinea-pig.

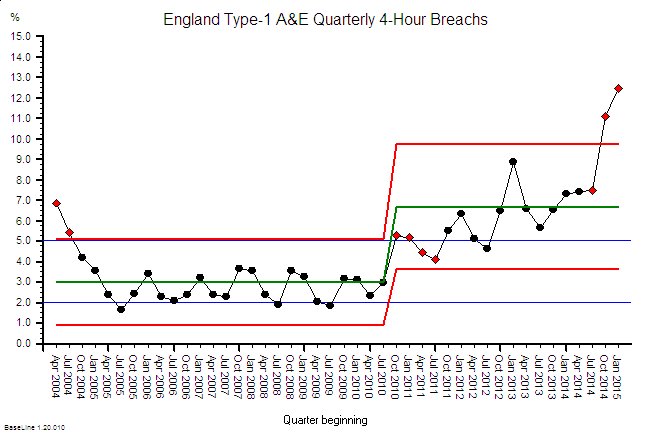
A2: Another NHS failure metric is the A&E 4-hour wait target which, worringly, also shows a deterioration that appears to have started just after July 2010, i.e. just after the new Government was elected into power.  Maybe that had something to do with it? Maybe it would have happened whichever party won at the polls.

A&E_Breaches_2004-15

A plausible temporal association does not constitute proof – and we cannot conclude a political move to a CCG-led NHS has caused the observed behaviour. Retrospective analysis alone is not able to establish the cause.

It could just as easily be that something else caused these behaviours. And it is important to remember that there are usually many causal factors combining together to create the observed effect.

And unraveling that Gordian Knot is the work of analysts, statisticians, economists, historians, academics, politicians and anyone else with an opinion.


We have a more pressing problem. We have a deteriorating NHS that needs urgent resuscitation!


So what can we do?

One thing we can do immediately is to make better use of our data by presenting it in ways that are easier to interpret … such as a work in progress chart.

Doing that will trigger different conversions; ones spiced with more curiosity and laced with less cynicism.

We can add more context to our data to give it life and meaning. We can season it with patient and staff stories to give it emotional impact.

And we can deepen our understanding of what causes lead to what effects.

And with that deeper understanding we can begin to make wiser decisions that will lead to more effective actions and better outcomes.

This is all possible. It is called Improvement Science.


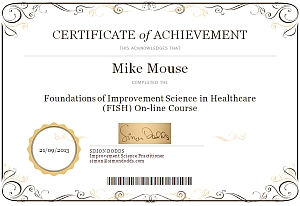
And as we speak there is an experiment running … a free offer to doctors-in-training to learn the foundations of improvement science in healthcare (FISH).

In just two weeks 186 have taken up that offer and 13 have completed the course!

And this vanguard of curious and courageous innovators have discovered a whole new world of opportunity that they were completely unaware of before. But not anymore!

So let us ease off applying the whip and ease in the application of WIP.


PostScript

Here is a short video describing how to create, animate and interpret a form of diagnostic Vitals Chart® using the raw data published by NHS England.  This is a training exercise from the Improvement Science Practitioner (level 2) course.

How to create an 18 weeks animated Bucket Brigade Chart (BBC)

Storytelling

figure_turning_a_custom_page_15415

Telling a compelling story of improvement is an essential skill for a facilitator and leader of change.

A compelling story has two essential components: cultural and technical. Otherwise known as emotional and factual.

Many of the stories that we hear are one or the other; and consequently are much less effective.


Some prefer emotive language and use stories of dismay and distress to generate an angry reaction: “That is awful we must DO something about that!”

And while emotion is the necessary fuel for action,  an angry mob usually attacks the assumed cause rather than the actual cause and can become ‘mindless’ and destructive.

Those who have observed the dangers of the angry mob opt for a more reflective, evidence-based, scientific, rational, analytical, careful, risk-avoidance approach.

And while facts are the necessary informers of decision, the analytical mind often gets stuck in the ‘paralysis of analysis’ swamp as layer upon layer of increasing complexity is exposed … more questions than answers.


So in a compelling story we need a bit of both.

We need a story that fires our emotions … and … we need a story that engages our intellect.

A bit of something for everyone.

And the key to developing this compelling-story-telling skill this is to start with something small enough to be doable in a reasonable period of time.  A short story rather than a lengthy legend.

A story, tale or fable.

Aesop’s Fables and Chaucer’s Canterbury Tales are still remembered for their timeless stories.


And here is a taste of such a story … one that has been published recently for all to read and to enjoy.

A Story of Learning Improvement Science

It is an effective blend of cultural and technical, emotional and factual … and to read the full story just follow the ‘Continue’ link.

The Improvement Pyramid

IS_PyramidDeveloping productive improvement capability in an organisation is like building a pyramid in the desert.

It is not easy and it takes time before there is any visible evidence of success.

The height of the pyramid is a measure of the level of improvement complexity that we can take on.

An improvement of a single step in a system would only require a small pyramid.

Improving the whole system will require a much taller one.


But if we rush and attempt to build a sky-scraper on top of the sand then we will not be surprised when it topples over before we have made very much progress.  The Egyptians knew this!

First, we need to dig down and to lay some foundations.  Stable enough and strong enough to support the whole structure.  We will never see the foundations so it is easy to forget them in our rush but they need to be there and they need to be there first.

It is the same when developing improvement science capability  … the foundations are laid first and when enough of that foundation knowledge is in place we can start to build the next layer of the pyramid: the practitioner layer.


It is the the Improvement Science Practitioners (ISPs) who start to generate tangible evidence of progress.  The first success stories help to spur us all on to continue to invest effort, time and money in widening our foundations to be able to build even higher – more layers of capability -until we can realistically take on a system wide improvement challenge.

So sharing the first hard evidence of improvement is an important milestone … it is proof of fitness for purpose … and that news should be shared with those toiling in the hot desert sun and with those watching from the safety of the shade.

So here is a real story of a real improvement pyramid achieving this magical and motivating milestone.


Over-Egged Expectation

FISH_ISP_eggs_jumpingResistance-to-change is an oft quoted excuse for improvement torpor. The implied sub-message is more like “We would love to change but They are resisting“.

Notice the Us-and-Them language.  This is the observable evidence of an “We‘re OK and They’re Not OK” belief.  And in reality it is this unstated belief and the resulting self-justifying behaviour that is an effective barrier to systemic improvement.

This Us-and-Them language generates cultural friction, erodes trust and erects silos that are effective barriers to the flow of information, of innovation and of learning.  And the inevitable reactive solutions to this Us-versus-Them friction create self-amplifying positive feedback loops that ensure the counter-productive behaviour is sustained.

One tangible manifestation are DRATs: Delusional Ratios and Arbitrary Targets.


So when a plausible, rational and well-evidenced candidate for an alternative approach is discovered then it is a reasonable reaction to grab it and to desperately spray the ‘magic pixie dust’ at everything.

This a recipe for disappointment: because there is no such thing as ‘improvement magic pixie dust’.

The more uncomfortable reality is that the ‘magic’ is the result of a long period of investment in learning and the associated hard work in practising and polishing the techniques and tools.

It may look like magic but is isn’t. That is an illusion.

And some self-styled ‘magicians’ choose to keep their hard-won skills secret … because by sharing them know that they will lose their ‘magic powers’ in a flash of ‘blindingly obvious in hindsight’.

And so the chronic cycle of despair-hope-anger-and-disappointment continues.


System-wide improvement in safety, flow, quality and productivity requires that the benefits of synergism overcome the benefits of antagonism.  This requires two changes to the current hope-and-despair paradigm.  Both are necessary and neither are sufficient alone.

1) The ‘wizards’ (i.e. magic folk) share their secrets.
2) The ‘muggles’ (i.e. non-magic folk) invest the time and effort in learning ‘how-to-do-it’.


The transition to this awareness is uncomfortable so it needs to be managed pro-actively … by being open about the risk … and how to mitigate it.

That is what experienced Practitioners of Improvement Science (and ISP) will do. Be open about the challenged ahead.

And those who desperately want the significant and sustained SFQP improvements; and an end to the chronic chaos; and an end to the gaming; and an end to the hope-and-despair cycle …. just need to choose. Choose to invest and learn the ‘how to’ and be part of the future … or choose to be part of the past.


Improvement science is simple … but it is not intuitively obvious … and so it is not easy to learn.

If it were we would be all doing it.

And it is the behaviour of a wise leader of change to set realistic and mature expectations of the challenges that come with a transition to system-wide improvement.

That is demonstrating the OK-OK behaviour needed for synergy to grow.

Learning Loops

campfire_burning_150_wht_174[Beep Beep] Bob’s phone reminded him that it was time for the remote coaching session with Leslie, one of the CHIPs (community of healthcare improvement science practitioners). He flipped open his laptop and logged in. Leslie was already there.

<Leslie> Hi Bob.  I hope you had a good Xmas.

<Bob> Thank you Leslie. Yes, I did. I was about to ask the same question.

<Leslie> Not so good here I am afraid to say. The whole urgent care system is in meltdown. The hospital is gridlocked, the 4-hour target performance has crashed like the Stock Market on Black Wednesday, emergency admissions have spilled over into the Day Surgery Unit, hundreds of operations have been cancelled, waiting lists are spiralling upwards and the fragile 18-week performance ceiling has been smashed. It is chaos. Dangerous chaos.

<Bob> Oh dear. It sounds as if the butterfly has flapped its wings. Do you remember seeing this pattern of behaviour before?

<Leslie> Sadly yes. When I saw you demonstrate the Save the NHS Game.  This is exactly the chaos I created when I attempted to solve the 4-hour target problem, and the chaos I have seen every doctor, manager and executive create when they do too. We seem to be the root cause!

<Bob> Please do not be too hard on yourself Leslie. I am no different. I had to realise that I was contributing to the chaos I was complaining about, by complaining about it. Paradoxically not complaining about it made no difference. My error was one of omission. I was not learning. I was stuck in a self-justifying delusional blame-bubble of my own making. My humility and curiosity disabled by my disappointment, frustration and anxiety. My inner chimp was running the show!

<Leslie> Wow! That is just how everyone is feeling and behaving. Including me. So how did you escape from the blame-bubble?

<Bob> Well first of all I haven’t completely escaped. I just spend less time there. It is always possible to get sucked back in. The way out started to appear when I installed a “learning loop”.

<Leslie> A what? Is that  like a hearing loop for the partially deaf?

<Bob> Ha! Yes! A very apt metaphor.  Yes, just like that. Very good. I will borrow that if I may.

<Leslie> So what did your learning loop consist of?

<Bob> A journal.  I started a journal. I invested a few minutes each day reflecting and writing it down. The first entries were short and rather “ranty”. I cannot possibly share them in public. It is too embarrassing. But it was therapeutic and over time the anger subsided and a quieter, calmer inner voice could be heard. The voice of curiosity. It was asking one question over and over again. “How?” … not “Why?”.

<Leslie> Like “How did I get myself into this state?

<Bob> Exactly so.  And also “How come I cannot get myself out of this mess?

<Leslie> And what happened next?

<Bob> I started to take more notice of things that I had discounted before. Apparently insignificant things that I discovered had profound implications. Like the “butterflies wing” effect … I discovered that small changes can have big effects.  I also learned to tune in to specific feelings because they were my warning signals.

<Leslie> Niggles you mean?

<Bob> Yes. Niggles are flashes of negative emotion that signal a design flaw. They are usually followed by an untested assumption, an invalid conclusion, an unwise decision and a counter-productive action. It all happens unconsciously and very fast so we are only aware of the final action – the MR ANGRY reply to the email that we stupidly broadcast via the Reply All button!

<Leslie> So you learned to tune into the niggle to avoid the chain reaction that led to hitting the Red Button.

<Bob> Sort of. What actually happened is that the passion unleashed by the niggle got redirected into a more constructive channel – via my Curiosity Centre to power up the Improvement Engine. It was a bit rusty! It had not been used for a long while.

<Leslie> And once the “engine” was running it sucked in niggles that were now a source of fuel! You started harvesting them using the 4N Chart! So what was the output?

<Bob> Purposeful, focused, constructive, rational actions. Not random, destructive, emotional explosions.

<Leslie> Constructive actions such as?

<Bob> Well designing and building the FISH course is one, and this ISP programme is another.

<Leslie> More learning loops!

<Bob> Yup.

<Leslie> OK. So I can see that a private journal can help an individual to build their own learning loop. How does that work with groups? We do not all need to design and build a FISH-equivalent surely!

<Bob> No indeed. What we do is we share stories. We gather together in small groups around camp fires and we share what we are learning … as we are learning it. We contribute our perspective to the collective awareness … and we all gain from everyone’s learning. We learn and teach together.

<Leslie> So the stories are about what we are learning, not what we achieved with that learning.

<Bob> Well put! The “how” we achieved it is more valuable knowledge than “what” we achieved. The “how” is the process, the “what” is just the product. And the “how” we failed to achieve is even more valuable.

<Leslie> Wow! So are you saying that the chaos we are experiencing is the expected effect of not installing enough learning loops! A system-wide error of omission.

<Bob> I would say that is a reasonable diagnosis.

<Leslie> So a rational and reasonable course of treatment becomes clear.  I am on the case!

A Little Law and Order

teamwork_puzzle_build_PA_150_wht_2341[Bing bong]. The sound heralded Lesley logging on to the weekly Webex coaching session with Bob, an experienced Improvement Science Practitioner.

<Bob> Good afternoon Lesley.  How has your week been and what topic shall we explore today?

<Lesley> Hi Bob. Well in a nutshell, the bit of the system that I have control over feels like a fragile oasis of calm in a perpetual desert of chaos.  It is hard work keeping the oasis clear of the toxic sand that blows in!

<Bob> A compelling metaphor. I can just picture it.  Maintaining order amidst chaos requires energy. So what would you like to talk about?

<Lesley> Well, I have a small shoal of FISHees who I am guiding  through the foundation shallows and they are getting stuck on Little’s Law.  I confess I am not very good at explaining it and that suggests to me that I do not really understand it well enough either.

<Bob> OK. So shall we link those two theme – chaos and Little’s Law?

<Lesley> That sounds like an excellent plan!

<Bob> OK. So let us refresh the foundation knowledge. What is Little’s Law?

<Lesley>It is a fundamental Law of process physics that relates flow, with lead time and work in progress.

<Bob> Good. And specifically?

<Lesley> Average lead time is equal to the average flow multiplied by the average work in progress.

<Bob>Yes. And what are the units of flow in your equation?

<Lesley> Ah yes! That is  a trap for the unwary. We need to be clear how we express flow. The usual way is to state it as number of tasks in a defined period of time, such as patients admitted per day.  In Little’s Law the convention is to use the inverse of that which is the average interval between consecutive flow events. This is an unfamiliar way to present flow to most people.

<Bob> Good. And what is the reason that we use the ‘interval between events’ form?

<Leslie> Because it is easier to compare it with two critically important  flow metrics … the takt time and the cycle time.

<Bob> And what is the takt time?

<Leslie> It is the average interval between new tasks arriving … the average demand interval.

<Bob> And the cycle time?

<Leslie> It is the shortest average interval between tasks departing …. and is determined by the design of the flow constraint step.

<Bob> Excellent. And what is the essence of a stable flow design?

<Lesley> That the cycle time is less than the takt time.

<Bob>Why less than? Why not equal to?

<Leslie> Because all realistic systems need some flow resilience to exhibit stable and predictable-within-limits behaviour.

<Bob> Excellent. Now describe the design requirements for creating chronically chaotic system behaviour?

<Leslie> This is a bit trickier to explain. The essence is that for chronically chaotic behaviour to happen then there must be two feedback loops – a destabilising loop and a stabilising loop.  The destabilising loop creates the chaos, the stabilising loop ensures it is chronic.

<Bob> Good … so can you give me an example of a destabilising feedback loop?

<Leslie> A common one that I see is when there is a long delay between detecting a safety risk and the diagnosis, decision and corrective action.  The risks are often transitory so if the corrective action arrives long after the root cause has gone away then it can actually destabilise the process and paradoxically increase the risk of harm.

<Bob> Can you give me an example?

<Leslie>Yes. Suppose a safety risk is exposed by a near miss.  A delay in communicating the niggle and a root cause analysis means that the specific combination of factors that led to the near miss has gone. The holes in the Swiss cheese are not static … they move about in the chaos.  So the action that follows the accumulation of many undiagnosed near misses is usually the non-specific mantra of adding yet another safety-check to the already burgeoning check-list. The longer check-list takes more time to do, and is often repeated many times, so the whole flow slows down, queues grow bigger, waiting times get longer and as pressure comes from the delivery targets corners start being cut, and new near misses start to occur; on top of the other ones. So more checks are added and so on.

<Bob> An excellent example! And what is the outcome?

<Leslie> Chronic chaos which is more dangerous, more disordered and more expensive. Lose lose lose.

<Bob> And how do the people feel who work in the system?

<Leslie> Chronically naffed off! Angry. Demotivated. Cynical.

<Bob>And those feelings are the key symptoms.  Niggles are not only symptoms of poor process design, they are also symptoms of a much deeper problem: a violation of values.

<Leslie> I get the first bit about poor design; but what is that second bit about values?

<Bob>  We all have a set of values that we learned when we were very young and that have bee shaped by life experience.  They are our source of emotional energy, and our guiding lights in an uncertain world. Our internal unconscious check-list.  So when one of our values is violated we know because we feel angry. How that anger is directed varies from person to person … some internalise it and some externalise it.

<Leslie> OK. That explains the commonest emotion that people report when they feel a niggle … frustration which is the same as anger.

<Bob>Yes.  And we reveal our values by uncovering the specific root causes of our niggles.  For example if I value ‘Hard Work’ then I will be niggled by laziness. If you value ‘Experimentation’ then you may be niggled by ‘Rigid Rules’.  If someone else values ‘Safety’ then they may value ‘Rigid Rules’ and be niggled by ‘Innovation’ which they interpret as risky.

<Leslie> Ahhhh! Yes, I see.  This explains why there is so much impassioned discussion when we do a 4N Chart! But if this behaviour is so innate then it must be impossible to resolve!

<Bob> Understanding  how our values motivate us actually helps a lot because we are naturally attracted to others who share the same values – because we have learned that it reduces conflict and stress and improves our chance of survival. We are tribal and tribes share the same values.

<Leslie> Is that why different  departments appear to have different cultures and behaviours and why they fight each other?

<Bob> It is one factor in the Silo Wars that are a characteristic of some large organisations.  But Silo Wars are not inevitable.

<Leslie> So how are they avoided?

<Bob> By everyone knowing what common purpose of the organisation is and by being clear about what values are aligned with that purpose.

<Leslie> So in the healthcare context one purpose is avoidance of harm … primum non nocere … so ‘safety’ is a core value.  Which implies anything that is felt to be unsafe generates niggles and well-intended but potentially self-destructive negative behaviour.

<Bob> Indeed so, as you described very well.

<Leslie> So how does all this link to Little’s Law?

<Bob>Let us go back to the foundation knowledge. What are the four interdependent dimensions of system improvement?

<Leslie> Safety, Flow, Quality and Productivity.

<Bob> And one measure of  productivity is profit.  So organisations that have only short term profit as their primary goal are at risk of making poor long term safety, flow and quality decisions.

<Leslie> And flow is the key dimension – because profit is just  the difference between two cash flows: income and expenses.

<Bob> Exactly. One way or another it all comes down to flow … and Little’s Law is a fundamental Law of flow physics. So if you want all the other outcomes … without the emotionally painful disorder and chaos … then you cannot avoid learning to use Little’s Law.

<Leslie> Wow!  That is a profound insight.  I will need to lie down in a darkened room and meditate on that!

<Bob> An oasis of calm is the perfect place to pause, rest and reflect.

Wacky Language

wacky_languageAll innovative ideas are inevitably associated with new language.

Familiar words used in an unfamiliar context so that the language sounds ‘wacky’ to those in the current paradigm.

Improvement science is no different.

A problem arises when familiar words are used in a new context and therefore with a different meaning. Confusion.

So we try to avoid this cognitive confusion by inventing new words, or by using foreign words that are ‘correct’ but unfamiliar.

This use of novel and foreign language exposes us to another danger: the evolution of a clique of self-appointed experts who speak the new and ‘wacky’ language.

This self-appointed expert clique can actually hinder change because it can result yet another us-and-them division.  Another tribe. More discussion. More confusion. Less improvement.


So it is important for an effective facilitator-of-improvement to define any new language using the language of the current paradigm.  This can be achieved by sharing examples of new concepts and their language in familiar contexts and with familiar words, because we learn what words mean from their use-in-context.

For example:

The word ‘capacity’ is familiar and we all know what we think it means.  So when we link it to another familiar word, ‘demand’, then we feel comfortable that we understand what the phrase ‘demand-and-capacity’ means.

But do we?

The act of recognising a word is a use of memory or knowledge. Understanding what a word means requires more … it requires knowing the context in which the word is used.  It means understanding the concept that the word is a label for.

To a practitioner of flow science the word ‘capacity’ is confusing – because it is too fuzzy.  There are many different forms of capacity: flow-capacity, space-capacity, time-capacity, and so on.  Each has a different unit and they are not interchangeable. So the unqualified term ‘capacity’ will trigger the question:

What sort of capacity are you referring to?

[And if that is not the reaction then you may be talking to someone who has little understanding of flow science].


Then there are the foreign words that are used as new labels for old concepts.

Lean zealots seem particularly fond of peppering their monologues with Japanese words that are meaningless to anyone else but other Lean zealots.  Words like muda and muri and mura which are labels for important and useful flow science concepts … but the foreign name gives no clue as to what that essential concept is!

[And for a bit of harmless sport ask a Lean zealot to explain what these three words actually mean but only using  language that you understand. If they cannot to your satisfaction then you have exposed the niggle. And if they can then it is worth asking ‘What is the added value of the foreign language?’]

And for those who are curious to know the essential concepts that these four-letter M words refer to:

muda means ‘waste’ and refers to the effects of poor process design in terms of the extra time (and cost) required for the process to achieve its intended purpose.  A linked concept is a ‘niggle’ which is the negative emotional effect of a poor process design.

muri means ‘overburdening’ and can be illustrated  with an example.  Suppose you work in a system where there is always a big backlog of work waiting to be done … a large queue of patients in the waiting room … a big heap of notes on the trolley. That ‘burden’ generates stress and leads to other risky behaviours such as rushing, corner-cutting, deflection and overspill. It is also an outcome of poor process design, so  is avoidable.

mura means variation or uncertainty. Again an example helps. Suppose we are running an emergency service then, by definition, a we have no idea what medical problem the next patient that comes through the door will present us with. It could be trivial or life-threatening. That is unplanned and expected variation and is part of the what we need our service to be designed to handle.  Suppose when we arrive for our shift that we have no idea how many staff will be available to do the work because people phone in sick at the last minute and there is no resilience on the staffing capacity.  Our day could be calm-and-capable (and rewarding) or chaotic-and-incapable (and unrewarding).  It is the stress of not knowing that creates the emotional and cultural damage, and is the expected outcome of incompetent process design. And is avoidable.


And finally we come to words that are not foreign but are not very familiar either.

Words like praxis.

This sounds like ‘practice’ but is not spelt the same. So is the the same?

And it sounds like a medical condition called dyspraxia which means:  poor coordination of movement.

And when we look up praxis in an English dictionary we discover that one definition is:

the practice and practical side of a profession or field of study, as opposed to theory.

Ah ah! So praxis is a label for the the concept of ‘how to’ … and someone who has this ‘know how’ is called a practitioner.  That makes sense.

On deeper reflection we might then describe our poor collective process design capability as dyspraxic or uncoordinated. That feels about right too.


An improvement science practitioner (ISP) is someone who knows the science of improvement; and can demonstrate their know-how in practice; and can explain the principles that underpin their praxis using the language of the learner. Without any wacky language.

So if we want to diagnose and treat our organisational dyspraxia;

… and if we want smooth and efficient services (i.e. elimination of chaos and reduction of cost);

… and if we want to learn this know-how,  practice or praxis;

… then we could study the Foundations of Improvement Science in Healthcare (FISH);

… and we could seek the wisdom of  the growing Community of Healthcare Improvement Practitioners (CHIPs).


FISH & CHIPs … a new use for a familiar phrase?

The Jigsaw

6MDesignJigsawSystems are made of interdependent parts that link together – rather like a jigsaw.

If pieces are distorted, missing, or in the wrong place then the picture is distorted and the system does not work as well as it could.

And if pieces of one jigsaw are mixed up with those of another then it is even more difficult to see any clear picture.

A system of improvement is just the same.

There are many improvement jigsaws each of which have pieces that fit well together and form a synergistic whole. Lean, Six Sigma, and Theory of Constraints are three well known ones.

Each improvement jigsaw evolved in a different context so naturally the picture that emerges is from a particular perspective: such as manufacturing.

So when the improvement context changes then the familiar jigsaws may not work as well: such as when we shift context from products to services, and from commercial to public.

A public service such as healthcare requires a modified improvement jigsaw … so how do we go about getting that?


One way is to ‘evolve’ an old jigsaw into a new context. That is tricky because it means adding new pieces and changing old pieces and the ‘zealots’ do not like changing their familiar jigsaw so they resist.

Another way is to ‘combine’ several old jigsaws in the hope that together they will provide enough perspectives. That is even more tricky because now you have several tribes of zealots who resist having their familiar jigsaws modified.

What about starting with a blank canvas and painting a new picture from scratch? Well it is actually very difficult to create a blank canvas for learning because we cannot erase what we already know. Our current mental model is the context we need for learning new knowledge.


So what about using a combination of the above?

What about first learning a new creative approach called design? And within that framework we can then create a new improvement jigsaw that better suits our specific context using some of the pieces of the existing ones. We may need to modify the pieces a bit to allow them to fit better together, and we may need to fashion new pieces to fill the gaps that we expose. But that is part of the fun.


6MDesignJigsawThe improvement jigsaw shown here is a new hybrid.

It has been created from a combination of existing improvement knowledge and some innovative stuff.

Pareto analysis was described by Vilfredo Pareto over 100 years ago.  So that is tried and tested!

Time-series charts were invented by Walter Shewhart almost 100 years ago. So they are tried and tested too!

The combination of Pareto and Shewhart tools have been used very effectively for over 50 years. The combination is well proven.

The other two pieces are innovative. They have different parents and different pedigrees. And different purposes.

The Niggle-o-Gram® is related to 2-by-2, FMEA and EIQ and the 4N Chart®.  It is the synthesis of them that creates a powerful lens for focussing our improvement efforts on where the greatest return-on-investment will be.

The Right-2-Left Map® is a descendent of the Design family and has been crossed with Graph Theory and Causal Network exemplars to introduce their best features.  Its purpose is to expose errors of omission.

The emergent system is synergistic … much more effective than each part individually … and more even than their linear sum.


So when learning this new Science of Improvement we have to focus first on learning about the individual pieces and we do that by seeing examples of them used in practice.  That in itself is illuminating!

As we learn about more pieces a fog of confusion starts to form and we run the risk of mutating into a ‘tool-head’.  We know about the pieces in detail but we still do not see the bigger picture.

To avoid the tool-head trap we must balance our learning wheel and ensure that we invest enough time in learning-by-doing.

Then one day something apparently random will happen that triggers a ‘click’.  Familiar pieces start to fit together in a unfamiliar way and as we see the relationships, the sequences, and the synergy – then a bigger picture will start to emerge. Slowly at first and then more quickly as more pieces aggregate.

Suddenly we feel a big CLICK as the final pieces fall into place.  The fog of confusion evaporates in the bright sunlight of a paradigm shift in our thinking.

The way forward that was previously obscured becomes clearly visible.

Ah ha!

And we are off on the next stage  of our purposeful journey of improvement.

Seeing-by-Doing

OneStopBeforeGanttFlow improvement-by-design requires being able to see the flows; and that is trickier than it first appears.

We can see movement very easily.

Seeing flows is not so easy – particularly when they are mixed-up and unsteady.

One of the most useful tools for visualising flow was invented over 100 years ago by Henry Laurence Gantt (1861-1919).

Henry Gantt was a mechanical engineer from Johns Hopkins University and an early associate of Frederick Taylor. Gantt parted ways with Taylor because he disagreed with the philosophy of Taylorism which was that workers should be instructed what to do by managers (=parent-child).  Gantt saw that workers and managers could work together for mutual benefit of themselves and their companies (=adult-adult).  At one point Gantt was invited to streamline the production of munitions for the war effort and his methods were so successful that the Ordinance Department was the most productive department of the armed forces.  Gantt favoured democracy over autocracy and is quoted to have said “Our most serious trouble is incompetence in high places. The manager who has not earned his position and who is immune from responsibility will fail time and again, at the cost of the business and the workman“.

Henry Gantt invented a number of different charts – not just the one used in project management which was actually invented 20 years earlier by Karol Adamieki and re-invented by Gantt. It become popularised when it was used in the Hoover Dam project management; but that was after Gantt’s death in 1919.

The form of Gantt chart above is called a process template chart and it is designed to show the flow of tasks through  a process. Each horizontal line is a task; each vertical column is an interval of time. The colour code in each cell indicates what the task is doing and which resource the task is using during that time interval. Red indicates that the task is waiting. White means that the task is outside the scope of the chart (e.g. not yet arrived or already departed).

The Gantt chart shows two “red wedges”.  A red wedge that is getting wider from top to bottom is the pattern created by a flow constraint.  A red wedge that is getting narrower from top to bottom is the pattern of a policy constraint.  Both are signs of poor scheduling design.

A Gantt chart like this has three primary uses:
1) Diagnosis – understanding how the current flow design is creating the queues and delays.
2) Design – inventing new design options.
3) Prognosis – testing the innovative designs so the ‘fittest’ can be chosen for implementation.

These three steps are encapsulated in the third “M” of 6M Design® – the Model step.

In this example the design flaw was the scheduling policy.  When that was redesigned the outcome was zero-wait performance. No red on the chart at all.  The same number of tasks were completed in the same with the same resources used. Just less waiting. Which means less space is needed to store the queue of waiting work (i.e. none in this case).

That this is even possible comes as a big surprise to most people. It feels counter-intuitive. It is however an easy to demonstrate fact. Our intuition tricks us.

And that reduction in the size of the queue implies a big cost reduction when the work-in-progress is perishable and needs constant attention [such as patients lying on A&E trolleys and in hospital beds].

So what was the cost of re-designing this schedule?

A pinch of humility. A few bits of squared paper and some coloured pens. A couple hours of time. And a one-off investment in learning how to do it.  Peanuts in comparison with the recurring benefit gained.


The Improvement Pyramid

tornada_150_wht_10155The image of a tornado is what many associate with improvement.  An unpredictable, powerful, force that sweeps away the wood in its path. It certainly transforms – but it leaves a trail of destruction and disappointment in its wake. It does not discriminate  between the green wood and the dead wood.

A whirlwind is created by a combination of powerful forces – but the trigger that unleashes the beast is innocuous. The classic ‘butterfly wing effect’. A spark that creates an inferno.

This is not the safest way to achieve significant and sustained improvement. A transformation tornado is a blunt and destructive tool.  All it can hope to achieve is to clear the way for something more elegant. Improvement Science.

We need to build the capability for improvement progressively and to build it effective, efficient, strong, reliable, and resilient. In a word  – trustworthy. We need a durable structure.

But what sort of structure?  A tower from whose lofty penthouse we can peer far into the distance?  A bridge between the past and the future? A house with foundations, walls and a roof? Do these man-made edifices meet our criteria?  Well partly.

Let us see what nature suggests. What are the naturally durable designs?

Suppose we have a bag of dry sand – an unstructured mix of individual grains – and that each grain represents an improvement idea.

Suppose we have a specific issue that we would like to improve – a Niggle.

Let us try dropping the Improvement Sand on the Niggle – not in a great big reactive dollop – but in a proactive, exploratory bit-at-a-time way.  What shape emerges?

hourglass_150_wht_8762What we see is illustrated by the hourglass.  We get a pyramid.

The shape of the pyramid is determined by two factors: how sticky the sand is and how fast we pour it.

What we want is a tall pyramid – one whose sturdy pinnacle gives us the capability to see far and to do much.

The stickier the sand the steeper the sides of our pyramid.  The faster we pour the quicker we get the height we need. But there is a limit. If we pour too quickly we create instability – we create avalanches.

So we need to give the sand time to settle into its stable configuration; time for it to trickle to where it feels most comfortable.

And, in translating this metaphor to building improvement capability in system we could suggest that the ‘stickiness’ factor is how well ideas hang together and how well individuals get on with each other and how well they share ideas and learning. How cohesive our people are.  Distrust and conflict represent repulsive forces.  Repulsion creates a large, wide, flat structure  – stable maybe but incapable of vision and improvement. That is not what we need

So when developing a strategy for building improvement capability we build small pyramids where the niggles point to. Over time they will merge and bigger pyramids will appear and merge – until we achieve the height. Then was have a stable and capable improvement structure. One that we can use and we can trust.

Just from sprinkling Improvement Science Sand on our Niggles.

Jiggling

hurry_with_the_SFQP_kit[Dring] Bob’s laptop signaled the arrival of Leslie for their regular ISP remote coaching session.

<Bob> Hi Leslie. Thanks for emailing me with a long list of things to choose from. It looks like you have been having some challenging conversations.

<Leslie> Hi Bob. Yes indeed! The deepening gloom and the last few blog topics seem to be polarising opinion. Some are claiming it is all hopeless and others, perhaps out of desperation, are trying the FISH stuff for themselves and discovering that it works.  The ‘What Ifs’ are engaged in war of words with the ‘Yes Buts’.

<Bob> I like your metaphor! Where would you like to start on the long list of topics?

<Leslie> That is my problem. I do not know where to start. They all look equally important.

<Bob> So, first we need a way to prioritise the topics to get the horse-before-the-cart.

<Leslie> Sounds like a good plan to me!

<Bob> One of the problems with the traditional improvement approaches is that they seem to start at the most difficult point. They focus on ‘quality’ first – and to be fair that has been the mantra from the gurus like W.E.Deming. ‘Quality Improvement’ is the Holy Grail.

<Leslie>But quality IS important … are you saying they are wrong?

<Bob> Not at all. I am saying that it is not the place to start … it is actually the third step.

<Leslie>So what is the first step?

<Bob> Safety. Eliminating avoidable harm. Primum Non Nocere. The NoNos. The Never Events. The stuff that generates the most fear for everyone. The fear of failure.

<Leslie> You mean having a service that we can trust not to harm us unnecessarily?

<Bob> Yes. It is not a good idea to make an unsafe design more efficient – it will deliver even more cumulative harm!

<Leslie> OK. That makes perfect sense to me. So how do we do that?

<Bob> It does not actually matter.  Well-designed and thoroughly field-tested checklists have been proven to be very effective in the ‘ultra-safe’ industries like aerospace and nuclear.

<Leslie> OK. Something like the WHO Safe Surgery Checklist?

<Bob> Yes, that is a good example – and it is well worth reading Atul Gawande’s book about how that happened – “The Checklist Manifesto“.  Gawande is a surgeon who had published a lot on improvement and even so was quite skeptical that something as simple as a checklist could possibly work in the complex world of surgery. In his book he describes a number of personal ‘Ah Ha!’ moments that illustrate a phenomenon that I call Jiggling.

<Leslie> OK. I have made a note to read Checklist Manifesto and I am curious to learn more about Jiggling – but can we stick to the point? Does quality come after safety?

<Bob> Yes, but not immediately after. As I said, Quality is the third step.

<Leslie> So what is the second one?

<Bob> Flow.

There was a long pause – and just as Bob was about to check that the connection had not been lost – Leslie spoke.

<Leslie> But none of the Improvement Schools teach basic flow science.  They all focus on quality, waste and variation!

<Bob> I know. And attempting to improve quality before improving flow is like papering the walls before doing the plastering.  Quality cannot grow in a chaotic context. The flow must be smooth before that. And the fear of harm must be removed first.

<Leslie> So the ‘Improving Quality through Leadership‘ bandwagon that everyone is jumping on will not work?

<Bob> Well that depends on what the ‘Leaders’ are doing. If they are leading the way to learning how to design-for-safety and then design-for-flow then the bandwagon might be a wise choice. If they are only facilitating collaborative agreement and group-think then they may be making an unsafe and ineffective system more efficient which will steer it over the edge into faster decline.

<Leslie>So, if we can stabilize safety using checklists do we focus on flow next?

<Bob>Yup.

<Leslie> OK. That makes a lot of sense to me. So what is Jiggling?

<Bob> This is Jiggling. This conversation.

<Leslie> Ah, I see. I am jiggling my understanding through a series of ‘nudges’ from you.

<Bob>Yes. And when the learning cogs are a bit rusty, some Improvement Science Oil and a bit of Jiggling is more effective and much safer than whacking the caveman wetware with a big emotional hammer.

<Leslie>Well the conversation has certainly jiggled Safety-Flow-Quality-and-Productivity into a sensible order for me. That has helped a lot. I will sort my to-do list into that order and start at the beginning. Let me see. I have a plan for safety, now I can focus on flow. Here is my top flow niggle. How do I design the resource capacity I need to ensure the flow is smooth and the waiting times are short enough to avoid ‘persecution’ by the Target Time Police?

<Bob> An excellent question! I will send you the first ISP Brainteaser that will nudge us towards an answer to that question.

<Leslie> I am ready and waiting to have my brain-teased and my niggles-nudged!

The Mirror

mirror_mirror[Dring Dring]

The phone announced the arrival of Leslie for the weekly ISP mentoring conversation with Bob.

<Leslie> Hi Bob.

<Bob> Hi Leslie. What would you like to talk about today?

<Leslie> A new challenge – one that I have not encountered before.

<Bob>Excellent. As ever you have pricked my curiosity. Tell me more.

<Leslie> OK. Up until very recently whenever I have demonstrated the results of our improvement work to individuals or groups the usual response has been “Yes, but“. The habitual discount as you call it. “Yes, but your service is simpler; Yes, but your budget is bigger; Yes, but your staff are less militant.” I have learned to expect it so I do not get angry any more.

<Bob> OK. The mantra of the skeptics is to be expected and you have learned to stay calm and maintain respect. So what is the new challenge?

<Leslie>There are two parts to it.  Firstly, because the habitual discounting is such an effective barrier to diffusion of learning;  our system has not changed; the performance is steadily deteriorating; the chaos is worsening and everything that is ‘obvious’ has been tried and has not worked. More red lights are flashing on the patient-harm dashboard and the Inspectors are on their way. There is an increasing  turnover of staff at all levels – including Executive.  There is an anguished call for “A return to compassion first” and “A search for new leaders” and “A cultural transformation“.

<Bob> OK. It sounds like the tipping point of awareness has been reached, enough people now appreciate that their platform is burning and radical change of strategy is required to avoid the ship sinking and them all drowning. What is the second part?

<Leslie> I am getting more emails along the line of “What would you do?

<Bob> And your reply?

<Leslie> I say that I do not know because I do not have a diagnosis of the cause of the problem. I do know a lot of possible causes but I do not know which plausible ones are the actual ones.

<Bob> That is a good answer.  What was the response?

<Leslie>The commonest one is “Yes, but you have shown us that Plan-Do-Study-Act is the way to improve – and we have tried that and it does not work for us. So we think that improvement science is just more snake oil!”

<Bob>Ah ha. And how do you feel about that?

<Leslie>I have learned the hard way to respect the opinion of skeptics. PDSA does work for me but not for them. And I do not understand why that is. I would like to conclude that they are not doing it right but that is just discounting them and I am wary of doing that.

<Bob>OK. You are wise to be wary. We have reached what I call the Mirror-on-the-Wall moment.  Let me ask what your understanding of the history of PDSA is?

<Leslie>It was called Plan-Do-Check-Act by Walter Shewhart in the 1930’s and was presented as a form of the scientific method that could be applied on the factory floor to improving the quality of manufactured products.  W Edwards Deming modified it to PDSA where the “Check” was changed to “Study”.  Since then it has been the key tool in the improvement toolbox.

<Bob>Good. That is an excellent summary.  What the Zealots do not talk about are the limitations of their wonder-tool.  Perhaps that is because they believe it has no limitations.  Your experience would seem to suggest otherwise though.

<Leslie>Spot on Bob. I have a nagging doubt that I am missing something here. And not just me.

<Bob>The reason PDSA works for you is because you are using it for the purpose it was designed for: incremental improvement of small bits of the big system; the steps; the points where the streams cross the stages.  You are using your FISH training to come up with change plans that will work because you understand the Physics of Flow better. You make wise improvement decisions.  In fact you are using PDSA in two separate modes: discovery mode and delivery mode.  In discovery mode we use the Study phase to build your competence – and we learn most when what happens is not what we expected.  In delivery mode we use the Study phase to build our confidence – and that grows most when what happens is what we predicted.

<Leslie>Yes, that makes sense. I see the two modes clearly now you have framed it that way – and I see that I am doing both at the same time, almost by second nature.

<Bob>Yes – so when you demonstrate it you describe PDSA generically – not as two complimentary but contrasting modes. And by demonstrating success you omit to show that there are some design challenges that cannot be solved with either mode.  That hidden gap attracts some of the “Yes, but” reactions.

<Leslie>Do you mean the challenges that others are trying to solve and failing?

<Bob>Yes. The commonest error is to discount the value of improvement science in general; so nothing is done and the inevitable crisis happens because the system design is increasingly unfit for the evolving needs.  The toast is not just burned it is on fire and is now too late to  use the discovery mode of PDSA because prompt and effective action is needed.  So the delivery mode of PDSA is applied to a emergent, ill-understood crisis. The Plan is created using invalid assumptions and guesswork so it is fundamentally flawed and the Do then just makes the chaos worse.  In the ensuing panic the Study and Act steps are skipped so all hope of learning is lost and and a vicious and damaging spiral of knee-jerk Plan-Do-Plan-Do follows. The chaos worsens, quality falls, safety falls, confidence falls, trust falls, expectation falls and depression and despair increase.

<Leslie>That is exactly what is happening and why I feel powerless to help. What do I do?

<Bob>The toughest bit is past. You have looked squarely in the mirror and can now see harsh reality rather than hasty rhetoric. Now you can look out of the window with different eyes.  And you are now looking for a real-world example of where complex problems are solved effectively and efficiently. Can you think of one?

<Leslie>Well medicine is one that jumps to mind.  Solving a complex, emergent clinical problems requires a clear diagnosis and prompt and effective action to stabilise the patient and then to cure the underlying cause: the disease.

<Bob>An excellent example. Can you describe what happens as a PDSA sequence?

<Leslie>That is a really interesting question.  I can say for starters that it does not start with P – we have learned are not to have a preconceived idea of what to do at the start because it badly distorts our clinical judgement.  The first thing we do is assess the patient to see how sick and unstable they are – we use the Vital Signs. So that means that we decide to Act first and our first action is to Study the patient.

<Bob>OK – what happens next?

<Leslie>Then we will do whatever is needed to stabilise the patient based on what we have observed – it is called resuscitation – and only then we can plan how we will establish the diagnosis; the root cause of the crisis.

<Bob> So what does that spell?

<Leslie> A-S-D-P.  It is the exact opposite of P-D-S-A … the mirror image!

<Bob>Yes. Now consider the treatment that addresses the root cause and that cures the patient. What happens then?

<Leslie>We use the diagnosis is used to create a treatment Plan for the specific patient; we then Do that, and we Study the effect of the treatment in that specific patient, using our various charts to compare what actually happens with what we predicted would happen. Then we decide what to do next: the final action.  We may stop because we have achieved our goal, or repeat the whole cycle to achieve further improvement. So that is our old friend P-D-S-A.

<Bob>Yes. And what links the two bits together … what is the bit in the middle?

<Leslie>Once we have a diagnosis we look up the appropriate treatment options that have been proven to work through research trials and experience; and we tailor the treatment to the specific patient. Oh I see! The missing link is design. We design a specific treatment plan using generic principles.

<Bob>Yup.  The design step is the jam in the improvement sandwich and it acts like a mirror: A-S-D-P is reflected back as P-D-S-A

<Leslie>So I need to teach this backwards: P-D-S-A and then Design and then A-S-P-D!

<Bob>Yup – and you know that by another name.

<Leslie> 6M Design®! That is what my Improvement Science Practitioner course is all about.

<Bob> Yup.

<Leslie> If you had told me that at the start it would not have made much sense – it would just have confused me.

<Bob>I know. That is the reason I did not. The Mirror needs to be discovered in order for the true value to appreciated. At the start we look in the mirror and perceive what we want to see. We have to learn to see what is actually there. Us. Now you can see clearly where P-D-S-A and Design fit together and the missing A-S-D-P component that is needed to assemble a 6M Design® engine. That is Improvement-by-Design in a nine-letter nutshell.

<Leslie> Wow! I can’t wait to share this.

<Bob> And what do you expect the response to be?

<Leslie>”Yes, but”?

<Bob> From the die hard skeptics – yes. It is the ones who do not say “Yes, but” that you want to engage with. The ones who are quiet. It is always the quiet ones that hold the key.

Three Essentials

There are three necessary parts before ANY improvement-by-design effort will gain traction. Omit any one of them and nothing happens.

stick_figure_drawing_three_check_marks_150_wht_5283

1. A clear purpose and an outline strategic plan.

2. Tactical measurement of performance-over-time.

3. A generic Improvement-by-Design framework.

These are necessary minimum requirements to be able to safely delegate the day-to-day and week-to-week tactical stuff the delivers the “what is needed”.

These are necessary minimum requirements to build a self-regulating, self-sustaining, self-healing, self-learning win-win-win system.

And this is not a new idea.  It was described by Joseph Juran in the 1960’s and that description was based on 20 years of hands-on experience of actually doing it in a wide range of manufacturing and service organisations.

That is 20 years before  the terms “Lean” or “Six Sigma” or “Theory of Constraints” were coined.  And the roots of Juran’s journey were 20 years before that – when he started work at the famous Hawthorne Works in Chicago – home of the Hawthorne Effect – and where he learned of the pioneering work of  Walter Shewhart.

And the roots of Shewhart’s innovations were 20 years before that – in the first decade of the 20th Century when innovators like Henry Ford and Henry Gantt were developing the methods of how to design and build highly productive processes.

Ford gave us the one-piece-flow high-quality at low-cost production paradigm. Toyota learned it from Ford.  Gantt gave us simple yet powerful visual charts that give us an understanding-at-a-glance of the progress of the work.  And Shewhart gave us the deceptively simple time-series chart that signals when we need to take more notice.

These nuggets of pragmatic golden knowledge have been buried for decades under a deluge of academic mud.  It is nigh time to clear away the detritus and get back to the bedrock of pragmatism. The “how-to-do-it” of improvement. Just reading Juran’s 1964 “Managerial Breakthrough” illustrates just how much we now take for granted. And how ignorant we have allowed ourselves to become.

Acquired Arrogance is a creeping, silent disease – we slip from second nature to blissful ignorance without noticing when we divorce painful reality and settle down with our own comfortable collective rhetoric.

The wake-up call is all the more painful as a consequence: because it is all the more shocking for each one of us; and because it affects more of us.

The pain is temporary – so long as we treat the cause and not just the symptom.

The first step is to acknowledge the gap – and to start filling it in. It is not technically difficult, time-consuming or expensive.  Whatever our starting point we need to put in place the three foundation stones above:

1. Common purpose.
2. Measurement-over-time.
3. Method for Improvement.

Then the rubber meets the road (rather than the sky) and things start to improve – for real. Lots of little things in lots of places at the same time – facilitated by the Junior Managers. The cumulative effect is dramatic. Chaos is tamed; calm is restored; capability builds; and confidence builds. The cynics have to look elsewhere for their sport and the skeptics are able to remain healthy.

Then the Middle Managers feel the new firmness under their feet – where before there were shifting sands. They are able to exert their influence again – to where it makes a difference. They stop chasing Scotch Mist and start reporting real and tangible improvement – with hard evidence. And they rightly claim a slice of the credit.

And the upwelling of win-win-win feedback frees the Senior Managers from getting sucked into reactive fire-fighting and the Victim Vortex; and that releases the emotional and temporal space to start learning and applying System-level Design.  That is what is needed to deliver a significant and sustained improvement.

And that creates the stable platform for the Executive Team to do Strategy from. Which is their job.

It all starts with the Three Essentials:

1. A Clear and Common Constancy of Purpose.
2. Measurement-over-time of the Vital Metrics.
3. A Generic Method for Improvement-by-Design.

Celebrating Achievement

CertificateOne of the best things about improvement is the delight that we feel when someone else acknowledges it.

Particularly someone whose opinion we respect.

We feel a warm glow of pride when they notice the difference and take the time to say “Well done!”

We need this affirmative feedback to fuel our improvement engine.

And we need to learn how to give ourselves affirmative feedback because usually there is a LOT of improvement work to do behind the scenes before any externally visible improvement appears.

It is like an iceberg – most of it is hidden from view.

And improvement is tough. We have to wade through Bureaucracy Treacle that is laced with Cynicide and policed by Skeptics.  We know this.

So we need to learn to celebrate the milestones we achieve and to keep reminding ourselves of what we have already done.  Even if no one else notices or cares.

Like the certificates, cups, and medals that we earned at school – still proudly displayed on our mantlepieces and shelves decades later. They are important. Especially to us.

So it is always a joy to celebrate the achievement of others and to say “Well Done” for reaching a significant milestone on the path of learning Improvement Science.

And that has been my great pleasure this week – to prepare and send the Certificates of Achievement to those who have recently completed the FISH course.

The best part of all has been to hear how many times the word “treasured” is used in the “Thank You” replies.

We display our Certificates with pride – not so much that others can see – more to remind ourselves every day to Celebrate Achievement.


DRAT!

[Bing Bong]  The sound bite heralded Leslie joining the regular Improvement Science mentoring session with Bob.  They were now using web-technology to run virtual meetings because it allows a richer conversation and saves a lot of time. It is a big improvement.

<Bob> Hi Lesley, how are you today?

<Leslie> OK thank you Bob.  I have a thorny issue to ask you about today. It has been niggling me even since we started to share the experience we are gaining from our current improvement-by-design project.

<Bob> OK. That sounds interesting. Can you paint the picture for me?

<Leslie> Better than that – I can show you the picture, I will share my screen with you.

DRAT_01 <Bob> OK. I can see that RAG table. Can you give me a bit more context?

<Leslie> Yes. This is how our performance management team have been asked to produce their 4-weekly reports for the monthly performance committee meetings.

<Bob> OK. I assume the “Period” means sequential four week periods … so what is Count, Fail and Fail%?

<Leslie> Count is the number of discharges in that 4 week period, Fail is the number whose length of stay is longer than the target, and Fail% is the ratio of Fail/Count for each 4 week period.

<Bob> It looks odd that the counts are all 28.  Is there some form of admission slot carve-out policy?

<Leslie> Yes. There is one admission slot per day for this particular stream – that has been worked out from the average historical activity.

<Bob> Ah! And the Red, Amber, Green indicates what?

<Leslie> That is depends where the Fail% falls in a set of predefined target ranges; less than 5% is green, 5-10% is Amber and more than 10% is red.

<Bob> OK. So what is the niggle?

<Leslie>Each month when we are in the green we get no feedback – a deafening silence. Each month we are in amber we get a warning email.  Each month we are in the red we have to “go and explain ourselves” and provide a “back-on-track” plan.

<Bob> Let me guess – this feedback design is not helping much.

<Leslie> It is worse than that – it creates a perpetual sense of fear. The risk of breaching the target is distorting people’s priorities and their behaviour.

<Bob> Do you have any evidence of that?

<Leslie> Yes – but it is anecdotal.  There is a daily operational meeting and the highest priority topic is “Which patients are closest to the target length of stay and therefore need to have their  discharge expedited?“.

<Bob> Ah yes.  The “target tail wagging the quality dog” problem. So what is your question?

<Leslie> How do we focus on the cause of the problem rather than the symptoms?  We want to be rid of the “fear of the stick”.

<Bob> OK. What you have hear is a very common system design flaw. It is called a DRAT.

<Leslie> DRAT?

<Bob> “Delusional Ratio and Arbitrary Target”.

<Leslie> Ha! That sounds spot on!  “DRAT” is what we say every time we miss the target!

<Bob> Indeed.  So first plot this yield data as a time series chart.

<Leslie> Here we go.

DRAT_02<Bob>Good. I see you have added the cut-off thresholds for the RAG chart. These 5% and 10% thresholds are arbitrary and the data shows your current system is unable to meet them. Your design looks incapable.

<Leslie>Yes – and it also shows that the % expressed to one decimal place is meaningless because there are limited possibilities for the value.

<Bob> Yes. These are two reasons that this is a Delusional Ratio; there are quite a few more.

DRAT_03<Leslie> OK  and if I plot this as an Individuals charts I can see that this variation is not exceptional.

<Bob> Careful Leslie. It can be dangerous to do this: an Individuals chart of aggregate yield becomes quite insensitive with aggregated counts of relatively rare events, a small number of levels that go down to zero, and a limited number of points.  The SPC zealots are compounding the problem and plotting this data as a C-chart or a P-chart makes no difference.

This is all the effect of the common practice of applying  an arbitrary performance target then counting the failures and using that as means of control.

It is poor feedback loop design – but a depressingly common one.

<Leslie> So what do we do? What is a better design?

<Bob> First ask what the purpose of the feedback is?

<Leslie> To reduce the number of beds and save money by forcing down the length of stay so that the bed-day load is reduced and so we can do the same activity with fewer beds and at the same time avoid cancellations.

<Bob> OK. That sounds reasonable from the perspective of a tax-payer and a patient. It would also be a more productive design.

<Leslie> I agree but it seems to be having the opposite effect.  We are focusing on avoiding breaches so much that other patients get delayed who could have gone home sooner and we end up with more patients to expedite. It is like a vicious circle.  And every time we fail we get whacked with the RAG stick again. It is very demoralizing and it generates a lot of resentment and conflict. That is not good for anyone – least of all the patients.

<Bob>Yes.  That is the usual effect of a DRAT design. Remember that senior managers have not been trained in process improvement-by-design either so blaming them is also counter-productive.  We need to go back to the raw data. Can you plot actual LOS by patient in order of discharge as a run chart.

DRAT_04

<Bob> OK – is the maximum LOS target 8 days?

<Leslie> Yes – and this shows  we are meeting it most of the time.  But it is only with a huge amount of effort.

<Bob> Do you know where 8 days came from?

<Leslie> I think it was the historical average divided by 85% – someone read in a book somewhere that 85%  average occupancy was optimum and put 2 and 2 together.

<Bob> Oh dear! The “85% Occupancy is Best” myth combined with the “Flaw of Averages” trap. Never mind – let me explain the reasons why it is invalid to do this.

<Leslie> Yes please!

<Bob> First plot the data as a run chart and  as a histogram – do not plot the natural process limits yet as you have done. We need to do some validity checks first.

DRAT_05

<Leslie> Here you go.

<Bob> What do you see?

<Leslie> The histogram  has more than one peak – and there is a big one sitting just under the target.

<Bob>Yes. This is called the “Horned Gaussian” and is the characteristic pattern of an arbitrary lead-time target that is distorting the behaviour of the system.  Just as you have described subjectively. There is a smaller peak with a mode of 4 days and are a few very long length of stay outliers.  This multi-modal pattern means that the mean and standard deviation of this data are meaningless numbers as are any numbers derived from them. It is like having a bag of mixed fruit and then setting a maximum allowable size for an unspecified piece of fruit. Meaningless.

<Leslie> And the cases causing the breaches are completely different and could never realistically achieve that target! So we are effectively being randomly beaten with a stick. That is certainly how it feels.

<Bob> They are certainly different but you cannot yet assume that their longer LOS is inevitable. This chart just says – “go and have a look at these specific cases for a possible cause for the difference“.

<Leslie> OK … so if they are from a different system and I exclude them from the analysis what happens?

<Bob> It will not change reality.  The current design of  this process may not be capable of delivering an 8 day upper limit for the LOS.  Imposing  a DRAT does not help – it actually makes the design worse! As you can see. Only removing the DRAT will remove the distortion and reveal the underlying process behaviour.

<Leslie> So what do we do? There is no way that will happen in the current chaos!

<Bob> Apply the 6M Design® method. Map, Measure and Model it. Understand how it is behaving as it is then design out all the causes of longer LOS and that way deliver with a shorter and less variable LOS. Your chart shows that your process is stable.  That means you have enough flow capacity – so look at the policies. Draw on all your FISH training. That way you achieve your common purpose, and the big nasty stick goes away, and everyone feels better. And in the process you will demonstrate that there is a better feedback design than DRATs and RAGs. A win-win-win design.

<Leslie> OK. That makes complete sense. Thanks Bob!  But what you have described is not part of the FISH course.

<Bob> You are right. It is part of the ISP training that comes after FISH. Improvement Science Practitioner.

<Leslie> I think we will need to get a few more people trained in the theory, techniques and tools of Improvement Science.

<Bob> That would appear to be the case. They will need a real example to see what is possible.

<Leslie> OK. I am on the case!

Fudge? We Love Fudge!

stick_figures_moving_net_150_wht_8609
It is almost autumn again.  The new school year brings anticipation and excitement. The evenings are drawing in and there is a refreshing chill in the early morning air.

This is the time of year for fudge.

Alas not the yummy sweet sort that Grandma cooked up and gave out as treats.

In healthcare we are already preparing the Winter Fudge – the annual guessing game of attempting to survive the Winter Pressures. By fudging the issues.

This year with three landmark Safety and Quality reports under our belts we have more at stake than ever … yet we seem as ill prepared as usual. Mr Francis, Prof Keogh and Dr Berwick have collectively exhorted us to pull up our socks.

So let us explore how and why we resort to fudging the issues.

Watch the animation of a highly simplified emergency department and follow the thoughts of the manager. You can pause, rewind, and replay as much as you like.  Follow the apparently flawless logic – it is very compelling. The exercise is deliberately simplified to eliminate wriggle room. But it is valid because the behaviour is defined by the Laws of Physics – and they are not negotiable.

http://www.youtube.com/watch?v=geRBGP-u5zg&rel=0&loop=1&modestbranding=1

The problem was combination of several planning flaws – two in particular.

First is the “Flaw of Averages” which is where the past performance-over-time is boiled down to one number. An average. And that is then used to predict precise future behaviour. This is a very big mistake.

The second is the “Flaw of Fudge Factors” which is a attempt to mitigate the effects of first error by fudging the answer – by adding an arbitrary “safety margin”.

This pseudo-scientific sleight-of-hand may polish the planning rhetoric and render it more plausible to an unsuspecting Board – but it does not fool Reality.

In reality the flawed design failed – as the animation dramatically demonstrated.  The simulated patients came to harm. Unintended harm to be sure – but harm nevertheless.

So what is the alternative?

The alternative is to learn how to avoid Sir Flaw of Averages and his slippery friend Mr Fudge Factor.

And learning how to do that is possible … it is called Improvement Science.

And you can start right now … click HERE.

Taming the Wicked Bull and the OH Effect

bull_by_the_horns_anim_150_wht_9609Take the bull by the horns” is a phrase that is often heard in Improvement circles.

The metaphor implies that the system – the bull – is an unpredictable, aggressive, wicked, wild animal with dangerous sharp horns.

“Unpredictable” and “Dangerous” is certainly what the newspapers tell us the NHS system is – and this generates fear.  Fear-for-our-safety and fear drives us to avoid the bad tempered beast.

It creates fear in the hearts of the very people the NHS is there to serve – the public.  It is not the intended outcome.

Bullish” is a phrase we use for “aggressive behaviour” and it is disappointing to see those accountable behave in a bullish manner – aggressive, unpredictable and dangerous.

We are taught that bulls are to be  avoided and we are told to not to wave red flags at them! For our own safety.

But that is exactly what must happen for Improvement to flourish.  We all need regular glimpses of the Red Flag of Reality.  It is called constructive feedback – but it still feels uncomfortable.  Our natural tendency to being shocked out of our complacency is to get angry and to swat the red flag waver.  And the more powerful we are,  the sharper our horns are, the more swatting we can do and the more fear we can generate.  Often intentionally.

So inexperienced improvement zealots are prodded into “taking the executive bull by the horns” – but it is poor advice.

Improvement Scientists are not bull-fighters. They are not fearless champions who put themselves at personal risk for personal glory and the entertainment of others.  That is what Rescuers do. The fire-fighters; the quick-fixers; the burned-toast-scrapers; the progress-chasers; and the self-appointed-experts. And they all get gored by an angry bull sooner or later.  Which is what the crowd came to see – Bull Fighter Blood and Guts!

So attempting to slay the wicked bullish system is not a realistic option.

What about taming it?

This is the game of Bucking Bronco.  You attach yourself to the bronco like glue and wear it down as it tries to throw you off and trample you under hoof. You need strength, agility, resilience and persistence. All admirable qualities. Eventually the exhausted beast gives in and does what it is told. It is now tamed. You have broken its spirit.  The stallion is no longer a passionate leader; it is just a passive follower. It has become a Victim.

Improvement requires spirit – lots of it.

Improvement requires the spirit-of-courage to challenge dogma and complacency.
Improvement requires the spirit-of-curiosity to seek out the unknown unknowns.
Improvement requires the spirit-of-bravery to take calculated risks.
Improvement requires the spirit-of-action to make  the changes needed to deliver the improvements.
Improvement requires the spirit-of-generosity to share new knowledge, understanding and wisdom.

So taming the wicked bull is not going to deliver sustained improvement.  It will only achieve stable mediocrity.

So what next?

What about asking someone who has actually done it – actually improved something?

Good idea! Who?

What about someone like Don Berwick – founder of the Institute of Healthcare Improvement in the USA?

Excellent idea! We will ask him to come and diagnose the disease in our system – the one that lead to the Mid-Staffordshire septic safety carbuncle, and the nasty quality rash in 14 Trusts that Professor Sir Bruce Keogh KBE uncovered when he lifted the bed sheet.

[Click HERE to see Dr Bruce’s investigation].

We need a second opinion because the disease goes much deeper – and we need it from a credible, affable, independent, experienced expert. Like Dr Don B.

So Dr Don has popped over the pond,  examined the patient, formulated his diagnosis and delivered his prescription.

[Click HERE to read Dr Don’s prescription].

Of course if you ask two experts the same question you get two slightly different answers.  If you ask ten you get ten.  This is because if there was only one answer that everyone agreed on then there would be no problem, no confusion, and need for experts. The experts know this of course. It is not in their interest to agree completely.

One bit of good news is that the reports are getting shorter.  Mr Robert’s report on the failing of one hospital is huge and has 209 recommendations.  A bit of a bucketful.  Dr Bruce’s report is specific to the Naughty Fourteen who have strayed outside the statistical white lines of acceptable mediocrity.

Dr Don’s is even shorter and it has just 10 recommendations. One for each finger – so easy to remember.

1. The NHS should continually and forever reduce patient harm by embracing wholeheartedly an ethic of learning.

2. All leaders concerned with NHS healthcare – political, regulatory, governance, executive, clinical and advocacy – should place quality of care in general, and patient safety in particular, at the top of their priorities for investment, inquiry, improvement, regular reporting, encouragement and support.

3. Patients and their carers should be present, powerful and involved at all levels of healthcare organisations from wards to the boards of Trusts.

4. Government, Health Education England and NHS England should assure that sufficient staff are available to meet the NHS’s needs now and in the future. Healthcare organisations should ensure that staff are present in appropriate numbers to provide safe care at all times and are well-supported.

5. Mastery of quality and patient safety sciences and practices should be part of initial preparation and lifelong education of all health care professionals, including managers and executives.

6. The NHS should become a learning organisation. Its leaders should create and support the capability for learning, and therefore change, at scale, within the NHS.

7. Transparency should be complete, timely and unequivocal. All data on quality and safety, whether assembled by government, organisations, or professional societies, should be shared in a timely fashion with all parties who want it, including, in accessible form, with the public.

8. All organisations should seek out the patient and carer voice as an essential asset in monitoring the safety and quality of care.

9. Supervisory and regulatory systems should be simple and clear. They should avoid diffusion of responsibility. They should be respectful of the goodwill and sound intention of the vast majority of staff. All incentives should point in the same direction.

10. We support responsive regulation of organisations, with a hierarchy of responses. Recourse to criminal sanctions should be extremely rare, and should function primarily as a deterrent to wilful or reckless neglect or mistreatment.

The meat in the sandwich are recommendations 5 and 6 that together say “Learn Improvement Science“.

And what happens when we commit and engage in that learning journey?

Steve Peak has described what happens in this this very blog. It is called the OH effect.

OH stands for “Obvious-in-Hindsight”.

Obvious means “understandable” which implies visible, sensible, rational, doable and teachable.

Hindsight means “reflection” which implies having done something and learning from reality.

So if you would like to have a sip of Dr Don’s medicine and want to get started on the path to helping to create a healthier healthcare system you can do so right now by learning how to FISH – the first step to becoming an Improvement Science Practitioner.

The good news is that this medicine is neither dangerous nor nasty tasting – it is actually fun!

And that means it is OK for everyone – clinicians, managers, patients, carers and politicians.  All of us.


The Learning Labyrinth

labyrinth

The mind is a labyrinth of knowledge – a maze with many twists, turns, joins, splits, tunnels, bridges, crevasses and caverns.

Some paths lead to dead ends; others take a long way around but get to the destination in the end.

The shortest path is not obvious – even in hindsight.

And there is another challenge … no two individuals share the same knowledge labyrinth.  An obvious path between problem and solution for one person may be  invisible or incomprehensible to another.

But the greatest challenge, and the greatest opportunity, is that our labyrinth of knowledge can change and does change continuously … through learning.

So if one person can see a path of improvement between current problem and future solution, then how can they guide another who cannot?

This is a challenge that an Improvement Scientist faces every day.

It is not effective to just give a list of instructions – “To get from problem to solution follow this path“.  The path may not exist in the recipients knowledge labyrinth. If they just follow the instructions they will come up against a wall or fall into a hole.

It is not realistic to expect the learner to replace their labyrinth of knowledge with that of the teacher – to clone the teachers way of thinking. Just reciting the Words of the Guru is not improvement – is Zealotry.

One way is for a guide to describe their own labyrinth of knowledge.  To lay it out in a way that any other can explore.  A way that is fully signposted, with explanations and maps that that the explorer can refer to as  they go.  A template against which they can compare their own knowledge labyrinth to reveal the similarities and the differences.

No two people will explore a knowledge labyrinth in the same way … but that does not matter. So long as they are able to uncover and assumptions that misguide them and any gaps in their knowledge block their progress.  With that feedback they can update their own mental signposts and create safe, effective and efficient paths that they can follow in future at will.

And that  is how the online FISH training is designed.  It is the knowledge labyrinth of an experienced Improvement Scientist that can be explored online.

And it keeps changing  …

The Grape Vine

growing_blue_vine_scrolling_down_150_wht_247Improvement Science is a collaborative community activity.

And word about what is possible spreads through The Grape Vine.

And it spreads in a particular way – through stories – personal accounts of “ah ha” moments.

Those “ah ha” moments are generated by a process – a process designed to generate them.

And that process is called the Nerve Curve.  It is rather like an emotional roller-coaster ride.

The Nerve Curve starts comfortably enough with a few gentle ups, downs, twists and turns – just to settle everyone in their seats.

Then it picks up pace and you have to hold on a bit tighter.

Then comes the Challenge – an interactive group-led improvement activity.  Something like the “Save the NHS Game“.

Then comes the Shock!  When the “intuitively obvious” and “collectively agreed” decisions and actions make the problem worse rather than better. The shock is magnified by learning that there is a solution – and that it was hidden from us. We did not know what we did not know. We were blissfully ignorant.

Now we are not. We are painfully aware of what we did not know.

Impossibility_HypothesisThen we head for Denial like a scared rabbit – but the cars are moving fast now and the is no stopping or going back.  We cannot get off – we cannot go back – so we cover our eyes and ears to block out the New Reality.

It does not work very well.  We quickly realize that it is safer to be able to see where we are heading so we can prepare for what is coming.  An emotional brick wall looms up in front of us – and written on it are the words “Impossibility Hypothesis”.  And we are heading right at it. A new emotion bubbles to the surface.

Anger.

Who’s ****** idea was it to get on this infernal contraption?  Why weren’t we warned?  Who is in charge? Who is to blame?

That does not work very well either. So we try a different strategy.

Bargaining.

We desperately want to limit the damage to comfort zone and confidence so we try negotiating a compromise, finding an exit option, and looking for the emergency stop cord.  There isn’t one. Reality is relentless and ruthless. Uncompromising.

Now we are really scared and with no viable options for staying where we were and no credible options for avoiding a catastrophe we are emotionally stuck – and we start to sink into Depression which is the path to Hopelessness, Apathy and Despair (HAD). We have run out of options. And we cannot stay in the past.

But the seed of innovation has been sown.  A hidden problem has been uncovered and an unknown option has been demonstrated. The “Way Over The Impossible-for-Me barrier” is clearly signposted. The light at the end of the tunnel has been switched on. We have a choice.

And at the last second we sweep over the Can’t Do Barrier and when we look back it has disappeared – it was a mirage – a perceptual trick our Intuition was playing on us. It only existed in our minds.

That is the “Ah ha”.

And now we can see a way forward – and how with support, guidance, encouragement and effort we can climb up Acceptance Mountain to Resolution Peak. It is will not be quick.  It will not be comfortable.  We have some unlearning to do. A few old assumptions and habits that need to be challenged, dismantled and re-designed.

It is hard work but it is surprisingly invigorating as a previously unrecognized inner well of hope, enthusiasm and confidence is tapped. We surprise ourselves with what we can do already.  We realize that the only thing that was actually blocking us before was our belief it was too difficult. And the lack of a guide.

And then we share our “ah ha” with others through The Grape Vine.

Here is a shared “ah ha” from this week:

The Post It® Note exercise was my biggest “Aha” moment on a combination of levels. The aspect that particularly resonated was the range of behaviours and responses from the different pairings, an aspect that would have been hidden had I done the exercise on my own. I’m still smiling at the simple elegance of this particular exercise and the depth of learning I am getting from it. [PD, Consultant Paediatrician. 15th July 2013].

The Post It® Note exercise is part of the FISH course … you can try it yourself here

This blog is part of The Grape Vine.

The Nerve Curve is ready and waiting to take you on an exciting ride through Improvement Science!

Step 5 – Monitor

Improvement-by-Design is not the same as Improvement-by-Desire.

Improvement-by-Design has a clear destination and a design that we know can get us there because we have tested it before we implement it.

Improvement-by-Desire has a vague direction and no design – we do not know if the path we choose will take us in the direction we desire to go. We cannot see the twists and turns, the unknown decisions, the forks, the loops, and the dead-ends. We expect to discover those along the way. It is an exercise in hope.

So where pessimists and skeptics dominate the debate then Improvement-by-Design is a safer strategy.

Just over seven weeks ago I started an Improvement-by-Design project – a personal one. The destination was clear: to get my BMI (body mass index) into a “healthy” range by reducing weight by about 5 kg.  The design was clear too – to reduce energy input rather than increase energy output. It is a tried-and-tested method – “avoid burning the toast”.  The physical and physiological model predicted that the goal was achievable in 6 to 8 weeks.

So what has happened?

To answer that question requires two time-series charts. The input chart of calories ingested and the output chart of weight. This is Step 5 of the 6M Design® sequence.

Energy_Weight_ModelRemember that there was another parameter  in this personal Energy-Weight system: the daily energy expended.

But that is very difficult to measure accurately – so I could not do that.

What I could do was to estimate the actual energy expended from the model of the system using the measured effect of the change. But that is straying into the Department of Improvement Science Nerds. Let us stay in the real world a  bit longer.

Here is the energy input chart …

SRD_EnergyIn_XmR

It shows an average calorie intake of 1500 kcal – the estimated required value to achieve the weight loss given the assumptions of the physiological model. It also shows a wide day-to-day variation.  It does not show any signal flags (red dots) so an inexperienced Improvementologist might conclude that this just random noise.

It is not.  The data is not homogeneous. There is a signal in the system – a deliberate design change – and without that context it is impossible to correctly interpret the chart.

Remember Rule #1: Data without context is meaningless.

The deliberate process design change was to reduce calorie intake for just two days per week by omitting unnecessary Hi-Cal treats – like those nice-but-naughty Chocolate Hobnobs. But which two days varied – so there is no obvious repeating pattern in the chart. And the intake on all days varied – there were a few meals out and some BBQ action.

To separate out these two parts of the voice-of-the-process we need to rationally group the data into the Lo-cal days (F) and the OK-cal days (N).

SRD_EnergyIn_Grouped_XmR

The grouped BaseLine© chart tells a different story.  The two groups clearly have a different average and both have a lower variation-over-time than the meaningless mixed-up chart.

And we can now see a flag – on the second F day. That is a prompt for an “investigation” which revealed: will-power failure.  Thursday evening beer and peanuts! The counter measure was to avoid Lo-cal on a Thursday!

What we are seeing here is the fifth step of 6M Design® exercise  – the Monitor step.

And as well as monitoring the factor we are changing – the cause;  we also monitor the factor we want to influence – the effect.

The effect here is weight. And our design includes a way of monitoring that – the daily weighing.

SRD_WeightOut_XmRThe output metric BaseLine© chart – weight – shows a very different pattern. It is described as “unstable” because there are clusters of flags (red dots) – some at the start and some at the end. The direction of the instability is “falling” – which is the intended outcome.

So we have robust, statistically valid evidence that our modified design is working.

The weight is falling so the energy going in must be less than the energy being put out. I am burning off the excess lard and without doing any extra exercise.  The physics of the system mandate that this is the only explanation. And that was my design specification.

So that is good. Our design is working – but is it working as we designed?  Does observation match prediction? This is Improvement-by-Design.

Remember that we had to estimate the other parameter to our model – the average daily energy output – and we guessed a value of 2400 kcal per day using generic published data.  Now I can refine the model using my specific measured change in weight – and I can work backwards to calculate the third parameter.  And when I did that the number came out at 2300 kcal per day.  Not a huge difference – the equivalent of one yummy Chocolate Hobnob a day – but the effect is cumulative.  Over the 53 days of the 6M Design® project so far that would be a 5300 kcal difference – about 0.6kg of useless blubber.

So now I have refined my personal energy-weight model using the new data and I can update my prediction and create a new chart – a Deviation from Aim chart.

SRD_WeightOut_DFA
This is the  chart I need to watch to see  if I am on the predicted track – and it too is unstable -and not a good direction.  It shows that the deviation-from-aim is increasing over time and this is because my original guesstimate of an unmeasurable model parameter was too high.

This means that my current design will not get me to where I want to be, when I what to be there. This tells me  I need to tweak my design.  And I have a list of options.

1) I could adjust the target average calories per day down from 1500 to 1400 and cut out a few more calories; or

2) I could just keep doing what I am doing and accept that it will take me longer to get to the destination; or

3) I could do a bit of extra exercise to burn the extra 100 kcals a day off, or

4) I could do a bit of any or all three.

And because I am comparing experience with expectation using a DFA chart I will know very quickly if the design tweak is delivering.

And because some nice weather has finally arrived so the BBQ will be busy I have chosen to take longer to get there. I will enjoy the weather, have a few beers and some burgers. And that is OK. It is a perfectly reasonable design option – it is a rational and justifiable choice.

And I need to set my next destination – a weight if about 72 kg according to the BMI chart – and with my calibrated Energy-Weight model I will know exactly how to achieve that weight and how long it will take me. And I also know how to maintain it – by  increasing my calorie intake. More beer and peanuts – maybe – or the occasional Chocolate Hobnob even. Hurrah! Win-win-win!


6MDesign This real-life example illustrates 6M Design® in action and demonstrates that it is a generic framework.

The energy-weight model in this case is a very simple one that can be worked out on the back of a beer mat (which is what I did).

It is called a linear model because the relationship between calories-in and weight-out is approximately a straight line.

Most real-world systems are not like this. Inputs are not linearly related to outputs.  They are called non-linear systems: and that makes a BIG difference.

A very common error is to impose a “linear model” on a “non-linear system” and it is a recipe for disappointment and disaster.  We do that when we commit the Flaw of Averages error. We do it when we plot linear regression lines through time-series data. We do it when we extrapolate beyond the limits of our evidence.  We do it when we equate time with money.

The danger of this error is that our linear model leads us to make unwise decisions and we actually make the problem worse – not better.  We then give up in frustration and label the problem as “impossible” or “wicked” or get sucked into to various forms of Snake Oil Sorcery.

The safer approach is to assume the system is non-linear and just let the voice of the system talk to us through our BaseLine© charts. The challenge for us is to learn to understand what the system is saying.

That is why the time-series charts are called System Behaviour Charts and that is why they are an essential component of Improvement-by-Design.

However – there is a step that must happen before this – and that is to get the Foundations in place. The foundation of knowledge on which we can build our new learning. That gap must be filled first.

And anyone who wants to invest in learning the foundations of improvement science can now do so at their own convenience and at their own pace because it is on-line …. and it is here.

fish

“When the Student is ready …”

Improvement Science is not a new idea.  The principles are enduring and can be traced back as far as recorded memory – for Millennia. This means that there is a deep well of ancient wisdom that we can draw from.  Much of this wisdom is condensed into short sayings which capture a fundamental principle or essence.

One such saying is attributed to Zen Buddhism and goes “When the Student is ready the Teacher will appear.

This captures the essence of a paradigm shift – a term made popular by Thomas S Kuhn in his seminal 1962 book – The Structure of Scientific Revolutions.  It was written just over 50 years ago.

System-wide change takes time and the first stage is the gradual build up of dissatisfaction with the current paradigm.  The usual reaction from the Guardians of the Status Quo is to silence the first voices of dissent, often brutally. As the pressure grows there are too many voices to silence individually so more repressive Policies and Policing are introduced. This works for a while but does not dissolve the drivers of dissatisfaction. The pressure builds and the cracks start to appear.  This is a dangerous phase.

There are three ways out: repression, revolution, and evolution.  The last one is the preferred option – and it requires effective leadership to achieve.  Effective leaders are both Teachers and Students. Knowledge and understanding flow through them as they acquire Wisdom.

The first essence of the message is that the solutions to the problems are already known – but the reason they are not widely known and used is our natural affection for the familiar and our distrust of the unfamiliar.  If we are comfortable then why change?

It is only when we are uncomfortable enough that we will start to look for ways to regain comfort – physical and psychological.

The second essence of the message is that to change we need to learn something and that means we have to become Students, and to seek the guidance of a Teacher. Someone who understands the problems, their root causes, the solutions, the benefits and most importantly – how to disseminate that knowledge and understanding.  A Teacher that can show us how not just tell us what.

The third essence of the message is that the Students become Teachers themselves as they put into practice what they have learned and prove to themselves that it works, and it is workable.  The new understanding flows along the Optimism-Skepticism gradient until the Tipping Point is reached.  It is then unstoppable and the Paradigm flips. Often remarkably quickly.

The risk is that change means opportunity and there are many who can sniff out an opportunity to cash in on the change chaos. They are the purveyors of Snakeoil – and they prey on the dissatisfied and desperate.

So how does a Student know a True-Teacher from a Snakeoil Salesperson?

Simple – the genuine Teacher will be able to show a portfolio of successes and delighted ex-students; will be able to explain and demonstrate how they were both achieved; will be willing to share their knowledge; and will respectfully decline to teach someone who they feel is not yet ready to learn.

Do Not Give Up Too Soon

clock_hands_spinning_import_150_wht_3149Tangible improvement takes time. Sometimes it takes a long time.

The more fundamental the improvement the more people are affected. The more people involved the greater the psychological inertia. The greater the resistance the longer it takes to show tangible effects.

The advantage of deep-level improvement is that the cumulative benefit is greater – the risk is that the impatient Improvementologist may give up too early – sometimes just before the benefit becomes obvious to all.

The seeds of change need time to germinate and to grow – and not all good ideas will germinate. The green shoots of innovation do not emerge immediately – there is often a long lag and little tangible evidence for a long time.

This inevitable  delay is a source of frustration, and the impatient innovator can unwittingly undo their good work.  By pushing too hard they can drag a failure from the jaws of success.

Q: So how do we avoid this trap?

The trick is to understand the effect of the change on the system.  This means knowing where it falls on our Influence Map that is marked with the Circles of Control, Influence and Concern.

Our Circle of Concern includes all those things that we are aware of that present a threat to our future survival – such as a chunk of high-velocity space rock smashing into the Earth and wiping us all out in a matter of milliseconds. Gulp! Very unlikely but not impossible.

Some concerns are less dramatic – such as global warming – and collectively we may have more influence over changing that. But not individually.

Our Circle of Influence lies between the limit of our individual control and the limit of our collective control. This a broad scope because “collective” can mean two, twenty, two hundred, two thousand, two million, two billion and so on.

Making significant improvements is usually a Circle of Influence challenge and only collectively can we make a difference.  But to deliver improvement at this level we have to influence others to change their knowledge, understanding, attitudes, beliefs and behaviour. That is not easy and that is not quick. It is possible though – with passion, plausibility, persistence, patience – and an effective process.

It is here that we can become impatient and frustrated and are at risk of giving up too soon – and our temperaments influence the risk. Idealists are impatient for fundamental change. Rationals, Guardians and Artisans do not feel the same pain – and it is a rich source of conflict.

So if we need to see tangible results quickly then we have to focus closer to home. We have to work inside our Circle of Individual Influence and inside our Circle of Control.  The scope of individual influence varies from person-to-person but our Circle of Control is the same for all of us: the outer limit is our skin.  We all choose our behaviour and it is that which influences others: for better or for worse.  It is not what we think it is what we do. We cannot read or control each others minds. We can all choose our attitudes and our actions.

So if we want to see tangible improvement quickly then we must limit the scope of our action to our Circle of Individual Influence and get started.  We do what we can and as soon as we can.

Choosing what to do and what not do requires wisdom. That takes time to develop too.


Making an impact outside the limit of our Circle of Individual Influence is more difficult because it requires influencing many other people.

So it is especially rewarding for to see examples of how individual passion, persistence and patience have led to profound collective improvement.  It proves that it is still possible. It provides inspiration and encouragement for others.

One example is the recently published Health Foundation Quality, Cost and Flow Report.

This was a three-year experiment to test if the theory, techniques and tools of Improvement Science work in healthcare: specifically in two large UK acute hospitals – Sheffield and Warwick.

The results showed that Improvement Science does indeed work in healthcare and it worked for tough problems that were believed to be very difficult if not impossible to solve. That is very good news for everyone – patients and practitioners.

But the results have taken some time to appear in published form – so it is really good news to report that the green shoots of improvement are now there for all to see.

The case studies provide hard evidence that win-win-win outcomes are possible and achievable in the NHS.

The Impossibility Hypothesis has been disproved. The cynics can step off the bus. The skeptics have their evidence and can now become adopters.

And the report offers a lot of detail on how to do it including two references that are available here:

  1. A Recipe for Improvement PIE
  2. A Study of Productivity Improvement Tactics using a Two-Stream Production System Model

These references both describe the fundamentals of how to align financial improvement with quality and delivery improvement to achieve the elusive win-win-win outcome.

A previously invisible door has opened to reveal a new Land of Opportunity. A land inhabited by Improvementologists who mark the path to learning and applying this new knowledge and understanding.

There are many who do not know what to do to solve the current crisis in healthcare – they now have a new vista to explore.

Do not give up too soon –  there is a light at the end of the dark tunnel.

And to get there safely and quickly we just need to learn and apply the Foundations of Improvement Science in Healthcare – and we first learn to FISH in our own ponds first.

fish

What is the Temperamenture?

tweet_birdie_flying_between_phones_150_wht_9168Tweet
The sound heralded the arrival of a tweet so Bob looked up from his book and scanned the message. It was from Leslie, one of the Improvement Science apprentices.

It said “If your organisation is feeling poorly then do not forget to measure the Temperamenture. You may have Cultural Change Fever.

Bob was intrigued. This was a novel word and he suspected it was not a spelling error. He know he was being teased. He tapped a reply on his iPad “Interesting word ‘Temperamenture’ – can you expand?” 

Ring Ring
<Bob> Hello, Bob here.

There was laughing on the other end of the line – it was Leslie.

<Leslie> Ho Ho. Hi Bob – I thought that might prick your curiosity if you were on line. I know you like novel words.

<Bob> Ah! You know my weakness – I am at your mercy now!  So, I am consumed with curiosity – as you knew I would be.

<Leslie> OK. No more games. You know that you are always saying that there are three parts to Improvement Science – Processes, People and Systems – and that the three are synergistic so they need to be kept in balance …

<Bob> Yes.

<Leslie> Well, I have discovered a source of antagonism that creates a lot of cultural imbalance and emotional heat in my organisation.

<Bob> OK. So I take from that you mean an imbalance in the People part that then upsets the Process and System parts.

<Leslie> Yes, exactly. In your Improvement Science course you mentioned the theory behind this but did not share any real examples.

<Bob> That is very possible.  Hard evidence and explainable examples are easier for the Process component – the People stuff is more difficult to do that way.  Can you be more specific?  I think I know where you may be going with this.

<Leslie> OK. Where do you feel I am going with it?

<Bob> Ha! The student becomes the teacher. Excellent response! I was thinking something to do with the Four Temperaments.

<Leslie>Yes.  And specifically the conflict that can happen between them.  I am thinking of the tension between the Idealists and the Guardians.

<Bob> Ah!  Yes. The Bile Wars – Yellow and Black. The Cholerics versus the Melancholics. So do you have hard evidence of this happening in reality rather than just my theoretical rhetoric?

<Leslie> Yes!  But the facts do not seem to fit the theory. You know that I work in a hospital. Well one of the most important “engines” of a hospital is the surgical operating suite. Conveniently called the SOS.

<Bob> Yes. It seems to be a frequent source of both Nuggets and Niggles.

<Leslie> Well, I am working with the SOS team at my hospital and I have to say that they are a pretty sceptical bunch.  Everyone seems to have strong opinions.  Strong but different opinions of what should happen and who should do it.  The words someone and should get mentioned a lot.  I have not managed to find this elusive “someone” yet.  The some-one, no-one, every-one, any-one problem.

<Bob> OK. I have heard this before. I hear that surgeons in particular have strong opinions – and they disagree with each other!  I remember watching episodes of “Doctor in the House” many years ago.  What was the name of the irascible chief surgeon played by James Robertson Justice? Sir Lancelot Spratt the archetype consultant surgeon. Are they actually like that?

<Leslie> I have not met any as extreme as Sir Lancelot though some do seem to emulate that role model.  In reality the surgeons, anaesthetists, nurses, ODPs, and managers all seem to believe there is one way that a theatre should be run, their way, and their separate “one ways” do not line up.  Hence the conflict and high emotional temperature.

<Bob> OK, so how does the Temperament dimension relate to this?  Is there a temperament mismatch between the different tribes in the operating suite as the MBTI theory would suggest?

<Leslie> That was my hypothesis and I decided that the only way I could test it was by mapping the temperaments using the Temperament Sorter from the FISH toolbox.

<Bob> Excellent, but you would need quite a big sample to draw any statistically valid conclusions.  How did you achieve that with a group of disparate sceptics?

<Leslie>I know.  So I posed this challenge as a research question – and they were curious enough to give it a try.  Well, the Surgeons and Anaesthetists were anyway.  The Nurses, OPDs and Managers chose to sit on the fence and watch the game.

<Bob>Wow! Now I am really interested. What did you find?

<Leslie>Woah there!  I need to explain how we did it first.  They have a monthly audit meeting where they all get together as separate groups and after I posed the question they decided to do use the Temperament Sorter at one of those meetings.  It was done in a light-hearted way and it was really good fun too.  I brought some cartoons and descriptions of the sixteen MBTI types and they tried to guess who was which type.

<Bob>Excellent.  So what did you find?

<Leslie>We disproved the hypothesis that there was a Temperament mismatch.

<Bob>Really!  What did the data show?

<Leslie> It showed that the Temperament profile for both surgeons and anaesthetists was different from the population average …

<Bob>OK, and …?

<Leslie>… and that there was no statistical difference between surgeons and anaesthetists.

<Bob> Really! So what are they both?

<Leslie> Guardians. The majority of both tribes are SJs.

There was a long pause.  Bob was digesting this juicy new fact.  Leslie knew that if there was one thing that Bob really liked it was having a theory disproved by reality.  Eventually he replied.

<Bob> Clarity of hindsight is a wonderful thing.  It makes complete sense that they are Guardians.  Speaking as a patient, what I want most is Safety and Predictability which is the ideal context for Guardians to deliver their best.  I am sure that neither surgeons nor anaesthetists like “surprises” and I suspect that they both prefer doing things “by the book”.  They are sceptical of new ideas by temperament.

<Leslie> And there is more.

<Bob> Excellent! What?

<Leslie> They are tough-minded Guardians. They are STJs.

<Bob> Of course!  Having the responsibility of “your life in my hands” requires a degree of tough-mindedness and an ability to not get too emotionally hooked.  Sir Lancelot is a classic extrovert tough-minded Guardian!  The Rolls-Royce and the ritual humiliation of ignorant underlings all fits.  Wow!  Well done Leslie.  So what have you done with this new knowledge and deeper understanding?

<Leslie> Ouch! You got me! That is why I sent the Tweet. Now what do I do?

<Bob> Ah! I am not sure.  We are both sailing in uncharted water now so I suggest we explore and learn together.  Let me ponder and do some exploring of the implications of your findings and I will get back to you.  Can you do the same?

<Leslie> Good plan. Shall we share notes in a couple of days?

<Bob> Excellent. I look forward to it.


This is not a completely fictional narrative.

In a recent experiment the Temperament of a group of 66 surgeons and 65 anaesthetists was mapped using a standard Myers-Briggs Type Indicator® tool.  The data showed that the proportion reporting a Guardian (xSxJ) preference was 62% for the surgeons and 59% for the anaesthetists.  The difference was not statistically significant [For the statistically knowledgable the Chi-squared test gave a p-value of 0.84].  The reported proportion of the normal population who have a Guardian temperament is 34% so this is very different from the combined group of operating theatre doctors [Chi-squared test, p<0.0001].  Digging deeper into the data the proportion showing the tough-minded Guardian preference, the xSTJ, was 55% for the Surgeons and 46% for the Anaesthetists which was also not significantly different [p=0.34] but compared with a normal population proportion of 24% there are significantly more tough-minded Guardians in the operating theatre [p<0.0001].

So what then is the difference between Surgeons and Anaesthetists in their preferred modes of thinking?

The data shows that Surgeons are more likely to prefer Extraversion – the ESTJ profile – compared with Anaesthetists – who lean more towards Introversion – the ISTJ profile (p=0.12). This p-value means that with the data available there is a one in eight chance that this difference is due to chance. We would needs a bigger set of data to get greater certainty.

The temperament gradient is enough to create a certain degree of tension because although the Guardian temperament is the same, and the tough-mindedness is the same, the dominant function differs between the ESTJ and the ISTJ types.  As the Surgeons tend to the ESTJ mode, their dominant function is Thinking Judgement. The Anaesthetists tend to perfer ISTJ so their dominant fuction is Sensed Perceiving. This makes a big difference.

And it fits with their chosen roles in the operating theatre. The archetype ESTJ Surgeon is the Supervisor and decides what to do and who does it. The archetype ISTJ Anaesthetist is the Inspector and monitors and maintains safety and stability. This is a sweepig generalisation of course – but a useful one.

The roles are complementary, the minor conflict is inevitable, and the tension is not a “bad” thing – it is healthy – for the patient.  But when external forces threaten the safety, predictability and stability the conflict is amplified.

lightning_strike_150_wht_5809Rather like the weather.

Hot wet air looks clear. Cold dry air looks clear too.  When hot-humid air from the tropics meets cold-crisp air from the poles then a band of of fog will be created.  We call it a weather front and it generates variation.  And if the temperature and humidity difference is excessive then storm clouds will form. The lightning will flash and the thunder will growl as the energy is released.

Clouds obscure clarity of forward vision but clouds also create shade from the sun above; clouds trap warmth beneath; and clouds create rain which is necessary to sustain growth. Clouds are not all bad.  Some cloudiness is necessary.

An Improvement Scientist knows that 100% harmony is not the healthiest ratio. Unchallenged group-think is potentially dangerous.  Zero harmony is also unhealthy.  Open warfare is destructive.  Everyone loses.  A mixture of temperaments, a diversity of perspectives, a bit of fog, and a bit of respectful challenge is healthier than All-or-None.

It is at the complex and dynamic interface between different temperaments that learning and innovation happens so a slight temperamenture gradient is ideal.  The emotometer should not read too cold or too hot.

Understanding this dynamic is a big step towards being able to manage the creative tension.

To explore the Temperamenture Map of your team, department and organisation try the Temperament Sorter tool – one of the Improvement Science cultural diagnostic tests.

The Writing on the Wall – Part II

Who_Is_To_BlameThe retrospectoscope is the favourite instrument of the forensic cynic – the expert in the after-the-event-and-I-told-you-so rhetoric. The rabble-rouser for the lynch-mob.

It feels better to retrospectively nail-to-a-cross the person who committed the Cardinal Error of Omission, and leave them there in emotional and financial pain as a visible lesson to everyone else.

This form of public feedback has been used for centuries.

It is called barbarism, and it has no place in a modern civilised society.


A more constructive question to ask is:

Could the evolving Mid-Staffordshire crisis have been detected earlier … and avoided?”

And this question exposes a tricky problem: it is much more difficult to predict the future than to explain the past.  And if it could have been detected and avoided earlier, then how is that done?  And if the how-is-known then is everyone else in the NHS using this know-how to detect and avoid their own evolving Mid-Staffs crisis?

To illustrate how it is currently done let us use the actual Mid-Staffs data. It is conveniently available in Figure 1 embedded in Figure 5 on Page 360 in Appendix G of Volume 1 of the first Francis Report.  If you do not have it at your fingertips I have put a copy of it below.

MS_RawData

The message does not exactly leap off the page and smack us between the eyes does it? Even with the benefit of hindsight.  So what is the problem here?

The problem is one of ergonomics. Tables of numbers like this are very difficult for most people to interpret, so they create a risk that we ignore the data or that we just jump to the bottom line and miss the real message. And It is very easy to miss the message when we compare the results for the current period with the previous one – a very bad habit that is spread by accountants.

This was a slowly emerging crisis so we need a way of seeing it evolving and the better way to present this data is as a time-series chart.

As we are most interested in safety and outcomes, then we would reasonably look at the outcome we do not want – i.e. mortality.  I think we will all agree that it is an easy enough one to measure.

MS_RawDeathsThis is the raw mortality data from the table above, plotted as a time-series chart.  The green line is the average and the red-lines are a measure of variation-over-time. We can all see that the raw mortality is increasing and the red flags say that this is a statistically significant increase. Oh dear!
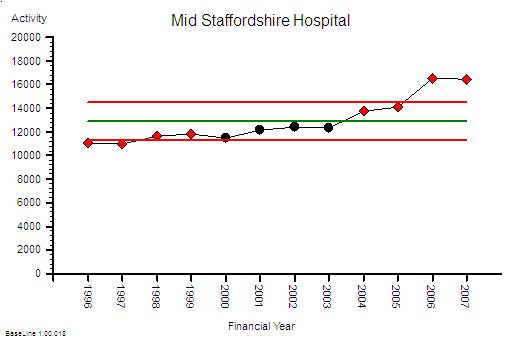
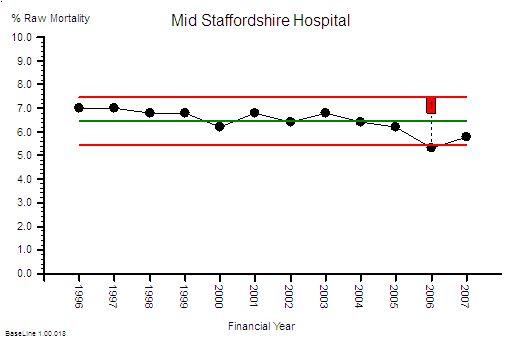
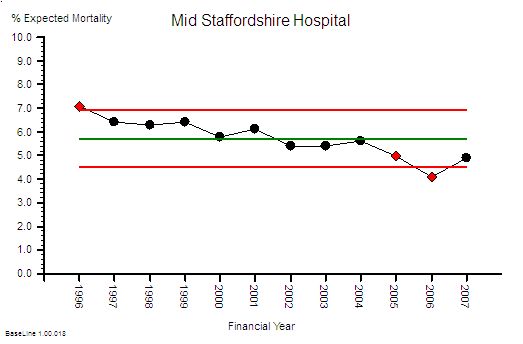
But hang on just a minute – using raw mortality data like this is invalid because we all know that the people are getting older, demand on our hospitals is rising, A&Es are busier, older people have more illnesses, and more of them will not survive their visit to our hospital. This rise in mortality may actually just be because we are doing more work.

Good point! Let us plot the activity data and see if there has been an increase.

MS_Activity

Yes – indeed the activity has increased significantly too.

Told you so! And it looks like the activity has gone up more than the mortality. Does that mean we are actually doing a better job at keeping people alive? That sounds like a more positive message for the Board and the Annual Report. But how do we present that message? What about as a ratio of mortality to activity? That will make it easier to compare ourselves with other hospitals.

Good idea! Here is the Raw Mortality Ratio chart.

MS_RawMortality_RatioAh ha. See! The % mortality is falling significantly over time. Told you so.

Careful. There is an unstated assumption here. The assumption that the case mix is staying the same over time. This pattern could also be the impact of us doing a greater proportion of lower complexity and lower risk work.  So we need to correct this raw mortality data for case mix complexity – and we can do that by using data from all NHS hospitals to give us a frame of reference. Dr Foster can help us with that because it is quite a complicated statistical modelling process. What comes out of Dr Fosters black magic box is the Global Hospital Raw Mortality (GHRM) which is the expected number of deaths for our case mix if we were an ‘average’ NHS hospital.

MS_ExpectedMortality_Ratio

What this says is that the NHS-wide raw mortality risk appears to be falling over time (which may be for a wide variety of reasons but that is outside the scope of this conversation). So what we now need to do is compare this global raw mortality risk with our local raw mortality risk  … to give the Hospital Standardised Mortality Ratio.

MS_HSMRThis gives us the Mid Staffordshire Hospital HSMR chart.  The blue line at 100 is the reference average – and what this chart says is that Mid Staffordshire hospital had a consistently higher risk than the average case-mix adjusted mortality risk for the whole NHS. And it says that it got even worse after 2001 and that it stayed consistently 20% higher after 2003.

Ah! Oh dear! That is not such a positive message for the Board and the Annual Report. But how did we miss this evolving safety catastrophe?  We had the Dr Foster data from 2001

This is not a new problem – a similar thing happened in Vienna between 1820 and 1850 with maternal deaths caused by Childbed Fever. The problem was detected by Dr Ignaz Semmelweis who also discovered a simple, pragmatic solution to the problem: hand washing.  He blew the whistle but unfortunately those in power did not like the implication that they had been the cause of thousands of avoidable mother and baby deaths.  Semmelweis was vilified and ignored, and he did not publish his data until 1861. And even then the story was buried in tables of numbers.  Semmelweis went mad trying to convince the World that there was a problem.  Here is the full story.

Also, time-series charts were not invented until 1924 – and it was not in healthcare – it was in manufacturing. These tried-and-tested safety and quality improvement tools are only slowly diffusing into healthcare because the barriers to innovation appear somewhat impervious.

And the pores have been clogged even more by the social poison called “cynicide” – the emotional and political toxin exuded by cynics.

So how could we detect a developing crisis earlier – in time to avoid a catastrophe?

The first step is to estimate the excess-death-equivalent. Dr Foster does this for you.MS_ExcessDeathsHere is the data from the table plotted as a time-series chart that shows that the estimated-excess-death-equivalent per year. It has an average of 100 (that is two per week) and the average should be close to zero. More worryingly the number was increasing steadily over time up to 200 per year in 2006 – that is about four excess deaths per week – on average.  It is important to remember that HSMR is a risk ratio and mortality is a multi-factorial outcome. So the excess-death-equivalent estimate does not imply that a clear causal chain will be evident in specific deaths. That is a complete misunderstanding of the method.

I am sorry – you are losing me with the statistical jargon here. Can you explain in plain English what you mean?

OK. Let us use an example.

Suppose we set up a tombola at the village fete and we sell 50 tickets with the expectation that the winner bags all the money. Each ticket holder has the same 1 in 50 risk of winning the wad-of-wonga and a 49 in 50 risk of losing their small stake. At the appointed time we spin the barrel to mix up the ticket stubs then we blindly draw one ticket out. At that instant the 50 people with an equal risk changes to one winner and 49 losers. It is as if the grey fog of risk instantly condenses into a precise, black-and-white, yes-or-no, winner-or-loser, reality.

Translating this concept back into HSMR and Mid Staffs – the estimated 1200 deaths are the just the “condensed risk of harm equivalent”.  So, to then conduct a retrospective case note analysis of specific deaths looking for the specific cause would be equivalent to trying to retrospectively work out the reason the particular winning ticket in the tombola was picked out. It is a search that is doomed to fail. To then conclude from this fruitless search that HSMR is invalid, is only to compound the delusion further.  The actual problem here is ignorance and misunderstanding of the basic Laws of Physics and Probability, because our brains are not good at solving these sort of problems.

But Mid Staffs is a particularly severe example and  it only shows up after years of data has accumulated. How would a hospital that was not as bad as this know they had a risk problem and know sooner? Waiting for years to accumulate enough data to prove there was a avoidable problem in the past is not much help. 

That is an excellent question. This type of time-series chart is not very sensitive to small changes when the data is noisy and sparse – such as when you plot the data on a month-by-month timescale and avoidable deaths are actually an uncommon outcome. Plotting the annual sum smooths out this variation and makes the trend easier to see, but it delays the diagnosis further. One way to increase the sensitivity is to plot the data as a cusum (cumulative sum) chart – which is conspicuous by its absence from the data table. It is the running total of the estimated excess deaths. Rather like the running total of swings in a game of golf.

MS_ExcessDeaths_CUSUMThis is the cusum chart of excess deaths and you will notice that it is not plotted with control limits. That is because it is invalid to use standard control limits for cumulative data.  The important feature of the cusum chart is the slope and the deviation from zero. What is usually done is an alert threshold is plotted on the cusum chart and if the measured cusum crosses this alert-line then the alarm bell should go off – and the search then focuses on the precursor events: the Near Misses, the Not Agains and the Niggles.

I see. You make it look easy when the data is presented as pictures. But aren’t we still missing the point? Isn’t this still after-the-avoidable-event analysis?

Yes! An avoidable death should be a Never-Event in a designed-to-be-safe healthcare system. It should never happen. There should be no coffins to count. To get to that stage we need to apply exactly the same approach to the Near-Misses, and then the Not-Agains, and eventually the Niggles.

You mean we have to use the SUI data and the IR1 data and the complaint data to do this – and also ask our staff and patients about their Niggles?

Yes. And it is not the number of complaints that is the most useful metric – it is the appearance of the cumulative sum of the complaint severity score. And we need a method for diagnosing and treating the cause of the Niggles too. We need to convert the feedback information into effective action.

Ah ha! Now I understand what the role of the Governance Department is: to apply the tools and techniques of Improvement Science proactively.  But our Governance Department have not been trained to do this!

Then that is one place to start – and their role needs to evolve from Inspectors and Supervisors to Demonstrators and Educators – ultimately everyone in the organisation needs to be a competent Healthcare Improvementologist.

OK – I now now what to do next. But wait a minute. This is going to cost a fortune!

This is just one small first step.  The next step is to redesign the processes so the errors do not happen in the first place. The cumulative cost saving from eliminating the repeated checking, correcting, box-ticking, documenting, investigating, compensating and insuring is much much more than the one-off investment in learning safe system design.

So the Finance Director should be a champion for safety and quality too.

Yup!

Brill. Thanks. And can I ask one more question? I do not want to appear to skeptical but how do we know we can trust that this risk-estimation system has been designed and implemented correctly? How do we know we are not being bamboozled by statisticians? It has happened before!

That is the best question yet.  It is important to remember that HSMR is counting deaths in hospital which means that it is not actually the risk of harm to the patient that is measured – it is the risk to the reputation of hospital! So the answer to your question is that you demonstrate your deep understanding of the rationle and method of risk-of-harm estimation by listing all the ways that such a system could be deliberately “gamed” to make the figures look better for the hospital. And then go out and look for hard evidence of all the “games” that you can invent. It is a sort of creative poacher-becomes-gamekeeper detective exercise.

OK – I sort of get what you mean. Can you give me some examples?

Yes. The HSMR method is based on deaths-in-hospital so discharging a patient from hospital before they die will make the figures look better. Suppose one hospital has more access to end-of-life care in the community than another: their HSMR figures would look better even though exactly the same number of people died. Another is that the HSMR method is weighted towards admissions classified as “emergencies” – so if a hospital admits more patients as “emergencies” who are not actually very sick and discharges them quickly then this will inflated their estimated deaths and make their actual mortality ratio look better – even though the risk-of-harm to patients has not changed.

OMG – so if we have pressure to meet 4 hour A&E targets and we get paid more for an emergency admission than an A&E attendance then admitting to an Assessmen Area and discharging within one day will actually reward the hospital financially, operationally and by apparently reducing their HSMR even though there has been no difference at all to the care that patients actually recieve?

Yes. It is an inevitable outcome of the current system design.

But that means that if I am gaming the system and my HSMR is not getting better then the risk-of-harm to patients is actually increasing and my HSMR system is giving me false reassurance that everything is OK.   Wow! I can see why some people might not want that realisation to be public knowledge. So what do we do?

Design the system so that the rewards are aligned with lower risk of harm to patients and improved outcomes.

Is that possible?

Yes. It is called a Win-Win-Win design.

How do we learn how to do that?

Improvement Science.

Footnote I:

The graphs tell a story but they may not create a useful sense of perspective. It has been said that there is a 1 in 300 chance that if you go to hospital you will not leave alive for avoidable causes. What! It cannot be as high as 1 in 300 surely?

OK – let us use the published Mid-Staffs data to test this hypothesis. Over 12 years there were about 150,000 admissions and an estimated 1,200 excess deaths (if all the risk were concentrated into the excess deaths which is not what actually happens). That means a 1 in 130 odds of an avoidable death for every admission! That is twice as bad as the estimated average.

The Mid Staffordshire statistics are bad enough; but the NHS-as-a-whole statistics are cumulatively worse because there are 100’s of other hospitals that are each generating not-as-obvious avoidable mortality. The data is very ‘noisy’ so it is difficult even for a statistical expert to separate the message from the morass.

And remember – that  the “expected” mortality is estimated from the average for the whole NHS – which means that if this average is higher than it could be then there is a statistical bias and we are being falsely reassured by being ‘not statistically significantly different’ from the pack.

And remember too – for every patient and family that suffers and avoidable death there are many more that have to live with the consequences of avoidable but non-fatal harm.  That is called avoidable morbidity.  This is what the risk really means – everyone has a higher risk of some degree of avoidable harm. Psychological and physical harm.

This challenge is not just about preventing another Mid Staffs – it is about preventing 1000’s of avoidable deaths and 100,000s of patients avoidably harmed every year in ‘average’ NHS trusts.

It is not a mass conspiracy of bad nurses, bad doctors, bad managers or bad policians that is the root cause.

It is poorly designed processes – and they are poorly designed because the nurses, doctors and managers have not learned how to design better ones.  And we do not know how because we were not trained to.  And that education gap was an accident – an unintended error of omission.  

Our urgently-improve-NHS-safety-challenge requires a system-wide safety-by-design educational and cultural transformation.

And that is possible because the knowledge of how to design, test and implement inherently safe processes exists. But it exists outside healthcare.

And that safety-by-design training is a worthwhile investment because safer-by-design processes cost less to run because they require less checking, less documenting, less correcting – and all the valuable nurse, doctor and manager time freed up by that can be reinvested in more care, better care and designing even better processes and systems.

Everyone Wins – except the cynics who have a choice: to eat humble pie or leave.

Footnote II:

In the debate that has followed the publication of the Francis Report a lot of scrutiny has been applied to the method by which an estimated excess mortality number is created and it is necessary to explore this in a bit more detail.

The HSMR is an estimate of relative risk – it does not say that a set of specific patients were the ones who came to harm and the rest were OK. So looking at individual deaths and looking for the specific causes is to completely misunderstand the method. So looking at the actual deaths individually and looking for identifiable cause-and-effect paths is an misuse of the message.  When very few if any are found to conclude that HSMR is flawed is an error of logic and exposes the ignorance of the analyst further.

HSMR is not perfect though – it has weaknesses.  It is a benchmarking process the”standard” of 100 is always moving because the collective goal posts are moving – the reference is always changing . HSMR is estimated using data submitted by hospitals themselves – the clinical coding data.  So the main weakness is that it is dependent on the quality of the clinicial coding – the errors of comission (wrong codes) and the errors of omission (missing codes). Garbage In Garbage Out.

Hospitals use clinically coded data for other reasons – payment. The way hospitals are now paid is based on the volume and complexity of that activity – Payment By Results (PbR) – using what are called Health Resource Groups (HRGs). This is a better and fairer design because hospitals with more complex (i.e. costly to manage) case loads get paid more per patient on average.  The HRG for each patient is determined by their clinical codes – including what are called the comorbidities – the other things that the patient has wrong with them. More comorbidites means more complex and more risky so more money and more risk of death – roughly speaking.  So when PbR came in it becamevery important to code fully in order to get paid “properly”.  The problem was that before PbR the coding errors went largely unnoticed – especially the comorbidity coding. And the errors were biassed – it is more likely to omit a code than to have an incorrect code. Errors of omission are harder to detect. This meant that by more complete coding (to attract more money) the estimated casemix complexity would have gone up compared with the historical reference. So as actual (not estimated) NHS mortality has gone down slightly then the HSMR yardstick becomes even more distorted.  Hospitals that did not keep up with the Coding Game would look worse even though  their actual risk and mortality may be unchanged.  This is the fundamental design flaw in all types of  benchmarking based on self-reported data.

The actual problem here is even more serious. PbR is actually a payment for activity – not a payment for outcomes. It is calculated from what it cost to run the average NHS hospital using a technique called Reference Costing which is the same method that manufacturing companies used to decide what price to charge for their products. It has another name – Absorption Costing.  The highest performers in the manufacturing world no longer use this out-of-date method. The implication of using Reference Costing and PbR in the NHS are profound and dangerous:

If NHS hospitals in general have poorly designed processes that create internal queues and require more bed days than actually necessary then the cost of that “waste” becomes built into the future PbR tariff. This means average length of stay (LOS) is financially rewarded. Above average LOS is financially penalised and below average LOS makes a profit.  There is no financial pressure to improve beyound average. This is called the Regression to the Mean effect.  Also LOS is not a measure of quality – so there is a to shorten length of stay for purely financial reasons – to generate a surplus to use to fund growth and capital investment.  That pressure is non-specific and indiscrimiate.  PbR is necessary but it is not sufficient – it requires an quality of outcome metric to complete it.    

So the PbR system is based on an out-of-date cost-allocation model and therefore leads to the very problems that are contributing to the MidStaffs crisis – financial pressure causing quality failures and increased risk of mortality.  MidStaffs may be a chance victim of a combination of factors coming together like a perfect storm – but those same factors are present throughout the NHS because they are built into the current design.

One solution is to move towards a more up-to-date financial model called stream costing. This uses the similar data to reference costing but it estimates the “ideal” cost of the “necessary” work to achieve the intended outcome. This stream cost becomes the focus for improvement – the streams where there is the biggest gap between the stream cost and the reference cost are the focus of the redesign activity. Very often the root cause is just poor operational policy design; sometimes it is quality and safety design problems. Both are solvable without investment in extra capacity. The result is a higher quality, quicker, lower-cost stream. Win-win-win. And in the short term that  is rewarded by a tariff income that exceeds cost and a lower HSMR.

Radically redesigning the financial model for healthcare is not a quick fix – and it requires a lot of other changes to happen first. So the sooner we start the sooner we will arrive. 

Robert Francis QC

press_on_screen_anim_150_wht_7028Today is an important day.

The Robert Francis QC Report and recommendations from the Mid-Staffordshire Hospital Crisis has been published – and it is a sobering read.  The emotions that just the executive summary evoked in me were sadness, shame and anger.  Sadness for the patients, relatives, and staff who have been irreversibly damaged; shame that the clinical professionals turned a blind-eye; and anger that the root cause has still not been exposed to public scrutiny.

Click here to get a copy of the RFQC Report Executive Summary.

Click here to see the video of RFQC describing his findings. 

The root cause is ignorance at all levels of the NHS.  Not stupidity. Not malevolence. Just ignorance.

Ignorance of what is possible and ignorance of how to achieve it.

RFQC rightly focusses his recommendations on putting patients at the centre of healthcare and on making those paid to deliver care accountable for the outcomes.  Disappointingly, the report is notably thin on the financial dimension other than saying that financial targets took priority over safety and quality.  He is correct. They did. But the report does not say that this is unnecessary – it just says “in future put safety before finance” and in so doing he does not challenge the belief that we are playing a zero-sum-game. The  assumotion that higher-quality-always-costs-more.

This assumption is wrong and can easily be disproved.

A system that has been designed to deliver safety-and-quality-on-time-first-time-and-every-time costs less. And it costs less because the cost of errors, checking, rework, queues, investigation, compensation, inspectors, correctors, fixers, chasers, and all the other expensive-high-level-hot-air-generation-machinery that overburdens the NHS and that RFQC has pointed squarely at is unnecessary.  He says “simplify” which is a step in the right direction. The goal is to render it irrelevent.

The ignorance is ignorance of how to design a healthcare system that works right-first-time. The fact that the Francis Report even exists and is pointing its uncomfortable fingers-of-evidence at every level of the NHS from ward to government is tangible proof of this collective ignorance of system design.

And the good news is that this collective ignorance is also unnecessary … because the knowledge of how to design safe-and-affordable systems already exists. We just have to learn how. I call it 6M Design® – but  the label is irrelevent – the knowledge exists and the evidence that it works exists.

So here are some of the RFQC recommendations viewed though a 6M Design® lens:       

1.131 Compliance with the fundamental standards should be policed by reference to developing the CQC’s outcomes into a specification of indicators and metrics by which it intends to monitor compliance. These indicators should, where possible, be produced by the National Institute for Health and Clinical Excellence (NICE) in the form of evidence-based procedures and practice which provide a practical means of compliance and of measuring compliance with fundamental standards.

This is the safety-and-quality outcome specification for a healthcare system design – the required outcome presented as a relevent metric in time-series format and qualified by context.  Only a stable outcome can be compared with a reference standard to assess the system capability. An unstable outcome metric requires inquiry to understand the root cause and an appropriate action to restore stability. A stable but incapable outcome performance requires redesign to achieve both stability and capability. And if  the terms used above are unfamiliar then that is further evidence of system-design-ignorance.   
 
1.132 The procedures and metrics produced by NICE should include evidence-based tools for establishing the staffing needs of each service. These measures need to be readily understood and accepted by the public and healthcare professionals.

This is the capacity-and-cost specification of any healthcare system design – the financial envelope within which the system must operate. The system capacity design works backwards from this constraint in the manner of “We have this much resource – what design of our system is capable of delivering the required safety and quality outcome with this capacity?”  The essence of this challenge is to identify the components of poor (i.e. wasteful) design in the existing systems and remove or replace them with less wasteful designs that achieve the same or better quality outcomes. This is not impossible but it does require system diagnostic and design capability. If the NHS had enough of those skills then the Francis Report would not exist.

1.133 Adoption of these practices, or at least their equivalent, is likely to help ensure patients’ safety. Where NICE is unable to produce relevant procedures, metrics or guidance, assistance could be sought and commissioned from the Royal Colleges or other third-party organisations, as felt appropriate by the CQC, in establishing these procedures and practices to assist compliance with the fundamental standards.

How to implement evidence-based research in the messy real world is the Elephant in the Room. It is possible but it requires techniques and tools that fall outside the traditional research and audit framework – or rather that sit between research and audit. This is where Improvement Science sits. The fact that the Report only mentions evidence-based practice and audit implies that the NHS is still ignorant of this gap and what fills it – and so it appears is RFQC.   

1.136 Information needs to be used effectively by regulators and other stakeholders in the system wherever possible by use of shared databases. Regulators should ensure that they use the valuable information contained in complaints and many other sources. The CQC’s quality risk profile is a valuable tool, but it is not a substitute for active regulatory oversight by inspectors, and is not intended to be.

Databases store data. Sharing databases will share data. Data is not information. Information requires data and the context for that data.  Furthermore having been informed does not imply either knowledge or understanding. So in addition to sharing information, the capability to convert information-into-decision is also required. And the decisions we want are called “wise decisions” which are those that result in actions and inactions that lead inevitably to the intended outcome.  The knowledge of how to do this exists but the NHS seems ignorant of it. So the challenge is one of education not of yet more investigation.

1.137 Inspection should remain the central method for monitoring compliance with fundamental standards. A specialist cadre of hospital inspectors should be established, and consideration needs to be given to collaborative inspections with other agencies and a greater exploitation of peer review techniques.

This is audit. This is the sixth stage of a 6M Design® – the Maintain step.  Inspectors need to know what they are looking for, the errors of commission and the errors of omission;  and to know what those errors imply and what to do to identify and correct the root cause of these errors when discovered. The first cadre of inspectors will need to be fully trained in healthcare systems design and healthcare systems improvement – in short – they need to be Healthcare Improvementologists. And they too will need to be subject to the same framework of accreditation, and accountability as those who work in the system they are inspecting.  This will be one of the greatest of the challenges. The fact that the Francis report exists implies that we do not have such a cadre. Who will train, accredit and inspect the inspectors? Who has proven themselves competent in reality (not rhetorically)?

1.163 Responsibility for driving improvement in the quality of service should therefore rest with the commissioners through their commissioning arrangements. Commissioners should promote improvement by requiring compliance with enhanced standards that demand more of the provider than the fundamental standards.

This means that commissioners will need to understand what improvement requires and to include that expectation in their commissioning contracts. This challenge is even geater that the creation of a “cadre of inspectors”. What is required is a “generation of competent commissioners” who are also experienced and who have demonstrated competence in healthcare system design. The Commissioners-of-the-Future will need to be experienced healthcare improvementologists.

The NHS is sick – very sick. The medicine it needs to restore its health and vitality does exist – and it will not taste very nice – but to withold an effective treatment for an serious illness on that basis is clinical negligence.

It is time for the NHS to look in the mirror and take the strong medicine. The effect is quick – it will start to feel better almost immediately. 

To deliver safety and quality and quickly and affordably is possible – and if you do not believe that then you will need to muster the humility to ask to have the how demonstrated.

6MDesign


Kicking the Habit

no_smoking_400_wht_6805It is not easy to kick a habit. We all know that. And for some reason the ‘bad’ habits are harder to kick than the ‘good’ ones. So what is bad about a ‘bad habit’ and why is it harder to give up? Surely if it was really bad it would be easier to give up?

Improvement is all about giving up old ‘bad’ habits and replacing them with new ‘good’ habits – ones that will sustain the improvement. But there is an invisible barrier that resists us changing any habit – good or bad. And it is that barrier to habit-breaking that we need to understand to succeed. Luck is not a reliable ally.

What does that habit-breaking barrier look like?

The problem is that it is invisible – or rather it is emotional – or to be precise it is chemical.

Our emotions are the output of a fantastically complex chemical system – our brains. And influencing the chemical balance of our brains can have a profound effect on our emotions.  That is how anti-depressants work – they very slightly adjust the chemical balance of every part of our brains. The cumulative effect is that we feel happier.  Nicotine has a similar effect.

And we can achieve the same effect without resorting to drugs or fags – and we can do that by consciously practising some new mental habits until they become ingrained and unconscious. We literally overwrite the old mental habit.

So how do we do this?

First we need to make the mental barrier visible – and then we can focus our attention on eroding it. To do that we need to remove the psychological filter that we all use to exclude our emotions. It is rather like taking off our psychological sunglasses.

When we do that the invisible barrier jumps into view: illuminated by the glare of three negative emotions.  Sadness, fear, and anxiety.  So whenever we feel any of these we know there is a barrier to improvement hiding  the emotional smoke. This is the first stage: tune in to our emotions.

The next step is counter-intuitive. Instead of running away from the negative feeling we consciously flip into a different way of thinking.  We actively engage with our negative feelings – and in a very specific way. We engage in a detached, unemotional, logical, rational, analytical  ‘What caused that negative feeling?’ way.

We then focus on the causes of the negative emotions. And when we have the root causes of our Niggles we design around them, under them, and over them.  We literally design them out of our heads.

The effect is like magic.

And this week I witnessed a real example of this principle in action.

figure_pressing_power_button_150_wht_10080One team I am working with experienced the Power of Improvementology. They saw the effect with their own eyes.  There were no computers in the way, no delays, no distortion and no deletion of data to cloud the issue. They saw the performance of their process jump dramatically – from a success rate of 60% to 96%!  And not just the first day, the second day too.  “Surprised and delighted” sums up their reaction.

So how did we achieve this miracle?

We just looked at the process through a different lens – one not clouded and misshapen by old assumptions and blackened by ignorance of what is possible.  We used the 6M Design® lens – and with the clarity of insight it brings the barriers to improvement became obvious. And they were dissolved. In seconds.

Success then flowed as the Dam of Disbelief crumbled and was washed away.

figure_check_mark_celebrate_anim_150_wht_3617The chaos has gone. The interruptions have gone. The expediting has gone. The firefighting has gone. The complaining has gone.  These chronic Niggles have have been replaced by the Nuggets of calm efficiency, new hope and visible excitement.

And we know that others have noticed the knock-on effect because we got an email from our senior executive that said simply “No one has moaned about TTOs for two days … something has changed.”    

That is Improvementology-in-Action.


A Ray Of Hope

stick_figure_shovel_snow_anim_150_wht_9579It does not seem to take much to bring a real system to an almost standstill.  Six inches of snow falling between 10 AM and 2 PM in a Friday in January seems to be enough!

It was not so much the amount of snow – it was the timing.  The decision to close many schools was not made until after the pupils had arrived – and it created a logistical nightmare for parents. 

Many people suddenly needed to get home before they expected which created an early rush hour and gridlocked the road system.

The same number of people travelled the same distance in the same way as they would normally – it just took them a lot longer.  And the queues created more problems as people tried to find work-arounds to bypass the traffic jams.

How many thousands of hours of life-time was wasted sitting in near-stationary queues of cars? How many millions of poundsworth of productivity was lost? How much will the catchup cost? 

And yet while we grumble we shrug our shoulders and say “It is just one of those things. We cannot control the weather. We just have to grin and bear it.”  

Actually we do not have to. And we do not need a weather machine to control the weather. Mother Nature is what it is.

Exactly the same behaviour happens in many systems – and our conclusion is the same.  We assume the chaos and queues are inevitable.

They are not.

They are symptoms of the system design – and specifically they are the inevitable outcomes of the time-design.

But it is tricky to visualise the time-design of a system.  We can see the manifestations of the poor time-design, the queues and chaos, but we do not so easily perceive the causes. So the poor time-design persists. We are not completely useless though; there are lots of obvious things we can do. We can devise ingenious ways to manage the queues; we can build warehouses to hold the queues; we can track the jobs in the queues using sophisticated and expensive information technology; we can identify the hot spots; we can recruit and deploy expediters, problem-solvers and fire-fighters to facilitate the flow through the hottest of them; and we can pump capacity and money into defences, drains and dramatics. And our efforts seem to work so we congratulate ourselves and conclude that these actions are the only ones that work.  And we keep clamouring for more and more resources. More capacity, MORE capacity, MORE CAPACITY.

Until we run out of money!

And then we have to stop asking for more. And then we start rationing. And then we start cost-cutting. And then the chaos and queues get worse. 

And all the time we are not aware that our initial assumptions were wrong.

The chaos and queues are not inevitable. They are a sign of the time-design of our system. So we do have other options.  We can improve the time-design of our system. We do not need to change the safety-design; nor the quality-design; nor the money-design.  Just improving the time-design will be enough. For now.

So the $64,000,000 question is “How?”

Before we explore that we need to demonstrate What is possible. How big is the prize?

The class of system design problem that cause particular angst are called mixed-priority mixed-complexity crossed-stream designs.  We encounter dozens of them in our daily life and we are not aware of it.  One of particular interest to many is called a hospital. The mixed-priority dimension is the need to manage some patients as emergencies, some as urgent and some as routine. The mixed-complexity dimension is that some patients are easy and some are complex. The crossed-stream dimension is the aggregation of specialised resources into departments. Expensive equipment and specific expertise.  We then attempt to push patients with different priorites long different paths through these different departments . And it is a management nightmare! 

BlueprintOur usual and “obvious” response to this challenge is called a carve-out design. And that means we chop up our available resource capacity into chunks.  And we do that in two ways: chunks of time and chunks of space.  We try to simplify the problem by dissecting it into bits that we can understand. We separate the emergency departments from the  planned-care facilities. We separate outpatients from inpatients. We separate medicine from surgery – and we then intellectually dissect our patients into organ systems: brains, lungs, hearts, guts, bones, skin, and so on – and we create separate departments for each one. Neurology, Respiratory, Cardiology, Gastroenterology, Orthopaedics, Dermatology to list just a few. And then we become locked into the carve-out design silos like prisoners in cages of our own making.

And so it is within the departments that are sub-systems of the bigger system. Simplification, dissection and separation. Ad absurdam.

The major drawback with our carve-up design strategy is that it actually makes the system more complicated.  The number of necessary links between the separate parts grows exponentially.  And each link can hold a small queue of waiting tasks – just as each side road can hold a queue of waiting cars. The collective complexity is incomprehensible. The cumulative queue is enormous. The opportunity for confusion and error grows exponentially. Safety and quality fall and cost rises. Carve-out is an inferior time-design.

But our goal is correct: we do need to simplify the system so that means simplifying the time-design.

To illustrate the potential of this ‘simplify the time-design’ approach we need a real example.

One way to do this is to create a real system with lots of carve-out time-design built into it and then we can observe how it behaves – in reality. A carefully designed Table Top Game is one way to do this – one where the players have defined Roles and by following the Rules they collectively create a real system that we can map, measure and modify. With our Table Top Team trained and ready to go we then pump realistic tasks into our realistic system and measure how long they take in reality to appear out of the other side. And we then use the real data to plot some real time-series charts. Not theoretical general ones – real specific ones. And then we use the actual charts to diagnose the actual causes of the actual queues and actual chaos.

TimeDesign_BeforeThis is the time-series chart of a real Time-Design Game that has been designed using an actual hospital department and real observation data.  Which department it was is not of importance because it could have been one of many. Carve-out is everywhere.

During one run of the Game the Team processed 186 tasks and the chart shows how long each task took from arriving to leaving (the game was designed to do the work in seconds when in the real department it took minutes – and this was done so that one working day could be condensed from 8 hours into 8 minutes!)

There was a mix of priority: some tasks were more urgent than others. There was a mix of complexity: some tasks required more steps that others. The paths crossed at separate steps where different people did defined work using different skills and special equipment.  There were handoffs between all of the steps on all of the streams. There were  lots of links. There were many queues. There were ample opportunities for confusion and errors.

But the design of the real process was such that the work was delivered to a high quality – there were very few output errors. The yield was very high. The design was effective. The resources required to achieve this quality were represented by the hours of people-time availability – the capacity. The cost. And the work was stressful, chaotic, pressured, and important – so it got done. Everyone was busy. Everyone pulled together. They helped each other out. They were not idle. They were a good team. The design was efficient.

The thin blue line on the time-series chart is the “time target” set by the Organisation.  But the effective and efficient system design only achieved it 77% of the time.  So the “obvious” solution was to clamour for more people and for more space and for more equipment so that the work can be done more quickly to deliver more jobs on-time.  Unfortunately the Rules of the Time-Design Game do not allow this more-money option. There is no more money.

To succeed at the Time-Design Game the team must find a way to improve their delivery time performance with the capacity they have and also to deliver the same quality.  But this is impossible! If it were possible then the solution would be obvious and they would be doing it already. No one can succeed on the Time-Design Game. 

Wrong. It is possible.  And the assumption that the solution is obvious is incorrect. The solution is not obvious – at least to the untrained eye.

To the trained eye the time-series chart shows the characteristic signals of a carve-out time-design. The high task-to-task variation is highly suggestive as is the pattern of some of the earlier arrivals having a longer lead time. An experienced system designer can diagnose a carve-out time-design from a set of time-series charts of a process just as a doctor can diagnose the disease from the vital signs chart for a patient.  And when the diagnosis is confirmed with a verification test then the time-Redesign phase can start. 

TimeDesign_AfterPhase1This chart shows what happened after the time-design of the system was changed – after some of the carve-out design was modified. The Y-axis scale is the same as before – and the delivery time improvement is dramatic. The Time-ReDesigned system is now delivering 98% achievement of the “on time target”.

The important thing to be aware of is that exactly the same work was done, using exactly the same steps, and exactly the same resources. No one had to be retrained, released or recruited.  The quality was not impaired. And the cost was actually less because less overtime was needed to mop up the spillover of work at the end of the day.

And the Time-ReDesigned system feels better to work in. It is not chaotic; flow is much smoother; and it is busy yet relaxed and even fun.  The same activity is achieved by the same people doing the same work in the same sequence. Only the Time-Design has changed. A change that delivered a win for the workers!

What was the impact of this cost-saving improvement on the customers of this service? They can now be 98% confident that they will get their task completed correctly in less than 120 minutes.  Before the Time-Redesign the 98% confidence limit was 470 minutes! So this is a win for the customers too!

And the Time-ReDesigned system is less expensive so it is a win for whoever is paying.

Same safety and quality, quicker with less variation, and at lower cost. Win-Win-Win.

And the usual reaction to playing the Time-ReDesign Game is incredulous disbelief.  Some describe it as a “light bulb” moment when they see how the diagnosis of the carve-out time-design is made and and how the Time-ReDesign is done. They say “If I had not seen it with my own eyes I would not have believed it.” And they say “The solutions are simple but not obvious!” And they say “I wish I had learned this years ago!”  And thay apologise for being so skeptical before.

And there are those who are too complacent, too careful or too cynical to play the Time-ReDesign Game (which is about 80% of people actually) – and who deny themselves the opportunity of a win-win-win outcome. And that is their choice. They can continue to grin and bear it – for a while longer.     

And for the 20% who want to learn how to do Time ReDesign for real in their actual systems there is now a Ray Of Hope.

And the Ray of Hope is illuminating a signpost on which is written “This Way to Improvementology“. 

The Management of Victimosis

erasable_sad_face_150_wht_6089One of the commonest psycho-socio-economic diseases is Victimosis.

This disease has a characteristic set of symptoms and signs. The symptoms are easy to detect – and the easiest way is to close your eyes and listen to the language being used. There is a characteristic vocabulary.  ‘Yes but’ is common as is ‘If only’ and ‘They should’ and ‘Not my’ and ‘Too busy’.  Hearing these phrases used frequently is good evidence that the subject is suffering from Victimosis.

Everyone suffers from Acute Victimosis occasionally, especially if they are tired and suffer a series of emotional set backs.  With the support of relatives and friends our psychoimmune system is able to combat the cause and return us to healthy normality. We are normally able to heal our emotional wounds.

Unfortunately Victimosis is an infectious and highly contagious condition and with a large enough innoculum it can spread until almost everyone in the organisation is affected to some degree.  When this happens the Victimosis behaviour can become the norm and awareness of the symptoms slips from consciousness. Victimosis then becomes the unspoken dominant culture and the transition to the Chronic Victimosis phase is complete.

dna_magnifying_glass_150_wht_8959Research has shown that Victimosis is an acquired disease linked to a transmissable meme that is picked up early in life. The meme can be transmitted person-to-person and also through mass communication systems which then leads to rapid dissemination. Typical channels are newspapers, television, the internet and now social media.  Just sample the daily news and observe how much Victimosis language is in circulation.

Those more susceptible to infection can develop into chronic carriers who constantly infect and reinfect others.  The outward mainfestations of the chronic form are incessant complaining, criticising, irrational decisions, ineffective actions, blaming and eventually depression, hopelessness and terminal despair.  The chronically infected may aggregate into like-minded groups as a safety-in-numbers reflex response.  These groups are characterised  by having a high proportion of people with the same temperament; particularly the Guardian preference (the Supervisors, Inspectors, Providers and Protectors who make up two thirds of the population).

Those able to resist infection find the context and culture toxic and they take action. They leave.

The outward manifestations of Chronic Victimosis are GroupThink and Silosis.  GroupThink is where collectives start to behave as one and their group-rhetoric becomes progressively less varied and more dogmatic. Silosis is a form of organisational tribalism where Departments become separated from each other, conceptually, emotionally, physically and financially. Both natural reactions only aggravate the condition and accelerate the decline.

patient_stumbling_with_bandages_150_wht_6861One of the effects of the Victimosis-meme is Agnostic Hyper-Reactivity. This is where both the Individuals and their Silos develop a thick emotional protective membrane that distorts their perception.  It is not that they do not sense what is happening – it is that they do not perceive it or that they perceive it in a distorted way.  This is the Agnosia part – literally ‘not knowing’.

Unfortunately being ignorant of Reality does not help and eventually the pressure of Reality builds up and punches a hole through the emotional barrier.  Something exceptionally bad happens that cannot be discounted or ignored. This is the ‘crisis‘ stage and it elicits a characteristic reflex reaction. An emotional knee-jerk. Unfortunately the reflex is an over-reaction and is poorly focussed and badly coordinated – so it does more harm than good.

This is the hyper-reactivity part.

The blind reflex reaction further destabilises an already unstable situation and accelerates the decline.  It creates a positive feedback loop that can quickly escalate to verbal, written and then psychological and physical conflict. The Lose-Lose-Lose of Self-Destructive behaviour that is characteristic of the late phase.  And that is not all.  Over time the reflex reaction gets less effective as the Victimosis Membrane thickens. The reflex fades out.  This is a dangerous development because on the surface it looks like things are improving, there is less conflict, but in reality the patient is slipping into pre-terminal Victimosis.

Fortunately there is a treatment for Victimosis.

It is called Positivicillin.

herbal_supplement_400_wht_8492This is not a new wonder drug, it is a natural product. We all produce Positivicillin and some of us produce more than others: they are called Optimists.  Positivicillin works by channelling the flow of emotional energy into the reflection-and-action pathways. Naturally occurring Positivicillin has a long-half life: the warm glow of success lasts a long time.  Unfortunately Positivicillin is irreversibly deactivated by the emotional toxin generated by the Victimosis meme: a toxin called Discountin. So in the presence of Discountin the affected person needs to generate more Positivicillin and to do so continuously and this leads to emotional exhaustion. The diffusion of Positivicillin is impeded by the Victimosis Membrane so if subject has a severe case of Chronic Victimosis then they may need extrinsic Positivicillin treatment at high dose and for a long time to prevent terminal decline. The primary goal of emergency treatment is to neutralise the excess Discountin for long enough that the natural production of Positivicillin can start to work.

So where can we get supplies of extrinsic Positivicillin from?

In its pure form Positivicillin is rare and expensive.  The number of naturally occurring Eternal Optimist Exporters is small and their collective Positivicillin production capability is limited. Healthy organisations value and attract them; unhealthy ones discount and reject them.

wine_toast_pc_400_wht_4449no_smoking_400_wht_6805So we are forced to resort to using more abundant, cheaper but inferior drugs.  One is called Alcoholimycin and another is Tobaccomycin.  They are both widely available and affordable but they have long term irreversible toxic side effects.

Chronic Victimosis is endemic so chronic abuse of Tobaccomycin and Alcoholimycin is common and, in an attempt to restrict their negative long term effects, both drugs are heavily taxed by the Authorities.

Unfortunately this only aggravates the spread of Chronic Victimosis which some report is a sign of the same condition affecting the Authorties! These radicals are calling for de-regulation of the more potent variants such a Cannabisimycin but the Authorities have opted for a tightly regulated supply of symptom-suppressants such as Anxiolytin and Antidepressin. These are now freely available and do help those who want to learn to cure themselves.

The long term goal of the Victimosis Research Council is to develop ways to produce pure Positivicillin and to treat the most severe cases of Chronic Victimosis; and to find ways to boost the natural production of Positivicillin within less seriously affected individuals and organisations.


Chronic Victimosis is not a new disease – it has been described in various forms throughout recorded history – so the search for a cure starts with the historical treatments – one of which is Confessmycin. This has been used for centuries and appears to work well for some but not others and this idiosyncratic response is believed to be due to the presence (or not) of the Rel-1-Gion meme. Active dissemination of a range of Rel-1-Gion meme variants (and the closely linked Pol-1-Tic meme variants) has been tried with considerable success but does not appear to be a viable long term option.

A recent high-tech approach is called a Twimplant.  This is an example of the Social-Media class of biopsychosocial feedback loops that uses the now ubiquitous mobiphonic symbiont to connect the individual to a regular supply of positive support, ideas and evidence called P-Tweets.  It is important to tune the Twimplant correctly because the same device can also pick up distress signals broadcast by sufferers of Chronic Victimosis who are attempting to dilute their Discountin by digitising it and exporting it to everyone else. These are called N-Tweets and are easily identifiable by their Victimosis vocabulary. N-tweets can be avoided by adopting an Unfollow policy.

heart_puzzle_piece_missing_pa_150_wht_4829One promising line of new research is called R2LM probe therapy.  This is an unconventional and innovative way of curing Chronic Victimosis. The R2LM probe is designed to identify the gaps in the organisational memetic code and to guide delivery of specific meme transplants that fill the gaps it reveals. One common gap is called the OM-meme deletion and one effective treatment for this is called FISH. Taking a course of FISH injections or using a FISH immersion technique leads to a rapid and sustained improvement in emotional balance.  That in-turn leads to an increase in the natural production of Positivicillin. From that point on the individual and can dissolve the Victimosis Membrance and correct their perceptual distortion. The treatment is sometimes uncomfortable but those who completed the course will vouch for its effectiveness.

For the milder forms of Victimosis it is possible to self-diagnose and to self-treat.

The strategy here is to actively reduce the production of Discountin and to boost the natural production of Positivicillin. These have a synergistic effect. The first step is to practice listening for the Victimosis vocabulary using a list of common phrases.  The patient is taught to listen for these in spoken communication and to look for them in written communication. Spoken communication includes their Internal Voice. The commonest phrases are:

1. “Yes but …”
2. “If only  …”
3. “I/You/We/They should …”
4. “I/We can’t …”
5. “I/We hope …”
6. “Not My/Our fault …”
7. “Constant struggle …”
8. “I/We do not know …”
9. “I am too busy to …”

The negative emotional impact of these phrases is caused by the presence of the Discountin toxin.

The second step is to substitute the contaminated phrase with an equivalent one where the Discountin is deactivated using Positivicillin. This deliberate and conscious substitution is easiest in written communication, then externally spoken and finally the Internal Voice. The replacements for the above are …

1. “Yes, and …”
2. “Next time …”
3. “I/We could …”
4. “I/We can …”
5. “I/We know …”
6. “My/Our responsibility …”
7. “Endless opportunity …”
8. “I/We will learn …”
9. “It is too important not to …”

figure_check_mark_celebrate_anim_150_wht_3617The system-wide benefits of the prompt and effective management of Chronic Victimosis are enormous. There is more reflective consideration and more effective action. There is success and celebration where before there was failure and frustration. The success stimulates natural release of more Positivicillin which builds a positive reinforcement feedback loop.  In addition the other GA-memes become progressively switched off and the signs of Passive Persecutitis and Reactive Rescuopathy resolve.

The combined effect leads to the release of Curiositonin, the natural inquisitiveness hormone, and Excitaline – the hormone that causes the addictive feeling of eager anticipation. The racing heart and the dry mouth.

From then on the ex-patient is able to maintain their emotional balance, to further develop their emotional resilience, and to assist other sufferers.  And that is a win for everyone.

The Six Dice Game

<Ring Ring><Ring Ring>

Hello, you are through to the Improvement Science Helpline. How can we help?

This is Leslie, one of your apprentices.  Could I speak to Bob – my Improvement Science coach?

Yes, Bob is free. I will connect you now.

<Ring Ring><Ring Ring>

B: Hello Leslie, Bob here. What is on your mind?

L: Hi Bob, I have a problem that I do not feel my Foundation training has equipped me to solve. Can I talk it through with you?

B: Of course. Can you outline the context for me?

L: OK. The context is a department that is delivering an acceptable quality-of-service and is delivering on-time but is failing financially. As you know we are all being forced to adopt austerity measures and I am concerned that if their budget is cut then they will fail on delivery and may start cutting corners and then fail on quality too.  We need a win-win-win outcome and I do not know where to start with this one.

B: OK – are you using the 6M Design method?

L: Yes – of course!

B: OK – have you done The 4N Chart for the customer of their service?

L: Yes – it was their customers who asked me if I could help and that is what I used to get the context.

B: OK – have you done The 4N Chart for the department?

L: Yes. And that is where my major concerns come from. They feel under extreme pressure; they feel they are working flat out just to maintain the current level of quality and on-time delivery; they feel undervalued and frustrated that their requests for more resources are refused; they feel demoralized; demotivated and scared that their service may be ‘outsourced’. On the positive side they feel that they work well as a team and are willing to learn. I do not know what to do next.

B: OK. Dispair not. This sounds like a very common and treatable system illness.  It is a stream design problem which may be the reason your Foundations training feels insufficient. Would you like to see how a Practitioner would approach this?

L: Yes please!

B: OK. Have you mapped their internal process?

L: Yes. It is a six-step process for each job. Each step has different requirements and are done by different people with different skills. In the past they had a problem with poor service quality so extra safety and quality checks were imposed by the Governance department.  Now the quality of each step is measured on a 1-6 scale and the quality of the whole process is the sum of the individual steps so is measured on a scale of 6 to 36. They now have been given a minimum quality target of 21 to achieve for every job. How they achieve that is not specified – it was left up to them.

B: OK – do they record their quality measurement data?

L: Yes – I have their report.

B: OK – how is the information presented?

L: As an average for the previous month which is reported up to the Quality Performance Committee.

B: OK – what was the average for last month?

L: Their results were 24 – so they do not have an issue delivering the required quality. The problem is the costs they are incurring and they are being labelled by others as ‘inefficient’. Especially the departments who are in budget and they are annoyed that this failing department keeps getting ‘bailed out’.

B: OK. One issue here is the quality reporting process is not alerting you to the real issue. It sounds from what you say that you have fallen into the Flaw of Averages trap.

L: I don’t understand. What is the Flaw of Averages trap?

B: The answer to your question will become clear. The finance issue is a symptom – an effect – it is unlikely to be the cause. When did this finance issue appear?

L: Just after the Safety and Quality Review. They needed to employ more agency staff to do the extra work created by having to meet the new Minimum Quality target.

B: OK. I need to ask you a personal question. Do you believe that improving quality always costs more?

L: I have to say that I am coming to that conclusion. Our Governance and Finance departments are always arguing about it. Governance state ‘a minimum standard of safety and quality is not optional’ and finance say ‘but we are going out of business’. They are at loggerheads. The service departments get caught in the cross-fire.

B: OK. We will need to use reality to demonstrate that this belief is incorrect. Rhetoric alone does not work. If it did then we would not be having this conversation. Do you have the raw data from which the averages are calculated?

L: Yes. We have the data. The quality inspectors are very thorough!

B: OK – can you plot the quality scores for the last fifty jobs as a BaseLine chart?

L: Yes – give me a second. The average is 24 as I said.

B: OK – is the process stable?

L: Yes – there is only one flag for the fifty. I know from my Foundations training that is not a cause for alarm.

B: OK – what is the process capability?

L: I am sorry – I don’t know what you mean by that?

B: My apologies. I forgot that you have not completed the Practitioner training yet. The capability is the range between the red lines on the chart.

L: Um – the lower line is at 17 and the upper line is at 31.

L: OK – how many points lie below the target of 21.

B: None of course. They are meeting their Minimum Quality target. The issue is not quality – it is money.

There was a pause.  Leslie knew from experience that when Bob paused there was a surprise coming.

B: Can you email me your chart?

A cold-shiver went down Leslie’s back. What was the problem here? Bob had never asked to see the data before.

Sure. I will send it now.  The recent fifty is on the right, the data on the left is from after the quality inspectors went in and before the the Minimum Quality target was imposed. This is the chart that Governance has been using as evidence to justify their existence because they are claiming the credit for improving the quality.

B: OK – thanks. I have got it – let me see.  Oh dear.

Leslie was shocked. She had never heard Bob use language like ‘Oh dear’.

There was another pause.

B: Leslie, what is the context for this data? What does the X-axis represent?

Leslie looked at the chart again – more closely this time. Then she saw what Bob was getting at. There were fifty points in the first group, and about the same number in the second group. That was not the interesting part. In the first group the X-axis went up to 50 in regular steps of five; in the second group it went from 50 to just over 149 and was no longer regularly spaced. Eventually she replied.

Bob, that is a really good question. My guess it is that this is the quality of the completed work.

B: It is unwise to guess. It is better to go and see reality.

You are right. I knew that. It is drummed into us during the Foundations training! I will go and ask. Can I call you back?

B: Of course. I will email you my direct number.


<Ring Ring><Ring Ring>

B: Hello, Bob here.

L: Bob – it is Leslie. I am  so excited! I have discovered something amazing.

B: Hello Leslie. That is good to hear. Can you tell me what you have discovered?

L: I have discovered that better quality does not always cost more.

B: That is a good discovery. Can you prove it with data?

L: Yes I can!  I am emailing you the chart now.

B: OK – I am looking at your chart. Can you explain to me what you have discovered?

L: Yes. When I went to see for myself I saw that when a job failed the Minimum Quality check at the end then the whole job had to be re-done because there was no time to investigate and correct the causes of the failure.  The people doing the work said that they were helpless victims of errors that were made upstream of them – and they could not predict from one job to the next what the error would be. They said it felt like quality was a lottery and that they were just firefighting all the time. They knew that just repeating the work was not solving the problem but they had no other choice because they were under enormous pressure to deliver on-time as well. The only solution they could see is was to get more resources but their requests were being refused by Finance on the grounds that there is no more money. They felt completely trapped.

B: OK. Can you describe what you did?

L: Yes. I saw immediately that there were so many sources of errors that it would be impossible for me to tackle them all. So I used the tool that I had learned in the Foundations training: the Niggle-o-Gram. That focussed us and led to a surprisingly simple, quick, zero-cost process design change. We deliberately did not remove the Inspection-and-Correction policy because we needed to know what the impact of the change would be. Oh, and we did one other thing that challenged the current methods. We plotted every attempt, both the successes and the failures, on the BaseLine chart so we could see both the the quality and the work done on one chart.  And we updated the chart every day and posted it chart on the notice board so everyone in the department could see the effect of the change that they had designed. It worked like magic! They have already slashed their agency staff costs, the whole department feels calmer and they are still delivering on-time. And best of all they now feel that they have the energy and time to start looking at the next niggle. Thank you so much! Now I see how the tools and techniques I learned in Foundations are so powerful and now I understand better the reason we learned them first.

B: Well done Leslie. You have taken an important step to becoming a fully fledged Practitioner. You have learned some critical lessons in this challenge.


This scenario is fictional but realistic.

And it has been designed so that it can be replicated easily using a simple game that requires only pencil, paper and some dice.

If you do not have some dice handy then you can use this little program that simulates rolling six dice.

The Six Digital Dice program (for PC only).

Instructions
1. Prepare a piece of A4 squared paper with the Y-axis marked from zero to 40 and the X-axis from 1 to 80.
2. Roll six dice and record the score on each (or roll one die six times) – then calculate the total.
3. Plot the total on your graph. Left-to-right in time order. Link the dots with lines.
4. After 25 dots look at the chart. It should resemble the leftmost data in the charts above.
5. Now draw a horizontal line at 21. This is the Minimum Quality Target.
6. Keep rolling the dice – six per cycle, adding the totals to the right of your previous data.

But this time if the total is less than 21 then repeat the cycle of six dice rolls until the score is 21 or more. Record on your chart the output of all the cycles – not just the acceptable ones.

7. Keep going until you have 25 acceptable outcomes. As long as it takes.

Now count how many cycles you needed to complete in order to get 25 acceptable outcomes.  You should find that it is about twice as many as before you “imposed” the Inspect-and-Correct QI policy.

This illustrates the problem of an Inspection-and-Correction design for quality improvement.  It does improve the quality of the final output – but at a higher cost.

We are treating the symptoms (effects) and ignoring the disease (causes).

The internal design of the process is unchanged so it is still generating mistakes.

How much quality improvement you get and how much it costs you is determined by the design of the underlying process – which has not changed. There is a Law of Diminishing returns here – and a big risk.

The risk is that if quality improves as the result of applying a quality target then it encourages the Governance thumbscrews to be tightened further and forces those delivering the service further into cross-fire between Governance and Finance.

The other negative consequence of the Inspect-and-Correct approach is that it increases both the average and the variation in lead time which also fuels the calls for more targets, more sticks, calls for  more resources and pushes costs up even further.

The lesson from this simple exercise seems clear.

The better strategy for improving quality is to design the root causes of errors out of the processes  because then we will get improved quality and improved delivery and improved productivity and we will discover that we have improved safety as well.  Win-win-win-win.

The Six Dice Game is a simpler version of the famous Red Bead Game that W Edwards Deming used to explain why, in the modern world, the arbitrary-target-driven-command-and-control-stick-and-carrot style of performance management creates more problems than it solves.

The illusion is of short-term gain but the reality is of long-term pain.

And if you would like to see and hear Deming talking about the science of improvement there is a video of him speaking in 1984. He is at the bottom of the page.  Click here.