 It is that time of year – again.
Winter.
The NHS is struggling, front-line staff are having to use heroic measures just to keep the ship afloat, and less urgent work has been suspended to free up space and time to help man the emergency pumps.
And the finger-of-blame is being waggled by the army of armchair experts whose diagnosis is unanimous: “lack of cash caused by an austerity triggered budget constraint”.
And the evidence seems plausible.

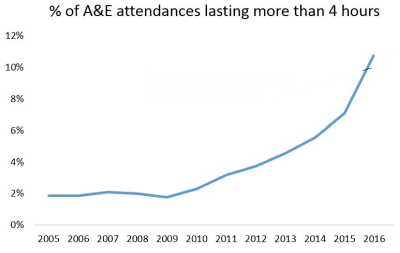
The A&E performance data says that each year since 2009, the proportion of patients waiting more than 4 hours in A&Es has been increasing. And the increase is accelerating. This is a progressive quality failure.
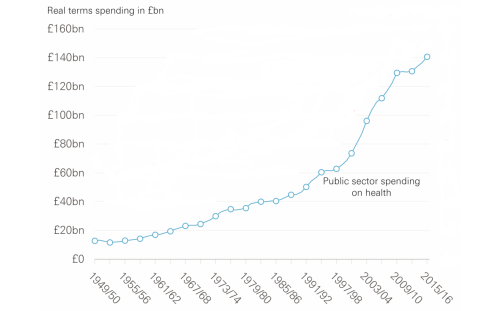
And health care spending since the NHS was born in 1948 shows a very similar accelerating pattern.

So which is the chicken and which is the egg? Or are they both symptoms of something else? Something deeper?
Both of these charts are characteristic of a particular type of system behaviour called a positive feedback loop. And the cost chart shows what happens when someone attempts to control the cash by capping the budget: It appears to work for a while … but the “pressure” is building up inside the system … and eventually the cash-limiter fails. Usually catastrophically. Bang!
The quality chart shows an associated effect of the “pressure” building inside the acute hospitals, and it is a very well understood phenomenon called an Erlang-Kingman queue. It is caused by the inevitable natural variation in demand meeting a cash-constrained, high-resistance, high-pressure, service provider. The effect is to amplify the natural variation and to create something much more dangerous and expensive: chaos.
The simple line-charts above show the long-term, aggregated effects and they hide the extremely complicated internal structure and the highly complex internal behaviour of the actual system.
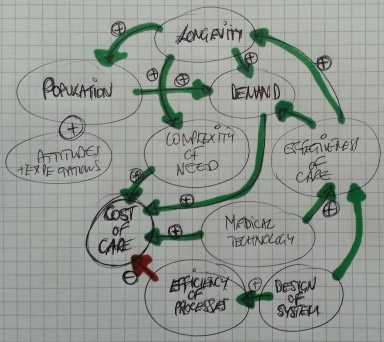
 One technique that system engineers use to represent this complexity is a causal loop diagram or CLD.
The arrows are of two types; green indicates a positive effect, and red indicates a negative effect.
This simplified CLD is dominated by green arrows all converging on “Cost of Care”. They are the positive drivers of the relentless upward cost pressure.
Health care is a victim of its own success.
So, if the cash is limited then the naturally varying demand will generate the queues, delays and chaos that have such a damaging effect on patients, providers and purses.
Safety and quality are adversely affected. Disappointment, frustration and anxiety are rife. Expectation is lowered. Confidence and trust are eroded. But costs continue to escalate because chaos is expensive to manage.
This system behaviour is what we are seeing in the press.
The cost-constraint has, paradoxically, had exactly the opposite effect, because it is treating the effect (the symptom) and ignoring the cause (the disease).
The CLD has one negative feedback loop that is linked to “Efficiency of Processes”. It is the only one that counteracts all of the other positive drivers. And it is the consequence of the “System Design”.
What this means is: To achieve all the other benefits without the pressures on people and purses, all the complicated interdependent processes required to deliver the evolving health care needs of the population must be proactively designed to be as efficient as technically possible.
And that is not easy or obvious. Efficient design does not happen naturally. It is hard work! It requires knowledge of the Anatomy and Physiology of Systems and of the Pathology of Variation. It requires understanding how to achieve effectiveness and efficiency at the same time as avoiding queues and chaos. It requires that the whole system is continually and proactively re-designed to remain reliable and resilient.
And that implies it has to be done by the system itself; and that means the NHS needs embedded health care systems engineering know-how.
And when we go looking for that we discover sequence of gaps.
An Awareness gap, a Belief gap and a Capability gap. ABC.
So the first gap to fill is the Awareness gap.

