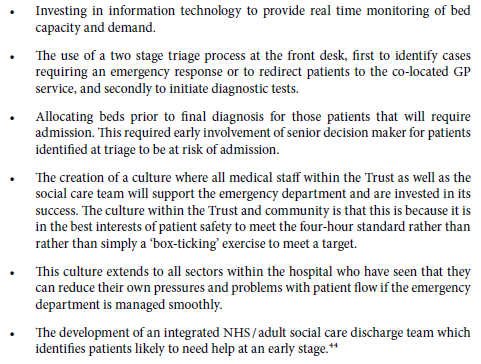
A New Decade of Hope

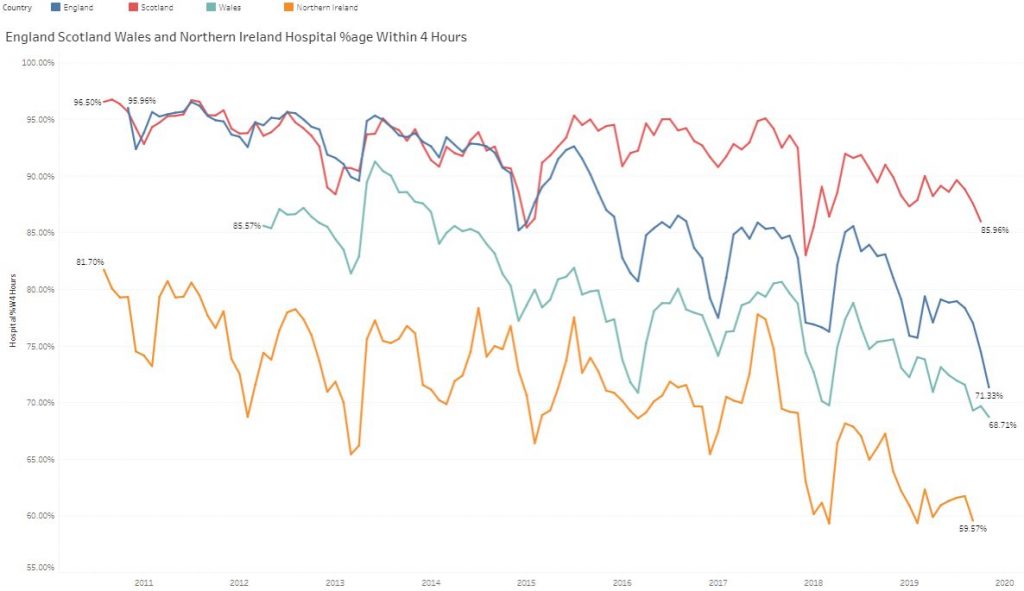
At the end of the decade it is the time to reflect on what has happened in the past before planning for the future.  As always, the hottest topic in health care is the status of the emergency care services, and we have the data – it is public.

This shows the last 9 years of aggregate, monthly data for Scotland (red), England (blue), Wales (teal) and N.Ireland (orange).  It does not take a data scientist and a supercomputer to interpret – there is a progressive system-wide progressive deterioration year-on-year.  The winter dips are obvious and the worst of these affect all four countries indicating a systemic cause … the severity of the winter weather/illness cycle -i.e. the Flu Season.

What this chart also says is that all the effort and money being expended in winter planning is not working well enough – and the nagging question is “Why not?”

Many claim that it is the predicted demographic “time bomb” … but if it is predicted then how come it has not been mitigated?

Many claim that it is a growing funding gap … but most NHS funding is spent on staff and  and training nurses, doctors and allied health professionals (AHPs) takes time.  Again, a predicted eventuality that has not been mitigated.

This looming crisis in a lack of heath care workers is a global health challenge … and is described by Mark Britnell in “Human – Solving the global workforce crisis in healthcare“.

Mark was the CEO of University Hospitals Birmingham from 2000 and has worked for KPMG since 2009 in a global health role so is well placed to present a strategic overview.


But, health care workers deliver care to patients – one at a time.  They are not responsible for designing the system of health care delivery; or ensuring all the pieces of that vast jigsaw link up and work in a synchronised way; or for the long term planning needed to mitigate the predictable effects of demographic drift and technology advances.

Who is responsible for that challenge and are they adequately trained to do it?

The evidence would appear to suggest that there is a gap that either no one has noticed or that no one is prepared to discuss.  An Undiscussable?


The global gap in the healthcare workforce is predicted to be about 20% by 2030.  That is a big gap to fill because with the NHS workforce of 1.3 million people – that implies training 260,000 new staff of all types in the next 10 years, in addition to replacing those that leave.

Assuming the processes and productivity stay as they are now.

So, perhaps there is a parallel approach, one that works more quickly and a lower cost.


When current health care processes are examined through a flow engineering lens they are found to be poorly designed. They are both ineffective (do not reliably deliver the intended outcome) and inefficient (waste a lot of resources in delivering any outcome).  Further examination reveals that the processes have never been designed … they have evolved.

And just because something is described as current practice does not prove that it is good design.

An expected symptom of a poorly designed process is a combination of chronic queues, delays, chaos, reactive fire-fighting and burnout.  And the assumed cause is often lack of resources because when extra resource is added the queues and chaos subsides, for a while.

But, if the unintentional poor design of the process is addressed then a sequence of surprising things can happen. The chaos evaporates immediately without any extra resources. A feeling of calm is restored and the disruptive fire-fighting stops. The health care workers are able to focus on what they do best and pride-in-work is restored. Patient experience improves and staff feel that feedback and become more motivated. The complaining abates, sickness and absence falls, funded-but-hard-to-recruit-to posts are refilled and there are more hands on the handle of a more efficient/effective/productive pump.  The chronic queues and delays start to melt away – as if by magic.

And if that all sounds totally impossible then here are a couple of recent, real-world case studies written by different teams in different cities in different parts of the UK.  One from cancer care and one from complex diabetic care.

They confirm that this chaos-to-calm transformation is possible.

So, is there a common thread that links these two examples?

Yes, there is, and once again the spotlight is shone on the Undiscussable Gap … the fact that the NHS does not appear to have the embedded capability to redesign itself.

There is a hidden workforce gap that none of the existing programmes will address – because it is not a lack of health care workers – it is a lack of appropriately trained health care manager-designers.


The Undiscussable Elephant Is In The Room … the Undiscussable Emperor Has No Clothes.

And if history teaches us anything, Necessity is the Mother of Innovation and the chart at the top of the page shows starkly that there is an Growing Urgent Necessity.

And if two embedded teams can learn this magic trick of flipping chaos into calm at no cost, then perhaps others can too?

Welcome to the New Decade of Hope and Health Care Systems Engineering.

From Push to Pull

One of the most frequent niggles that I hear from patients is the difficultly they have getting an appointment with their general practitioner.  I too have personal experience of the distress caused by the ubiquitous “Phone at 8AM for an Appointment” policy, so in June 2018 when I was approached to help a group of local practices redesign their appointment booking system I said “Yes, please!


What has emerged is a fascinating, enjoyable and rewarding journey of co-evolution of learning and co-production of an improved design.  The multi-skilled design team (MDT) we pulled together included general practitioners, receptionists and practice managers and my job was to show them how to use the health care systems engineering (HCSE) framework to diagnose, design, decide and deliver what they wanted: A safe, calm, efficient, high quality, value-4-money appointment booking service for their combined list of 50,000 patients.


This week they reached the start of the ‘decide and deliver‘ phase.  We have established the diagnosis of why the current booking system is not delivering what we all want (i.e. patients and practices), and we have assembled and verified the essential elements of an improved design.

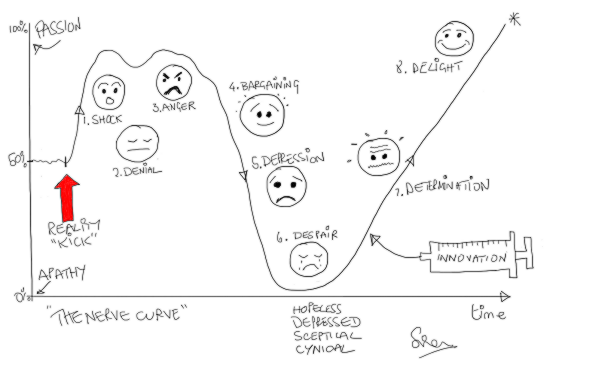
And the most important outcome for me is that the Primary Care MDT now feel confident and capable to decide what and how to deliver it themselves.   That is what I call embedded capability and achieving it is always an emotional roller coaster ride that we call The Nerve Curve.

What we are dealing with here is called a complex adaptive system (CAS) which has two main components: Processes and People.  Both are complicated and behave in complex ways.  Both will adapt and co-evolve over time.  The processes are the result of the policies that the people produce.  The policies are the result of the experiences that the people have and the explanations that they create to make intuitive sense of them.

But, complex systems often behave in counter-intuitive ways, so our intuition can actually lead us to make unwise decisions that unintentionally perpetuate the problem we are trying to solve.  The name given to this is a wicked problem.

A health care systems engineer needs to be able to demonstrate where these hidden intuitive traps lurk, and to explain what causes them and how to avoid them.  That is the reason the diagnosis and design phase is always a bit of a bumpy ride – emotionally – our Inner Chimp does not like to be challenged!  We all resist change.  Fear of the unknown is hard-wired into us by millions of years of evolution.

But we know when we are making progress because the “ah ha” moments signal a slight shift of perception and a sudden new clarity of insight.  The cognitive fog clears a bit and a some more of the unfamiliar terrain ahead comes into view.  We are learning.

The Primary Care MDT have experienced many of these penny-drop moments over the last six months and unfortunately there is not space here to describe them all, but I can share one pivotal example.


A common symptom of a poorly designed process is a chronically chaotic queue.

[NB. In medicine the term chronic means “long standing”.  The opposite term is acute which means “recent onset”].

Many assume, intuitively, that the cause of a chronically chaotic queue is lack of capacity; hence the incessant calls for ‘more capacity’.  And it appears that we have learned this reflex response by observing the effect of adding capacity – which is that the queue and chaos abate (for a while).  So that proves that lack of capacity was the cause. Yes?

Well actually it doesn’t.  Proving causality requires a bit more work.  And to illustrate this “temporal association does not prove causality trap” I invite you to consider this scenario.

I have a headache => I take a paracetamol => my headache goes away => so the cause of my headache was lack of paracetamol. Yes?

Errr .. No!

There are many contributory causes of chronically chaotic queues and lack of capacity is not one of them because the queue is chronic.  What actually happens is that something else triggers the onset of chaos which then consumes the very resource we require to avoid the chaos.  And once we slip into this trap we cannot escape!  The chaos-perpretuating behaviour we observe is called fire-fighting and the necessary resource it consumes is called resilience.


Six months ago, the Primary Care MDT believed that the cause of their chronic appointment booking chaos was a mismatch between demand and capacity – i.e. too much patient demand for the appointment capacity available.  So, there was a very reasonable resistance to the idea of making the appointment booking process easier for patients – they justifiably feared being overwhelmed by a tsunami of unmet need!

Six months on, the Primary Care MDT understand what actually causes chronic queues and that awareness has been achieved by a step-by-step process of explanation and experimentation in the relative safety of the weekly design sessions.

We played simulation games – lots of them.

One particularly memorable “Ah Ha!” moment happened when we played the Carveout Game which is done using dice, tiddly-winks, paper and coloured-pens.  No computers.  No statistics.  No queue theory gobbledygook.  No smoke-and-mirrors.  No magic.

What the Carveout Game demonstrates, practically and visually, is that an easy way to trigger the transition from calm-efficiency to chaotic-ineffectiveness is … to impose a carveout policy on a system that has been designed to achieve optimum efficiency by using averages.  Boom!  We slip on the twin banana skins of the Flaw-of-Averages and Sub-Optimisation, slide off the performance cliff, and career down the rocky slope of Chronic Chaos into the Depths of Despair – from which we cannot then escape.

This visual demonstration was a cognitive turning point for the MDT.  They now believed that there is a rational science to improvement and from there we were on the step-by-step climb to building the necessary embedded capability.


It now felt like the team were pulling what they needed to know.  I was no longer pushing.  We had flipped from push-to-pull.  That is called the tipping point.

And that is how health care systems engineering (HCSE) works.


Health care is a complex adaptive system, and what a health care systems engineer actually “designs” is a context-sensitive  incubator that nurtures the seeds of innovation that already exist in the system and encourages them to germinate, grow and become strong enough to establish themselves.

That is called “embedded improvement-by-design capability“.

And each incubator need to be different – because each system is different.  One-solution-fits-all-problems does not work here just as it does not in medicine.  Each patient is both similar and unique.


Just as in medicine, first we need to diagnose the actual cause;  second we need to design some effective solutions; third we need to decide which design to implement and fourth we need to deliver it.

But the how-to-do-it feels a bit counter-intuitive, and if it were not we would already be doing it. But the good news is that anyone can learn how to do HCSE.

Filter-Pull versus Push-Carveout

It is November 2018, the clocks have changed back to GMT, the trick-and-treats are done, the fireworks light the night skies and spook the hounds, and the seasonal aisles in the dwindling number of high street stores are already stocked for Christmas.

I have been a bit quiet on the blog front this year but that is because there has been a lot happening behind the scenes and I have had to focus.

One output of is the recent publication of an article in Future Healthcare Journal on the topic of health care systems engineering (HCSE).  Click here to read the article and the rest of this excellent edition of FHJ that is dedicated to “systems”.

So, as we are back to the winter phase of the annual NHS performance cycle it is a good time to glance at the A&E Performance Radar and see who is doing well, and not-so-well.

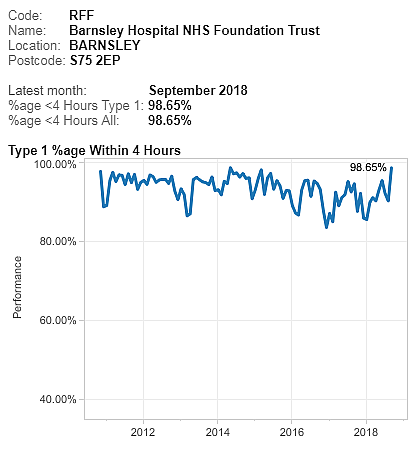
Based on past experience, I was expecting Luton to be Top-of-the-Pops and so I was surprised (and delighted) to see that Barnsley have taken the lead.  And the chart shows that Barnsley has turned around a reasonable but sagging performance this year.

So I would be asking “What has happened at Barnsley that we can all learn from? What did you change and how did you know what and how to do that?

To be sure, Luton is still in the top three and it is interesting to explore who else is up there and what their A&E performance charts look like.

The data is all available for anyone with a web-browser to view – here.

For completeness, this is the chart for Luton, and we can see that, although the last point is lower than Barnsley, the performance-over-time is more consistent and less variable. So who is better?

NB. This is a meaningless question and illustrates the unhelpful tactic of two-point comparisons with others, and with oneself. The better question is “Is my design fit-for-purpose?”

The question I have for Luton is different. “How do you achieve this low variation and how do you maintain it? What can we all learn from you?”

And I have some ideas how they do that because in a recent HSJ interview they said “It is all about the filters“.


What do they mean by filters?

A filter is an essential component of any flow design if we want to deliver high safety, high efficiency, high effectiveness, and high productivity.  In other words, a high quality, fit-4-purpose design.

And the most important flow filters are the “upstream” ones.

The design of our upstream flow filters is critical to how the rest of the system works.  Get it wrong and we can get a spiralling decline in system performance because we can unintentionally trigger a positive feedback loop.

Queues cause delays and chaos that consume our limited resources.  So, when we are chasing cost improvement programme (CIP) targets using the “salami slicer” approach, and combine that with poor filter design … we can unintentionally trigger the perfect storm and push ourselves over the catastrophe cliff into perpetual, dangerous and expensive chaos.

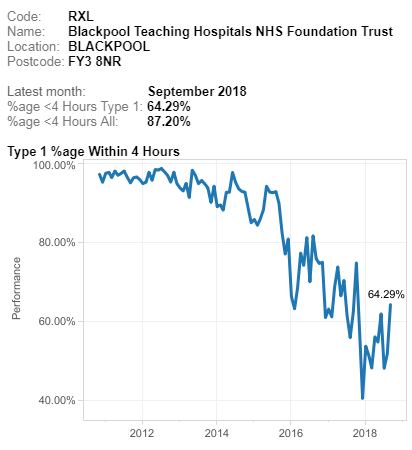
If we look at the other end of the NHS A&E league table we can see typical examples that illustrate this pattern.  I have used this one only because it happens to be bottom this month.  It is not unique.

All other NHS trusts fall somewhere between these two extremes … stable, calm and acceptable and unstable, chaotic and unacceptable.

Most display the stable and chaotic combination – the “Zone of Perpetual Performance Pain”.

So what is the fundamental difference between the outliers that we can all learn from? The positive deviants like Barnsley and Luton, and the negative deviants like Blackpool.  I ask this because comparing the extremes is more useful than laboriously exploring the messy, mass-mediocrity in the middle.

An effective upstream flow filter design is a necessary component, but it is not sufficient. Triage (= French for sorting) is OK but it is not enough.  The other necessary component is called “downstream pull” and omitting that element of the design appears to be the primary cause of the chronic chaos that drags trusts and their staff down.

It is not just an error of omission though, the current design is an actually an error of commission. It is anti-pull; otherwise known as “push”.


This year I have been busy on two complicated HCSE projects … one in secondary care and the other in primary care.  In both cases the root cause of the chronic chaos is the same.  They are different systems but have the same diagnosis.  What we have revealed together is a “push-carveout” design which is the exact opposite of the “upstream-filter-plus-downstream-pull” design we need.

And if an engineer wanted to design a system to be chronically chaotic then it is very easy to do. Here is the recipe:

a) Set high average utilisation target of all resources as a proxy for efficiency to ensure everything is heavily loaded. Something between 80% and 100% usually does the trick.

b) Set a one-size-fits-all delivery performance target that is not currently being achieved and enforce it punitively.  Something like “>95% of patients seen and discharged or admitted in less than 4 hours, or else …”.

c) Divvy up the available resources (skills, time, space, cash, etc) into ring-fenced pots.

Chronic chaos is guaranteed.  The Laws of Physics decree it.


Unfortunately, the explanation of why this is the case is counter-intuitive, so it is actually better to experience it first, and then seek the explanation.  Reality first, reasoning second.

And, it is a bittersweet experience, so it needs to be done with care and compassion.

And that’s what I’ve been busy doing this year. Creating the experiences and then providing the explanations.  And if done gradually what then happens is remarkable and rewarding.

The FHJ article outlines one validated path to developing individual and organisational capability in health care systems engineering.

The Pathology of Variation II

It is that time of year – again.

Winter.

The NHS is struggling, front-line staff are having to use heroic measures just to keep the ship afloat, and less urgent work has been suspended to free up space and time to help man the emergency pumps.

And the finger-of-blame is being waggled by the army of armchair experts whose diagnosis is unanimous: “lack of cash caused by an austerity triggered budget constraint”.


And the evidence seems plausible.

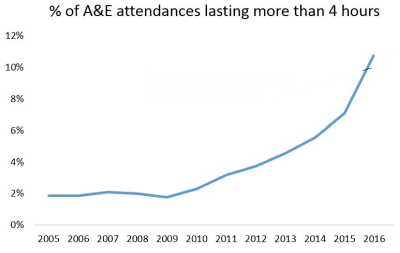
The A&E performance data says that each year since 2009, the proportion of patients waiting more than 4 hours in A&Es has been increasing.  And the increase is accelerating. This is a progressive quality failure.

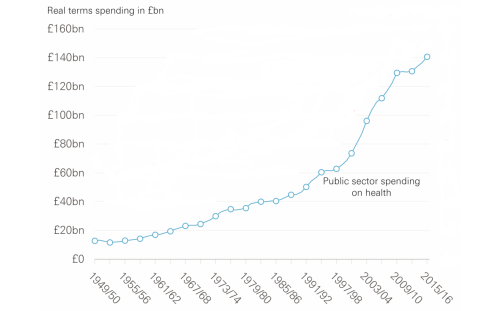
And health care spending since the NHS was born in 1948 shows a very similar accelerating pattern.    

So which is the chicken and which is the egg?  Or are they both symptoms of something else? Something deeper?


Both of these charts are characteristic of a particular type of system behaviour called a positive feedback loop.  And the cost chart shows what happens when someone attempts to control the cash by capping the budget:  It appears to work for a while … but the “pressure” is building up inside the system … and eventually the cash-limiter fails. Usually catastrophically. Bang!


The quality chart shows an associated effect of the “pressure” building inside the acute hospitals, and it is a very well understood phenomenon called an Erlang-Kingman queue.  It is caused by the inevitable natural variation in demand meeting a cash-constrained, high-resistance, high-pressure, service provider.  The effect is to amplify the natural variation and to create something much more dangerous and expensive: chaos.


The simple line-charts above show the long-term, aggregated  effects and they hide the extremely complicated internal structure and the highly complex internal behaviour of the actual system.

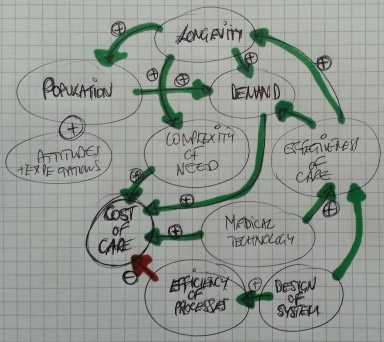
One technique that system engineers use to represent this complexity is a causal loop diagram or CLD.

The arrows are of two types; green indicates a positive effect, and red indicates a negative effect.

This simplified CLD is dominated by green arrows all converging on “Cost of Care”.  They are the positive drivers of the relentless upward cost pressure.

Health care is a victim of its own success.

So, if the cash is limited then the naturally varying demand will generate the queues, delays and chaos that have such a damaging effect on patients, providers and purses.

Safety and quality are adversely affected. Disappointment, frustration and anxiety are rife. Expectation is lowered.  Confidence and trust are eroded.  But costs continue to escalate because chaos is expensive to manage.

This system behaviour is what we are seeing in the press.

The cost-constraint has, paradoxically, had exactly the opposite effect, because it is treating the effect (the symptom) and ignoring the cause (the disease).


The CLD has one negative feedback loop that is linked to “Efficiency of Processes”.  It is the only one that counteracts all of the other positive drivers.  And it is the consequence of the “System Design”.

What this means is: To achieve all the other benefits without the pressures on people and purses, all the complicated interdependent processes required to deliver the evolving health care needs of the population must be proactively designed to be as efficient as technically possible.


And that is not easy or obvious.  Efficient design does not happen naturally.  It is hard work!  It requires knowledge of the Anatomy and Physiology of Systems and of the Pathology of Variation.  It requires understanding how to achieve effectiveness and efficiency at the same time as avoiding queues and chaos.  It requires that the whole system is continually and proactively re-designed to remain reliable and resilient.

And that implies it has to be done by the system itself; and that means the NHS needs embedded health care systems engineering know-how.

And when we go looking for that we discover sequence of gaps.

An Awareness gap, a Belief gap and a Capability gap. ABC.

So the first gap to fill is the Awareness gap.

H.R.O.

The New Year of 2018 has brought some unexpected challenges. Or were they?

We have belligerent bullies with their fingers on their nuclear buttons.

We have an NHS in crisis, with corridor-queues of urgent frail, elderly, unwell and a month of cancelled elective operations.

And we have winter storms, fallen trees, fractured power-lines, and threatened floods – all being handled rather well by people who are trained to manage the unexpected.

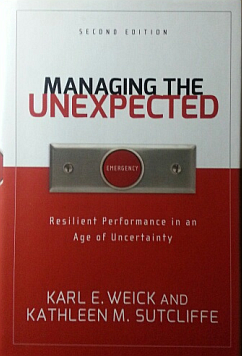
Which is the title of this rather interesting book that talks a lot about HROs.

So what are HROs?


“H” stands for High.  “O” stands for Organisation.

What does R stand for?  Rhetoric? Rigidity? Resistance?

Watching the news might lead one to suggest these words would fit … but they are not the answer.

“R” stands for Reliability and “R” stands for Resilience … and they are linked.


Think of a global system that is so reliable that we all depend on it, everyday.  The Global Positioning System or the Internet perhaps.  We rely on them because they serve a need and because they work. Reliably and resiliently.

And that was no accident.

Both the Internet and the GPS were designed and built to meet the needs of billions and to be reliable and resilient.  They were both created by an army of unsung heroes called systems engineers – who were just doing their job. The job they were trained to do.


The NHS serves a need – and often an urgent one, so it must also be reliable. But it is not.

The NHS needs to be resilient. It must cope with the ebb and flow of seasonal illness. But it does not.

And that is because the NHS has not been designed to be either reliable or resilient. And that is because the NHS has not been designed.  And that is because the NHS does not appear to have enough health care systems engineers trained to do that job.

But systems engineering is a mature discipline, and it works just as well inside health care as it does outside.


And to support that statement, here is evidence of what happened after a team of NHS clinicians and managers were trained in the basics of HCSE.

Monklands A&E Improvement

So the gap seems to be just an awareness/ability gap … which is a bridgeable one.


Who would like to train to be a Health Case Systems Engineer and to join the growing community of HCSE practitioners who have the potential to be the future unsung heroes of the NHS?

Click here if you are interested: http://www.ihcse.uk

PS. “Managing the Unexpected” is an excellent introduction to SE.

The Turkeys Voting For Xmas Trap

One of the quickest and easiest ways to kill an improvement initiative stone dead is to label it as a “cost improvement program” or C.I.P.

Everyone knows that the biggest single contributor to cost is salaries.

So cost reduction means head count reduction which mean people lose their jobs and their livelihood.

Who is going to sign up to that?

It would be like turkeys voting for Xmas.

There must be a better approach?

Yes. There is.


Over the last few weeks, groups of curious skeptics have experienced the immediate impact of systems engineering theory, techniques and tools in a health care context.

They experienced queues, delays and chaos evaporate in front of their eyes … and it cost nothing to achieve. No extra resources. No extra capacity. No extra cash.

Their reaction was “surprise and delight”.

But … it also exposed a problem.  An undiscussable problem.


Queues and chaos require expensive resources to manage.

We call them triagers, progress-chasers, and fire-fighters.  And when the queues and chaos evaporate then their jobs do too.

The problem is that the very people who are needed to make the change happen are the ones who become surplus-to-requirement as a result of the change.

So change does not happen.

It would like turkeys voting for Xmas.


The way around this impasse is to anticipate the effect and to proactively plan to re-invest the resource that is released.  And to re-invest it doing a more interesting and more worthwhile jobs than queue-and-chaos management.

One opportunity for re-investment is called time-buffering which is an effective way to improve resilience to variation, especially in an unscheduled care context.

Another opportunity for re-investment is tail-gunning the chronic backlogs until they are down to a safe and sensible size.

And many complain that they do not have time to learn about improvement because they are too busy managing the current chaos.

So, another opportunity for re-investment is training – oneself first and then others.


R.I.P.    C.I.P.

The Disbelief to Belief Transition

The NHS appears to be descending in a frenzy of fear as the winter looms and everyone says it will be worse than last and the one before that.

And with that we-are-going-to-fail mindset, it almost certainly will.

Athletes do not start a race believing that they are doomed to fail … they hold a belief that they can win the race and that they will learn and improve even if they do not. It is a win-win mindset.

But to succeed in sport requires more than just a positive attitude.

It also requires skills, training, practice and experience.

The same is true in healthcare improvement.


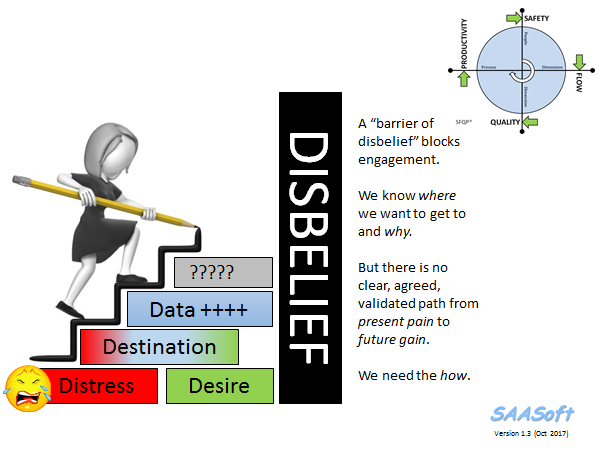
That is not the barrier though … the barrier is disbelief.

And that comes from not having experienced what it is like to take a system that is failing and transform it into one that is succeeding.

Logically, rationally, enjoyably and surprisingly quickly.

And, the widespread disbelief that it is possible is paradoxical because there are plenty of examples where others have done exactly that.

The disbelief seems to be “I do not believe that will work in my world and in my hands!

And the only way to dismantle that barrier-of-disbelief is … by doing it.


How do we do that?

The emotionally safest way is in a context that is carefully designed to enable us to surface the unconscious assumptions that are the bricks in our individual Barriers of Disbelief.

And to discard the ones that do not pass a Reality Check, and keep the ones that are OK.

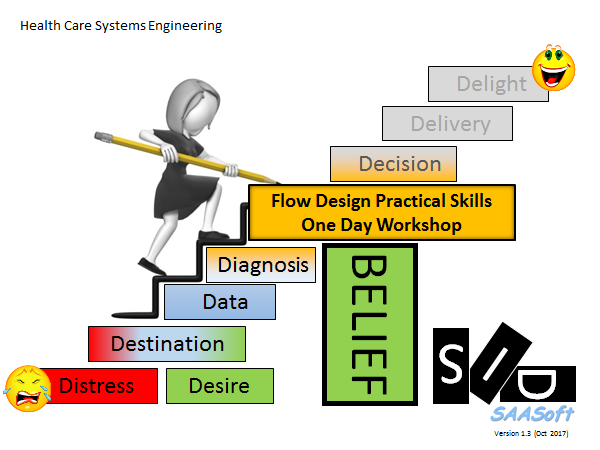
This Disbelief-Busting design has been proven to be effective, as evidenced by the growing number of individuals who are learning how to do it themselves, and how to inspire, teach and coach others to as well.


So, if you would like to flip disbelief-and-hopeless into belief-and-hope … then the door is here.

The Rise And Fall of Quality Improvement

“Those who cannot remember the past are condemned to repeat it”.

Aphorism by George Santayana, philosopher (1863-1952).

And the history of quality improvement (QI) is worth reflecting on, because there is massive pressure to grow QI capability in health care as a way of solving some chronic problems.

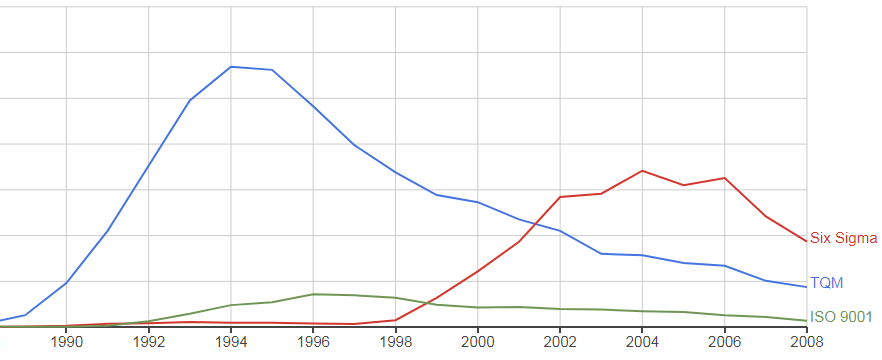
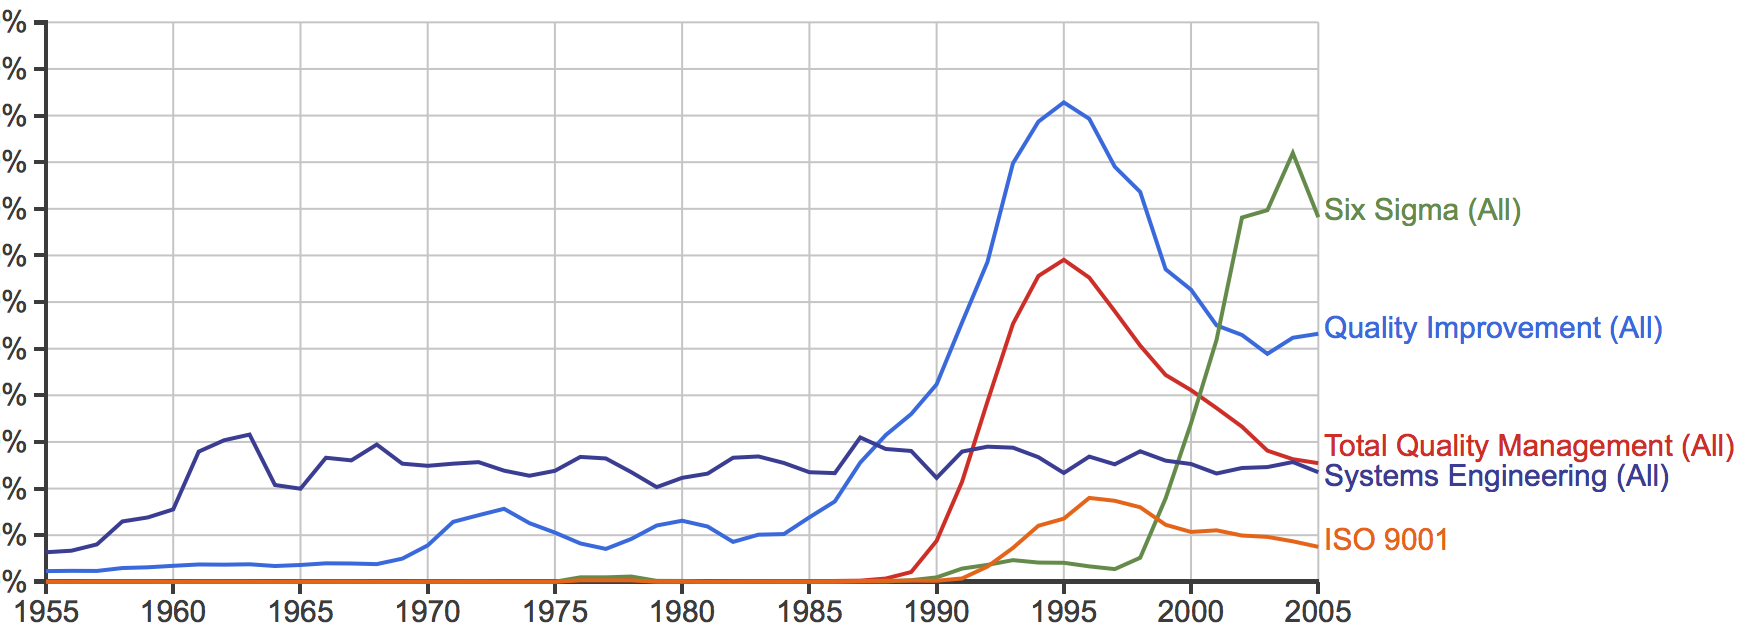
The chart below is a Google Ngram, it was generated using some phrases from the history of Quality Improvement:

TQM = the total quality management movement that grew from the work of Walter Shewhart in the 1920’s and 30’s and was “incubated” in Japan after being transplanted there by Shewhart’s student W. Edwards Deming in the 1950’s.
ISO 9001 = an international quality standard first published in 2000 that developed from the British Standards Institute (BSI) in the 1970’s via ISO 9000 that was first published in 1987.
Six Sigma = a highly statistical quality improvement / variation reduction methodology that originated in the rapidly expanding semiconductor industry in the 1980’s.

The rise-and-fall pattern is characteristic of how innovations spread; there is a long lag phase, then a short accelerating growth phase, then a variable plateau phase and then a long, decelerating decline phase.

It is called a life-cycle. It is how complex adaptive systems behave. It is how innovations spread. It is expected.

So what happened?

Did the rise of TQM lead to the rise of ISO 9000 which triggered the development of the Six Sigma methodology?

It certainly looks that way.

So why is Six Sigma “dying”?  Or is it just being replaced by something else?


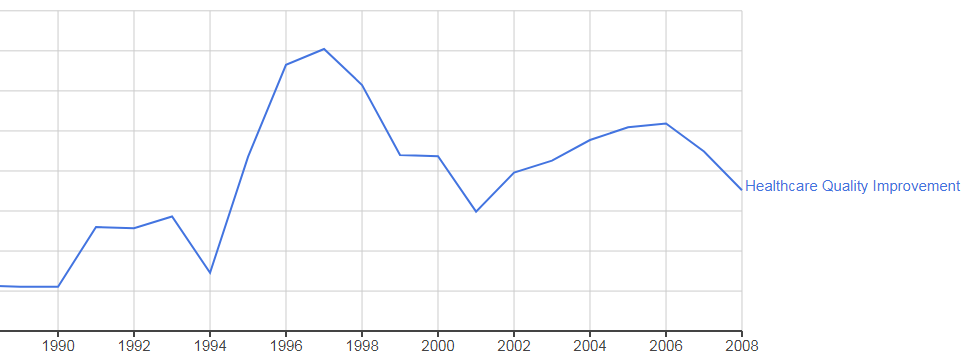
This is the corresponding Ngram for “Healthcare Quality Improvement” which seems to sit on the timeline in about the same place as ISO 9001 and that suggests that it was triggered by the TQM movement. 

The Institute of Healthcare Improvement (IHI) was officially founded in 1991 by Dr Don Berwick, some years after he attended one of the Deming 4-day workshops and had an “epiphany”.

Don describes his personal experience in a recent plenary lecture (from time 01:07).  The whole lecture is worth watching because it describes the core concepts and principles that underpin QI.


So given the fact that safety and quality are still very big issues in health care – why does the Ngram above suggest that the use of the term Quality Improvement does not sustain?

Will that happen in healthcare too?

Could it be that there is more to improvement than just a focus on safety (reducing avoidable harm) and quality (improving patient experience)?

Could it be that flow and productivity are also important?

The growing angst that permeates the NHS appears to be more focused on budgets and waiting-time targets (4 hrs in A&E, 63 days for cancer, 18 weeks for scheduled care, etc.).

Mortality and Quality hardly get a mention any more, and the nationally failed waiting time targets are being quietly dropped.

Is it too politically embarrassing?

Has the NHS given up because it firmly believes that pumping in even more money is the only solution, and there isn’t any more in the tax pot?


This week another small band of brave innovators experienced, first-hand, the application of health care systems engineering (HCSE) to a very common safety, flow, quality and productivity problem …

… a chronically chaotic clinic characterized by queues and constant calls for more capacity and cash.

They discovered that the queues, delays and chaos (i.e. a low quality experience) were not caused by lack of resources; they were caused by flow design.  They were iatrogenic.  And when they applied the well-known concepts and principles of scheduling design, they saw the queues and chaos evaporate, and they measured a productivity increase of over 60%.

OMG!

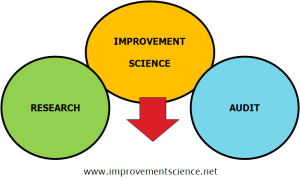
Improvement science is more than just about safety and quality, it is about flow and productivity as well; because we all need all four to improve at the same time.

And yes we need all the elements of Deming’s System of Profound Knowledge (SoPK), but need more than that.  We need to harness the knowledge of the engineers who for centuries have designed and built buildings, bridges, canals, steam engines, factories, generators, telephones, automobiles, aeroplanes, computers, rockets, satellites, space-ships and so on.

We need to revisit the legacy of the engineers like Watt, Brunel, Taylor, Gantt, Erlang, Ford, Forrester and many, many others.

Because it does appear to be possible to improve-by-design as well as to improve-by-desire.

Here is the Ngram with “Systems Engineering” (SE) added and the time line extended back to 1955.  Note the rise of SE in the 1950’s and 1960’s and note that it has sustained.

That pattern of adoption only happens when something is proven to be fit-4-purpose, and is valued and is respected and is promoted and is taught.

What opportunity does systems engineering offer health care?

That question is being actively explored … here.

Eating the Elephant in the Room

The Elephant in the Room is an English-language metaphorical idiom for an obvious problem or risk no one wants to discuss.

An undiscussable topic.

And the undiscussability is also undiscussable.

So the problem or risk persists.

And people come to harm as a result.

Which is not the intended outcome.

So why do we behave this way?

Perhaps it is because the problem looks too big and too complicated to solve in one intuitive leap, and we give up and label it a “wicked problem”.


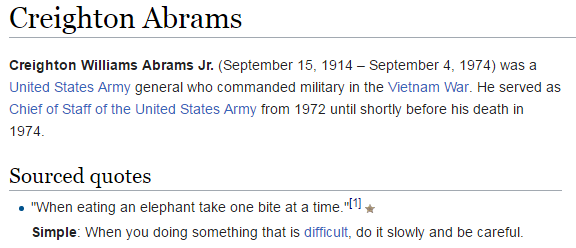
The well known quote “When eating an elephant take one bite at a time” is attributed to Creighton Abrams, a US Chief of Staff.


It says that even seemingly “impossible” problems can be solved so long as we proceed slowly and carefully, in small steps, learning as we go.

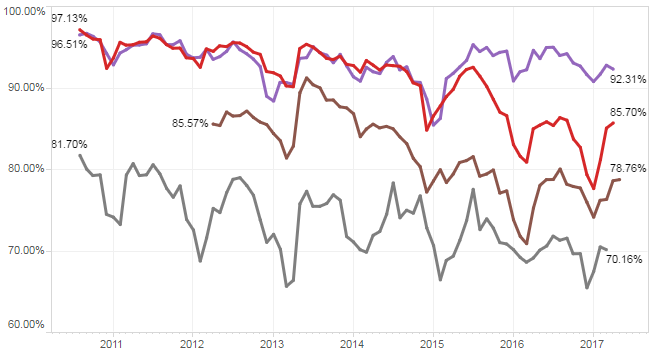
And the continued decline of the NHS UK Unscheduled Care performance seems to be an Elephant-in-the-Room problem, as shown by the monthly A&E 4-hour performance over the last 10 years and the fact that this chart is not published by the NHS.

Red = England, Brown=Wales, Grey=N.Ireland, Purple=Scotland.


This week I experienced a bite of this Elephant being taken and chewed on.

The context was a Flow Design – Practical Skills – One Day Workshop and the design challenge posed to the eager delegates was to improve the quality and efficiency of a one stop clinic.

A seemingly impossible task because the delegates reported that the queues, delays and chaos that they experienced in the simulated clinic felt very realistic.

Which means that this experience is accepted as inevitable, and is impossible to improve without more resources, but financial cuts prevent that, so we have to accept the waits.


At the end of the day their belief had been shattered.

The queues, delays and chaos had evaporated and the cost to run the new one stop clinic design was actually less than the old one.

And when we combined the quality metrics with the cost metrics and calculated the measured improvement in productivity; the answer was over 70%!

The delegates experienced it all first-hand. They did the diagnosis, design, and delivery using no more than squared-paper and squeaky-pen.

And at the end they were looking at a glaring mismatch between their rhetoric and the reality.

The “impossible to improve without more money” hypothesis lay in tatters – it had been rationally, empirically and scientifically disproved.

I’d call that quite a big bite out of the Elephant-in-the-Room.


So if you have a healthy appetite for Elephant-in-the-Room challenges, and are not afraid to try something different, then there is a whole menu of nutritious food-for-thought at a FISH&CHIPs® practical skills workshop.

The Storyboard

This week about thirty managers and clinicians in South Wales conducted two experiments to test the design of the Flow Design Practical Skills One Day Workshop.

Their collective challenge was to diagnose and treat a “chronically sick” clinic and the majority had no prior exposure to health care systems engineering (HCSE) theory, techniques, tools or training.

Two of the group, Chris and Jat, had been delegates at a previous ODWS, and had then completed their Level-1 HCSE training and real-world projects.

They had seen it and done it, so this experiment was to test if they could now teach it.

Could they replicate the “OMG effect” that they had experienced and that fired up their passion for learning and using the science of improvement?

Continue reading “The Storyboard”

Diagnose-Design-Deliver

A story was shared this week.

A story of hope for the hard-pressed NHS, its patients, its staff and its managers and its leaders.

A story that says “We can learn how to fix the NHS ourselves“.

And the story comes with evidence; hard, objective, scientific, statistically significant evidence.


The story starts almost exactly three years ago when a Clinical Commissioning Group (CCG) in England made a bold strategic decision to invest in improvement, or as they termed it “Achieving Clinical Excellence” (ACE).

They invited proposals from their local practices with the “carrot” of enough funding to allow GPs to carve-out protected time to do the work.  And a handful of proposals were selected and financially supported.

This is the story of one of those proposals which came from three practices in Sutton who chose to work together on a common problem – the unplanned hospital admissions in their over 70’s.

Their objective was clear and measurable: “To reduce the cost of unplanned admissions in the 70+ age group by working with hospital to reduce length of stay.

Did they achieve their objective?

Yes, they did.  But there is more to this story than that.  Much more.


One innovative step they took was to invest in learning how to diagnose why the current ‘system’ was costing what it was; then learning how to design an improvement; and then learning how to deliver that improvement.

They invested in developing their own improvement science skills first.

They did not assume they already knew how to do this and they engaged an experienced health care systems engineer (HCSE) to show them how to do it (i.e. not to do it for them).

Another innovative step was to create a blog to make it easier to share what they were learning with their colleagues; and to invite feedback and suggestions; and to provide a journal that captured the story as it unfolded.

And they measured stuff before they made any changes and afterwards so they could measure the impact, and so that they could assess the evidence scientifically.

And that was actually quite easy because the CCG was already measuring what they needed to know: admissions, length of stay, cost, and outcomes.

All they needed to learn was how to present and interpret that data in a meaningful way.  And as part of their IS training,  they learned how to use system behaviour charts, or SBCs.


By Jan 2015 they had learned enough of the HCSE techniques and tools to establish the diagnosis and start to making changes to the parts of the system that they could influence.


Two years later they subjected their before-and-after data to robust statistical analysis and they had a surprise. A big one!

Reducing hospital mortality was not a stated objective of their ACE project, and they only checked the mortality data to be sure that it had not changed.

But it had, and the “p=0.014” part of the statement above means that the probability that this 20.0% reduction in hospital mortality was due to random chance … is less than 1.4%.  [This is well below the 5% threshold that we usually accept as “statistically significant” in a clinical trial.]

But …

This was not a randomised controlled trial.  This was an intervention in a complicated, ever-changing system; so they needed to check that the hospital mortality for comparable patients who were not their patients had not changed as well.

And the statistical analysis of the hospital mortality for the ‘other’ practices for the same patient group, and the same period of time confirmed that there had been no statistically significant change in their hospital mortality.

So, it appears that what the Sutton ACE Team did to reduce length of stay (and cost) had also, unintentionally, reduced hospital mortality. A lot!


And this unexpected outcome raises a whole raft of questions …


If you would like to read their full story then you can do so … here.

It is a story of hunger for improvement, of humility to learn, of hard work and of hope for the future.

Hugh, Louise and Bob

Bob Jekyll was already sitting at a table, sipping a pint of Black Sheep and nibbling on a bowl of peanuts when Hugh and Louise arrived.

<Hugh> Hello, are you Bob?

<Bob> Yes, indeed! You must be Hugh and Louise. Can I get you a thirst quencher?

<Louise> Lime and soda for me please.

<Hugh> I’ll have the same as you, a Black Sheep.

<Bob> On the way.

<Hugh> Hello Louise, I’m Hugh Lewis.  I am the ops manager for acute medicine at St. Elsewhere’s Hospital. It is good to meet you at last. I have seen your name on emails and performance reports.

<Louise> Good to meet you too Hugh. I am senior data analyst for St. Elsewhere’s and I think we may have met before, but I’m not sure when.  Do you know what this is about? Your invitation was a bit mysterious.

<Hugh> Yes. Sorry about that. I was chatting to a friend of mine at the golf club last week, Dr Bill Hyde who is one of our local GPs.  As you might expect, we got to talking about the chronic pressure we are all under in both primary and secondary care.  He said he has recently crossed paths with an old chum of his from university days who he’d had a very interesting conversation with in this very pub, and he recommended I email him. So I did. And that led to a phone conversation with Bob Jekyll. I have to say he asked some very interesting questions that left me feeling a mixture of curiosity and discomfort. After we talked Bob suggested that we meet for a longer chat and that I invite my senior data analyst along. So here we are.

<Louise> I have to say my curiosity was pricked by your invitation, specifically the phrase ‘system behaviour charts’. That is a new one on me and I have been working in the NHS for some time now. It is too many years to mention since I started as junior data analyst, fresh from university!

<Hugh> That is the term Bob used, and I confess it was new to me too.

<Bob> Here we are, Black Sheep, lime soda and more peanuts.  Thank you both for coming, so shall we talk about the niggle that Hugh raised when we spoke on the phone?

<Hugh> Ah! Louise, please accept my apologies in advance. I think Bob might be referring to when I said that “90% of the performance reports don’t make any sense to me“.

<Louise> There is no need to apologise Hugh. I am actually reassured that you said that. They don’t make any sense to me either! We only produce them that way because that is what we are asked for.  My original degree was geography and I discovered that I loved data analysis! My grandfather was a doctor so I guess that’s how I ended up in doing health care data analysis. But I must confess, some days I do not feel like I am adding much value.

<Hugh> Really? I believe we are in heated agreement! Some days I feel the same way.  Is that why you invited us both Bob?

<Bob> Yes.  It was some of the things that Hugh said when we talked on the phone.  They rang some warning bells for me because, in my line of work, I have seen many people fall into a whole minefield of data analysis traps that leave them feeling confused and frustrated.

<Louise> What exactly is your line of work, Bob?

<Bob> I am a systems engineer.  I design, build, verify, integrate, implement and validate systems. Fit-for-purpose systems.

<Louise> In health care?

<Bob> Not until last week when I bumped into Bill Hyde, my old chum from university.  But so far the health care system looks just like all the other ones I have worked in, so I suspect some of the lessons from other systems are transferable.

<Hugh> That sounds interesting. Can you give us an example?

<Bob> OK.  Hugh, in our first conversation, you often used the words “demand”  and “capacity”. What do you mean by those terms?

<Hugh> Well, demand is what comes through the door, the flow of requests, the workload we are expected to manage.  And capacity is the resources that we have to deliver the work and to meet our performance targets.  Capacity is the staff, the skills, the equipment, the chairs, and the beds. The stuff that costs money to provide.  As a manager, I am required to stay in-budget and that consumes a big part of my day!

<Bob> OK. Speaking as an engineer I would like to know the units of measurement of “demand” and “capacity”?

<Hugh> Oh! Um. Let me think. Er. I have never been asked that question before. Help me out here Louise.  I told you Bob asks tricky questions!

<Louise> I think I see what Bob is getting at.  We use these terms frequently but rather loosely. On reflection they are not precisely defined, especially “capacity”. There are different sorts of capacity all of which will be measured in different ways so have different units. No wonder we spend so much time discussing and debating the question of if we have enough capacity to meet the demand.  We are probably all assuming different things.  Beds cannot be equated to staff, but too often we just seem to lump everything together when we talk about “capacity”.  So by doing that what we are really asking is “do we have enough cash in the budget to pay for the stuff we thing we need?”. And if we are failing one target or another we just assume that the answer is “No” and we shout for “more cash”.

<Bob> Exactly my point. And this was one of the warning bells.  Lack of clarity on these fundamental definitions opens up a minefield of other traps like the “Flaw of Averages” and “Time equals Money“.  And if we are making those errors then they will, unwittingly, become incorporated into our data analysis.

<Louise> But we use averages all the time! What is wrong with an average?

<Bob> I can sense you are feeling a bit defensive Louise.  There is no need to.  An average is perfectly OK and is very useful tool.  The “flaw” is when it is used inappropriately.  Have you heard of Little’s Law?

<Louise> No. What’s that?

<Bob> It is the mathematically proven relationship between flow, work-in-progress and lead time.  It is a fundamental law of flow physics and it uses averages. So averages are OK.

<Hugh> So what is the “Flaw of Averages”?

<Bob> It is easier to demonstrate it than to describe it.  Let us play a game.  I have some dice and we have a big bowl of peanuts.  Let us simulate a simple two step process.  Hugh you are Step One and Louise you are Step Two.  I will be the the source of demand.

I will throw a dice and count that many peanuts out of the bowl and pass them to Hugh.  Hugh, you then throw the dice and move that many peanuts from your heap to Louise, then Louise throws the dice and moves that many from her pile to the final heap which we will call activity.

<Hugh> Sounds easy enough.  If we all use the same dice then the average flow through each step will be the same so after say ten rounds we should have, um …

<Louise> … thirty five peanuts in the activity heap.  On average.

<Bob> OK.  That’s the theory, let’s see what happens in reality.  And no eating the nuts-in-progress please.


They play the game and after a few minutes they have completed the ten rounds.


<Hugh> That’s odd.  There are only 30 nuts in the activity heap and we expected 35.  Nobody nibbled any nuts so its just chance I suppose.  Lets play again. It should average out.

…..  …..

<Louise> Thirty four this time which is better, but is still below the predicted average.  That could still be a chance effect though.  Let us run the ‘nutty’ game this a few more times.

….. …..

<Hugh> We have run the same game six times with the same nuts and the same dice and we delivered activities of 30, 34, 30, 24, 23 and 31 and there are usually nuts stuck in the process at the end of each game, so it is not due to a lack of demand.  We are consistently under-performing compared with our theoretical prediction.  That is weird.  My head says we were just unlucky but I have a niggling doubt that there is more to it.

<Louise> Is this the Flaw of Averages?

<Bob> Yes, it is one of them. If we set our average future flow-capacity to the average historical demand and there is any variation anywhere in the process then we will see this effect.

<Hugh> H’mmm.  But we do this all the time because we assume that the variation will average out over time. Intuitively it must average out over time.  What would happen if we kept going for more cycles?

<Bob> That is a very good question.  And your intuition is correct.  It does average out eventually but there is a catch.

<Hugh> What is the catch?

<Bob>  The number of peanuts in the process and the time it takes for one peanut to get through is very variable.

<Louise> Is there any pattern to the variation? Is it predictable?

<Bob> Another excellent question.  Yes, there is a pattern.  It is called “chaos”.  Predictable chaos if you like.

<Hugh> So is that the reason you said on the phone that we should present our metrics as time-series charts?

<Bob> Yes, one of them.  The appearance of chaotic system behaviour is very characteristic on a time-series chart.

<Louise> And if we see the chaos pattern on our charts then we could conclude that we have made the Flaw of Averages error?

<Bob> That would be a reasonable hypothesis.

<Hugh> I think I understand the reason you invited us to a face-to-face demonstration.  It would not have worked if you had just described it.  You have to experience it because it feels so counter-intuitive.  And this is starting to feel horribly familiar; perpetual chaos about sums up my working week!

<Louise> You also mentioned something you referred to as the “time equals money” trap.  Is that somehow linked to this?

<Bob> Yes.  We often equate time and money but they do not behave the same way.  If have five pounds today and I only spend four pounds then I can save the remaining one pound for tomorrow and spend it then – so the Law of Averages works.  But if I have five minutes today and I only use four minutes then the other minute cannot be saved and used tomorrow, it is lost forever.  That is why the Law of Averages does not work for time.

<Hugh> But that means if we set our budgets based on the average demand and the cost of people’s time then not only will we have queues, delays and chaos, we will also consistently overspend the budget too.  This is sounding more and more familiar by the minute!  This is nuts, if you will excuse the pun.

<Louise> So what is the solution?  I hope you would not have invited us here if there was no solution.

<Bob> Part of the solution is to develop our knowledge of system behaviour and how we need to present it in a visual format. With that we develop a deeper understanding of what the system behaviour charts are saying to us.  With that we can develop our ability to make wiser decisions that will lead to effective actions which will eliminate the queues, delays, chaos and cost-pressures.

<Hugh> This is possible?

<Bob> Yes. It is called systems engineering. That’s what I do.

<Louise> When do we start?

<Bob> We have started.

How Do We Know We Have Improved?

Phil and Pete are having a coffee and a chat.  They both work in the NHS and have been friends for years.

They have different jobs. Phil is a commissioner and an accountant by training, Pete is a consultant and a doctor by training.

They are discussing a challenge that affects them both on a daily basis: unscheduled care.

Both Phil and Pete want to see significant and sustained improvements and how to achieve them is often the focus of their coffee chats.


<Phil> We are agreed that we both want improvement, both from my perspective as a commissioner and from your perspective as a clinician. And we agree that what we want to see improvements in patient safety, waiting, outcomes, experience for both patients and staff, and use of our limited NHS resources.

<Pete> Yes. Our common purpose, the “what” and “why”, has never been an issue.  Where we seem to get stuck is the “how”.  We have both tried many things but, despite our good intentions, it feels like things are getting worse!

<Phil> I agree. It may be that what we have implemented has had a positive impact and we would have been even worse off if we had done nothing. But I do not know. We clearly have much to learn and, while I believe we are making progress, we do not appear to be learning fast enough.  And I think this knowledge gap exposes another “how” issue: After we have intervened, how do we know that we have (a) improved, (b) not changed or (c) worsened?

<Pete> That is a very good question.  And all that I have to offer as an answer is to share what we do in medicine when we ask a similar question: “How do I know that treatment A is better than treatment B?”  It is the essence of medical research; the quest to find better treatments that deliver better outcomes and at lower cost.  The similarities are strong.

<Phil> OK. How do you do that? How do you know that “Treatment A is better than Treatment B” in a way that anyone will trust the answer?

 <Pete> We use a science that is actually very recent on the scientific timeline; it was only firmly established in the first half of the 20th century. One reason for that is that it is rather a counter-intuitive science and for that reason it requires using tools that have been designed and demonstrated to work but which most of us do not really understand how they work. They are a bit like magic black boxes.

<Phil> H’mm. Please forgive me for sounding skeptical but that sounds like a big opportunity for making mistakes! If there are lots of these “magic black box” tools then how do you decide which one to use and how do you know you have used it correctly?

<Pete> Those are good questions! Very often we don’t know and in our collective confusion we generate a lot of unproductive discussion.  This is why we are often forced to accept the advice of experts but, I confess, very often we don’t understand what they are saying either! They seem like the medieval Magi.

<Phil> H’mm. So these experts are like ‘magicians’ – they claim to understand the inner workings of the black magic boxes but are unable, or unwilling, to explain in a language that a ‘muggle’ would understand?

<Pete> Very well put. That is just how it feels.

<Phil> So can you explain what you do understand about this magical process? That would be a start.


<Pete> OK, I will do my best.  The first thing we learn in medical research is that we need to be clear about what it is we are looking to improve, and we need to be able to measure it objectively and accurately.

<Phil> That  makes sense. Let us say we want to improve the patient’s subjective quality of the A&E experience and objectively we want to reduce the time they spend in A&E. We measure how long they wait. 

<Pete> The next thing is that we need to decide how much improvement we need. What would be worthwhile? So in the example you have offered we know that reducing the average time patients spend in A&E by just 30 minutes would have a significant effect on the quality of the patient and staff experience, and as a by-product it would also dramatically improve the 4-hour target performance.

<Phil> OK.  From the commissioning perspective there are lots of things we can do, such as commissioning alternative paths for specific groups of patients; in effect diverting some of the unscheduled demand away from A&E to a more appropriate service provider.  But these are the sorts of thing we have been experimenting with for years, and it brings us back to the question: How do we know that any change we implement has had the impact we intended? The system seems, well, complicated.

<Pete> In medical research we are very aware that the system we are changing is very complicated and that we do not have the power of omniscience.  We cannot know everything.  Realistically, all we can do is to focus on objective outcomes and collect small samples of the data ocean and use those in an attempt to draw conclusions can trust. We have to design our experiment with care!

<Phil> That makes sense. Surely we just need to measure the stuff that will tell us if our impact matches our intent. That sounds easy enough. What’s the problem?

<Pete> The problem we encounter is that when we measure “stuff” we observe patient-to-patient variation, and that is before we have made any changes.  Any impact that we may have is obscured by this “noise”.

<Phil> Ah, I see.  So if the our intervention generates a small impact then it will be more difficult to see amidst this background noise. Like trying to see fine detail in a fuzzy picture.

<Pete> Yes, exactly like that.  And it raises the issue of “errors”.  In medical research we talk about two different types of error; we make the first type of error when our actual impact is zero but we conclude from our data that we have made a difference; and we make the second type of error when we have made an impact but we conclude from our data that we have not.

<Phil> OK. So does that imply that the more “noise” we observe in our measure for-improvement before we make the change, the more likely we are to make one or other error?

<Pete> Precisely! So before we do the experiment we need to design it so that we reduce the probability of making both of these errors to an acceptably low level.  So that we can be assured that any conclusion we draw can be trusted.

<Phil> OK. So how exactly do you do that?

<Pete> We know that whenever there is “noise” and whenever we use samples then there will always be some risk of making one or other of the two types of error.  So we need to set a threshold for both. We have to state clearly how much confidence we need in our conclusion. For example, we often use the convention that we are willing to accept a 1 in 20 chance of making the Type I error.

<Phil> Let me check if I have heard you correctly. Suppose that, in reality, our change has no impact and we have set the risk threshold for a Type 1 error at 1 in 20, and suppose we repeat the same experiment 100 times – are you saying that we should expect about five of our experiments to show data that says our change has had the intended impact when in reality it has not?

<Pete> Yes. That is exactly it.

<Phil> OK.  But in practice we cannot repeat the experiment 100 times, so we just have to accept the 1 in 20 chance that we will make a Type 1 error, and we won’t know we have made it if we do. That feels a bit chancy. So why don’t we just set the threshold to 1 in 100 or 1 in 1000?

<Pete> We could, but doing that has a consequence.  If we reduce the risk of making a Type I error by setting our threshold lower, then we will increase the risk of making a Type II error.

<Phil> Ah! I see. The old swings-and-roundabouts problem. By the way, do these two errors have different names that would make it  easier to remember and to explain?

<Pete> Yes. The Type I error is called a False Positive. It is like concluding that a patient has a specific diagnosis when in reality they do not.

<Phil> And the Type II error is called a False Negative?

<Pete> Yes.  And we want to avoid both of them, and to do that we have to specify a separate risk threshold for each error.  The convention is to call the threshold for the false positive the alpha level, and the threshold for the false negative the beta level.

<Phil> OK. So now we have three things we need to be clear on before we can do our experiment: the size of the change that we need, the risk of the false positive that we are willing to accept, and the risk of a false negative that we are willing to accept.  Is that all we need?

<Pete> In medical research we learn that we need six pieces of the experimental design jigsaw before we can proceed. We only have three pieces so far.

<Phil> What are the other three pieces then?

<Pete> We need to know the average value of the metric we are intending to improve, because that is our baseline from which improvement is measured.  Improvements are often framed as a percentage improvement over the baseline.  And we need to know the spread of the data around that average, the “noise” that we referred to earlier.

<Phil> Ah, yes!  I forgot about the noise.  But that is only five pieces of the jigsaw. What is the last piece?

<Pete> The size of the sample.

<Phil> Eh?  Can’t we just go with whatever data we can realistically get?

<Pete> Sadly, no.  The size of the sample is how we control the risk of a false negative error.  The more data we have the lower the risk. This is referred to as the power of the experimental design.

<Phil> OK. That feels familiar. I know that the more experience I have of something the better my judgement gets. Is this the same thing?

<Pete> Yes. Exactly the same thing.

<Phil> OK. So let me see if I have got this. To know if the impact of the intervention matches our intention we need to design our experiment carefully. We need all six pieces of the experimental design jigsaw and they must all fall inside our circle of control. We can measure the baseline average and spread; we can specify the impact we will accept as useful; we can specify the risks we are prepared to accept of making the false positive and false negative errors; and we can collect the required amount of data after we have made the intervention so that we can trust our conclusion.

<Pete> Perfect! That is how we are taught to design research studies so that we can trust our results, and so that others can trust them too.

<Phil> So how do we decide how big the post-implementation data sample needs to be? I can see we need to collect enough data to avoid a false negative but we have to be pragmatic too. There would appear to be little value in collecting more data than we need. It would cost more and could delay knowing the answer to our question.

<Pete> That is precisely the trap than many inexperienced medical researchers fall into. They set their sample size according to what is achievable and affordable, and then they hope for the best!

<Phil> Well, we do the same. We analyse the data we have and we hope for the best.  In the magical metaphor we are asking our data analysts to pull a white rabbit out of the hat.  It sounds rather irrational and unpredictable when described like that! Have medical researchers learned a way to avoid this trap?

<Pete> Yes, it is a tool called a power calculator.

<Phil> Ooooo … a power tool … I like the sound of that … that would be a cool tool to have in our commissioning bag of tricks. It would be like a magic wand. Do you have such a thing?

<Pete> Yes.

<Phil> And do you understand how the power tool magic works well enough to explain to a “muggle”?

<Pete> Not really. To do that means learning some rather unfamiliar language and some rather counter-intuitive concepts.

<Phil> Is that the magical stuff I hear lurks between the covers of a medical statistics textbook?

<Pete> Yes. Scary looking mathematical symbols and unfathomable spells!

<Phil> Oh dear!  Is there another way for to gain a working understanding of this magic? Something a bit more pragmatic? A path that a ‘statistical muggle’ might be able to follow?

<Pete> Yes. It is called a simulator.

<Phil> You mean like a flight simulator that pilots use to learn how to control a jumbo jet before ever taking a real one out for a trip?

<Pete> Exactly like that.

<Phil> Do you have one?

<Pete> Yes. It was how I learned about this “stuff” … pragmatically.

<Phil> Can you show me?

<Pete> Of course.  But to do that we will need a bit more time, another coffee, and maybe a couple of those tasty looking Danish pastries.

<Phil> A wise investment I’d say.  I’ll get the the coffee and pastries, if you fire up the engines of the simulator.

Outliers

reading_a_book_pa_150_wht_3136An effective way to improve is to learn from others who have demonstrated the capability to achieve what we seek.  To learn from success.

Another effective way to improve is to learn from those who are not succeeding … to learn from failures … and that means … to learn from our own failings.

But from an early age we are socially programmed with a fear of failure.

The training starts at school where failure is not tolerated, nor is challenging the given dogma.  Paradoxically, the effect of our fear of failure is that our ability to inquire, experiment, learn, adapt, and to be resilient to change is severely impaired!

So further failure in the future becomes more likely, not less likely. Oops!


Fortunately, we can develop a healthier attitude to failure and we can learn how to harness the gap between intent and impact as a source of energy, creativity, innovation, experimentation, learning, improvement and growing success.

And health care provides us with ample opportunities to explore this unfamiliar terrain. The creative domain of the designer and engineer.


The scatter plot below is a snapshot of the A&E 4 hr target yield for all NHS Trusts in England for the month of July 2016.  The required “constitutional” performance requirement is better than 95%.  The delivered whole system average is 85%.  The majority of Trusts are failing, and the Trust-to-Trust variation is rather wide. Oops!

This stark picture of the gap between intent (95%) and impact (85%) prompts some uncomfortable questions:

Q1: How can one Trust achieve 98% and yet another can do no better than 64%?

Q2: What can all Trusts learn from these high and low flying outliers?

[NB. I have not asked the question “Who should we blame for the failures?” because the name-shame-blame-game is also a predictable consequence of our fear-of-failure mindset.]


Let us dig a bit deeper into the information mine, and as we do that we need to be aware of a trap:

A snapshot-in-time tells us very little about how the system and the set of interconnected parts is behaving-over-time.

We need to examine the time-series charts of the outliers, just as we would ask for the temperature, blood pressure and heart rate charts of our patients.

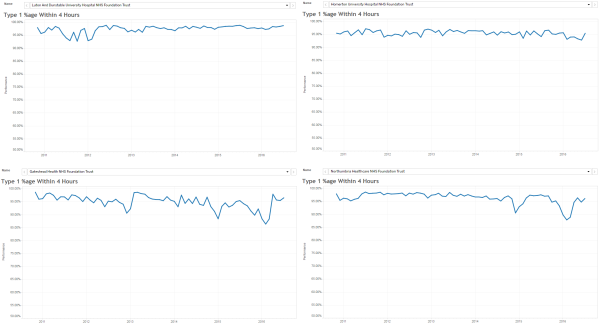
Here are the last six years by month A&E 4 hr charts for a sample of the high-fliers. They are all slightly different and we get the impression that the lower two are struggling more to stay aloft more than the upper two … especially in winter.


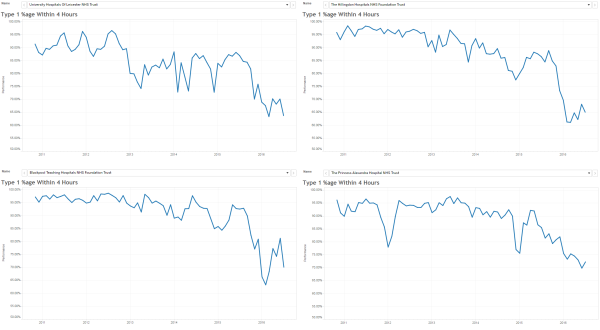
And here are the last six years by month A&E 4 hr charts for a sample of the low-fliers.  The Mark I Eyeball Test results are clear … these swans are falling out of the sky!


So we need to generate some testable hypotheses to explain these visible differences, and then we need to examine the available evidence to test them.

One hypothesis is “rising demand”.  It says that “the reason our A&E is failing is because demand on A&E is rising“.

Another hypothesis is “slow flow”.  It says that “the reason our A&E is failing is because of the slow flow through the hospital because of delayed transfers of care (DTOCs)“.

So, if these hypotheses account for the behaviour we are observing then we would predict that the “high fliers” are (a) diverting A&E arrivals elsewhere, and (b) reducing admissions to free up beds to hold the DTOCs.

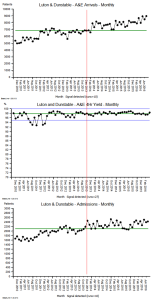
Let us look at the freely available data for the highest flyer … the green dot on the scatter gram … code-named “RC9”.

The top chart is the A&E arrivals per month.

The middle chart is the A&E 4 hr target yield per month.

The bottom chart is the emergency admissions per month.

Both arrivals and admissions are increasing, while the A&E 4 hr target yield is rock steady!

And arranging the charts this way allows us to see the temporal patterns more easily (and the images are deliberately arranged to show the overall pattern-over-time).

Patterns like the change-for-the-better that appears in the middle of the winter of 2013 (i.e. when many other trusts were complaining that their sagging A&E performance was caused by “winter pressures”).

The objective evidence seems to disprove the “rising demand”, “slow flow” and “winter pressure” hypotheses!

So what can we learn from our failure to adequately explain the reality we are seeing?


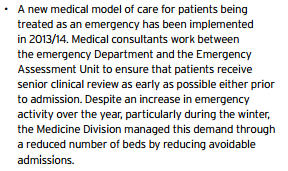
The trust code-named “RC9” is Luton and Dunstable, and it is an average district general hospital, on the surface.  So to reveal some clues about what actually happened there, we need to read their Annual Report for 2013-14.  It is a public document and it can be downloaded here.

This is just a snippet …

… and there are lots more knowledge nuggets like this in there …

… it is a treasure trove of well-known examples of good system flow design.

The results speak for themselves!


Q: How many black swans does it take to disprove the hypothesis that “all swans are white”.

A: Just one.

“RC9” is a black swan. An outlier. A positive deviant. “RC9” has disproved the “impossibility” hypothesis.

And there is another flock of black swans living in the North East … in the Newcastle area … so the “Big cities are different” hypothesis does not hold water either.


The challenge here is a human one.  A human factor.  Our learned fear of failure.

Learning-how-to-fail is the way to avoid failing-how-to-learn.

And to read more about that radical idea I strongly recommend reading the recently published book called Black Box Thinking by Matthew Syed.

It starts with a powerful story about the impact of human factors in health care … and here is a short video of Martin Bromiley describing what happened.

The “black box” that both Martin and Matthew refer to is the one that is used in air accident investigations to learn from what happened, and to use that learning to design safer aviation systems.

Martin Bromiley has founded a charity to support the promotion of human factors in clinical training, the Clinical Human Factors Group.

So if we can muster the courage and humility to learn how to do this in health care for patient safety, then we can also learn to how do it for flow, quality and productivity.

Our black swan called “RC9” has demonstrated that this goal is attainable.

And the body of knowledge needed to do this already exists … it is called Health and Social Care Systems Engineering (HSCSE).


For more posts like this please vote here.
For more information please subscribe here.
To email the author please click here.


Postscript: And I am pleased to share that Luton & Dunstable features in the House of Commons Health Committee report entitled Winter Pressures in A&E Departments that was published on 3rd Nov 2016.

Here is part of what L&D shared to explain their deviant performance:

luton_nuggets

These points describe rather well the essential elements of a pull design, which is the antidote to the rather more prevalent pressure cooker design.

DIKUW

This 100 second video of the late Russell Ackoff is solid gold!

In it he describes the DIKUW hierarchy – data, information, knowledge, understanding and wisdom – and how it is critical to put effectiveness before efficiency.

A wise objective is a purpose … the intended outcome … and a well designed system will be both effective and efficient.  That is the engineers definition of productivity.  Doing the right thing first, and doing it right second.

So how do we transform data into wisdom? What are needs to be added or taken away? What is the process?

Data is what we get from our senses.

To convert data into information we add context.

To convert information into knowledge we use memory.

To convert knowledge into understanding we need to learn-by-doing.

And the test of understanding is to be able to teach someone else what we know and to be able to support them developing an understanding through practice.

To convert understanding into wisdom requires years of experience of seeing, doing and teaching.

There are no short cuts.

So the sooner we start learning-by-doing the quicker we will develop the wisdom of purpose, and the understanding of process.


For more posts like this please vote here.
For more information please subscribe here.

Bloodsucking Bugs

BloodSuckerThis is a magnified picture of a blood sucking bug called a Red Poultry Mite.

They go red after having gorged themselves on chicken blood.

Their life-cycle is only 7 days so, when conditions are just right, they can quickly cause an infestation – and one that is remarkably difficult to eradicate!  But if it is not dealt with then chicken coop productivity will plummet.


We use the term “bug” for something else … a design error … in a computer program for example.  If the conditions are just right, then software bugs can spread too and can infest a computer system.  They feed on the hardware resources – slurping up processor time and memory space until the whole system slows to a crawl.


And one especially pernicious type of system design error is called an Error of Omission.  These are the things we do not do that would prevent the bloodsucking bugs from breeding and spreading.

Prevention is better than cure.


In the world of health care improvement there are some blood suckers out there, ones who home in on a susceptible host looking for a safe place to establish a colony.  They are masters of the art of mimicry.  They look like and sound like something they are not … they claim to be symbiotic whereas in reality they are parasitic.

The clue to their true nature is that their impact does not match their intent … but by the time that gap is apparent they are entrenched and their spores have already spread.

Unlike the Red Poultry Mites, we do not want to eradicate them … we need to educate them. They only behave like parasites because they are missing a few essential bits of software.  And once those upgrades are installed they can achieve their potential and become symbiotic.

So, let me introduce them, they are called Len, Siggy and Tock and here is their story:

Six Ways Not To Improve Flow

Early Warning System

radar_screen_anim_300_clr_11649The most useful tool that a busy operational manager can have is a reliable and responsive early warning system (EWS).

One that alerts when something is changing and that, if missed or ignored, will cause a big headache in the future.

Rather like the radar system on an aircraft that beeps if something else is approaching … like another aircraft or the ground!


Operational managers are responsible for delivering stuff on time.  So they need a radar that tells them if they are going to deliver-on-time … or not.

And their on-time-delivery EWS needs to alert them soon enough that they have time to diagnose the ‘threat’, design effective plans to avoid it, decide which plan to use, and deliver it.

So what might an effective EWS for a busy operational manager look like?

  1. It needs to be reliable. No missed threats or false alarms.
  2. It needs to be visible. No tomes of text and tables of numbers.
  3. It needs to be simple. Easy to learn and quick to use.

And what is on offer at the moment?

The RAG Chart
This is a table that is coloured red, amber and green. Red means ‘failing’, green means ‘not failing’ and amber means ‘not sure’.  So this meets the specification of visible and simple, but it is reliable?

It appears not.  RAG charts do not appear to have helped to solve the problem.

A RAG chart is generated using historic data … so it tells us where we are now, not how we got here, where we are going or what else is heading our way.  It is a snapshot. One frame from the movie.  Better than complete blindness perhaps, but not much.

The SPC Chart
This is a statistical process control chart and is a more complicated beast.  It is a chart of how some measure of performance has changed over time in the past.  So like the RAG chart it is generated using historic data.  The advantage is that it is not just a snapshot of where were are now, it is a picture of story of how we got to where we are, so it offers the promise of pointing to where we may be heading.  It meets the specification of visible, and while more complicated than a RAG chart, it is relatively easy to learn and quick to use.

Luton_A&E_4Hr_YieldHere is an example. It is the SPC  chart of the monthly A&E 4-hour target yield performance of an acute NHS Trust.  The blue lines are the ‘required’ range (95% to 100%), the green line is the average and the red lines are a measure of variation over time.  What this charts says is: “This hospital’s A&E 4-hour target yield performance is currently acceptable, has been so since April 2012, and is improving over time.”

So that is much more helpful than a RAG chart (which in this case would have been green every month because the average was above the minimum acceptable level).


So why haven’t SPC charts replaced RAG charts in every NHS Trust Board Report?

Could there be a fly-in-the-ointment?

The answer is “Yes” … there is.

SPC charts are a quality audit tool.  They were designed nearly 100 years ago for monitoring the output quality of a process that is already delivering to specification (like the one above).  They are designed to alert the operator to early signals of deterioration, called ‘assignable cause signals’, and they prompt the operator to pay closer attention and to investigate plausible causes.

SPC charts are not designed for predicting if there is a flow problem looming over the horizon.  They are not designed for flow metrics that exhibit expected cyclical patterns.  They are not designed for monitoring metrics that have very skewed distributions (such as length of stay).  They are not designed for metrics where small shifts generate big cumulative effects.  They are not designed for metrics that change more slowly than the frequency of measurement.

And these are exactly the sorts of metrics that a busy operational manager needs to monitor, in reality, and in real-time.

Demand and activity both show strong cyclical patterns.

Lead-times (e.g. length of stay) are often very skewed by variation in case-mix and task-priority.

Waiting lists are like bank accounts … they show the cumulative sum of the difference between inflow and outflow.  That simple fact invalidates the use of the SPC chart.

Small shifts in demand, activity, income and expenditure can lead to big cumulative effects.

So if we abandon our RAG charts and we replace them with SPC charts … then we climb out of the RAG frying pan and fall into the SPC fire.

Oops!  No wonder the operational managers and financial controllers have not embraced SPC.


So is there an alternative that works better?  A more reliable EWS that busy operational managers and financial controllers can use?

Yes, there is, and here is a clue …

… but tread carefully …

… building one of these Flow-Productivity Early Warning Systems is not as obvious as it might first appear.  There are counter-intuitive traps for the unwary and the untrained.

You may need the assistance of a health care systems engineer (HCSE).

The Capstan

CapstanA capstan is a simple machine for combining the effort of many people and enabling them to achieve more than any of them could do alone.

The word appears to have come into English from the Portuguese and Spanish sailors at around the time of the Crusades.

Each sailor works independently of the others. There is no requirement them to be equally strong because the capstan will combine their efforts.  And the capstan also serves as a feedback loop because everyone can sense when someone else pushes harder or slackens off.  It is an example of simple, efficient, effective, elegant design.


In the world of improvement we also need simple, efficient, effective and elegant ways to combine the efforts of many in achieving a common purpose.  Such as raising the standards of excellence and weighing the anchors of resistance.

In health care improvement we have many simultaneous constraints and we have many stakeholders with specific perspectives and special expertise.

And if we are not careful they will tend to pull only in their preferred direction … like a multi-way tug-o-war.  The result?  No progress and exhausted protagonists.

There are those focused on improving productivity – Team Finance.

There are those focused on improving delivery – Team Operations.

There are those focused on improving safety – Team Governance.

And we are all tasked with improving quality – Team Everyone.

So we need a synergy machine that works like a capstan-of-old, and here is one design.

Engine_Of_ExcellenceIt has four poles and it always turns in a clockwise direction, so the direction of push is clear.

And when all the protagonists push in the same direction, they will get their own ‘win’ and also assist the others to make progress.

This is how the sails of success are hoisted to catch the wind of change; and how the anchors of anxiety are heaved free of the rocks of fear; and how the bureaucratic bilge is pumped overboard to lighten our load and improve our speed and agility.

And the more hands on the capstan the quicker we will achieve our common goal.

Collective excellence.

Undiscussables

Chimp_NoHear_NoSee_NoSpeakLast week I shared a link to Dr Don Berwick’s thought provoking presentation at the Healthcare Safety Congress in Sweden.

Near the end of the talk Don recommended six books, and I was reassured that I already had read three of them. Naturally, I was curious to read the other three.

One of the unfamiliar books was “Overcoming Organizational Defenses” by the late Chris Argyris, a professor at Harvard.  I confess that I have tried to read some of his books before, but found them rather difficult to understand.  So I was intrigued that Don was recommending it as an ‘easy read’.  Maybe I am more of a dimwit that I previously believed!  So fear of failure took over my inner-chimp and I prevaricated. I flipped into denial. Who would willingly want to discover the true depth of their dimwittedness!


Later in the week, I was forwarded a copy of a recently published paper that was on a topic closely related to a key thread in Dr Don’s presentation:

understanding variation.

The paper was by researchers who had looked at the Board reports of 30 randomly selected NHS Trusts to examine how information on safety and quality was being shared and used.  They were looking for evidence that the Trust Boards understood the importance of variation and the need to separate ‘signal’ from ‘noise’ before making decisions on actions to improve safety and quality performance.  This was a point Don had stressed too, so there was a link.

The randomly selected Trust Board reports contained 1488 charts, of which only 88 demonstrated the contribution of chance effects (i.e. noise). Of these, 72 showed the Shewhart-style control charts that Don demonstrated. And of these, only 8 stated how the control limits were constructed (which is an essential requirement for the chart to be meaningful and useful).

That is a validity yield of 8 out of 1488, or 0.54%, which is for all practical purposes zero. Oh dear!


This chance combination of apparently independent events got me thinking.

Q1: What is the reason that NHS Trust Boards do not use these signal-and-noise separation techniques when it has been demonstrated, for at least 12 years to my knowledge, that they are very effective for facilitating improvement in healthcare? (e.g. Improving Healthcare with Control Charts by Raymond G. Carey was published in 2003).

Q2: Is there some form of “organizational defense” system in place that prevents NHS Trust Boards from learning useful ‘new’ knowledge?


So I surfed the Web to learn more about Chris Argyris and to explore in greater depth his concept of Single Loop and Double Loop learning.  I was feeling like a dimwit again because to me it is not a very descriptive title!  I suspect it is not to many others too.

I sensed that I needed to translate the concept into the language of healthcare and this is what emerged.

Single Loop learning is like treating the symptoms and ignoring the disease.

Double Loop learning is diagnosing the underlying disease and treating that.


So what are the symptoms?
The pain of NHS Trust  failure on all dimensions – safety, delivery, quality and productivity (i.e. affordability for a not-for-profit enterprise).

And what are the signs?
The tell-tale sign is more subtle. It’s what is not present that is important. A serious omission. The missing bits are valid time-series charts in the Trust Board reports that show clearly what is signal and what is noise. This diagnosis is critical because the strategies for addressing them are quite different – as Julian Simcox eloquently describes in his latest essay.  If we get this wrong and we act on our unwise decision, then we stand a very high chance of making the problem worse, and demoralizing ourselves and our whole workforce in the process! Does that sound familiar?

And what is the disease?
Undiscussables.  Emotive subjects that are too taboo to table in the Board Room.  And the issue of what is discussable is one of the undiscussables so we have a self-sustaining system.  Anyone who attempts to discuss an undiscussable is breaking an unspoken social code.  Another undiscussable is behaviour, and our social code is that we must not upset anyone so we cannot discuss ‘difficult’ issues.  But by avoiding the issue (the undiscussable disease) we fail to address the root cause and end up upsetting everyone.  We achieve exactly what we are striving to avoid, which is the technical definition of incompetence.  And Chris Argyris labelled this as ‘skilled incompetence’.


Does an apparent lack of awareness of what is already possible fully explain why NHS Trust Boards do not use the tried-and-tested tool called a system behaviour chart to help them diagnose, design and deliver effective improvements in safety, flow, quality and productivity?

Or are there other forces at play as well?

Some deeper undiscussables perhaps?

Culture – cause or effect?

The Harvard Business Review is worth reading because many of its articles challenge deeply held assumptions, and then back up the challenge with the pragmatic experience of those who have succeeded to overcome the limiting beliefs.

So the heading on the April 2016 copy that awaited me on my return from an Easter break caught my eye: YOU CAN’T FIX CULTURE.


HBR_April_2016

The successful leaders of major corporate transformations are agreed … the cultural change follows the technical change … and then the emergent culture sustains the improvement.

The examples presented include the Ford Motor Company, Delta Airlines, Novartis – so these are not corporate small fry!

The evidence suggests that the belief of “we cannot improve until the culture changes” is the mantra of failure of both leadership and management.


A health care system is characterised by a culture of risk avoidance. And for good reason. It is all too easy to harm while trying to heal!  Primum non nocere is a core tenet – first do no harm.

But, change and improvement implies taking risks – and those leaders of successful transformation know that the bigger risk by far is to become paralysed by fear and to do nothing.  Continual learning from many small successes and many small failures is preferable to crisis learning after a catastrophic failure!

The UK healthcare system is in a state of chronic chaos.  The evidence is there for anyone willing to look.  And waiting for the NHS culture to change, or pushing for culture change first appears to be a guaranteed recipe for further failure.

The HBR article suggests that it is better to stay focussed; to work within our circles of control and influence; to learn from others where knowledge is known, and where it is not – to use small, controlled experiments to explore new ground.


And I know this works because I have done it and I have seen it work.  Just by focussing on what is important to every member on the team; focussing on fixing what we could fix; not expecting or waiting for outside help; gathering and sharing the feedback from patients on a continuous basis; and maintaining patient and team safety while learning and experimenting … we have created a micro-culture of high safety, high efficiency, high trust and high productivity.  And we have shared the evidence via JOIS.

The micro-culture required to maintain the safety, flow, quality and productivity improvements emerged and evolved along with the improvements.

It was part of the effect, not the cause.


So the concept of ‘fix the system design flaws and the continual improvement culture will emerge’ seems to work at macro-system and at micro-system levels.

We just need to learn how to diagnose and treat healthcare system design flaws. And that is known knowledge.

So what is the next excuse?  Too busy?

Grit in the Oyster

Pearl_and_OysterThe word pearl is a metaphor for something rare, beautiful, and valuable.

Pearls are formed inside the shell of certain mollusks as a defense mechanism against a potentially threatening irritant.

The mollusk creates a pearl sac to seal off the irritation.


And so it is with change and improvement.  The growth of precious pearls of improvement wisdom – the ones that develop slowly over time – are triggered by an irritant.

Someone asking an uncomfortable question perhaps, or presenting some information that implies that an uncomfortable question needs to be asked.


About seven years ago a question was asked “Would improving healthcare flow and quality result in lower costs?”

It is a good question because some believe that it would and some believe that it would not.  So an experiment to test the hypothesis was needed.

The Health Foundation stepped up to the challenge and funded a three year project to find the answer. The design of the experiment was simple. Take two oysters and introduce an irritant into them and see if pearls of wisdom appeared.

The two ‘oysters’ were Sheffield Hospital and Warwick Hospital and the irritant was Dr Kate Silvester who is a doctor and manufacturing system engineer and who has a bit-of-a-reputation for asking uncomfortable questions and backing them up with irrefutable information.


Two rare and precious pearls did indeed grow.

In Sheffield, it was proved that by improving the design of their elderly care process they improved the outcome for their frail, elderly patients.  More went back to their own homes and fewer left via the mortuary.  That was the quality and safety improvement. They also showed a shorter length of stay and a reduction in the number of beds needed to store the work in progress.  That was the flow and productivity improvement.

What was interesting to observe was how difficult it was to get these profoundly important findings published.  It appeared that a further irritant had been created for the academic peer review oyster!

The case study was eventually published in Age and Aging 2014; 43: 472-77.

The pearl that grew around this seed is the Sheffield Microsystems Academy.


In Warwick, it was proved that the A&E 4 hour performance could be improved by focussing on improving the design of the processes within the hospital, downstream of A&E.  For example, a redesign of the phlebotomy and laboratory process to ensure that clinical decisions on a ward round are based on todays blood results.

This specific case study was eventually published as well, but by a different path – one specifically designed for sharing improvement case studies – JOIS 2015; 22:1-30

And the pearls of wisdom that developed as a result of irritating many oysters in the Warwick bed are clearly described by Glen Burley, CEO of Warwick Hospital NHS Trust in this recent video.


Getting the results of all these oyster bed experiments published required irritating the Health Foundation oyster … but a pearl grew there too and emerged as the full Health Foundation report which can be downloaded here.


So if you want to grow a fistful of improvement and a bagful of pearls of wisdom … then you will need to introduce a bit of irritation … and Dr Kate Silvester is a proven source of grit for your oyster!

The Cost of Chaos

british_pound_money_three_bundled_stack_400_wht_2425This week I conducted an experiment – on myself.

I set myself the challenge of measuring the cost of chaos, and it was tougher than I anticipated it would be.

It is easy enough to grasp the concept that fire-fighting to maintain patient safety amidst the chaos of healthcare would cost more in terms of tears and time …

… but it is tricky to translate that concept into hard numbers; i.e. cash.


Chaos is an emergent property of a system.  Safety, delivery, quality and cost are also emergent properties of a system. We can measure cost, our finance departments are very good at that. We can measure quality – we just ask “How did your experience match your expectation”.  We can measure delivery – we have created a whole industry of access target monitoring.  And we can measure safety by checking for things we do not want – near misses and never events.

But while we can feel the chaos we do not have an easy way to measure it. And it is hard to improve something that we cannot measure.


So the experiment was to see if I could create some chaos, then if I could calm it, and then if I could measure the cost of the two designs – the chaotic one and the calm one.  The difference, I reasoned, would be the cost of the chaos.

And to do that I needed a typical chunk of a healthcare system: like an A&E department where the relationship between safety, flow, quality and productivity is rather important (and has been a hot topic for a long time).

But I could not experiment on a real A&E department … so I experimented on a simplified but realistic model of one. A simulation.

What I discovered came as a BIG surprise, or more accurately a sequence of big surprises!

  1. First I discovered that it is rather easy to create a design that generates chaos and danger.  All I needed to do was to assume I understood how the system worked and then use some averaged historical data to configure my model.  I could do this on paper or I could use a spreadsheet to do the sums for me.
  2. Then I discovered that I could calm the chaos by reactively adding lots of extra capacity in terms of time (i.e. more staff) and space (i.e. more cubicles).  The downside of this approach was that my costs sky-rocketed; but at least I had restored safety and calm and I had eliminated the fire-fighting.  Everyone was happy … except the people expected to foot the bill. The finance director, the commissioners, the government and the tax-payer.
  3. Then I got a really big surprise!  My safe-but-expensive design was horribly inefficient.  All my expensive resources were now running at rather low utilisation.  Was that the cost of the chaos I was seeing? But when I trimmed the capacity and costs the chaos and danger reappeared.  So was I stuck between a rock and a hard place?
  4. Then I got a really, really big surprise!!  I hypothesised that the root cause might be the fact that the parts of my system were designed to work independently, and I was curious to see what happened when they worked interdependently. In synergy. And when I changed my design to work that way the chaos and danger did not reappear and the efficiency improved. A lot.
  5. And the biggest surprise of all was how difficult this was to do in my head; and how easy it was to do when I used the theory, techniques and tools of Improvement-by-Design.

So if you are curious to learn more … I have written up the full account of the experiment with rationale, methods, results, conclusions and references and I have published it here.

New Meat for Old Bones

FreshMeatOldBonesEvolution is an amazing process.

Using the same building blocks that have been around for a lot time, it cooks up innovative permutations and combinations that reveal new and ever more useful properties.

Very often a breakthrough in understanding comes from a simplification, not from making it more complicated.

Knowledge evolves in just the same way.

Sometimes a well understood simplification in one branch of science is used to solve an ‘impossible’ problem in another.

Cross-fertilisation of learning is a healthy part of the evolution process.


Improvement implies evolution of knowledge and understanding, and then application of that insight in the process of designing innovative ways of doing things better.


And so it is in healthcare.  For many years the emphasis on healthcare improvement has been the Safety-and-Quality dimension, and for very good reasons.  We need to avoid harm and we want to achieve happiness; for everyone.

But many of the issues that plague healthcare systems are not primarily SQ issues … they are flow and productivity issues. FP. The safety and quality problems are secondary – so only focussing on them is treating the symptoms and not the cause.  We need to balance the wheel … we need flow science.


Fortunately the science of flow is well understood … outside healthcare … but apparently not so well understood inside healthcare … given the queues, delays and chaos that seem to have become the expected norm.  So there is a big opportunity for cross fertilisation here.  If we choose to make it happen.


For example, from computer science we can borrow the knowledge of how to schedule tasks to make best use of our finite resources and at the same time avoid excessive waiting.

It is a very well understood science. There is comprehensive theory, a host of techniques, and fit-for-purpose tools that we can pick of the shelf and use. Today if we choose to.

So what are the reasons we do not?

Is it because healthcare is quite introspective?

Is it because we believe that there is something ‘special’ about healthcare?

Is it because there is no evidence … no hard proof … no controlled trials?

Is it because we assume that queues are always caused by lack of resources?

Is it because we do not like change?

Is it because we do not like to admit that we do not know stuff?

Is it because we fear loss of face?


Whatever the reasons the evidence and experience shows that most (if not all) the queues, delays and chaos in healthcare systems are iatrogenic.

This means that they are self-generated. And that implies we can un-self-generate them … at little or no cost … if only we knew how.

The only cost is to our egos of having to accept that there is knowledge out there that we could use to move us in the direction of excellence.

New meat for our old bones?

The Bit In The Middle

RIA_graphicA question that is often asked by doctors in particular is “What is the difference between Research, Audit and Improvement Science?“.

It is a very good question and the diagram captures the essence of the answer.

Improvement science is like a bridge between research and audit.

To understand why that is we first need to ask a different question “What are the purposes of research, improvement science and audit? What do they do?

In a nutshell:

Research provides us with new knowledge and tells us what the right stuff is.
Improvement Science provides us with a way to design our system to do the right stuff.
Audit provides us with feedback and tells us if we are doing the right stuff right.


Research requires a suggestion and an experiment to test it.   A suggestion might be “Drug X is better than drug Y at treating disease Z”, and the experiment might be a randomised controlled trial (RCT).  The way this is done is that subjects with disease Z are randomly allocated to two groups, the control group and the study group.  A measure of ‘better’ is devised and used in both groups. Then the study group is given drug X and the control group is given drug Y and the outcomes are compared.  The randomisation is needed because there are always many sources of variation that we cannot control, and it also almost guarantees that there will be some difference between our two groups. So then we have to use sophisticated statistical data analysis to answer the question “Is there a statistically significant difference between the two groups? Is drug X actually better than drug Y?”

And research is often a complicated and expensive process because to do it well requires careful study design, a lot of discipline, and usually large study and control groups. It is an effective way to help us to know what the right stuff is but only in a generic sense.


Audit requires a standard to compare with and to know if what we are doing is acceptable, or not. There is no randomisation between groups but we still need a metric and we still need to measure what is happening in our local reality.  We then compare our local experience with the global standard and, because variation is inevitable, we have to use statistical tools to help us perform that comparison.

And very often audit focuses on avoiding failure; in other words the standard is a ‘minimum acceptable standard‘ and as long as we are not failing it then that is regarded as OK. If we are shown to be failing then we are in trouble!

And very often the most sophisticated statistical tool used for audit is called an average.  We measure our performance, we average it over a period of time (to remove the troublesome variation), and we compare our measured average with the minimum standard. And if it is below then we are in trouble and if it is above then we are not.  We have no idea how reliable that conclusion is though because we discounted any variation.


A perfect example of this target-driven audit approach is the A&E 95% 4-hour performance target.

The 4-hours defines the metric we are using; the time interval between a patient arriving in A&E and them leaving. It is called a lead time metric. And it is easy to measure.

The 95% defined the minimum  acceptable average number of people who are in A&E for less than 4-hours and it is usually aggregated over three months. And it is easy to measure.

So, if about 200 people arrive in a hospital A&E each day and we aggregate for 90 days that is about 18,000 people in total so the 95% 4-hour A&E target implies that we accept as OK for about 900 of them to be there for more than 4-hours.

Do the 900 agree? Do the other 17,100?  Has anyone actually asked the patients what they would like?


The problem with this “avoiding failure” mindset is that it can never lead to excellence. It can only deliver just above the minimum acceptable. That is called mediocrity.  It is perfectly possible for a hospital to deliver 100% on its A&E 4 hour target by designing its process to ensure every one of the 18,000 patients is there for exactly 3 hours and 59 minutes. It is called a time-trap design.

We can hit the target and miss the point.

And what is more the “4-hours” and the “95%” are completely arbitrary numbers … there is not a shred of research evidence to support them.

So just this one example illustrates the many problems created by having a gap between research and audit.


And that is why we need Improvement Science to help us to link them together.

We need improvement science to translate the global knowledge and apply it to deliver local improvement in whatever metrics we feel are most important. Safety metrics, flow metrics, quality metrics and productivity metrics. Simultaneously. To achieve system-wide excellence. For everyone, everywhere.

When we learn Improvement Science we learn to measure how well we are doing … we learn the power of measurement of success … and we learn to avoid averaging because we want to see the variation. And we still need a minimum acceptable standard because we want to exceed it 100% of the time. And we want continuous feedback on just how far above the minimum acceptable standard we are. We want to see how excellent we are, and we want to share that evidence and our confidence with our patients.

We want to agree a realistic expectation rather than paint a picture of the worst case scenario.

And when we learn Improvement Science we will see very clearly where to focus our improvement efforts.


Improvement Science is the bit in the middle.


Turning the Corner

Nerve_CurveThe emotional journey of change feels like a roller-coaster ride and if we draw as an emotion versus time chart it looks like the diagram above.

The toughest part is getting past the low point called the Well of Despair and doing that requires a combination of inner strength and external support.

The external support comes from an experienced practitioner who has been through it … and survived … and has the benefit of experience and hindsight.

The Improvement Science coach.


What happens as we  apply the IS principles, techniques and tools that we have diligently practiced and rehearsed? We discover that … they work!  And all the fence-sitters and the skeptics see it too.

We start to turn the corner and what we feel next is that the back pressure of resistance falls a bit. It does not go away, it just gets less.

And that means that the next test of change is a bit easier and we start to add more evidence that the science of improvement does indeed work and moreover it is a skill we can learn, demonstrate and teach.

We have now turned the corner of disbelief and have started the long, slow, tough climb through mediocrity to excellence.


This is also a time of risks and there are several to be aware of:

  1. The objective evidence that dramatic improvements in safety, flow, quality and productivity are indeed possible and that the skills can be learned will trigger those most threatened by the change to fight harder to defend their disproved rhetoric. And do not underestimate how angry and nasty they can get!
  2. We can too easily become complacent and believe that the rest will follow easily. It doesn’t.  We may have nailed some of the easier niggles to be sure … but there are much more challenging ones ahead.  The climb to excellence is a steep learning curve … all the way. But the rewards get bigger and bigger as we progress so it is worth it.
  3. We risk over-estimating our capability and then attempting to take on the tougher improvement assignments without the necessary training, practice, rehearsal and support. If we do that we will crash and burn.  It is like a game of snakes and ladders.  Our IS coach is there to help us up the ladders and to point out where the slippery snakes are lurking.

So before embarking on this journey be sure to find a competent IS coach.

They are easy to identify because they will have a portfolio of case studies that they have done themselves. They have the evidence of successful outcomes and that they can walk-the-talk.

And avoid anyone who talks-the-walk but does not have a portfolio of evidence of their own competence. Their Siren song will lure you towards the submerged Rocks of Disappointment and they will disappear like morning mist when you need them most – when it comes to the toughest part – turning the corner. You will be abandoned and fall into the Well of Despair.

So ask your IS coach for credentials, case studies and testimonials and check them out.

A Case of Chronic A&E Pain: Part 6

Dr_Bob_ThumbnailDr Bob runs a Clinic for Sick Systems and is sharing the Case of St Elsewhere’s® Hospital which is suffering from chronic pain in their A&E department.

The story so far: The history and examination of St.Elsewhere’s® Emergency Flow System have revealed that the underlying disease includes carveoutosis multiforme.  StE has consented to a knowledge transplant but is suffering symptoms of disbelief – the emotional rejection of the new reality. Dr Bob prescribed some loosening up exercises using the Carveoutosis Game.  This is the appointment to review the progress.


<Dr Bob> Hello again. I hope you have done the exercises as we agreed.

<StE> Indeed we have.  Many times in fact because at first we could not believe what we were seeing. We even modified the game to explore the ramifications.  And we have an apology to make. We discounted what you said last week but you were absolutely correct.

<Dr Bob> I am delighted to hear that you have explored further and I applaud you for the curiosity and courage in doing that.  There is no need to apologize. If this flow science was intuitively obvious then we we would not be having this conversation. So, how have you used the new understanding?

<StE> Before we tell the story of what happened next we are curious to know where you learned about this?

<Dr Bob> The pathogenesis of carveoutosis spatialis has been known for about 100 years but in a different context.  The story goes back to the 1870s when Alexander Graham Bell invented the telephone.  He was not an engineer or mathematician by background; he was interested in phonetics and he was a pragmatist and experimented by making things. He invented the telephone and the Bell Telephone Co. was born.  This innovation spread like wildfire, as you can imagine, and by the early 1900’s there were many telephone companies all over the world.  At that time the connections were made manually by telephone operators using patch boards and the growing demand created a new problem.  How many lines and operators were needed to provide a high quality service to bill paying customers? In other words … to achieve an acceptably low chance of hearing the reply “I’m sorry but all lines are busy, please try again later“.  Adding new lines and more operators was a slow and expensive business so they needed a way to predict how many would be needed – and how to do that was not obvious!  In 1917, a Danish mathematician, statistician and engineer called Agner Krarup Erlang published a paper with the solution.  A complicated formula that described the relationship and his Erlang B equation allowed telephone exchanges to be designed, built and staffed and to provide a high quality service at an acceptably low cost.  Mass real-time voice communication by telephone became affordable and has transformed the world.

<StE> Fascinating! We sort of sense there is a link here and certainly the “high quality and low cost” message resonates for us. But how does designing telephone exchanges relate to hospital beds?

<Dr Bob> If we equate an emergency admission needing a bed to a customer making a phone call, and we equate the number of telephone lines to the number of beds, then the two systems are very similar from the flow physics perspective. Erlang’s scary-looking equation can be used to estimate the minimum number of beds needed to achieve any specified level of admission service quality if you know the average rate of demand and average the length of stay.  That is how I made the estimate last week. It is this predictable-within-limits behaviour that you demonstrated to yourself with the Carveoutosis Game.

<StE> And this has been known for nearly 100 years but we have only just learned about it!

<Dr Bob> Yes. That is a bit annoying isn’t it?

<StE> And that explains why when we ‘ring-fence’ our fixed stock of beds the 4-hour performance falls!

<Dr Bob> Yes, that is a valid assertion. By doing that you are reducing your space-capacity resilience and the resulting danger, chaos, disappointment and escalating cost is completely predictable.

<StE> So our pain is iatrogenic as you said! We have unwittingly caused this. That is uncomfortable news to hear.

<Dr Bob> The root cause is actually not what you have done wrong, it is what you have not done right. It is an error of omission. You have not learned to listen to what your system is telling you. You have not learned how that can help you to deepen your understanding of how your system works. It is that information, knowledge, understanding and wisdom that you need to design a safer, calmer, higher quality and more affordable healthcare system.

<StE> And now we can see our omission … before it was like a blind spot … and now we can see the fallacy of our previously deeply held belief: that it was impossible to solve this without more beds, more staff and more money.  The gap is now obvious where before it was invisible. It is like a light has been turned on.  Now we know what to do and we are on the road to recovery. We need to learn how to do this ourselves … but not by guessing and meddling … we need to learn to diagnose and then to design and then to deliver safety, flow, quality and productivity.  All at the same time.

<Dr Bob> Welcome to the world of Improvement Science. And here I must sound a note of caution … there is a lot more to it than just blindly applying Erlang’s B equation. That will get us into the ball-park, which is a big leap forward, but real systems are not just simple, passive games of chance; they are complicated, active and adaptive.  Applying the principles of flow design in that context requires more than just mathematics, statistics and computer models.  But that know-how is available and accessible too … and waiting for when you are ready to take that leap of learning.

OK. I do not think you require any more help from me at this stage. You have what you need and I wish you well.  And please let me know the outcome.

<StE> Thank you and rest assured we will. We have already started writing our story … and we wanted to share the that with you today … but with this new insight we will need to write a few more chapters first.  This is really exciting … thank you so much.


St.Elsewhere’s® is a registered trademark of Kate Silvester Ltd,  and to read more real cases of 4-hour A&E pain download Kate’s: The Christmas Crisis


Part 1 is here. Part 2 is here. Part 3 is here. Part 4 is here. Part 5 is here.

The Five-day versus Seven-day Bun-Fight

Dr_Bob_ThumbnailThere is a big bun-fight kicking off on the topic of 7-day working in the NHS.

The evidence is that there is a statistical association between mortality in hospital of emergency admissions and day of the week: and weekends are more dangerous.

There are fewer staff working at weekends in hospitals than during the week … and delays and avoidable errors increase … so risk of harm increases.

The evidence also shows that significantly fewer patients are discharged at weekends.


So the ‘obvious’ solution is to have more staff on duty at weekends … which will cost more money.


Simple, obvious, linear and wrong.  Our intuition has tricked us … again!


Let us unravel this Gordian Knot with a bit of flow science and a thought experiment.

1. The evidence shows that there are fewer discharges at weekends … and so demonstrates lack of discharge flow-capacity. A discharge process is not a single step, there are many things that must flow in sync for a discharge to happen … and if any one of them is missing or delayed then the discharge does not happen or is delayed.  The weakest link effect.

2. The evidence shows that the number of unplanned admissions varies rather less across the week; which makes sense because they are unplanned.

3. So add those two together and at weekends we see hospitals filling up with unplanned admissions – not because the sick ones are arriving faster – but because the well ones are leaving slower.

4. The effect of this is that at weekends the queue of people in beds gets bigger … and they need looking after … which requires people and time and money.

5. So the number of staffed beds in a hospital must be enough to hold the biggest queue – not the average or some fudged version of the average like a 95th percentile.

6. So a hospital running a 5-day model needs more beds because there will be more variation in bed use and we do not want to run out of beds and delay the admission of the newest and sickest patients. The ones at most risk.

7. People do not get sicker because there is better availability of healthcare services – but saying we need to add more unplanned care flow capacity at weekends implies that it does.  What is actually required is that the same amount of flow-resource that is currently available Mon-Fri is spread out Mon-Sun. The flow-capacity is designed to match the customer demand – not the convenience of the supplier.  And that means for all parts of the system required for unplanned patients to flow.  What, where and when. It costs the same.

8. Then what happens is that the variation in the maximum size of the queue of patients in the hospital will fall and empty beds will appear – as if by magic.  Empty beds that ensure there is always one for a new, sick, unplanned admission on any day of the week.

9. And empty beds that are never used … do not need to be staffed … so there is a quick way to reduce expensive agency staff costs.

So with a comprehensive 7-day flow-capacity model the system actually gets safer, less chaotic, higher quality and less expensive. All at the same time. Safety-Flow-Quality-Productivity.

Good Science, an antidote to Ben Goldacre’s “Bad Science”

by Julian Simcox & Terry Weight

Ben Goldacre has spent several years popularizing the idea that we all ought all to be more interested in science.

Every day he writes and tweets examples of “bad science”, and about getting politicians and civil servants to be more evidence-based; about how governmental interventions should be more thoroughly tested before being rolled-out to the hapless citizen; about how the development and testing of new drugs should be more transparent to ensure the public get drugs that actually make a difference rather than risk harm; and about bad statistics – the kind that “make clever people do stupid things”(8).

Like Ben we would like to point the public sector, in particular the healthcare sector and its professionals, toward practical ways of doing more of the good kind of science, but just what is GOOD science?

In collaboration with the Cabinet Office’s behaviour insights team, Ben has recently published a polemic (9) advocating evidence-based government policy. For us this too is commendable, yet there is a potentially grave error of omission in their paper which seems to fixate upon just a single method of research, and risks setting-up the unsuspecting healthcare professional for failure and disappointment – as Abraham Maslow once famously said

.. it is tempting, if the only tool you have is a hammer, to treat everything as if it were a nail”(17)

We question the need for the new Test, Learn and Adapt (TLA) model he offers because the NHS already possesses such a model – one which in our experience is more complete and often simpler to follow – it is called the “Improvement Model”(15) – and via its P-D-S-A mnemonic (Plan-Do-Study-Act) embodies the scientific method.

Moreover there is a preexisting wealth of experience on how best to embed this thinking within organisations – from top-to-bottom and importantly from bottom-to-top; experience that has been accumulating for fully nine decades – and though originally established in industrial settings has long since spread to services.

We are this week publishing two papers, one longer and one shorter, in which we start by defining science, ruing the dismal way in which it is perennially conveyed to children and students, the majority of whom leave formal education without understanding the power of discovery or gaining any first hand experience of the scientific method.

View Shorter Version Abstract

We argue that if science were to be defined around discovery, and learning cycles, and built upon observation, measurement and the accumulation of evidence – then good science could vitally be viewed as a process rather than merely as an externalized entity. These things comprise the very essence of what Don Berwick refers to as Improvement Science (2) as embodied by the Institute of Healthcare Improvement (IHI) and in the NHS’s Model for Improvement.

We also aim to bring an evolutionary perspective to the whole idea of science, arguing that its time has been coming for five centuries, yet is only now more fully arriving. We suggest that in a world where many at school have been turned-off science, the propensity to be scientific in our daily lives – and at work – makes a vast difference to the way people think about outcomes and their achievement. This is especially so if those who take a perverse pride in saying they avoided science at school, or who freely admit they do not do numbers, can get switched on to it.

The NHS Model for Improvement has a pedigree originating with Walter Shewhart in the 1920’s, then being famously applied by Deming and Juran after WWII. Deming in particular encapsulates the scientific method in his P-D-C-A model (three decades later he revised it to P-D-S-A in order to emphasize that the Check stage must not be short-changed) – his pragmatic way of enabling a learning/improvement to evolve bottom-up in organisations.

After the 1980’s Dr Don Berwick , standing on these shoulders, then applied the same thinking to the world of healthcare – initially in his native America. Berwick’s approach is to encourage people to ask questions such as: What works? .. and How would we know? His method, is founded upon a culture of evidence-based learning, providing a local context for systemic improvement efforts. A new organisational culture, one rooted in the science of improvement, if properly nurtured, may then emerge.

Yet, such a culture may initially jar with the everyday life of a conventional organisation, and the individuals within it. One of several reasons, according to Yuval Harari (21), is that for hundreds of generations our species has evolved such that imagined reality has been lorded over objective reality. Only relatively recently in our evolution has the advance of science been leveling up this imbalance, and in our papers we argue that a method is now needed that enables these two realities to more easily coexist.

We suggest that a method that enables data-rich evidence-based storytelling – by those who most know about the context and intend growing their collective knowledge – will provide the basis for an approach whereby the two realities may do just that.

In people’s working lives, a vital enabler is the 3-paradigm “Accountability/Improvement/Research” measurement model (AIRmm), reflecting the three archetypal ways in which people observe and measure things. It was created by healthcare professionals (23) to help their colleagues and policy-makers to unravel a commonly prevailing confusion, and to help people make better sense of the different approaches they may adopt when needing to evidence what they’re doing – depending on the specific purpose. An amended version of this model is already widely quoted inside the NHS, though this is not to imply that it is yet as widely understood or applied as it needs to be.
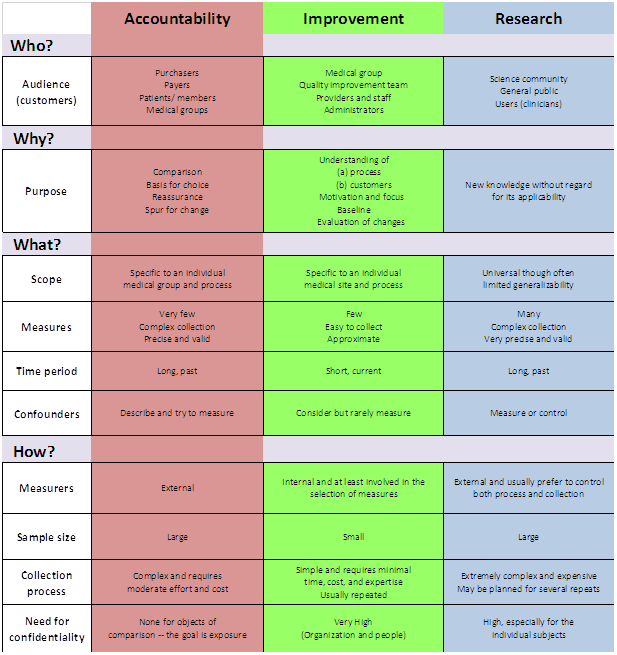
goodscience_AIR_model

This 3-paradigm A-I-R measurement model underpins the way that science can be applied by, and has practical appeal for, the stretched healthcare professional, managerial leader, civil servant.

Indeed for anyone who intuitively suspects there has to be a better way to combine goals that currently feel disconnected or even in conflict: empowerment and accountability; safety and productivity; assurance and improvement; compliance and change; extrinsic and intrinsic motivation; evidence and action; facts and ideas; logic and values; etc.

Indeed for anyone who is searching for ways to unify their actions with the system-based implementation of those actions as systemic interventions. Though widely quoted in other guises, we are returning to the original model (23) because we feel it better connects to the primary aim of supporting healthcare professionals make best sense of their measurement options.

In particular the model makes it immediately plain that a way out of the apparent Research/Accountability dichotomy is readily available to anyone willing to “Learn, master and apply the modern methods of quality control, quality improvement and quality planning” – the recommendation made for all staff in the Berwick Report (3).

In many organisations, and not just in healthcare, the column 1 paradigm is the only game in town. Column 3 may feel attractive as a way-out, but it also feels inaccessible unless there is a graduate in statistician on hand. Moreover, the mainstay of the Column 3 worldview: the Randomized Controlled Trial (RCT) can feel altogether overblown and lacking in immediacy. It can feel like reaching for a spanner and finding a lump hammer in your hand – as Berwick says “Fans of traditional research methods view RCTs as the gold standard, but RCTs do not work well in many healthcare contexts” (2).

Like us, Ben is frustrated by the ways that healthcare organisations conduct themselves – not just the drug companies that commercialize science and publish only the studies likely to enhance sales, but governments too who commonly implement politically expedient policies only to then have to subsequently invent evidence to support them.

Policy-based evidence rather than evidence-based policy.

Ben’s recommended Column 3-style T-L-A approach is often more likely to make day-to-day sense to people and teams on the ground if complemented by Column 2-style improvement science.
One reason why Improvement Science can sometimes fail to dent established cultures is that it gets corralled by organisational “experts” – some of whom then use what little knowledge they have gathered merely to make themselves indispensable, not realising the extent to which everyone else as a consequence gets dis-empowered.

In our papers we take the opportunity to outline the philosophical underpinnings, and to do this we have borrowed the 7-point framework from a recent paper by Perla et al (35) who suggest that Improvement Science:

1. Is grounded in testing and learning cycles – the aim is collective knowledge and understanding about cause & effect over time. Some scientific method is needed, together with a way to make the necessary inquiry a collaborative one. Shewhart realised this and so invented the concept “continual improvement”.

2. Embraces a combination of psychology and logic – systemic learning requires that we balance myth and received wisdom with logic and the conclusions we derive from rational inquiry. This balance is approximated by the Sensing-Intuiting continuum in the Jungian-based MBTI model (12) reminding us that constructing a valid story requires bandwidth.

3. Has a philosophical foundation of conceptualistic pragmatism (16) – it cannot be expected that two scientists when observing, experiencing, or experimenting will make the same theory-neutral observations about the same event – even if there is prior agreement about methods of inference and interpretation. The normative nature of reality therefore has to be accommodated. Whereas positivism ultimately reduces the relation between meaning and experience to a matter of logical form, pragmatism allows us to ground meaning in conceived experience.

4. Employs Shewhart’s “theory of cause systems” – Walter Shewhart created the Control Chart for tuning-in to systemic behaviour that would otherwise remain unnoticed. It is a diagnostic tool, but by flagging potential trouble also aids real time prognosis. It might have been called a “self-control chart” for he was especially interested in supporting people working in and on their system being more considered (less reactive) when taking action to enhance it without over-reacting – avoiding what Deming later referred to as “Tampering” (4).

5. Requires the use of Operational Definitions – Deming warned that some of the most important aspects of a system cannot be expressed numerically, and those that can require care because “there is no true value of anything measured or observed” (5). When it comes to metric selection therefore it is essential to understand the measurement process itself, as well as the “operational definition” that each metric depends upon – the aim being to reduce ambiguity to zero.

6. Considers the contexts of both justification and discovery – Science can be defined as a process of discovery – testing and learning cycles built upon observation, measurement and accumulating evidence or experience – shared for example via a Flow Chart or a Gantt chart in order to justify a belief in the truth of an assertion. To be worthy of the term “science” therefore, a method or procedure is needed that is characterised by collaborative inquiry.

7. Is informed by Systems Theory – Systems Theory is the study of systems, any system: as small as a quark or as large as the universe. It aims to uncover archetypal behaviours and the principles by which systems hang together – behaviours that can be applied across all disciplines and all fields of research. There are several types of systems thinking, but Jay Forrester’s “System Dynamics” has most pertinence to Improvement Science because of its focus on flows and relationships – recognising that the behaviour of the whole may not be explained by the behaviour of the parts.

In the papers, we say more about this philosophical framing, and we also refer to the four elements in Deming’s “System of Profound Knowledge”(5). We especially want to underscore that the overall aim of any scientific method we employ is contextualised knowledge – which is all the more powerful if continually generated in context-specific experimental cycles. Deming showed that good science requires a theory of knowledge based upon ever-better questions and hypotheses. We two aim now to develop methods for building knowledge-full narratives that can work well in healthcare settings.

We wholeheartedly agree with Ben that for the public sector – not just in healthcare – policy-making needs to become more evidence-based.

In a poignant blog from the Health Foundation’s (HF) Richard Taunt (24), he recently describes attending two recent conferences on the same day. At the first one, policymakers from 25 countries had assembled to discuss how national policy can best enhance the quality of health care. When collectively asked which policies they would retain and repeat, their list included: use of data, building quality improvement capability, ensuring senior management are aware of improvement approaches, and supporting and spreading innovations.

In a different part of London, UK health politicians happened also to be debating Health and Care in order to establish the policy areas they would focus on if forming the next government. This second discussion brought out a completely different set of areas: the role of competition, workforce numbers, funding, and devolution of commissioning. These two discussions were supposedly about the same topic, but a Venn diagram would have contained next to no overlap.

Clare Allcock, also from the HF, then blogged to comment that “in England, we may think we are fairly advanced in terms of policy levers, but (unlike, for example in Scotland or the USA) we don’t even have a strategy for implementing health system quality.” She points in particular to Denmark who recently have announced they are phasing out their hospital accreditation scheme in favour of an approach strongly focused around quality improvement methodology and person-centred care. The Danes are in effect taking the 3-paradigm model and creating space for Column 2: improvement thinking.

The UK needs to take a leaf out of their book, for without changing fundamentally the way the NHS (and the public sector as a whole) thinks about accountability, any attempt to make column 2 the dominant paradigm is destined to be still born.

It is worth noting that in large part the AIRmm Column 2 paradigm was actually central to the 2012 White Paper’s values, and with it the subsequent Outcomes Framework consultation – both of which repeatedly used the phrase “bottom-up” to refer to how the new system of accountability would need to work, but somehow this seems to have become lost in legislative procedures that history will come to regard as having been overly ambitious. The need for a new paradigm of accountability however remains – and without it health workers and clinicians – and the managers who support them – will continue to view metrics more as something intrusive than as something that can support them in delivering enhancements in sustained outcomes. In our view the Stevens’ Five Year Forward View makes this new kind of accountability an imperative.

“Society, in general, and leaders and opinion formers, in particular, (including national and local media, national and local politicians of all parties, and commentators) have a crucial role to play in shaping a positive culture that, building on these strengths, can realise the full potential of the NHS.
When people find themselves working in a culture that avoids a predisposition to blame, eschews naïeve or mechanistic targets, and appreciates the pressures that can accumulate under resource constraints, they can avoid the fear, opacity, and denial that will almost inevitably lead to harm.”
Berwick Report (3)

Changing cultures means changing our habits – it starts with us. It won’t be easy because people default to the familiar, to more of the same. Hospitals are easier to build than relationships; operations are easier to measure than knowledge, skills and confidence; and prescribing is easier than enabling. The two of us do not of course possess a monopoly on all possible solutions, but our experience tells us that now is the time for: evidence-rich storytelling by front line teams; by pharmaceutical development teams; by patients and carers conversing jointly with their physicians.

We know that measurement is not a magic bullet, but what frightens us is that the majority of people seem content to avoid it altogether. As Oliver Moody recently noted in The Times ..

Call it innumeracy, magical thinking or intrinsic mental laziness, but even intelligent members of the public struggle, through no fault of their own, to deal with statistics and probability. This is a problem. People put inordinate amounts of trust in politicians, chief executives, football managers and pundits whose judgment is often little better than that of a psychic octopus.     Short of making all schoolchildren study applied mathematics to A level, the only thing scientists can do about this is stick to their results and tell more persuasive stories about them.

Too often, Disraeli’s infamous words: “Lies, damned lies, and statistics” are used as the refuge of busy professionals looking for an excuse to avoid numbers.

If Improvement Science is to become a shared language, Berwick’s recommendation that all NHS staff “Learn, master and apply the modern methods of quality control, quality improvement and quality planning” has to be taken seriously.

As a first step we recommend enabling teams to access good data in as near to real time as possible, data that indicates the impact that one’s intervention is having – this alone can prompt a dramatic shift in the type of conversation that people working in and on their system may have. Often this can be initiated simply by converting existing KPI data into System Behaviour Chart form which, using a tool like BaseLine® takes only a few mouse clicks.

In our longer paper we offer three examples of Improvement Science in action – combining to illustrate how data may be used to evidence both sustained systemic enhancement, and to generate engagement by the people most directly connected to what in real time is systemically occurring.

1. A surgical team using existing knowledge established by column 3-type research as a platform for column 2-type analytic study – to radically reduce post-operative surgical site infection (SSI).

2. 25 GP practices are required to collect data via the Friends & Family Test (FFT) and decide to experiment with being more than merely compliant. In two practices they collectively pilot a system run by their PPG (patient participation group) to study the FFT score – patient by patient – as they arrive each day. They use IS principles to separate signal from noise in a way that prompts the most useful response to the feedback in near to real time. Separately they summarise all the comments as a whole and feed their analysis into the bi-monthly PPG meeting. The aim is to address both “special cause” feedback and “common cause” feedback in a way that, in what most feel is an over-loaded system, can prompt sensibly prioritised improvement activity.

3. A patient is diagnosed with NAFLD and receives advice from their doctor to get more exercise e.g. by walking more. The patient uses the principles of IS to monitor what happens – using the data not just to show how they are complying with their doctor’s advice, but to understand what drives their personal mind/body system. The patient hopes that this knowledge can lead them to better decision-making and sustained motivation.

The landscape of NHS improvement and innovation support is fragmented, cluttered, and currently pretty confusing. Since May 2013 Academic Health Science Networks (AHSNs) funded by NHS England (NHSE) have been created with the aim of bringing together health services, and academic and industry members. Their stated purpose is to improve patient outcomes and generate economic benefits for the UK by promoting and encouraging the adoption of innovation in healthcare. They have a 5 year remit and have spent the first 2 years establishing their structures and recruiting, it is not yet clear if they will be able to deliver what’s really needed.

Patient Safety Collaboratives linked with AHSN areas have also been established to improve the safety of patients and ensure continual patient safety learning. The programme, coordinated by NHSE and NHSIQ will provide safety improvements across a range of healthcare settings by tackling the leading causes of avoidable harm to patients. The intention is to empower local patients and healthcare staff to work together to identify safety priorities and develop solutions – implemented and tested within local healthcare organisations, then later shared nationally.

We hope our papers will significantly influence the discussions about how improvement and innovation can assist with these initiatives. In the shorter paper to echo Deming, we even include our own 14 points for how healthcare organisations need to evolve. We will know that we have succeeded if the papers are widely read; if we enlist activists like Ben to the definition of science embodied by Improvement Science; and if we see a tidal wave of improvement science methods being applied across the NHS?

As patient volunteers, we each intend to find ways of contributing in any way that appears genuinely helpful. It is our hope that Improvement Science enables the cultural transformation we have envisioned in our papers and with our case studies. This is what we feel most equipped to help with. When in your sixties it easy to feel that time is short, but maybe people of every age should feel this way? In the words of Francis Bacon, the father of the scientific method.

goodscience_francisbaconquote

Download Long Version

References

goodscience_refs

What is Productivity?

It was the time for Bob and Leslie’s regular coaching session. Dr_Bob_ThumbnailBob was already on line when Leslie dialed in to the teleconference.

<Leslie> Hi Bob, sorry I am a bit late.

<Bob> No problem Leslie. What aspect of improvement science shall we explore today?

<Leslie> Well, I’ve been working through the Safety-Flow-Quality-Productivity cycle in my project and everything is going really well.  The team are really starting to put the bits of the jigsaw together and can see how the synergy works.

<Bob> Excellent. And I assume they can see the sources of antagonism too.

<Leslie> Yes, indeed! I am now up to the point of considering productivity and I know it was introduced at the end of the Foundation course but only very briefly.

<Bob> Yes,  productivity was described as a system metric. A ratio of a steam metric and a stage metric … what we get out of the streams divided by what we put into the stages.  That is a very generic definition.

<Leslie> Yes, and that I think is my problem. It is too generic and I get it confused with concepts like efficiency.  Are they the same thing?

<Bob> A very good question and the short answer is “No”, but we need to explore that in more depth.  Many people confuse efficiency and productivity and I believe that is because we learn the meaning of words from the context that we see them used in. If  others use the words imprecisely then it generates discussion, antagonism and confusion and we are left with the impression of that it is a ‘difficult’ subject.  The reality is that it is not difficult when we use the words in a valid way.

<Leslie> OK. That reassures me a bit … so what is the definition of efficiency?

<Bob> Efficiency is a stream metric – it is the ratio of the minimum cost of the resources required to complete one task divided by the actual cost of the resources used to complete one task.

<Leslie> Um.  OK … so how does time come into that?

<Bob> Cost is a generic concept … it can refer to time, money and lots of other things.  If we stick to time and money then we know that if we have to employ ‘people’ then time will cost money because people need money to buy essential stuff that the need for survival. Water, food, clothes, shelter and so on.

<Leslie> So we could use efficiency in terms of resource-time required to complete a task?

<Bob> Yes. That is a very useful way of looking at it.

<Leslie> So how is productivity different? Completed tasks out divided by cash in to pay for resource time would be a productivity metric. It looks the same.

<Bob> Does it?  The definition of efficiency is possible cost divided by actual cost. It is not the as our definition of system productivity.

<Leslie> Ah yes, I see. So do others define productivity the same way?

<Bob> Try looking it up on Wikipedia …

<Leslie> OK … here we go …

Productivity is an average measure of the efficiency of production. It can be expressed as the ratio of output to inputs used in the production process, i.e. output per unit of input”.

Now that is really confusing!  It looks like efficiency and productivity are the same. Let me see what the Wikipedia definition of efficiency is …

“Efficiency is the (often measurable) ability to avoid wasting materials, energy, efforts, money, and time in doing something or in producing a desired result”.

But that is closer to your definition of efficiency – the actual cost is the minimum cost plus the cost of waste.

<Bob> Yes.  I think you are starting to see where the confusion arises.  And this is because there is a critical piece of the jigsaw missing.

<Leslie> Oh …. and what is that?

<Bob> Worth.

<Leslie> Eh?

<Bob> Efficiency has nothing to do with whether the output of the stream has any worth.  I can produce a worthless product with low waste … in other words very efficiently.  And what if we have the situation where the output of my process is actually harmful.  The more efficiently I use my resources the more harm I will cause from a fixed amount of resource … and in that situation it is actually safer to have an inefficient process!

<Leslie> Wow!  That really hits the nail on the head … and the implications are … profound.  Efficiency is objective and relates only to flow … and between flow and productivity we have to cross the Safety-Quality line. Productivity also includes the subjective concept of worth or value. That all makes complete sense now. A productive system is a subjectively and objectively win-win-win design.

<Bob> Yup.  Get the safety, flow and quality perspectives of the design in synergy and productivity will sky-rocket. It is called a Fit-4-Purpose design.

Measure and Matter

stick_figure_balance_mind_heart_150_wht_9344Improvement implies learning.  And to learn we need feedback from reality because without it we will continue to believe our own rhetoric.

So reality feedback requires both sensation and consideration.

There are many things we might sense, measure and study … so we need to be selective … we need to choose those things that will help us to make the wise decisions.


Wise decisions lead to effective actions which lead to intended outcomes.


Many measures generate objective data that we can plot and share as time-series charts.  Pictures that tell an evolving story.

There are some measures that matter – our intended outcomes for example. Our safety, flow, quality and productivity charts.

There are some measures that do not matter – the measures of compliance for example – the back-covering blame-avoiding management-by-fear bureaucracy.


And there are some things that matter but are hard to measure … objectively at least.

We can sense them subjectively though.  We can feel them. If we choose to.

And to do that we only need to go to where the people are and the action happens and just watch, listen, feel and learn.  We do not need to do or say anything else.

And it is amazing what we learn in a very short period of time. If we choose to.


If we enter a place where a team is working well we will see smiles and hear laughs. It feels magical.  They will be busy and focused and they will show synergism. The team will be efficient, effective and productive.

If we enter place where is team is not working well we will see grimaces and hear gripes. It feels miserable. They will be busy and focused but they will display antagonism. The team will be inefficient, ineffective and unproductive.


So what makes the difference between magical and miserable?

The difference is the assumptions, attitudes, prejudices, beliefs and behaviours of those that they report to. Their leaders and managers.

If the culture is management-by-fear (a.k.a bullying) then the outcome is unproductive and miserable.

If the culture is management-by-fearlessness (a.k.a. inspiring) then the outcome is productive and magical.

It really is that simple.

Bitten by the ISP bug

beehive_bees_150_wht_12723There is a condition called SFQPosis which is an infection that is transmitted by a vector called an ISP.

The primary symptom of SFQPosis is sudden clarity of vision and a new understanding of how safety, flow, quality and productivity improvements can happen at the same time …

… when they are seen as partners on the same journey.


There are two sorts of ISP … Solitary and Social.

Solitary ISPs infect one person at a time … often without them knowing.  And there is often a long lag time between the infection and the appearance of symptoms. Sometimes years – and often triggered by an apparently unconnected event.

In contrast the Social ISPs will tend to congregate together and spend their time foraging for improvement pollen and nectar and bringing it back to their ‘hive’ to convert into delicious ‘improvement honey’ which once tasted is never forgotten.


It appears that Jeremy Hunt, the Secretary of State for Health, has recently been bitten by an ISP and is now exhibiting the classic symptoms of SFQPosis.

Here is the video of Jeremy describing his symptoms at the recent NHS Confederation Conference. The talk starts at about 4 minutes.

His account suggests that he was bitten while visiting the Virginia Mason Hospital in the USA and on return home then discovered some Improvement hives in the UK … and some of the Solitary ISPs that live in England.

Warwick and Sheffield NHS Trusts are buzzing with ISPs … and the original ISP that infected them was one Kate Silvester.

The repeated message in Jeremy’s speech is that improved safety, quality and productivity can happen at the same time and are within our gift to change – and the essence of achieving that is to focus on flow.

SFQPThe sequence is safety first (eliminate the causes of avoidable harm), then flow second (eliminate the causes of avoidable chaos), then quality (measure both expectation and experience) and then productivity will soar.

And everyone will  benefit.

This is not a zero-sum win-lose game.


So listen for the buzz of the ISPs …. follow it and ask them to show you how … ask them to innoculate you with SFQPosis.


And here is a recent video of Dr Steve Allder, a consultant neurologist and another ISP that Kate infected with SFQPosis a few years ago.  Steve is describing his own experience of learning how to do Improvement-by-Design.

Over-Egged Expectation

FISH_ISP_eggs_jumpingResistance-to-change is an oft quoted excuse for improvement torpor. The implied sub-message is more like “We would love to change but They are resisting“.

Notice the Us-and-Them language.  This is the observable evidence of an “We‘re OK and They’re Not OK” belief.  And in reality it is this unstated belief and the resulting self-justifying behaviour that is an effective barrier to systemic improvement.

This Us-and-Them language generates cultural friction, erodes trust and erects silos that are effective barriers to the flow of information, of innovation and of learning.  And the inevitable reactive solutions to this Us-versus-Them friction create self-amplifying positive feedback loops that ensure the counter-productive behaviour is sustained.

One tangible manifestation are DRATs: Delusional Ratios and Arbitrary Targets.


So when a plausible, rational and well-evidenced candidate for an alternative approach is discovered then it is a reasonable reaction to grab it and to desperately spray the ‘magic pixie dust’ at everything.

This a recipe for disappointment: because there is no such thing as ‘improvement magic pixie dust’.

The more uncomfortable reality is that the ‘magic’ is the result of a long period of investment in learning and the associated hard work in practising and polishing the techniques and tools.

It may look like magic but is isn’t. That is an illusion.

And some self-styled ‘magicians’ choose to keep their hard-won skills secret … because by sharing them know that they will lose their ‘magic powers’ in a flash of ‘blindingly obvious in hindsight’.

And so the chronic cycle of despair-hope-anger-and-disappointment continues.


System-wide improvement in safety, flow, quality and productivity requires that the benefits of synergism overcome the benefits of antagonism.  This requires two changes to the current hope-and-despair paradigm.  Both are necessary and neither are sufficient alone.

1) The ‘wizards’ (i.e. magic folk) share their secrets.
2) The ‘muggles’ (i.e. non-magic folk) invest the time and effort in learning ‘how-to-do-it’.


The transition to this awareness is uncomfortable so it needs to be managed pro-actively … by being open about the risk … and how to mitigate it.

That is what experienced Practitioners of Improvement Science (and ISP) will do. Be open about the challenged ahead.

And those who desperately want the significant and sustained SFQP improvements; and an end to the chronic chaos; and an end to the gaming; and an end to the hope-and-despair cycle …. just need to choose. Choose to invest and learn the ‘how to’ and be part of the future … or choose to be part of the past.


Improvement science is simple … but it is not intuitively obvious … and so it is not easy to learn.

If it were we would be all doing it.

And it is the behaviour of a wise leader of change to set realistic and mature expectations of the challenges that come with a transition to system-wide improvement.

That is demonstrating the OK-OK behaviour needed for synergy to grow.

Circles

SFQP_enter_circle_middle_15576For a system to be both effective and efficient the parts need to work in synergy. This requires both alignment and collaboration.

Systems that involve people and processes can exhibit complex behaviour. The rules of engagement also change as individuals learn and evolve their beliefs and their behaviours.

The values and the vision should be more fixed. If the goalposts are obscure or oscillate then confusion and chaos is inevitable.


So why is collaborative alignment so difficult to achieve?

One factor has been mentioned. Lack of a common vision and a constant purpose.

Another factor is distrust of others. Our fear of exploitation, bullying, blame, and ridicule.

Distrust is a learned behaviour. Our natural inclination is trust. We have to learn distrust. We do this by copying trust-eroding behaviours that are displayed by our role models. So when leaders display these behaviours then we assume it is OK to behave that way too.  And we dutifully emulate.

The most common trust eroding behaviour is called discounting.  It is a passive-aggressive habit characterised by repeated acts of omission:  Such as not replying to emails, not sharing information, not offering constructive feedback, not asking for other perspectives, and not challenging disrespectful behaviour.


There are many causal factors that lead to distrust … so there is no one-size-fits-all solution to dissolving it.

One factor is ineptitude.

This is the unwillingness to learn and to use available knowledge for improvement.

It is one of the many manifestations of incompetence.  And it is an error of omission.


Whenever we are unable to solve a problem then we must always consider the possibility that we are inept.  We do not tend to do that.  Instead we prefer to jump to the conclusion that there is no solution or that the solution requires someone else doing something different. Not us.

The impossibility hypothesis is easy to disprove.  If anyone has solved the problem, or a very similar one, and if they can provide evidence of what and how then the problem cannot be impossible to solve.

The someone-else’s-fault hypothesis is trickier because proving it requires us to influence others effectively.  And that is not easy.  So we tend to resort to easier but less effective methods … manipulation, blame, bullying and so on.


A useful way to view this dynamic is as a set of four concentric circles – with us at the centre.

The outermost circle is called the ‘Circle of Ignorance‘. The collection of all the things that we do not know we do not know.

Just inside that is the ‘Circle of Concern‘.  These are things we know about but feel completely powerless to change. Such as the fact that the world turns and the sun rises and falls with predictable regularity.

Inside that is the ‘Circle of Influence‘ and it is a broad and continuous band – the further away the less influence we have; the nearer in the more we can do. This is the zone where most of the conflict and chaos arises.

The innermost is the ‘Circle of Control‘.  This is where we can make changes if we so choose to. And this is where change starts and from where it spreads.


SFQP_enter_circle_middle_15576So if we want system-level improvements in safety, flow, quality and productivity (or cost) then we need to align these four circles. Or rather the gaps in them.

We start with the gaps in our circle of control. The things that we believe we cannot do … but when we try … we discover that we can (and always could).

With this new foundation of conscious competence we can start to build new relationships, develop trust and to better influence others in a win-win-win conversation.

And then we can collaborate to address our common concerns – the ones that require coherent effort. We can agree and achieve our common purpose, vision and goals.

And from there we will be able to explore the unknown opportunities that lie beyond. The ones we cannot see yet.

A School for Rebels

Troublemaker_vs_RebelSystem-wide, significant, and sustained improvement implies system-wide change.

And system-wide change implies more than 20% of the people commit to action. This is the cultural tipping point.

These critical 20% have a badge … they call themselves rebels … and they are perceived as troublemakers by those who profit most from the status quo.

But troublemakers and rebels are radically different … as shown in the summary by Lois Kelly.


Rebels share a common, future-focussed purpose.  A mission.  They are passionate, optimistic and creative.  They understand synergy and how to release and align the stored emotional energy of both themselves and others.  And most importantly they are value-led and that makes them attractive.  Values such as honesty, integrity and industry are what make leaders together-effective.

SHCR_logoAnd as we speak there is school for rebels in healthcare gaining momentum …  and their programme is current, open to all and free to access. And the change agent development materials are excellent!

Click here to download their study guide.


Converting possibilities into realities is the essence of design … so our merry band of rebels will also need to learn how to convert their positive rhetoric into practical reality. And that is more physics than psychology.

Streams flow because of physics not because of passion.SFQP_Compass

And this is why the science of improvement is important because it is the synthesis of the people dimension and the process dimension – into a system that delivers significant and sustained improvement.

On all dimensions. Safety, Flow, Quality and Productivity.

The lighthouse is our purpose; the whale represents the magnitude of our challenge; the blue sky is the creative thinking we need … to avoid trying to boil the ocean.

And the noisy, greedy, s****y seagulls are the troublemakers who always will plague us.

[Image by Malaika Art].


SFQP

SFQPThe flavour of the week has been “chaos”.  Again!

Chaos dissipates energy faster than calm so chaotic behaviour is a symptom of an inefficient design.

And we would like to improve our design to restore a state of ‘calm efficiency’.

Chaos is a flow phenomenon … but that is not where the improvement by design process starts.  There is a step before that … Safety.


Safety First
If a design is unsafe it generates harm.  So we do not want to improve the smooth efficiency of the harm generator … that will only produce more harm!  First we must consider if our system is safe enough.

Despite what many claim, our healthcare systems are actually very safe.  For sure there are embarrassing exceptions and we can always improve safety further, but we actually have quite a safe design.

It is not a very efficient design though.  There is a lot of checking and correcting which uses up time and resources … but it helps to ensure safety is good enough for now.

Having done the safety sanity check we can move on to Flow.


Flow Second
Flow comes before quality because it is impossible to deliver a high quality experience in a chaotic system.  First we need to calm any chaos.  Or rather we need to diagnose the root causes of the chaotic behaviour and do some flow re-design to restore the calm.

Chaos is funny stuff.  It does not behave intuitively.  Time is always a factor.  The butterflies wing effect is ever present.  Small causes can have big effects, both good and bad.  Big causes can have no effect.  Causes can be synergistic and they can be antagonistic.  The whole is not the sum of the parts.  This confusing and counter-intuitive behaviour is called “non linear” and we are all rubbish at getting a mental handle on it.  Our brains did not evolve that way.

The good news is that when chaos reigns it is usually possible to calm it with a small number of carefully placed, carefully timed, carefully designed, synergistic, design “tweaks”.

The problem is that when we do what intuitively feels “right” we can too easily make poor improvement decisions that lead to ineffective actions.  The chaos either does not go away or it gets worse.  So, we have learned from our ineptitude to just put up with the chaos and to accept the inefficiency, the high cost-of-chaos.

To calm the chaos we have to learn how to use the tools designed to do that.  And they do exist.


Quality
Safety and Flow represent the “absolute” half of the SFQP cycle.  Harm is an absolute metric. We can devise absolute definitions and count harmful events.  Mortality.  Mistakes.  Hospital  acquired infections.  That sort of stuff.

Flow is absolute too in the sense that the Laws of Physics determine what happens, and they are absolute too. And non-negotiable.

Quality is relative.  It is the ratio of experience and expectation and both of these are subjective but that is not the point.  The point is that it is a ratio and that makes it a relative metric.  My expectation influences my perception of quality, as does what I experience.  And this has important implications.  For example we can reduce disappointment by lowering expectation; or we can reduce disappointment by improving experience.  Lowering expectation is the easier option because to do that we only have to don the “black hat” and paint a grisly picture of a worst case scenario.  Some call it “informed consent”; I call it “abdication of empathy” and “fear-mongering”.

Variable quality can  come from variable experience, variable expectation or both.  So, to reduce quality variation we can focus on either input to the ratio; and the easiest is expectation.  Setting a realistic expectation just requires measuring experience retrospectively and sharing it prospectively.  Not satisfaction mind you – Experience. Satisfaction surveys are largely meaningless as an improvement tool because just setting a lower expectation will improve satisfaction!

And this is why quality follows flow … because if flow is chaotic then expectation becomes a lottery, and quality does too.  The chaotic behaviour of the St.Elsewhere’s® A&E Department that we saw last week implies that we cannot set any other expectation than “It might be OK or it might be Not OK … we cannot predict. So fingers crossed.”  It is a quality lottery!

But with calm and efficient flow we experience less variation and with that we can set a reasonable expectation.  Quality becomes predictable-within-limits.


Productivity
Productivity is also a relative concept.  It is the ratio of what we get out of the system divided by what we put in.  Revenue divided by expense for example.

And it does not actually emerge last.  As soon as safety, flow or quality improve then they will have an immediate impact on productivity.  Work gets easier.  The cost of harm, chaos and disappointment will fall (and they are surprisingly large costs!).

The reason that productivity-by-design comes last is because we are talking about focussed productivity improvement-by-design.  Better value for money.  And that requires a specific design focus.  And it comes last because we need some head-space and some life-time to learn and do good system design.

And SFQP is a cycle so after doing the Productivity improvement we go back to Safety and ask “How can we make our design even safer and even simpler?” And so on, round and round the SFQP loop.

Do no harm, restore the calm, delight for all, and costs will fall.

And if you would like a full-size copy of the SFQP cycle diagram to use and share just click here.

Counter-Productivity

coffee_table_talk_PA_150_wht_6082The Webex icon bounced up and down on Bob’s task bar signalling that Leslie had just joined the weekly ISP coaching session.

<Leslie> Hi Bob. I have been so busy this week that I have not had time to consider a topic to explore.

<Bob> No problem Leslie, I have shelf full of topics we have not touched yet.  So shall we talk about counter-productivity?

<Leslie> Don’t you mean productivity … the fourth dimension of system improvement.

<Bob>They are related of course but we will approach the issue of productivity from a different angle. Rather like we did with safety. To improve safety we considered at the causes of un-safety and focussed our efforts there.

<Leslie> Ah yes, I see.  So to improve productivity we look at the causes of un-productivity … in other words counter-productive beliefs and behaviours that are manifest as system design flaws.

<Bob> Exactly. So remind me what the definition of a productivity metric is from your FISH course.

<Leslie> Productivity is the ratio of a stream metric and a stage metric.  Value-for-Money for example.

<Bob> Good.  So counter-productivity is also a ratio of a stream and a stage metric.

<Leslie> Um, I’m not sure I quite get that. Can you explain a bit more.

<Bob> OK. To explore deeper we need to be clear about how each metric relates to our intended outcome.  Remember in safety-by-design we count the number and severity of risks and harm because  as harm is going up then safety is going down.  So harm is an un-safety stream metric.

<Leslie> Ah! Yes I see.  So if we look at cycle-time, which is a stage metric; as cycle-time increases, the activity falls and productivity falls. So cycle-time is actually a counter-productivity metric.

<Bob>Excellent. You are getting the hang of the concept of counter-productivity.

<Leslie> And we need to be careful because productivity is a ratio so the numerator and denominator metrics work in opposite ways: increasing the magnitude of the numerator is equivalent to decreasing the magnitude of the denominator – the ratio increases.

<Bob> Indeed, there are many hazards with ratios as we have explored before. So let is consider a real and rather useful example.  Let us look at Little’s Law from the perspective of counter-productivity. Remind me of the definition of Little’s Law for a single step system.

<Leslie> Little’s Law is a mathematically proven law of flow physics which states that the average lead-time is the product of the average work-in-progress and the average cycle-time.

LT = WIP * CT

<Bob> Good and I am pleased to see that you have used cycle-time. We are considering a single stream, single stage, single step system.

<Leslie> Yes, I avoided using the unqualified term ‘activity’. I have learned that lesson the hard way too!

<Bob> So how do the terms in Little’s Law relate to streams, stages and systems?

<Leslie> Lead-time is a stream metric, cycle-time is a stage metric and work-in-progress is a …. h’mm. What it is? A stream metric or a stage metric?

<Bob>Or?

<Leslie>A system metric?  WIP is a system metric!

<Bob> Good. So now re-arrange Little’s Law as a productivity formula.

<Leslie> Work-in-Progress equals lead-time divided by cycle-time

WIP = LT / CT

<Bob> So is WIP a productivity or a counter-productivity metric?

<Leslie> H’mmm …. I will need to work this through logically and step-by-step. I do not trust my intuition on this flow stuff.

Increasing cycle-time is counter-productive because it implies activity is falling while costs are not.

But cycle-time is on the bottom of the ratio so it’s effect reverses.

So if lead-time stays the same and cycle-time increases then because it is on the bottom of the ratio that implies a more productive design. And at the same time work in progress must be falling. Urrgh! This is hurting my head.

<Bob> Good, keep going … you are nearly there.

<Leslie> So a falling WIP is a sign of increasing productivity.

<Bob> Good … and that implies?

<Leslie> WIP is a counter-productivity system metric!

<Bob> Well done. Your logic is flawless.

<Leslie> So that  is why we focus on WIP so much!  Whatever causes WIP to increase is counter-productive!

Ahhhh …. that makes complete sense.

Lo-WIP  designs are more productive than Hi-WIP designs.

<Bob> Bravo!  And translating this into financial metrics … it is because a big queue of waiting work incurs costs. Storage cost, maintenance cost, processing cost and so on. So WIP is a liability. It is not an asset!

<Leslie> But doesn’t that imply treating work-in-progress as an asset on the financial balance sheet is counter-productive?

<Bob> It does indeed.

<Leslie> Oh dear! That revelation is going to upset a lot of people in the accounting department!

<Bob> The painful reality is that  the Laws of Flow Physics are completely indifferent to what any of us believe or do not believe.

<Leslie> Wow!  I like this concept of counter-productivity … it really helps to expose some of our invalid assumptions that invisibly block improvement!

<Bob> So here is a question to ponder.  Is zero WIP desirable or even possible?

<Leslie> H’mmm.  I will have to think about that.  I know you would not have asked the question for no reason.
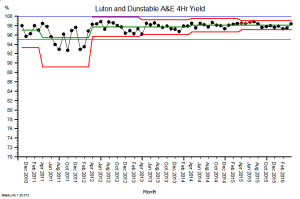
Fit-4-Purpose

F4P_PillsWe all want a healthcare system that is fit for purpose.

One which can deliver diagnosis, treatment and prognosis where it is needed, when it is needed, with empathy and at an affordable cost.

One that achieves intended outcomes without unintended harm – either physical or psychological.

We want safety, delivery, quality and affordability … all at the same time.

And we know that there are always constraints we need to work within.

There are constraints set by the Laws of the Universe – physical constraints.

These are absolute,  eternal and are not negotiable.

Dr Who’s fantastical tardis is fictional. We cannot distort space, or travel in time, or go faster than light – well not with our current knowledge.

There are also constraints set by the Laws of the Land – legal constraints.

Legal constraints are rigid but they are also adjustable.  Laws evolve over time, and they are arbitrary. We design them. We choose them. And we change them when they are no longer fit for purpose.

The third limit is often seen as the financial constraint. We are required to live within our means. There is no eternal font of  limitless funds to draw from.  We all share a planet that has finite natural resources  – and ‘grow’ in one part implies ‘shrink’ in another.  The Laws of the Universe are not negotiable. Mass, momentum and energy are conserved.

The fourth constraint is perceived to be the most difficult yet, paradoxically, is the one that we have most influence over.

It is the cultural constraint.

The collective, continuously evolving, unwritten rules of socially acceptable behaviour.


Improvement requires challenging our unconscious assumptions, our beliefs and our habits – and selectively updating those that are no longer fit-4-purpose.

To learn we first need to expose the gaps in our knowledge and then to fill them.

We need to test our hot rhetoric against cold reality – and when the fog of disillusionment forms we must rip up and rewrite what we have exposed to be old rubbish.

We need to examine our habits with forensic detachment and we need to ‘unlearn’ the ones that are limiting our effectiveness, and replace them with new habits that better leverage our capabilities.

And all of that is tough to do. Life is tough. Living is tough. Learning is tough. Leading is tough. But it energising too.

Having a model-of-effective-leadership to aspire to and a peer-group for mutual respect and support is a critical piece of the jigsaw.

It is not possible to improve a system alone. No matter how smart we are, how committed we are, or how hard we work.  A system can only be improved by the system itself. It is a collective and a collaborative challenge.


So with all that in mind let us sketch a blueprint for a leader of systemic cultural improvement.

What values, beliefs, attitudes, knowledge, skills and behaviours would be on our ‘must have’ list?

What hard evidence of effectiveness would we ask for? What facts, figures and feedback?

And with our check-list in hand would we feel confident to spot an ‘effective leader of systemic cultural improvement’ if we came across one?


This is a tough design assignment because it requires the benefit of  hindsight to identify the critical-to-success factors: our ‘must have and must do’ and ‘must not have and must not do’ lists.

H’mmmm ….

So let us take a more pragmatic and empirical approach. Let us ask …

“Are there any real examples of significant and sustained healthcare system improvement that are relevant to our specific context?”

And if we can find even just one Black Swan then we can ask …

Q1. What specifically was the significant and sustained improvement?
Q2. How specifically was the improvement achieved?
Q3. When exactly did the process start?
Q4. Who specifically led the system improvement?

And if we do this exercise for the NHS we discover some interesting things.

First let us look for exemplars … and let us start using some official material – the Monitor website (http://www.monitor.gov.uk) for example … and let us pick out ‘Foundation Trusts’ because they are the ones who are entrusted to run their systems with a greater degree of capability and autonomy.

And what we discover is a league table where those FTs that are OK are called ‘green’ and those that are Not OK are coloured ‘red’.  And there are some that are ‘under review’ so we will call them ‘amber’.

The criteria for deciding this RAG rating are embedded in a large balanced scorecard of objective performance metrics linked to a robust legal contract that provides the framework for enforcement.  Safety metrics like standardised mortality ratios, flow metrics like 18-week and 4-hour target yields, quality metrics like the friends-and-family test, and productivity metrics like financial viability.

A quick tally revealed 106 FTs in the green, 10 in the amber and 27 in the red.

But this is not much help with our quest for exemplars because it is not designed to point us to who has improved the most, it only points to who is failing the most!  The league table is a name-and-shame motivation-destroying cultural-missile fuelled by DRATs (delusional ratios and arbitrary targets) and armed with legal teeth.  A projection of the current top-down, Theory-X, burn-the-toast-then-scrape-it management-of-mediocrity paradigm. Oh dear!

However,  despite these drawbacks we could make better use of this data.  We could look at the ‘reds’ and specifically at their styles of cultural leadership and compare with a random sample of all the ‘greens’ and their models for success. We could draw out the differences and correlate with outcomes: red, amber or green.

That could offer us some insight and could give us the head start with our blueprint and check-list.


It would be a time-consuming and expensive piece of work and we do not want to wait that long. So what other avenues are there we can explore now and at no cost?

Well there are unofficial sources of information … the ‘grapevine’ … the stuff that people actually talk about.

What examples of effective improvement leadership in the NHS are people talking about?

Well a little blue bird tweeted one in my ear this week …

And specifically they are talking about a leader who has learned to walk-the-improvement-walk and is now talking-the-improvement-walk: and that is Sir David Dalton, the CEO of Salford Royal.

Here is a copy of the slides from Sir David’s recent lecture at the Kings Fund … and it is interesting to compare and contrast it with the style of NHS Leadership that led up to the Mid Staffordshire Failure, and to the Francis Report, and to the Keogh Report and to the Berwick Report.

Chalk and cheese!


So if you are an NHS employee would you rather work as part of an NHS Trust where the leaders walk-DD’s-walk and talk-DD’s-talk?

And if you are an NHS customer would you prefer that the leaders of your local NHS Trust walked Sir David’s walk too?


We are the system … we get the leaders that we deserve … we make the  choice … so we need to choose wisely … and we need to make our collective voice heard.

Actions speak louder than words.  Walk works better than talk.  We must be the change we want to see.

A Little Law and Order

teamwork_puzzle_build_PA_150_wht_2341[Bing bong]. The sound heralded Lesley logging on to the weekly Webex coaching session with Bob, an experienced Improvement Science Practitioner.

<Bob> Good afternoon Lesley.  How has your week been and what topic shall we explore today?

<Lesley> Hi Bob. Well in a nutshell, the bit of the system that I have control over feels like a fragile oasis of calm in a perpetual desert of chaos.  It is hard work keeping the oasis clear of the toxic sand that blows in!

<Bob> A compelling metaphor. I can just picture it.  Maintaining order amidst chaos requires energy. So what would you like to talk about?

<Lesley> Well, I have a small shoal of FISHees who I am guiding  through the foundation shallows and they are getting stuck on Little’s Law.  I confess I am not very good at explaining it and that suggests to me that I do not really understand it well enough either.

<Bob> OK. So shall we link those two theme – chaos and Little’s Law?

<Lesley> That sounds like an excellent plan!

<Bob> OK. So let us refresh the foundation knowledge. What is Little’s Law?

<Lesley>It is a fundamental Law of process physics that relates flow, with lead time and work in progress.

<Bob> Good. And specifically?

<Lesley> Average lead time is equal to the average flow multiplied by the average work in progress.

<Bob>Yes. And what are the units of flow in your equation?

<Lesley> Ah yes! That is  a trap for the unwary. We need to be clear how we express flow. The usual way is to state it as number of tasks in a defined period of time, such as patients admitted per day.  In Little’s Law the convention is to use the inverse of that which is the average interval between consecutive flow events. This is an unfamiliar way to present flow to most people.

<Bob> Good. And what is the reason that we use the ‘interval between events’ form?

<Leslie> Because it is easier to compare it with two critically important  flow metrics … the takt time and the cycle time.

<Bob> And what is the takt time?

<Leslie> It is the average interval between new tasks arriving … the average demand interval.

<Bob> And the cycle time?

<Leslie> It is the shortest average interval between tasks departing …. and is determined by the design of the flow constraint step.

<Bob> Excellent. And what is the essence of a stable flow design?

<Lesley> That the cycle time is less than the takt time.

<Bob>Why less than? Why not equal to?

<Leslie> Because all realistic systems need some flow resilience to exhibit stable and predictable-within-limits behaviour.

<Bob> Excellent. Now describe the design requirements for creating chronically chaotic system behaviour?

<Leslie> This is a bit trickier to explain. The essence is that for chronically chaotic behaviour to happen then there must be two feedback loops – a destabilising loop and a stabilising loop.  The destabilising loop creates the chaos, the stabilising loop ensures it is chronic.

<Bob> Good … so can you give me an example of a destabilising feedback loop?

<Leslie> A common one that I see is when there is a long delay between detecting a safety risk and the diagnosis, decision and corrective action.  The risks are often transitory so if the corrective action arrives long after the root cause has gone away then it can actually destabilise the process and paradoxically increase the risk of harm.

<Bob> Can you give me an example?

<Leslie>Yes. Suppose a safety risk is exposed by a near miss.  A delay in communicating the niggle and a root cause analysis means that the specific combination of factors that led to the near miss has gone. The holes in the Swiss cheese are not static … they move about in the chaos.  So the action that follows the accumulation of many undiagnosed near misses is usually the non-specific mantra of adding yet another safety-check to the already burgeoning check-list. The longer check-list takes more time to do, and is often repeated many times, so the whole flow slows down, queues grow bigger, waiting times get longer and as pressure comes from the delivery targets corners start being cut, and new near misses start to occur; on top of the other ones. So more checks are added and so on.

<Bob> An excellent example! And what is the outcome?

<Leslie> Chronic chaos which is more dangerous, more disordered and more expensive. Lose lose lose.

<Bob> And how do the people feel who work in the system?

<Leslie> Chronically naffed off! Angry. Demotivated. Cynical.

<Bob>And those feelings are the key symptoms.  Niggles are not only symptoms of poor process design, they are also symptoms of a much deeper problem: a violation of values.

<Leslie> I get the first bit about poor design; but what is that second bit about values?

<Bob>  We all have a set of values that we learned when we were very young and that have bee shaped by life experience.  They are our source of emotional energy, and our guiding lights in an uncertain world. Our internal unconscious check-list.  So when one of our values is violated we know because we feel angry. How that anger is directed varies from person to person … some internalise it and some externalise it.

<Leslie> OK. That explains the commonest emotion that people report when they feel a niggle … frustration which is the same as anger.

<Bob>Yes.  And we reveal our values by uncovering the specific root causes of our niggles.  For example if I value ‘Hard Work’ then I will be niggled by laziness. If you value ‘Experimentation’ then you may be niggled by ‘Rigid Rules’.  If someone else values ‘Safety’ then they may value ‘Rigid Rules’ and be niggled by ‘Innovation’ which they interpret as risky.

<Leslie> Ahhhh! Yes, I see.  This explains why there is so much impassioned discussion when we do a 4N Chart! But if this behaviour is so innate then it must be impossible to resolve!

<Bob> Understanding  how our values motivate us actually helps a lot because we are naturally attracted to others who share the same values – because we have learned that it reduces conflict and stress and improves our chance of survival. We are tribal and tribes share the same values.

<Leslie> Is that why different  departments appear to have different cultures and behaviours and why they fight each other?

<Bob> It is one factor in the Silo Wars that are a characteristic of some large organisations.  But Silo Wars are not inevitable.

<Leslie> So how are they avoided?

<Bob> By everyone knowing what common purpose of the organisation is and by being clear about what values are aligned with that purpose.

<Leslie> So in the healthcare context one purpose is avoidance of harm … primum non nocere … so ‘safety’ is a core value.  Which implies anything that is felt to be unsafe generates niggles and well-intended but potentially self-destructive negative behaviour.

<Bob> Indeed so, as you described very well.

<Leslie> So how does all this link to Little’s Law?

<Bob>Let us go back to the foundation knowledge. What are the four interdependent dimensions of system improvement?

<Leslie> Safety, Flow, Quality and Productivity.

<Bob> And one measure of  productivity is profit.  So organisations that have only short term profit as their primary goal are at risk of making poor long term safety, flow and quality decisions.

<Leslie> And flow is the key dimension – because profit is just  the difference between two cash flows: income and expenses.

<Bob> Exactly. One way or another it all comes down to flow … and Little’s Law is a fundamental Law of flow physics. So if you want all the other outcomes … without the emotionally painful disorder and chaos … then you cannot avoid learning to use Little’s Law.

<Leslie> Wow!  That is a profound insight.  I will need to lie down in a darkened room and meditate on that!

<Bob> An oasis of calm is the perfect place to pause, rest and reflect.

The 85% Optimum Occupancy Myth

egg_face_spooked_400_wht_13421There seems to be a belief among some people that the “optimum” average bed occupancy for a hospital is around 85%.

More than that risks running out of beds and admissions being blocked, 4 hour breaches appearing and patients being put at risk. Less than that is inefficient use of expensive resources. They claim there is a ‘magic sweet spot’ that we should aim for.

Unfortunately, this 85% optimum occupancy belief is a myth.

So, first we need to dispel it, then we need to understand where it came from, and then we are ready to learn how to actually prevent queues, delays, disappointment, avoidable harm and financial non-viability.


Disproving this myth is surprisingly easy.   A simple thought experiment is enough.

Suppose we have a policy where  we keep patients in hospital until someone needs their bed, then we discharge the patient with the longest length of stay and admit the new one into the still warm bed – like a baton pass.  There would be no patients turned away – 0% breaches.  And all our the beds would always be full – 100% occupancy. Perfection!

And it does not matter if the number of admissions arriving per day is varying – as it will.

And it does not matter if the length of stay is varying from patient to patient – as it will.

We have disproved the hypothesis that a maximum 85% average occupancy is required to achieve 0% breaches.


The source of this specific myth appears to be a paper published in the British Medical Journal in 1999 called “Dynamics of bed use in accommodating emergency admissions: stochastic simulation model

So it appears that this myth was cooked up by academic health economists using a computer model.

And then amateur queue theory zealots jump on the band-wagon to defend this meaningless mantra and create a smoke-screen by bamboozling the mathematical muggles with tales of Poisson processes and Erlang equations.

And they are sort-of correct … the theoretical behaviour of the “ideal” stochastic demand process was described by Poisson and the equations that describe the theoretical behaviour were described by Agner Krarup Erlang.  Over 100 years ago before we had computers.

BUT …

The academics and amateurs conveniently omit one minor, but annoying,  fact … that real world systems have people in them … and people are irrational … and people cook up policies that ride roughshod over the mathematics, the statistics and the simplistic, stochastic mathematical and computer models.

And when creative people start meddling then just about anything can happen!


So what went wrong here?

One problem is that the academic hefalumps unwittingly stumbled into a whole minefield of pragmatic process design traps.

Here are just some of them …

1. Occupancy is a ratio – it is a meaningless number without its context – the flow parameters.

2. Using linear, stochastic models is dangerous – they ignore the non-linear complex system behaviours (chaos to you and me).

3. Occupancy relates to space-capacity and says nothing about the flow-capacity or the space-capacity and flow-capacity scheduling.

4. Space-capacity utilisation (i.e. occupancy) and systemic operational efficiency are not equivalent.

5. Queue theory is a simplification of reality that is needed to make the mathematics manageable.

6. Ignoring the fact that our real systems are both complex and adaptive implies that blind application of basic queue theory rhetoric is dangerous.

And if we recognise and avoid these traps and we re-examine the problem a little more pragmatically then we discover something very  useful:

That the maximum space capacity requirement (the number of beds needed to avoid breaches) is actually easily predictable.

It does not need a black-magic-box full of scary queue theory equations or rather complicated stochastic simulation models to do this … all we need is our tried-and-trusted tool … a spreadsheet.

And we need something else … some flow science training and some simulation model design discipline.

When we do that we discover something else …. that the expected average occupancy is not 85%  … or 65%, or 99%, or 95%.

There is no one-size-fits-all optimum occupancy number.

And as we explore further we discover that:

The expected average occupancy is context dependent.

And when we remember that our real system is adaptive, and it is staffed with well-intended, well-educated, creative people (who may have become rather addicted to reactive fire-fighting),  then we begin to see why the behaviour of real systems seems to defy the predictions of the 85% optimum occupancy myth:

Our hospitals seem to work better-than-predicted at much higher occupancy rates.

And then we realise that we might actually be able to design proactive policies that are better able to manage unpredictable variation; better than the simplistic maximum 85% average occupancy mantra.

And finally another penny drops … average occupancy is an output of the system …. not an input. It is an effect.

And so is average length of stay.

Which implies that setting these output effects as causal inputs to our bed model creates a meaningless, self-fulfilling, self-justifying delusion.

Ooops!


Now our challenge is clear … we need to learn proactive and adaptive flow policy design … and using that understanding we have the potential to deliver zero delays and high productivity at the same time.

And doing that requires a bit more than a spreadsheet … but it is possible.

Economy-of-Scale vs Economy-of-Flow

We_Need_Small_HospitalsThis was an interesting headline to see on the front page of a newspaper yesterday!

The Top Man of the NHS is openly challenging the current Centralisation-is-The-Only-Way-Forward Mantra;  and for good reason.
Mass centralisation is poor system design – very poor.

Q: So what is driving the centralisation agenda?

A: Money.

Or to be more precise – rather simplistic thinking about money.

The misguided money logic goes like this:

1. Resources (such as highly trained doctors, nurses and AHPs) cost a lot of money to provide.
[Yes].

2. So we want all these resources to be fully-utilised to get value-for-money.
[No, not all – just the most expensive].

3. So we will gather all the most expensive resources into one place to get the Economy-of-Scale.
[No, not all the most expensive – just the most specialised]

4. And we will suck /push all the work through these super-hubs to keep our expensive specialist resources busy all the time.
[No, what about the growing population of older folks who just need a bit of expert healthcare support, quickly, and close to home?]

This flawed logic confuses two complementary ways to achieve higher system productivity/economy/value-for-money without  sacrificing safety:

Economies of Scale (EoS) and Economies of Flow (EoF).

Of the two the EoF is the more important because by using EoF principles we can increase productivity in huge leaps at almost no cost; and without causing harm and disappointment. EoS are always destructive.

But that is impossible. You are talking rubbish … because if it were possible we would be doing it!

It is not impossible and we are doing it … but not at scale and pace in healthcare … and the reason for that is we are not trained in Economy-of-Flow methods.

And those who are trained and who have have experienced the effects of EoF would not do it any other way.

Example:

In a recent EoF exercise an ISP (Improvement Science Practitioner) helped a surgical team to increase their operating theatre productivity by 30% overnight at no cost.  The productivity improvement was measured and sustained for most of the last year. [it did dip a bit when the waiting list evaporated because of the higher throughput, and again after some meddlesome middle management madness was triggered by end-of-financial-year target chasing].  The team achieved the improvement using Economy of Flow principles and by re-designing some historical scheduling policies. The new policies  were less antagonistic. They were designed to line the ducks up and as a result the flow improved.


So the specific issue of  Super Hospitals vs Small Hospitals is actually an Economy of Flow design challenge.

But there is another critical factor to take into account.

Specialisation.

Medicine has become super-specialised for a simple reason: it is believed that to get ‘good enough’ at something you have to have a lot of practice. And to get the practice you have to have high volumes of the same stuff – so you need to specialise and then to sort undifferentiated work into separate ‘speciologist’ streams or sequence the work through separate speciologist stages.

Generalists are relegated to second-class-citizen status; mere tripe-skimmers and sign-posters.

Specialisation is certainly one way to get ‘good enough’ at doing something … but it is not the only way.

Another way to learn the key-essentials from someone who already knows (and can teach) and then to continuously improve using feedback on what works and what does not – feedback from everywhere.

This second approach is actually a much more effective and efficient way to develop expertise – but we have not been taught this way.  We have only learned the scrape-the-burned-toast-by-suck-and-see method.

We need to experience another way.

We need to experience rapid acquisition of expertise!

And being able to gain expertise quickly means that we can become expert generalists.

There is good evidence that the broader our skill-set the more resilient we are to change, and the more innovative we are when faced with novel challenges.

In the Navy of the 1800’s sailors were “Jacks of All Trades and Master of One” because if only one person knew how to navigate and they got shot or died of scurvy the whole ship was doomed.  Survival required resilience and that meant multi-skilled teams who were good enough at everything to keep the ship afloat – literally.


Specialisation has another big drawback – it is very expensive and on many dimensions. Not just Finance.

Example:

Suppose we have six-step process and we have specialised to the point where an individual can only do one step to the required level of performance (safety/flow/quality/productivity).  The minimum number of people we need is six and the process only flows when we have all six people. Our minimum costs are high and they do not scale with flow.

If any one of the six are not there then the whole process stops. There is no flow.  So queues build up and smooth flow is sacrificed.

Out system behaves in an unstable and chaotic feast-or-famine manner and rapidly shifting priorities create what is technically called ‘thrashing’.

And the special-six do not like the constant battering.

And the special-six have the power to individually hold the whole system to ransom – they do not even need to agree.

And then we aggravate the problem by paying them the high salary that it is independent of how much they collectively achieve.

We now have the perfect recipe for a bigger problem!  A bunch of grumpy, highly-paid specialists who blame each other for the chaos and who incessantly clamour for ‘more resources’ at every step.

This is not financially viable and so creates the drive for economy-of-scale thinking in which to get us ‘flow resilience’ we need more than one specialist at each of the six steps so that if one is on holiday or off sick then the process can still flow.  Let us call these tribes of ‘speciologists’ there own names and budgets, and now we need to put all these departments somewhere – so we will need a big hospital to fit them in – along with the queues of waiting work that they need.

Now we make an even bigger design blunder.  We assume the ‘efficiency’ of our system is the same as the average utilisation of all the departments – so we trim budgets until everyone’s utilisation is high; and we suck any-old work in to ensure there is always something to do to keep everyone busy.

And in so doing we sacrifice all our Economy of Flow opportunities and we then scratch our heads and wonder why our total costs and queues are escalating,  safety and quality are falling, the chaos continues, and our tribes of highly-paid specialists are as grumpy as ever they were!   It must be an impossible-to-solve problem!


Now contrast that with having a pool of generalists – all of whom are multi-skilled and can do any of the six steps to the required level of expertise.  A pool of generalists is a much more resilient-flow design.

And the key phrase here is ‘to the required level of expertise‘.

That is how to achieve Economy-of-Flow on a small scale without compromising either safety or quality.

Yes, there is still a need for a super-level of expertise to tackle the small number of complex problems – but that expertise is better delivered as a collective-expertise to an individual problem-focused process.  That is a completely different design.

Designing and delivering a system that that can achieve the synergy of the pool-of-generalists and team-of-specialists model requires addressing a key error of omission first: we are not trained how to do this.

We are not trained in Complex-Adaptive-System Improvement-by-Design.

So that is where we must start.


Alignment of Purpose

woman_back_and_forth_questions_150_wht_12477<Lesley> Hi Bob, how are you today?

<Bob> I’m OK thanks Lesley. Having a bit of a break from the daily grind.

<Lesley> Oh! I am sorry, I had no idea you were on holiday. I will call when you are back at work.

<Bob> No need Lesley. Our chats are always a welcome opportunity to reflect and learn.

<Lesley> OK, if you are sure.  The top niggle on my list at the moment is that I do not feel my organisation values what I do.

<Bob> OK. Have you done the diagnostic Right-2-Left Map® backwards from that top niggle?

<Lesley>Yes. The final straw was that I was asked to justify my improvement role.

<Bob> OK, and before that?

<Lesley> There have been some changes in the senior management team.

<Bob> OK. This sounds like the ‘New Brush Sweeps Clean’ effect.

<Lesley> I have heard that phrase before. What does it mean in this context?

<Bob> Senior management changes are very disruptive events. The more senior the change the more disruptive it is.  Let us call it a form of ‘Disruptive Innovation’.  The trigger for the change is important.  One trigger might be a well-respected and effective leader retiring or moving to an even more senior role.  This leaves a leadership gap which is an opportunity for someone to grow and develop.  Another trigger might be a less-respected  and ineffective leader moving on and leaving a trail of rather-too-visible failures. It is the latter tends to be associated with the New Broom effect.

<Lesley> How is that?

<Bob>Well, put yourself in the shoes of the New Leader who has inherited a Trail of Disappointment – you need to establish your authority and expectation quickly and decisively. Ambiguity and lack of clarity will only contribute to further disappointment.  So you have to ask everyone to justify what they do.  And if they cannot then you need to know that.  And if they can then you need to decide if what they do is aligned with your purpose.  This is the New Brush.

<Lesley> So what if I can justify what I do and that does not fit with the ‘New Leader’s Plan’?

<Bob> If what you do is aligned to your Life Purpose but not with the New Brush then you have to choose.  And experience shows that the road to long term personal happiness is the one the aligns with your individual purpose.  And often it is just a matter of timing. The New Brush is indiscriminate and impatient – anything that does not fit neatly into the New Plan has to go.

<Lesley> OK my purpose is to improve the safety, flow, quality and productivity of healthcare processes – for the benefit of all. That is not negotiable. It is what fires my passion and fuels my day.  So does it matter really where or how I do that?

<Bob> Not really.  You do need be mindful of the pragmatic constraints though … your life circumstances.  There are many paths to your Purpose, so it is wise to choose one that is low enough risk to both you and those you love.

<Lesley> Ah! Now I see why you say that timing is important. You need to prepare to be able to make the decision.  You do not what to be caught by surprise and off balance.

<Bob>Yes. That is why as an ISP you always start with your own Purpose and your own Right-2-Left Map®.  Then you will know what to prepare and in what order so that you have the maximum number of options when you have to make a choice.  Sometimes the Universe will create the trigger and sometimes you have to initiate it yourself.

<Lesley> So this is just another facet of Improvement Science?

<Bob>  Yes.

Our Iceberg Is Melting

hold_your_ground_rope_300_wht_6223[Dring Dring] The telephone soundbite announced the start of the coaching session.

<Bob> Good morning Leslie. How are you today?

<Leslie> I have been better.

<Bob> You seem upset. Do you want to talk about it?

<Leslie> Yes, please. The trigger for my unhappiness is that last week I received an email demanding that I justify the time I spend doing improvement work and  a summons to a meeting to ‘discuss some issues that have been raised‘.

<Bob> OK. I take it that you do not know what or who has triggered this inquiry.

<Leslie> You are correct. My working hypothesis is that it is the end of the financial year and budget holders are looking for opportunities to do some pruning – to meet their cost improvement program targets!

<Bob> So what is the problem? You have shared the output of your work. You have demonstrated significant improvements in safety, flow, quality and productivity and you have described both them and the methodology clearly.

<Leslie> I know. That us why I was so upset to get this email. It is as if everything that we have achieved has been ignored. It is almost as if it is resented.

<Bob> Ah! You may well be correct.  This is the nature of paradigm shifts. Those who have the greatest vested interest in the current paradigm get spooked when they feel it start to wobble. Each time you share the outcome of your improvement work you create emotional shock-waves. The effects are cumulative and eventually there will be is a ‘crisis of confidence’ in those who feel most challenged by the changes that you are demonstrating are possible.  The whole process is well described in Thomas Kuhn’s The Structure of Scientific Revolutions. That is not a book for an impatient reader though – for those who prefer something lighter I recommend “Our Iceberg is Melting” by John Kotter.

<Leslie> Thanks Bob. I will get a copy of Kotter’s book – that sounds more my cup of tea. Will that tell me what to do?

<Bob> It is a parable – a fictional story of a colony of penguins who discover that their iceberg is melting and are suddenly faced with a new and urgent potential risk of not surviving the storms of the approaching winter. It is not a factual account of a real crisis or a step-by-step recipe book for solving all problems  – it describes some effective engagement strategies in general terms.

<Leslie> I will still read it. What I need is something more specific to my actual context.

<Bob> This is an improvement-by-design challenge. The only difference from the challenges you have done already is that this time the outcome you are looking for is a smooth transition from the ‘old’ paradigm to the ‘new’ one.  Kuhn showed that this transition will not start to happen until there is a new paradigm because individuals choose to take the step from the old to the new and they do not all do that at the same time.  Your work is demonstrating that there is a new paradigm. Some will love that message, some will hate it. Rather like Marmite.

<Leslie> Yes, that make sense.  But how do I deal with an unseen enemy who is stirring up trouble behind my back?

<Bob> Are you are referring to those who have ‘raised some issues‘?

<Leslie> Yes.

<Bob> They will be the ones who have most invested in the current status quo and they will not be in senior enough positions to challenge you directly so they are going around spooking the inner Chimps of those who can. This is expected behaviour when the relentlessly changing reality starts to wobble the concrete current paradigm.

<Leslie> Yes! That is  exactly how it feels.

<Bob> The danger lurking here is that your inner Chimp is getting spooked too and is conjuring up Gremlins and Goblins from the Computer! Left to itself your inner Chimp will steer you straight into the Victim Vortex.  So you need to take it for a long walk, let it scream and wave its hairy arms about, listen to it, and give it lots of bananas to calm it down. Then put your put your calmed-down Chimp into its cage and your ‘paradigm transition design’ into the Computer. Only then will you be ready for the ‘so-justify-yourself’ meeting.  At the meeting your Chimp will be out of its cage like a shot and interpreting everything as a threat. It will disable you and go straight to the Computer for what to do – and it will read your design and follow the ‘wise’ instructions that you have put in there.

<Leslie> Wow! I see how you are using the Chimp Paradox metaphor to describe an incredibly complex emotional process in really simple language. My inner Chimp is feeling happier already!

<Bob> And remember that you are in all in the same race. Your collective goal is to cross the finish line as quickly as possible with the least chaos, pain and cost.  You are not in a battle – that is lose-lose inner Chimp thinking.  The only message that your interrogators must get from you is ‘Win-win is possible and here is how we can do it‘. That will be the best way to soothe their inner Chimps – the ones who fear that you are going to sink their boat by rocking it.

<Leslie> That is really helpful. Thank you again Bob. My inner Chimp is now snoring gently in its cage and while it is asleep I have some Improvement-by-Design work to do and then some Computer programming.

Jiggling

hurry_with_the_SFQP_kit[Dring] Bob’s laptop signaled the arrival of Leslie for their regular ISP remote coaching session.

<Bob> Hi Leslie. Thanks for emailing me with a long list of things to choose from. It looks like you have been having some challenging conversations.

<Leslie> Hi Bob. Yes indeed! The deepening gloom and the last few blog topics seem to be polarising opinion. Some are claiming it is all hopeless and others, perhaps out of desperation, are trying the FISH stuff for themselves and discovering that it works.  The ‘What Ifs’ are engaged in war of words with the ‘Yes Buts’.

<Bob> I like your metaphor! Where would you like to start on the long list of topics?

<Leslie> That is my problem. I do not know where to start. They all look equally important.

<Bob> So, first we need a way to prioritise the topics to get the horse-before-the-cart.

<Leslie> Sounds like a good plan to me!

<Bob> One of the problems with the traditional improvement approaches is that they seem to start at the most difficult point. They focus on ‘quality’ first – and to be fair that has been the mantra from the gurus like W.E.Deming. ‘Quality Improvement’ is the Holy Grail.

<Leslie>But quality IS important … are you saying they are wrong?

<Bob> Not at all. I am saying that it is not the place to start … it is actually the third step.

<Leslie>So what is the first step?

<Bob> Safety. Eliminating avoidable harm. Primum Non Nocere. The NoNos. The Never Events. The stuff that generates the most fear for everyone. The fear of failure.

<Leslie> You mean having a service that we can trust not to harm us unnecessarily?

<Bob> Yes. It is not a good idea to make an unsafe design more efficient – it will deliver even more cumulative harm!

<Leslie> OK. That makes perfect sense to me. So how do we do that?

<Bob> It does not actually matter.  Well-designed and thoroughly field-tested checklists have been proven to be very effective in the ‘ultra-safe’ industries like aerospace and nuclear.

<Leslie> OK. Something like the WHO Safe Surgery Checklist?

<Bob> Yes, that is a good example – and it is well worth reading Atul Gawande’s book about how that happened – “The Checklist Manifesto“.  Gawande is a surgeon who had published a lot on improvement and even so was quite skeptical that something as simple as a checklist could possibly work in the complex world of surgery. In his book he describes a number of personal ‘Ah Ha!’ moments that illustrate a phenomenon that I call Jiggling.

<Leslie> OK. I have made a note to read Checklist Manifesto and I am curious to learn more about Jiggling – but can we stick to the point? Does quality come after safety?

<Bob> Yes, but not immediately after. As I said, Quality is the third step.

<Leslie> So what is the second one?

<Bob> Flow.

There was a long pause – and just as Bob was about to check that the connection had not been lost – Leslie spoke.

<Leslie> But none of the Improvement Schools teach basic flow science.  They all focus on quality, waste and variation!

<Bob> I know. And attempting to improve quality before improving flow is like papering the walls before doing the plastering.  Quality cannot grow in a chaotic context. The flow must be smooth before that. And the fear of harm must be removed first.

<Leslie> So the ‘Improving Quality through Leadership‘ bandwagon that everyone is jumping on will not work?

<Bob> Well that depends on what the ‘Leaders’ are doing. If they are leading the way to learning how to design-for-safety and then design-for-flow then the bandwagon might be a wise choice. If they are only facilitating collaborative agreement and group-think then they may be making an unsafe and ineffective system more efficient which will steer it over the edge into faster decline.

<Leslie>So, if we can stabilize safety using checklists do we focus on flow next?

<Bob>Yup.

<Leslie> OK. That makes a lot of sense to me. So what is Jiggling?

<Bob> This is Jiggling. This conversation.

<Leslie> Ah, I see. I am jiggling my understanding through a series of ‘nudges’ from you.

<Bob>Yes. And when the learning cogs are a bit rusty, some Improvement Science Oil and a bit of Jiggling is more effective and much safer than whacking the caveman wetware with a big emotional hammer.

<Leslie>Well the conversation has certainly jiggled Safety-Flow-Quality-and-Productivity into a sensible order for me. That has helped a lot. I will sort my to-do list into that order and start at the beginning. Let me see. I have a plan for safety, now I can focus on flow. Here is my top flow niggle. How do I design the resource capacity I need to ensure the flow is smooth and the waiting times are short enough to avoid ‘persecution’ by the Target Time Police?

<Bob> An excellent question! I will send you the first ISP Brainteaser that will nudge us towards an answer to that question.

<Leslie> I am ready and waiting to have my brain-teased and my niggles-nudged!

The Speed of Trust

London_UndergroundSystems are built from intersecting streams of work called processes.

This iconic image of the London Underground shows a system map – a set of intersecting transport streams.

Each stream links a sequence of independent steps – in this case the individual stations.  Each step is a system in itself – it has a set of inner streams.

For a system to exhibit stable and acceptable behaviour the steps must be in synergy – literally ‘together work’. The steps also need to be in synchrony – literally ‘same time’. And to do that they need to be aligned to a common purpose.  In the case of a transport system the design purpose is to get from A to B safety, quickly, in comfort and at an affordable cost.

In large socioeconomic systems called ‘organisations’ the steps represent groups of people with special knowledge and skills that collectively create the desired product or service.  This creates an inevitable need for ‘handoffs’ as partially completed work flows through the system along streams from one step to another. Each step contributes to the output. It is like a series of baton passes in a relay race.

This creates the requirement for a critical design ingredient: trust.

Each step needs to be able to trust the others to do their part:  right-first-time and on-time.  All the steps are directly or indirectly interdependent.  If any one of them is ‘untrustworthy’ then the whole system will suffer to some degree. If too many generate dis-trust then the system may fail and can literally fall apart. Trust is like social glue.

So a critical part of people-system design is the development and the maintenance of trust-bonds.

And it does not happen by accident. It takes active effort. It requires design.

We are social animals. Our default behaviour is to trust. We learn distrust by experiencing repeated disappointments. We are not born cynical – we learn that behaviour.

The default behaviour for inanimate systems is disorder – and it has a fancy name – it is called ‘entropy’. There is a Law of Physics that says that ‘the average entropy of a system will increase over time‘. The critical word is ‘average’.

So, if we are not aware of this and we omit to pay attention to the hand-offs between the steps we will observe increasing disorder which leads to repeated disappointments and erosion of trust. Our natural reaction then is ‘self-protect’ which implies ‘check-and-reject’ and ‘check and correct’. This adds complexity and bureaucracy and may prevent further decline – which is good – but it comes at a cost – quite literally.

Eventually an equilibrium will be achieved where our system performance is limited by the amount of check-and-correct bureaucracy we can afford.  This is called a ‘mediocrity trap’ and it is very resilient – which means resistant to change in any direction.


To escape from the mediocrity trap we need to break into the self-reinforcing check-and-reject loop and we do that by developing a design that challenges ‘trust eroding behaviour’.  The strategy is to develop a skill called  ‘smart trust’.

To appreciate what smart trust is we need to view trust as a spectrum: not as a yes/no option.

At one end is ‘nonspecific distrust’ – otherwise known as ‘cynical behaviour’. At the other end is ‘blind trust’ – otherwise  known and ‘gullible behaviour’.  Neither of these are what we need.

In the middle is the zone of smart trust that spans healthy scepticism  through to healthy optimism.  What we need is to maintain a balance between the two – not to eliminate them. This is because some people are ‘glass-half-empty’ types and some are ‘glass-half-full’. And both views have a value.

The action required to develop smart trust is to respectfully challenge every part of the organisation to demonstrate ‘trustworthiness’ using evidence.  Rhetoric is not enough. Politicians always score very low on ‘most trusted people’ surveys.

The first phase of this smart trust development is for steps to demonstrate trustworthiness to themselves using their own evidence, and then to share this with the steps immediately upstream and downstream of them.

So what evidence is needed?

SFQP1Safety comes first. If a step cannot be trusted to be safe then that is the first priority. Safe systems need to be designed to be safe.

Flow comes second. If the streams do not flow smoothly then we experience turbulence and chaos which increases stress,  the risk of harm and creates disappointment for everyone. Smooth flow is the result of careful  flow design.

Third is Quality which means ‘setting and meeting realistic expectations‘.  This cannot happen in an unsafe, chaotic system.  Quality builds on Flow which builds on Safety. Quality is a design goal – an output – a purpose.

Fourth is Productivity (or profitability) and that does not automatically follow from the other three as some QI Zealots might have us believe. It is possible to have a safe, smooth, high quality design that is unaffordable.  Productivity needs to be designed too.  An unsafe, chaotic, low quality design is always more expensive.  Always. Safe, smooth and reliable can be highly productive and profitable – if designed to be.

So whatever the driver for improvement the sequence of questions is the same for every step in the system: “How can I demonstrate evidence of trustworthiness for Safety, then Flow, then Quality and then Productivity?”

And when that happens improvement will take off like a rocket. That is the Speed of Trust.  That is Improvement Science in Action.

The Time Trap

clock_hands_spinning_import_150_wht_3149[Hmmmmmm] The desk amplified the vibration of Bob’s smartphone as it signaled the time for his planned e-mentoring session with Leslie.

[Dring Dring]

<Bob> Hi Leslie, right-on-time, how are you today?

<Leslie> Good thanks Bob. I have a specific topic to explore if that is OK. Can we talk about time traps.

<Bob> OK – do you have a specific reason for choosing that topic?

<Leslie> Yes. The blog last week about ‘Recipe for Chaos‘ set me thinking and I remembered that time-traps were mentioned in the FISH course but I confess, at the time, I did not understand them. I still do not.

<Bob> Can you describe how the ‘Recipe for Chaos‘ blog triggered this renewed interest in time-traps?

<Leslie> Yes – the question that occurred to me was: ‘Is a time-trap a recipe for chaos?’

<Bob> A very good question! What do you feel the answer is?

<Leslie>I feel that time-traps can and do trigger chaos but I cannot explain how. I feel confused.

<Bob>Your intuition is spot on – so can you localize the source of your confusion?

<Leslie>OK. I will try. I confess I got the answer to the MCQ correct by guessing – and I wrote down the answer when I eventually guessed correctly – but I did not understand it.

<Bob>What did you write down?

<Leslie>“The lead time is independent of the flow”.

<Bob>OK. That is accurate – though I agree it is perhaps a bit abstract. One source of confusion may be that there are different causes of of time-traps and there is a lot of overlap with other chaos-creating policies. Do you have a specific example we can use to connect theory with reality?

<Leslie> OK – that might explain my confusion.  The example that jumped to mind is the RTT target.

<Bob> RTT?

<Leslie> Oops – sorry – I know I should not use undefined abbreviations. Referral to Treatment Time.

<Bob> OK – can you describe what you have mapped and measured already?

<Leslie> Yes.  When I plot the lead-time for patients in date-of-treatment order the process looks stable but the histogram is multi-modal with a big spike just underneath the RTT target of 18 weeks. What you describe as the ‘Horned Gaussian’ – the sign that the performance target is distorting the behaviour of the system and the design of the system is not capable on its own.

<Bob> OK and have you investigated why there is not just one spike?

<Leslie> Yes – the factor that best explains that is the ‘priority’ of the referral.  The  ‘urgents’ jump in front of the ‘soons’ and both jump in front of the ‘routines’. The chart has three overlapping spikes.

<Bob> That sounds like a reasonable policy for mixed-priority demand. So what is the problem?

<Leslie> The ‘Routine’ group is the one that clusters just underneath the target. The lead time for routines is almost constant but most of the time those patients sit in one queue or another being leap-frogged by other higher-priority patients. Until they become high-priority – then they do the leap frogging.

<Bob> OK – and what is the condition for a time trap again?

<Leslie> That the lead time is independent of flow.

<Bob>Which implies?

<Leslie> Um. let me think. That the flow can be varying but the lead time stays the same?

<Bob> Yup. So is the flow of routine referrals varying?

<Leslie> Not over the long term. The chart is stable.

<Bob> What about over the short term? Is demand constant?

<Leslie>No of course not – it varies – but that is expected for all systems. Constant means ‘over-smoothed data’ – the Flaw of Averages trap!

<Bob>OK. And how close is the average lead time for routines to the RTT maximum allowable target?

<Leslie> Ah! I see what you mean. The average is about 17 weeks and the target is 18 weeks.

<Bob>So what is the flow variation on a week-to-week time scale?

<Leslie>Demand or Activity?

<Bob>Both.

<Leslie>H’mm – give me a minute to re-plot flow as a weekly-aggregated chart. Oh! I see what you mean – both the weekly activity and demand are both varying widely and they are not in sync with each other. Work in progress must be wobbling up and down a lot! So how can the lead time variation be so low?

<Bob>What do the flow histograms look like?

<Leslie> Um. Just a second. That is weird! They are both bi-modal with peaks at the extremes and not much in the middle – the exact opposite of what I expected to see! I expected a centered peak.

<Bob>What you are looking at is the characteristic flow fingerprint of a chaotic system – it is called ‘thrashing’.

<Leslie> So I was right!

<Bob> Yes. And now you know the characteristic pattern to look for. So what is the policy design flaw here?

<Leslie>The DRAT – the delusional ratio and arbitrary target?

<Bob> That is part of it – that is the external driver policy. The one you cannot change easily. What is the internally driven policy? The reaction to the DRAT?

<Leslie> The policy of leaving routine patients until they are about to breach then re-classifying them as ‘urgent’.

<Bob>Yes! It is called a ‘Prevarication Policy’ and it is surprisingly and uncomfortably common. Ask yourself – do you ever prevaricate? Do you ever put off ‘lower priority’ tasks until later and then not fill the time freed up with ‘higher priority tasks’?

<Leslie> OMG! I do that all the time! I put low priority and unexciting jobs on a ‘to do later’ heap but I do not sit idle – I do then focus on the high priority ones.

<Bob> High priority for whom?

<Leslie> Ah! I see what you mean. High priority for me. The ones that give me the biggest reward! The fun stuff or the stuff that I get a pat on the back for doing or that I feel good about.

<Bob> And what happens?

<Leslie> The heap of ‘no-fun-for-me-to-do’ jobs gets bigger and I await the ‘reminders’ and then have to rush round in a mad panic to avoid disappointment, criticism and blame. It feels chaotic. I get grumpy. I make more mistakes and I deliver lower-quality work. If I do not get a reminder I assume that the job was not that urgent after all and if I am challenged I claim I am too busy doing the other stuff.

<Bob> Have you avoided disappointment?

<Leslie> Ah! No – that I needed to be reminded meant that I had already disappointed. And when I do not get a reminded does not prove I have not disappointed either. Most people blame rather than complain. I have just managed to erode other people’s trust in my reliability. I have disappointed myself. I have achieved exactly the opposite of what I intended. Drat!

<Bob> So what is the reason that you work this way? There will be a reason.  A good reason.
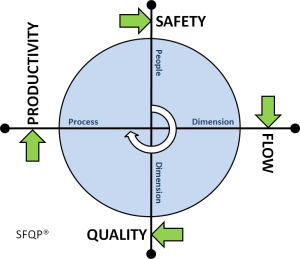
<Leslie> That is a very good question! I will reflect on that because I believe it will help me understand why others behave this way too.

<Bob> OK – I will be interested to hear your conclusion.  Let us return to the question. What is the  downside of a ‘Prevarication Policy’?

<Leslie> It creates stress, chaos, fire-fighting, last minute changes, increased risk of errors,  more work and it erodes both quality, confidence and trust.

<Bob>Indeed so – and the impact on productivity?

<Leslie> The activity falls, the system productivity falls, revenue falls, queues increase, waiting times increase and the chaos increases!

<Bob> And?

<Leslie> We treat the symptoms by throwing resources at the problem – waiting list initiatives – and that pushes our costs up. Either way we are heading into a spiral of decline and disappointment. We do not address the root cause.

<Bob> So what is the way out of chaos?

<Leslie> Reduce the volume on the destabilizing feedback loop? Stop the managers meddling!

<Bob> Or?

<Leslie> Eh? I do not understand what you mean. The blog last week said management meddling was the problem.

<Bob> It is a problem. How many feedback loops are there?

<Leslie> Two – that need to be balanced.

<Bob> So what is another option?

<Leslie> OMG! I see. Turn UP the volume of the stabilizing feedback loop!

<Bob> Yup. And that is a lot easier to do in reality. So that is your other challenge to reflect on this week. And I am delighted to hear you using the terms ‘stabilizing feedback loop’ and ‘destabilizing feedback loop’.

<Leslie> Thank you. That was a lesson for me after last week – when I used the terms ‘positive and negative feedback’ it was interpreted in the emotional context – positive feedback as encouragement and negative feedback as criticism.  So ‘reducing positive feedback’ in that sense is the exact opposite of what I was intending. So I switched my language to using ‘stabilizing and destabilizing’ feedback loops that are much less ambiguous and the confusion and conflict disappeared.

<Bob> That is very useful learning Leslie … I think I need to emphasize that distinction more in the blog. That is one advantage of online media – it can be updated!

 <Leslie> Thanks again Bob!  And I have the perfect opportunity to test a new no-prevarication-policy design – in part of the system that I have complete control over – me!

The Recipe for Chaos

boxes_group_PA4_150_wht_4916There are only four ingredients required to create Chaos.

The first is Time.

All processes and systems are time-dependent.

The second ingredient is a Metric of Interest (MoI).

That means a system performance metric that is important to all – such as a Safety or Quality or Cost; and usually all three.

The third ingredient is a feedback loop of a specific type – it is called a Negative Feedback Loop.  The NFL  is one that tends to adjust, correct and stabilise the behaviour of the system.

Negative feedback loops are very useful – but they have a drawback. They resist change and they reduce agility. The name is also a disadvantage – the word ‘negative feedback’ is often associated with criticism.

The fourth and final ingredient in our Recipe for Chaos is also a feedback loop but one of a different design – a Positive Feedback Loop (PFL)- one that amplifies variation and change.

Positive feedback loops are also very useful – they are required for agility – quick reactions to unexpected events. Fast reflexes.

The downside of a positive feedback loop is that increases instability.

The name is also confusing – ‘positive feedback’ is associated with encouragement and praise.

So, in this context it is better to use the terms ‘stabilizing feedback’ and ‘destabilizing feedback’  loops.

When we mix these four ingredients in just the right amounts we get a system that may behave chaotically. That is surprising and counter-intuitive. But it is how the Universe works.

For example:

Suppose our Metric of Interest is the amount of time that patients spend in a Accident and Emergency Department. We know that the longer this time is the less happy they are and the higher the risk of avoidable harm – so it is a reasonable goal to reduce it.

Longer-than-possible waiting times have many root causes – it is a non-specific metric.  That means there are many things that could be done to reduce waiting time and the most effective actions will vary from case-to-case, day-to-day and even minute-to-minute.  There is no one-size-fits-all solution.

This implies that those best placed to correct the causes of these delays are the people who know the specific system well – because they work in it. Those who actually deliver urgent care. They are the stabilizing ingredient in our Recipe for Chaos.

The destabilizing ingredient is the hit-the-arbitrary-target policy which drives a performance management feedback loop.

This policy typically involves:
(1) Setting a performance target that is desirable but impossible for the current design to achieve reliably;
(2) inspecting how close to the target we are; then
(3) using the real-time data to justify threats of dire consequences for failure.

Now we have a perfect Recipe for Chaos.

The higher the failure rate the more inspections, reports, meetings, exhortations, threats, interruptions, and interventions that are generated.  Fear-fuelled management meddling. This behaviour consumes valuable time – so leaves less time to do the worthwhile work. Less time to devote to safety, flow, and quality. The queues build and the pressure increases and the system becomes hyper-sensitive to small fluctuations. Delays multiply and errors are more likely and spawn more workload, more delays and more errors.  Tempers become frayed and molehills are magnified into mountains. Irritations become arguments.  And all of this makes the problem worse rather than better. Less stable. More variable. More chaotic. More dangerous. More expensive.

It is actually possible to write a simple equation that captures this complex dynamic behaviour characteristic of real systems.  And that was a very surprising finding when it was discovered in 1976 by a mathematician called Robert May.

This equation is called the logistic equation.

Here is the abstract of his seminal paper.

Nature 261, 459-467 (10 June 1976)

Simple mathematical models with very complicated dynamics

First-order difference equations arise in many contexts in the biological, economic and social sciences. Such equations, even though simple and deterministic, can exhibit a surprising array of dynamical behaviour, from stable points, to a bifurcating hierarchy of stable cycles, to apparently random fluctuations. There are consequently many fascinating problems, some concerned with delicate mathematical aspects of the fine structure of the trajectories, and some concerned with the practical implications and applications. This is an interpretive review of them.

The fact that this chaotic behaviour is completely predictable and does not need any ‘random’ element was a big surprise. Chaotic is not the same as random. The observed chaos in the urgent healthcare care system is the result of the design of the system – or more specifically the current healthcare system management policies.

This has a number of profound implications – the most important of which is this:

If the chaos we observe in our health care systems is the predictable and inevitable result of the management policies we ourselves have created and adopted – then eliminating the chaos will only require us to re-design these policies.

In fact we only need to tweak one of the ingredients of the Recipe for Chaos – such as to reduce the strength of the destabilizing feedback loop. The gain. The volume control on the variation amplifier!

This is called the MM factor – otherwise known as ‘Management Meddling‘.

We need to keep all four ingredients though – because we need our system to have both agility and stability.  It is the balance of ingredients that that is critical.

The flaw is not the Managers themselves – it is their learned behaviour – the Meddling.  This is learned so it can be unlearned. We need to keep the Managers but “tweak” their role slightly. As they unlearn their old habits they move from being ‘Policy-Enforcers and Fire-Fighters’ to becoming ‘Policy-Engineers and Chaos-Calmers’. They focus on learning to understand the root causes of variation that come from outside the circle of influence of the non-Managers.   They learn how to rationally and radically redesign system policies to achieve both agility and stability.

And doing that requires developing systemic-thinking and learning Improvement Science skills – because the causes of chaos are counter-intuitive. If it were intuitively-obvious we would have discovered the nature of chaos thousands of years ago. The fact that it was not discovered until 1976 demonstrates this fact.

It is our homo sapiens intuition that got us into this mess!  The inherent flaws of the chimp-ware between our ears.  Our current management policies are intuitively-obvious, collectively-agreed, rubber-stamped and wrong! They are part of the Recipe for Chaos.

And when we learn to re-design our system policies and upload the new system software then the chaos evaporates as if a magic wand had been waved.

And that comes as a really BIG surprise!

What also comes as a big surprise is just how small the counter-intuitive policy design tweaks often are.

Safe, smooth, efficient, effective, and productive flow is restored. Calm confidence reigns. Safety, Flow, Quality and Productivity all increase – at the same time.  The emotional storm clouds dissipate and the prosperity sun shines again.

Everyone feels better. Everyone. Patients, managers, and non-managers.

This is Win-Win-Win improvement by design. Improvement Science.

Software First

computer_power_display_glowing_150_wht_9646A healthcare system has two inter-dependent parts. Let us call them the ‘hardware’ and the ‘software’ – terms we are more familiar with when referring to computer systems.

In a computer the critical-to-success software is called the ‘operating system’ – and we know that by the brand labels such as Windows, Linux, MacOS, or Android. There are many.

It is the O/S that makes the hardware fit-for-purpose. Without the O/S the computer is just a box of hot chips. A rather expensive room heater.

All the programs and apps that we use to to deliver our particular information service require the O/S to manage the actual hardware. Without a coordinator there would be chaos.

In a healthcare system the ‘hardware’ is the buildings, the equipment, and the people.  They are all necessary – but they are not sufficient on their own.

The ‘operating system’ in a healthcare system are the management policies: the ‘instructions’ that guide the ‘hardware’ to do what is required, when it is required and sometimes how it is required.  These policies are created by managers – they are the healthcare operating system design engineers so-to-speak.

Change the O/S and you change the behaviour of the whole system – it may look exactly the same – but it will deliver a different performance. For better or for worse.


In 1953 the invention of the transistor led to the first commercially viable computers. They were faster, smaller, more reliable, cheaper to buy and cheaper to maintain than their predecessors. They were also programmable.  And with many separate customer programs demanding hardware resources – an effective and efficient operating system was needed. So the understanding of “good” O/S design developed quickly.

In the 1960’s the first integrated circuits appeared and the computer world became dominated by mainframe computers. They filled air-conditioned rooms with gleaming cabinets tended lovingly by white-coated technicians carrying clipboards. Mainframes were, and still are, very expensive to build and to run! The valuable resource that was purchased by the customers was ‘CPU time’.  So the operating systems of these machines were designed to squeeze every microsecond of value out of the expensive-to-maintain CPU: for very good commercial reasons. Delivering the “data processing jobs” right, on-time and every-time was paramount.

The design of the operating system software was critical to the performance and to the profit.  So a lot of brain power was invested in learning how to schedule jobs; how to orchestrate the parts of the hardware system so that they worked in harmony; how to manage data buffers to smooth out flow and priority variation; how to design efficient algorithms for number crunching, sorting and searching; and how to switch from one task to the next quickly and without wasting time or making errors.

Every modern digital computer has inherited this legacy of learning.

In the 1970’s the first commercial microprocessors appeared – which reduced the size and cost of computers by orders of magnitude again – and increased their speed and reliability even further. Silicon Valley blossomed and although the first micro-chips were rather feeble in comparison with their mainframe equivalents they ushered in the modern era of the desktop-sized personal computer.

In the 1980’s players such as Microsoft and Apple appeared to exploit this vast new market. The only difference was that Microsoft only offered just the operating system for the new IBM-PC hardware (called MS-DOS); while Apple created both the hardware and software as a tightly integrated system – the Apple I.

The ergonomic-seamless-design philosophy at Apple led to the Apple Mac which revolutionised personal computing. It made them usable by people who had no interest in the innards or in programming. The Apple Macs were the “designer”computers and were reassuringly more expensive. The innovations that Apple designed into the Mac are now expected in all personal computers as well as the latest generations of smartphones and tablets.

Today we carry more computing power in our top pocket than a mainframe of the 1970’s could deliver! The design of the operating system has hardly changed though.

It was the O/S  design that leveraged the maximum potential of the very expensive hardware.  And that is still the case – but we take it for completely for granted.


Exactly the same principle applies to our healthcare systems.

The only difference is that the flow is not 1’s and 0’s – it is patients and all the things needed to deliver patient care. The ‘hardware’ is the expensive part to assemble and run – and the largest cost is the people.  Healthcare is a service delivered by people to people. Highly-trained nurses, doctors and allied healthcare professionals are expensive.

So the key to healthcare system performance is high quality management policy design – the healthcare operating system (HOS).

And here we hit a snag.

Our healthcare management policies have not been designed using the same rigor as the operating systems for our computers. They have not been designed using the well-understood principles of flow physics. The various parts of our healthcare system do not work well together. The flows are fractured. The silos work independently. And the ubiquitous symptom of this dysfunction is confusion, chaos and conflict.  The managers and the doctors are at each others throats. And this is because the management policies have evolved through a largely ineffective and very inefficient strategy called “burn-and-scrape”. Firefighting.

The root cause of the poor design is that neither healthcare managers nor the healthcare workers are trained in operational policy design. Design for Safety. Design for Quality. Design for Delivery. Design for Productivity.

And we are all left with a lose-lose-lose legacy: a system that is no longer fit-for-purpose and a generation of managers and clinicians who have never learned how to design the operational and clinical policies that ensure the system actually delivers what the ‘hardware’ is capable of delivering.


For example:

Suppose we have a simple healthcare system with three stages called A, B and C.  All the patients flow through A, then to B and then to C.  Let us assume these three parts are managed separately as departments with separate budgets and that they are free to use whatever policies they choose so long as they achieve their performance targets -which are (a) to do all the work and (b) to stay in budget and (c) to deliver on time.  So far so good.

Now suppose that the work that arrives at Department B from Department  A is not all the same and different tasks require different pathways and different resources. A Radiology, Pathology or Pharmacy Department for example.

Sorting the work into separate streams and having expensive special-purpose resources sitting idle waiting for work to arrive is inefficient and expensive. It will push up the unit cost – the total cost divided by the total activity. This is called ‘carve-out’.

Switching resources from one pathway to another takes time and that change-over time implies some resources are not able to do the work for a while.  These inefficiencies will contribute to the total cost and therefore push up the “unit-cost”. The total cost for the department divided by the total activity for the department.

So Department B decides to improve its “unit cost” by deploying a policy called ‘batching’.  It starts to sort the incoming work into different types of task and when a big enough batch has accumulated it then initiates the change-over. The cost of the change-over is shared by the whole batch. The “unit cost” falls because Department B is now able to deliver the same activity with fewer resources because they spend less time doing the change-overs. That is good. Isn’t it?

But what is the impact on Departments A and C and what effect does it have on delivery times and work in progress and the cost of storing the queues?

Department A notices that it can no longer pass work to B when it wants because B will only start the work when it has a full batch of requests. The queue of waiting work sits inside Department A.  That queue takes up space and that space costs money but the queue cost is incurred by Department A – not Department B.

What Department C sees is the order of the work changed by Department B to create a bigger variation in lead times for consecutive tasks. So if the whole system is required to achieve a delivery time specification – then Department C has to expedite the longest waiters and delay the shortest waiters – and that takes work,  time, space and money. That cost is incurred by Department C not by Department B.

The unit costs for Department B go down – and those for A and C both go up. The system is less productive as a whole.  The queues and delays caused by the policy change means that work can not be completed reliably on time. The blame for the failure falls on Department C.  Conflict between the parts of the system is inevitable. Lose-Lose-Lose.

And conflict is always expensive – on all dimensions – emotional, temporal and financial.


The policy design flaw here looks like it is ‘batching’ – but that policy is just a reaction to a deeper design flaw. It is a symptom.  The deeper flaw is not even the use of ‘unit costing’. That is a useful enough tool. The deeper flaw is the incorrect assumption that by improving the unit costs of the stages independently will always get an improvement in whole system productivity.

This is incorrect. This error is the result of ‘linear thinking’.

The Laws of Flow Physics do not work like this. Real systems are non-linear.

To design the management policies for a non-linear system using linear-thinking is guaranteed to fail. Disappointment and conflict is inevitable. And that is what we have. As system designers we need to use ‘systems-thinking’.

This discovery comes as a bit of a shock to management accountants. They feel rather challenged by the assertion that some of their cherished “cost improvement policies” are actually making the system less productive. Precisely the opposite of what they are trying to achieve.

And it is the senior management that decide the system-wide financial policies so that is where the linear-thinking needs to be challenged and the ‘software patch’ applied first.

It is not a major management software re-write. Just a minor tweak is all that is required.

And the numbers speak for themselves. It is not a difficult experiment to do.


So that is where we need to start.

We need to learn Healthcare Operating System design and we need to learn it at all levels in healthcare organisations.

And that system-thinking skill has another name – it is called Improvement Science.

The good news is that it is a lot easier to learn than most people believe.

And that is a big shock too – because how to do this has been known for 50 years.

So if you would like to see a real and current example of how poor policy design leads to falling productivity and then how to re-design the policies to reverse this effect have a look at Journal Of Improvement Science 2013:8;1-20.

And if you would like to learn how to design healthcare operating policies that deliver higher productivity with the same resources then the first step is FISH.

Improvement-by-Twitter

Sat 5th October

It started with a tweet.

08:17 [JG] The NHS is its people. If you lose them, you lose the NHS.

09:15 [DO] We are in a PEOPLE business – educating people and creating value.

Sun 6th October

08:32 [SD] Who isn’t in people business? It is only people who buy stuff. Plants, animals, rocks and machines don’t.

09:42 [DO] Very true – it is people who use a service and people who deliver a service and we ALL know what good service is.

09:47 [SD] So onus is on us to walk our own talk. If we don’t all improve our small bits of the NHS then who can do it for us?

Then we were off … the debate was on …

10:04 [DO] True – I can prove I am saving over £160 000.00 a year – roll on PBR !?

10:15 [SD] Bravo David. I recently changed my surgery process: productivity up by 35%. Cost? Zero. How? Process design methods.

11:54 [DO] Exactly – cost neutral because we were thinking differently – so how to persuade the rest?

12:10 [SD] First demonstrate it is possible then show those who want to learn how to do it themselves. http://www.saasoft.com/fish/course

We had hard evidence it was possible … and now MC joined the debate …

12:48 [MC] Simon why are there different FISH courses for safety, quality and efficiency? Shouldn’t good design do all of that?

12:52 [SD] Yes – goal of good design is all three. It just depends where you are starting from: Governance, Operations or Finance.

A number of parallel threads then took off and we all had lots of fun exploring  each others knowledge and understanding.

17:28 MC registers on the FISH course.

And that gave me an idea. I emailed an offer – that he could have a complimentary pass for the whole FISH course in return for sharing what he learns as he learns it.  He thought it over for a couple of days then said “OK”.

Weds 9th October

06:38 [MC] Over the last 4 years of so, I’ve been involved in incrementally improving systems in hospitals. Today I’m going to start an experiment.

06:40 [MC] I’m going to see if we can do less of the incremental change and more system redesign. To do this I’ve enrolled in FISH

Fri 11th October

06:47 [MC] So as part of my exploration into system design, I’ve done some studies in my clinic this week. Will share data shortly.

21:21 [MC] Here’s a chart showing cycle time of patients in my clinic. Median cycle time 14 mins, but much longer in 2 pic.twitter.com/wu5MsAKk80

20131019_TTchart

21:22 [MC] Here’s the same clinic from patients’ point if view, wait time. Much longer than I thought or would like

20131019_WTchart

21:24 [MC] Two patients needed to discuss surgery or significant news, that takes time and can’t be rushed.

21:25 [MC] So, although I started on time, worked hard and finished on time. People were waited ages to see me. Template is wrong!

21:27 [MC] By the time I had seen the the 3rd patient, people were waiting 45 mins to see me. That’s poor.

21:28 [MC] The wait got progressively worse until the end of the clinic.

Sunday 13th October

16:02 [MC] As part of my homework on systems, I’ve put my clinic study data into a Gantt chart. Red = waiting, green = seeing me pic.twitter.com/iep2PDoruN

20131019_Ganttchart

16:34 [SD] Hurrah! The visual power of the Gantt Chart. Worth adding the booked time too – there are Seven Sins of Scheduling to find.

16:36 [SD] Excellent – good idea to sort into booked time order – it makes the planned rate of demand easier to see.

16:42 [SD] Best chart is Work In Progress – count the number of patients at each time step and plot as a run chart.

17:23 [SD] Yes – just count how many lines you cross vertically at each time interval. It can be automated in Excel

17:38 [MC] Like this? pic.twitter.com/fTnTK7MdOp


20131019_WIPchart

This is the work-in-progress chart. The most useful process monitoring chart of all. It shows the changing size of the queue over time.  Good flow design is associated with small, steady queues.

18:22 [SD] Perfect! You’re right not to plot as XmR – this is a cusum metric. Not a healthy WIP chart this!

There was more to follow but the “ah ha” moment had been seen and shared.

Weds 16th October

MC completes the Online FISH course and receives his well-earned Certificate of Achievement.

This was his with-the-benefit-of-hindsight conclusion:

I wish I had known some of this before. I will have totally different approach to improvement projects now. Key is to measure and model well before doing anything radical.

Improvement Science works.
Improvement-by-Design is a skill that can be learned quickly.
FISH is just a first step.

Making it a habit – Steve Peak

It’s another sunny day and the laptop continues to perform well in the garden!

Yippee! I have completed my Foundations in Improvement Science for Healthcare (FISH©) course. The final stages of the course have taken me through visual presentation of system data, some worked examples (very useful) and of course the final assessment.  The key elements of the course came back to me easily for the assessment test which I always think is an indication of both enjoyment and how well the material has been presented.

My mentor says I have done more than enough to progress to the next stage of my improvement science journey.  Practitioner level now awaits. It is when it really gets serious and you take the learning so far and start applying it in very practical ways.  My goal is to become ‘safe’ in the use of the tools and techniques, which will give me the confidence to help others learn these fantastic skills.  All very satisfying indeed.

The other day I was at Keele University doing a session on change management to a group of specialist registrars.  We were exploring the key steps to follow if you are going to improve your approach to change management.  It struck me at the time that we need to make our approaches to potentially complex scenarios habit forming.  In other words lots and lots of research on change management has been conducted, so lets use it rather than stumbling through.  Similarly improvement science gives you a set of disciplines and tools to support and deliver changes in the design of our healthcare systems.  What we have to do is get to the point where it is a widespread habit to approach our healthcare systems and processes using this knowledge.  I am absolutely convinced patients will feel the difference and the ‘ground hog day’ operational struggles can be approached with renewed vigour and produce differing outcomes. i.e. improved quality, motivation and productivity.

So bring on the next stage of my journey as a mentor to other FISH participants, learning to be a practitioner and being able to apply this knowledge habitually.

The sun is still out!

The Chimp in me – Steve Peak

It’s a sunny day and I realize that my laptop screen is viewable whilst sitting in the garden!

I am now three quarters the way through my Foundations in Improvement Science for Healthcare (FISH©) course.  It has been a revelation to say the least.  The last time I blogged on my progress I remarked that memories of operational struggles whilst working within my various senior leadership roles have become clearer as to why we had some success and plenty of failure in terms of sustainable difference around the three key wins.  These are improved quality, productivity and motivation.  This feeling has most definitely continued!

The course so far has taken me through the general concepts using the Three Wins Design®, plenty of the people stuff that is fundamental to success and on the last few ‘study’ occasions the more technical stuff of what it takes to understand how a system is functioning. In other words how to build up a picture of the root causes for the outcomes from the system, how to analyse the data and present the data so that it is information and finally how potential design changes can be tested to reveal how the root causes can be reduced to achieve a balancing act around the three wins.  So I am becoming more confident in the use of value stream maps that set out how work is done and how resources are used and presentation on a process template.  What this does is to remove rhetoric; intuition and frankly some guess work that is all too common when tackling operational challenges.  The notion of cycle times that can help to explain why outpatient clinics, day case units etc can be a less than positive experience for patients by simply setting out the process on a Gantt chart is wonderful to see as it changes perceived complexity into a simple picture.

I am feeling more motivated than ever to complete the course as the power to resolve challenges becomes more and more obvious.  This is despite the fact I am being tested to grasp the concepts of schedules, standard work, hand offs, Pareto analysis, the 80:20 heuristic and how to present demand, workloads and resources in a consistent manner.  This is not easy for somebody who does not naturally occupy this type of space!

So why the Chimp in me?  Whilst completing the course I am reading an interesting book called the Chimp Paradox by Dr Steve Peters.  He sets out his thoughts on how the brain functions and how to manage your chimp.  Your chimp is the emotional part of the brain that will tell your human or logical part you can’t do something or ask why would you want to learn something new that could make you look daft.   Well my chimp is feeling settled and untroubled at the moment because of the combination of the achievement and the huge potential I see in using improvement science.  All this adds up to, I want to learn some more of this stuff.  Oh and the sun is still shining!

Steve Peak