Business as Usual

At last the light appears to be visible at the end of the tunnel for Covid-19 in the UK. And we have our fingers-crossed that we can contemplate getting back to business as usual. What ever that is.

For the NHS, attention will no doubt return to patient access targets. The data has continued to be collected, processed and published for the last 16 months, so we are able to see the impact that the Covid-19 epidemic has had on the behaviour of the hospital-based emergency system. The Emergency Departments.

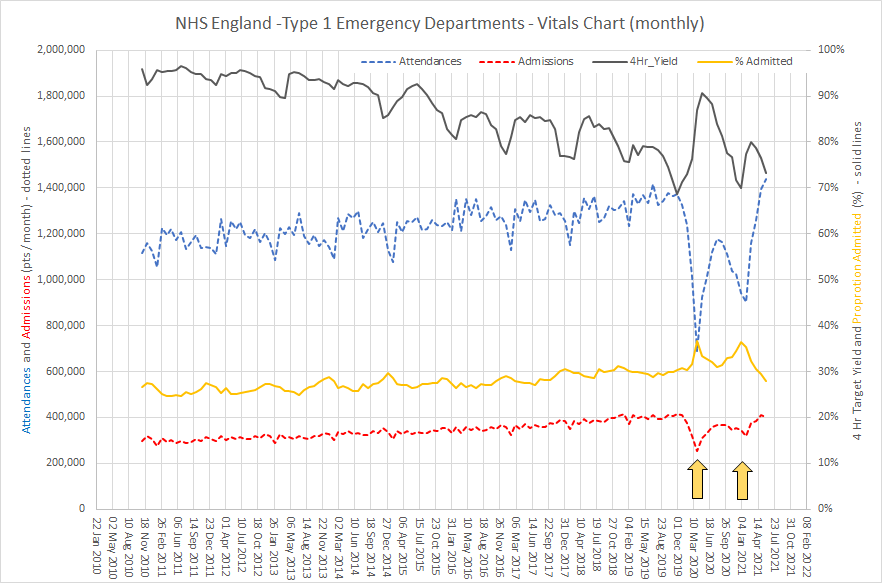
The run chart below shows the monthly reported ED metrics for England from Nov 2010.

The solid grey line is the infamous 4 Hr target – the proportion of ED attendances that are seen and admitted or discharged within 4 hours. It reveals that the progressive decline over the last decade improved during the first and second waves. And if we look for plausible causes we can see that the ED attendances dropped precipitously (blue dotted line) in both the first and second waves. We dutifully “Stayed at Home to Protect the NHS and Save Lives”.

The drop in ED attendances was accompanied by a drop in ED admissions (dotted red line) but a higher proportion of those who did attend were admitted (solid orange line) – which suggests they were sicker patients. So, all that makes sense.

And as restrictions are relaxed we can see that attendances, admissions, 4 Hr yield and proportion admitted are returning to the projected levels. Business as Usual.


Up to March 2021 the chart says that 70-75% of patients who attend ED did not need to be admitted to hospital. So this begs a raft of questions

Q1: What is that makes nearly 35,000 people per day to go to ED and then home?

Q2. How can the ED footfall drop by 50% almost overnight?

Q3. Where did those patients go for the services they were previously seeking in ED?

Q4. What were their outcomes?

Q5. What are the reasons they were choosing to go to ED rather than their GP before March 2020?

Q6. How much of the ED demand is spillover from Primary Care?

Q7: How much of the ED workload is diagnostic testing to exclude serious illness?

Q8: What lessons can be learned to mitigate the growing pressure on EDs?

Q9: Can urgent care services for this 70% be provided in a more distributed way?


And if we can do drive-thru urgent testing during Covid-19 and we can do and drive-thru urgent treatment during Covid-19 then perhaps we can do more drive-thru urgent care after Covid-19?

Sting in the Tail

Monday 19th July 2021 was the official end of COVID-19 restrictions in England – yet the number of positive tests, hospital admissions and deaths is rising. “How can that make any sense!” wail the doom mongers. Is it irresponsible? Are we destined for a deadly third wave? Is a nasty sting in the tail on the way?

To address these questions we need to step back and look at the bigger picture.

As we have seen, the evolution of the COVID-19 pandemic has been tricky to predict because the virus and the host have been co-evolving. The host has implemented social distancing and developed vaccines to attenuate the viral spread and illness severity. The virus has mutated and more contagious variants have emerged as the dominant players.

And trying to work out how all these factors combine together is beyond the computational ability of the 1.4 kg of chimpware between our ears. Our intuition is confounded by the counter-intuitive complexity. We need help.

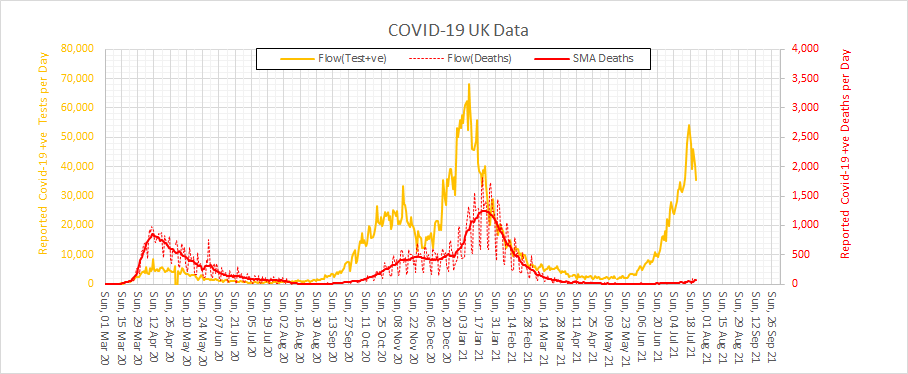
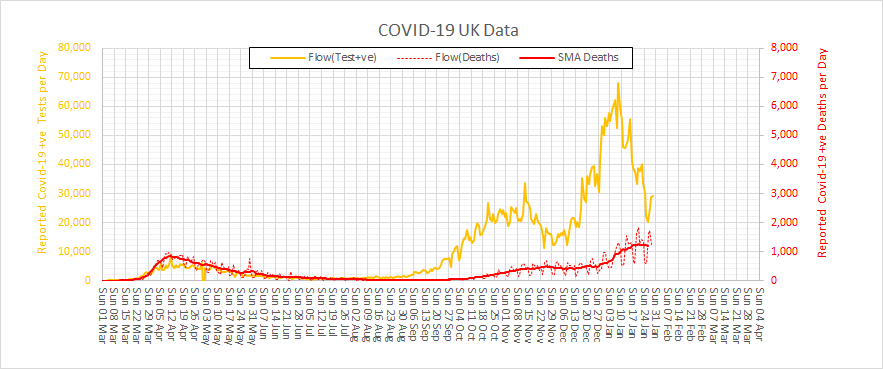
Here is the published data … the orange line is the daily reported positive COVID tests and the red dotted line is the daily reported COVID deaths. There is a clear temporal association but the size of the peaks don’t seem to make sense – even when we note that the test and death lines are plotted on very different scales.

One problem here is that the number of positive tests reported is very dependent on the testing process. In the first wave only hospital admissions were tested; in the second wave there was much more community-based testing of symptomatic people; and now many people are self-testing regularly to provide evidence of wellness.

The only way to unravel this Gordian Knot of interacting influences is to use the data to build and calibrate a causal structure model (CSM). Conventional statistical analysis is not up to the job because it conflates association and causation. We need something which is able to provide a diagnosis and a prognosis. Something that can use the past to help predict the future.

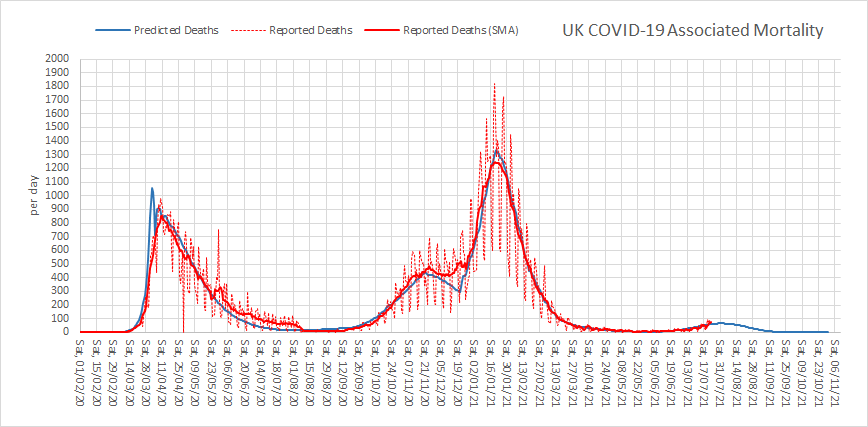
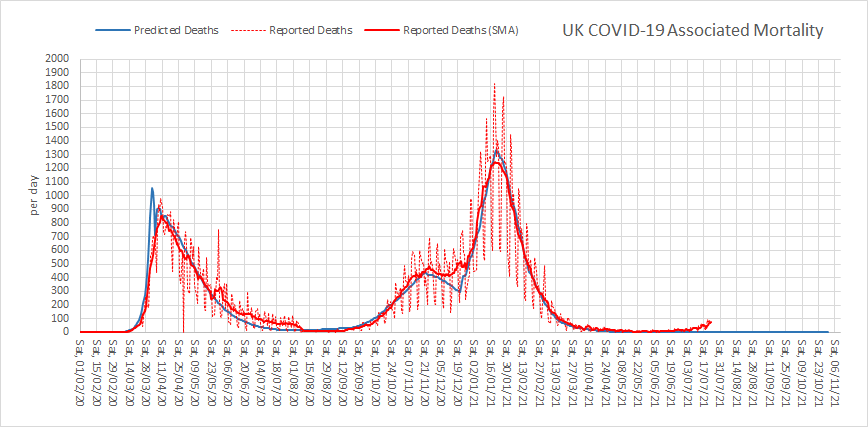
The blue line in the chart below is the output of a CSM that has been designed using proven principles of epidemic dynamics, and calibrated using historical data. And it predicts that there is indeed a third wave underway and that it is minor in comparison with the first two in terms of the predicted mortality.

The emergence of a third wave is the combined effect of three things:
a) The relaxing of social distancing rules.
b) The emergence and spread of more contagious variants of the virus.
c) The known fact that the vaccine is not 100% effective.
d) The known fact that immunity after illness or vaccination will wane with time.

One use of a CSM is to conduct counterfactual analysis which helps us to deepen our understanding of how complex systems behave. These are called “What would have happened if?” experiments.

One such experiment is “What would have happened if the vaccine was completely effective?

Here is the CSM prediction for a 100% effective vaccine: The first and second waves were the same because the vaccination programme did not start until the peak of the second wave – and there is no third wave even with complete relaxation of social distancing.

But the actual data disproves this causal hypothesis because there is a third wave developing.


So, here is the CSM prediction for a 0% effective vaccine: The first and second waves are largely unchanged and now we have a third wave as bad as the second. A nasty sting in the tail.

But then the epidemic fizzles out because all the host “fuel” of susceptible people has been used up.


Setting the aggregate effectiveness of the vaccine to 75% gives us the best fit to the historical data; and that value is consistent with the pilot studies of vaccine effectiveness.

And what is the most useful evidence that suggests this latest prediction is reliable? It is that the infection rate is predicted to be falling already, despite distancing rules being relaxed, and that is what the data is showing.

And with this re-calibrated CSM we can estimate the impact of the vaccination programme in terms of lives saved … at it comes out at about 40,000 people! That is a lot.

So what next?

Well, we know that immunity will wane with time, and we know that new viral variants will emerge, and we know that coronavirus will be with us for the foreseeable future at a background level.

And we have seen how this pandemic has exposed the vulnerabilities of our current socioeconomic systems – health and social care, education, transport, communication, commerce and so on. Every part of the system has been affected because everything is interconnected.

We cannot just go back to business as usual. The world has been changed. And our immediate challenge is to redesign and rebuild a health care system that is safer, more efficient and more agile and that will serve us better in the future.

Another lesson learned is just how useful systems engineering theory, tools and techniques has been – the CSM demonstrated above is a standard systems engineering technique.

So, we will need some more health care systems engineers. A lot more. And they will need to be embedded at all levels in the NHS as an integral part of the system.

A self-healing health care system.

Emergence

The last year has been dominated by one theme – the SARS-2-CoV global pandemic. It has been a roller coaster ride of ups and downs and twists and turns, often in darkness and accompanied by the baleful drone of doom-mongers and naysayers. But there have also been bright flashes of insight that have illuminated the way and surges of innovation that have carved new designs out of old paradigms.

What we are experiencing is the evolution of a complex adaptive system and what we are seeing is the emergence of a new normal.

Almost nothing will be the same again.

The diagram above tells many inter-weaved story threads that cannot be untangled. Two Chapters are complete – CRC and UTC. We are just starting Chapter 3.

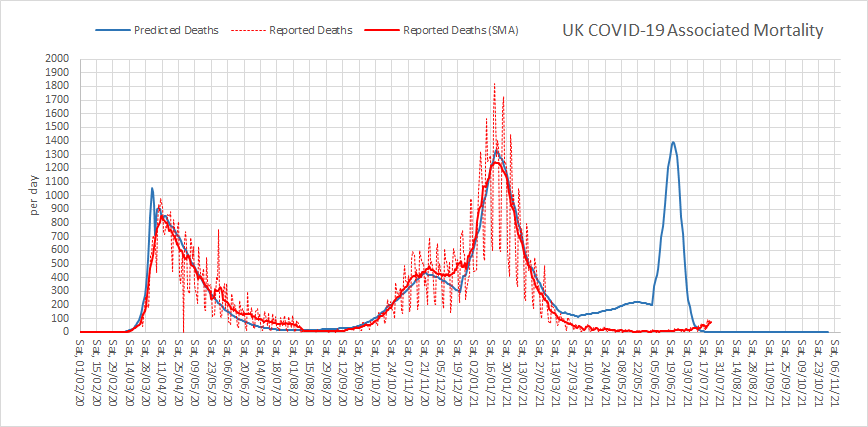
The first Thread of Tragedy is shown by the red dotted line. It is the number of daily COVID-19 associated deaths reported in the UK. The total stands at just over 127,000 which is a more than enough to fill the whole of Wembley Stadium. And a lot more.

The solid red line on the diagram is the result of removing the 7-day oscillation caused the the reporting process which opts to take weekends off.

COVID-19 is busy 24 x 7.

The first reported COVID-19 death in the UK was in the first week of March 2020. The WHO declared a global pandemic the following week, and the UK implemented the first part of a national lock down the week after. It closed some pubs in London. The need for speed was because hospital admissions and deaths were growing exponentially. As the chart shows – deaths were doubling every few days.

The Chancellor’s Magic Blank Chequebook appeared and several Nightingales were rapidly assembled to absorb the predicted storm surge. However, critically ill patients require specialised equipment and highly trained staff – and those necessities were already in short supply. As was the personal protective equipment (PPE) the front-line staff needed to keep them safe.

The Nightingales were never going to be able to sing. It was a doomed design from Day #1.

The bigger problem was the millions of potentially infectious people who would get poorly but not unwell enough to go to hospital. What was the national plan for them? It seemed that there wasn’t one. So, we created our own. The COVID Referral Centre. CRC.

This was Chapter One and the story of that has already been shared here.

The CRC was an innovative drive-thru design and a temporary solution that was conceived, commissioned, constructed and opened in 3 weeks (the red box at the top of the first diagram). It worked as designed and it was disassembled, as planned, at the predicted end of the First Wave (the orange box at the top of the first diagram).

What happened next is even more interesting. We had demonstrated, by doing it, that a drive-thru design was feasible and now we had a new challenge. Most of the elective and urgent services had been mothballed to free up space and staff to fight the First Wave. And we had no clear picture what would happen if lock down restrictions were released. The Nightingales were held in readiness. An expensive and ineffective insurance policy.

Could the drive-thru design be used for a handful of small, temporary urgent treatment centres (UTCs)?

A key lesson from the CRC was the critical importance of managing the inflow to avoid a traffic jam of anxious and potentially very poorly people. We solved this using an electronic triage and referral app that was rapidly designed, developed and delivered for the opening of the CRC. Doing that took a whole week using the JEDI method (Just ‘Effing Do It) also known as Agile.

By August 2020 things were getting back to sort-of-normal. People were having summer holidays. Schools and universities were concocting elaborate plans to re-open in the autumn. And we were thinking ahead to Winter 2020 and the prospect of seasonal flu on top of a possible resurgence of COVID. The much-feared Second Wave.

So, just before the CRC was decommissioned we took the opportunity to measure how many people could be vaccinated in an innovative drive-thru compared with a conventional walk-in. An important constraint was we did not want queues of vulnerable elderly people inside or outside. This time we had the luxury of being able to map and measure the process properly and it revealed that the drive-thru option was feasible.

We now had the information we needed to design a high efficiency flow scheduler which would set the rate at which patients could arrive without causing queues and chaos, and at the same time make good use of the available and valuable resources.

The next design question we had to answer was “How will the booking be done?” and the immediate answers offered were “on-line” and “by the patient”.

But, this was not how the CRC worked. In that service the patient had to speak to a GP who assessed their symptoms and, if deemed necessary, referred them electronically to the CRC for a face-2-face assessment. The e-referral app was designed to limit the number of referrals to prevent a traffic jam and it also automatically assigned the next available free slot to make best use of the resources. There was no patient choice.

The other question that spun out of this exercise was “If patients could book their own appointments for a routine flu jab then could they refer themselves to a drive-thru urgent treatment centre?”

Now we were shaking the trees a bit too hard. The general consensus was “No“. But why not? Surely the patient is best placed to decide how urgent they feel their problem is? And anyway, an online self-referral can be quickly screened and any inappropriate ones addressed proactively. It is probably a better design than a walk-in service.

So, we decided to design a prototype online self-referral system and we looked on the Web for ideas that solved a similar “niggle” of being able provide convenient 24 x 7 online access to a traditional face-to-face 9-5 Mon-Fri service. Rather like the niggle of trying to get an urgent appointment at your GP practice. Or the niggle of finding an increasingly rare Post Office to go to and to get the right postage stamps for an urgent big letter / small parcel.

We discovered that the postage stamp niggle had been solved with an online app for a pay-and-print-postage-label. So, that gave us a validated design to start from.

All this digital innovation was going on during the Blue Period on the first diagram, along with the planning of a cluster of small, temporary, drive-thru UTCs placed in more convenient locations for patients. And by the time the whole caboodle was ready-to-roll it was apparent that the feared Second Wave was building momentum.

The drive-thru UTC service opened its gates in early October 2020 and only four weeks later the nation was commanded to lock down for a second time. The return of pupils to schools and students to university had created the perfect COVID incubator and the emergence of a hyper-contagious Mutant. The first diagram shows when the ‘fire-break’ lock down was eased, and when the Mutant exploded out of its cage, wiped out Christmas and doubled the UK death toll.

But, the drive-thru UTCs weathered the winter storms – figuratively and literally. They valiantly delivered a much needed service while the hospitals were swamped with a third tsunami of critically ill. The NHS was better prepared this time, which is just as well because the Third Wave was much bigger than the First.

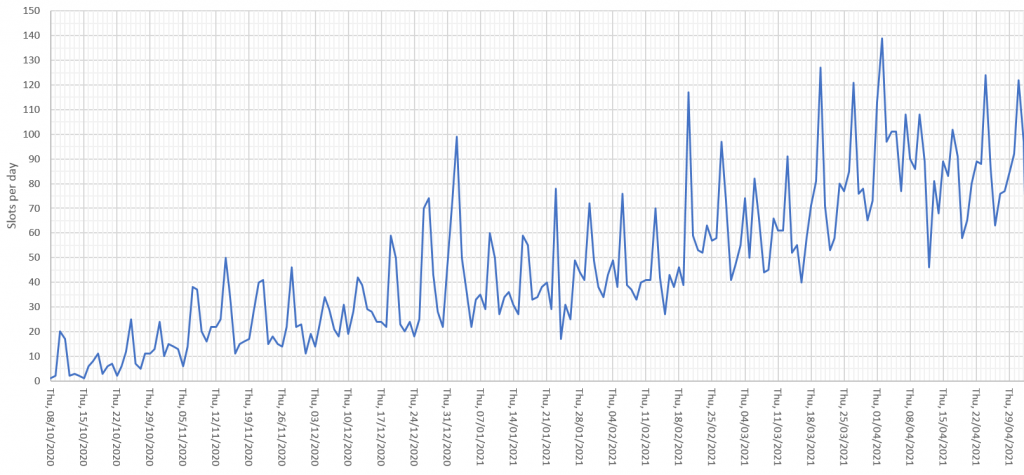
And the data the UTCs collected themselves showed that the prototype self-referral app worked as designed. We have seen gradual adoption over the seven months since it was first piloted (see below). The day-to-day variation is not random. The weekly spikes on the chart coincide with weekends when GP practices are shut and A&Es are busy dealing with accidents and emergencies (not anyone and everything).

So what does the future hold?

When COVID is just a bad/sad memory and the NHS is grappling with the elephantine challenge of post-COVID recovery amidst yet another re-disorganisation, would a more permanent drive-thru urgent care service be a viable service delivery option?

Based on the hard evidence shown I would say “Yes“.

Necessity is the Mother of Invention.

Engineers Design Things to be Fit-for-Purpose.

One Year On

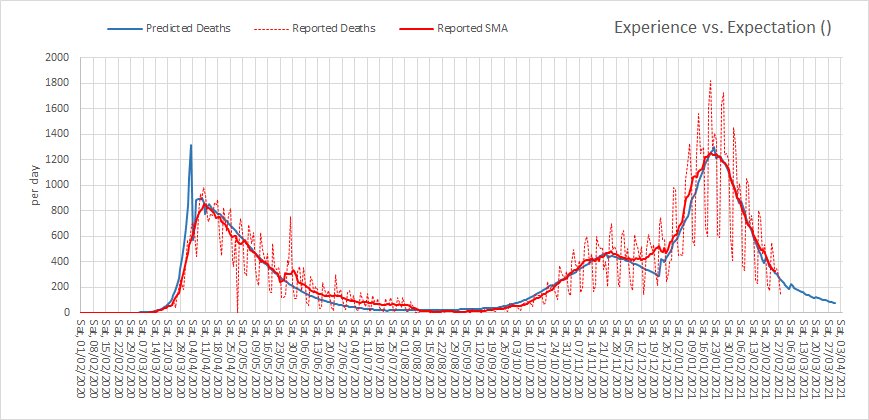
This is a picture that tells a story. In fact, it is a picture of millions of stories. Some tragic. Some heroic. Most neither. This is a story of a system adapting to an unexpected and deadly challenge. Over 125,000 souls have been lost. Much has been learned. We cannot return to what was before. The world has changed.

There are three lines on this chart.

The dotted red line is the daily reported deaths, and the obvious pattern is the weekly oscillation. This is caused by the fact that for two days of the week many people do not sit at their computers processing data. These are called weekends. So, they have to catch up with the data backlog when they return to work on Monday.

The solid red line illustrates what actually happened … the actual number of souls lost per day … peaking at over 1000 in January 2021. The ups and downs show the effect of three drastic interventions to limit the spread of a merciless virus that was mutating, evolving and competing with itself to spread faster.

This is a picture of a system learning how the Universe works – the hard, painful way.

The blue line is a prediction of how many souls would be lost, and it is surprisingly accurate. The blue line was generated by a computer. Not a multi-million pound supercomputer like the ones used to predict the weather – but a laptop like those millions of people use every day. And the reason the prediction is so accurate is because epidemics follow simple mathematical rules – and these rules were worked out about 100 years ago.

The tricky bit is turning these simple mathematical formulae into an accurate prediction … in our heads … intuitively. And the reason it is so tricky is because our brains have not evolved to do that. It is not a matter of lack of intelligence … it is just that a human brain is the wrong tool for that job.

But, what our brains are superbly evolved to do is conceptualise, innovate and collaborate to create tools like computers and Excel spreadsheets.

And many have said that in one year we have achieved ten years worth of innovation. We had to. Our lives depended on it.

So, now we have seen what is possible with a burning platform pushing us. How about we keep going with burning ambition pulling us to innovate and improve further?

Our lives and livelihoods will depend on it.

The Crystal Ball

A crystal ball or orbuculum is a crystal or glass ball and is associated with the performance of clairvoyance and the ability to predict future events.

Before the modern era, those who claimed to be able to see the future were treated with suspicion and branded as alchemists, magicians and heretics.

Nowadays we take it for granted that the weather can be predicted with surprising accuracy for a few days at least – certainly long enough to influence our decisions.

And weather forecasting is a notoriously tricky challenge because small causes can have big effects – and big causes can have no effects.  The reason for this is that weather forecasting is called a nonlinear problem and to solve it we have had to resort to using sophisticated computer simulations run on powerful computers.

In contrast, predicting the course of the COVID-19 epidemic is a walk in the park.   It too is a nonlinear problem but much a less complicated one that can be solved using a simple computer simulation on a basic laptop.

The way it is done is to use the equations that describe how epidemics work (which have been known for nearly 100 years) and then use the emerging data to calibrate the model, so over time it gets more accurate.

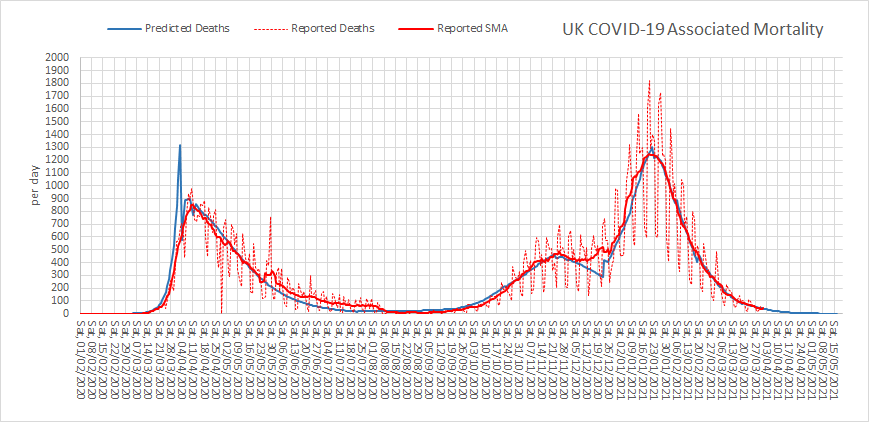
Here’s what it looks like for COVID-19 associated mortality in the UK.  The red dotted line is the reported data and the oscillation is caused by the reporting process with weekend delays.  The solid red line is the same data with the 7-day oscillation filtered out to reveal the true pattern.  The blue line is the prediction made my the model.

And we can see how accurate the prediction is, especially since the peak of the third wave.

What this chart does not show is the restrictions being gradually lifted and completely removed by April 2020.

The COVID Crystal Ball says it will be OK so long as nothing unexpected happens – like a new variation that evades our immune systems, or even a new bug completely.

It has been a tough year.  We have learned a lot through hardship and heroism and that a random act of nature can swat us like an annoying fly.

So, perhaps our sense of hope should be tempered with some humility because the chart above did not need to look like that.  We have the knowledge, tools and skills to to better.  We have lots of Crystal Balls.

End In Sight

We are a month into Lock-down III.

Is there any light at the end of the tunnel?

Here is the reported UK data.  As feared the Third Wave was worse than the First and the Second, and the cumulative mortality has exceeded 100,000 souls.  But the precipitous fall in reported positive tests is encouraging and it looks like the mortality curve is also turning the corner.

The worst is over.

So, was this turnaround caused by Lock-down III?

It is not possible to say for sure from this data.  We would need a No Lock-down randomised control group to keep the statistical purists happy and we could not do that.

Is there another way?

Yes, there is.  It is called a digital twin.  The basic idea is we design, build, verify and calibrate a digital simulation model of the system that we are interested and use that to explore cause-and-effect hypotheses.  Here is an example: The solid orange line in the chart above (daily reported positive tests) is closely related to the dotted grey line in the chart below (predicted daily prevalence of infectious people).   Note the almost identical temporal pattern and be aware that in the first wave we only reported positive tests of patients admitted to hospital.

What does our digital twin say was the cause?

It says that the primary cause of the fall in daily prevalence of infectious people is because the number of susceptible people (the solid blue line) has fallen to a low enough level for the epidemic to fizzle out on its own.  Without any more help from us.

And it says that Lock-down III has contributed a bit by flattening and lowering the peak of infections, admissions and deaths.

And it says that the vaccination programme has not contributed to the measured fall in prevalence.

What are the implications if our digital twin is speaking the truth?

Firstly, that the epidemic is already self-terminating.
Secondly, that the restrictions will not be needed after the end of February.
Thirdly, that a mass vaccination programme is a belt-and-braces insurance policy.

I would say that is all good news.  The light the end would appear to be in sight.

No Queue Vaccination

Vaccinating millions of vulnerable people in the middle of winter requires a safe, efficient and effective process.

It is not safe to have queues of people waiting outside in the freezing cold.  It is not safe to have queues of people packed into an indoor waiting area.

It is not safe to have queues full stop.

And let us face it, the NHS is not brilliant at avoiding queues.

My experience is that the commonest cause of queues in health care processes something called the Flaw of Averages.

This is where patients are booked to arrive at an interval equal to the average rate they can be done.

For example, suppose I can complete 15 vaccinations in an hour … that is one every 4 minutes on average … so common sense tells me it that the optimum way to book patients for their jab is one every four minutes.  Yes?

Actually, No.  That is the perfect design for generating a queue – and the reason is because, in reality, patients don’t arrive exactly on time, and they don’t arrive at exactly one every three minutes, and  there will be variation in exactly how long it takes me to do each jab, and unexpected things will happen.  In short, there are lots of sources of variation.  Some random and some not.  And just that variation is enough to generate a predictably unpredictable queue.  A chaotic queue.

The Laws of Physics decree it.


So, to illustrate the principles of creating a No Queue design here are some videos of a simulated mass vaccination process.

The process is quite simple – there are three steps that every patient must complete in sequence:

1) Pre-Jab Safety Check – Covid Symptoms + Identity + Clinical Check.
2) The Jab.
3) Post-Jab Safety Check (15 minutes of observation … just-in-case).

And the simplest layout of a sequential process is a linear one with the three steps in sequence.

So, let’s see what happens.

Notice where the queue develops … this tells us that we have a flow design problem.  A queue is signpost that points to the cause.

The first step is to create a “balanced load, resilient flow” design.

Hurrah! The upstream queue has disappeared and we finish earlier.  The time from starting to finishing is called the makespan and the shorter this is, the more efficient the design.

OK. Let’s scale up and have multiple, parallel, balanced-load lanes running with an upstream FIFO (first-in-first-out) buffer and a round-robin stream allocation policy (the sorting hat in the video).  Oh, and can we see some process performance metrics too please.

Good, still no queues.  We are making progress.  Only problem is our average utilisation is less than 90% and The Accountants won’t be happy with that.  Also, the Staff are grumbling that they don’t get rest breaks.

Right, let’s add a Flow Coordinator to help move things along quicker and hit that optimum 100% utilisation target that The Accountants desire.

Oh dear!  Adding a Flow Coordinator seems to made queues worse rather than better; and we’ve increased costs so The Accountants will be even less happy.  And the Staff are still grumbling because they still don’t get any regular rest breaks.  The Flow Coordinator is also grumbling because they are running around like a blue a***d fly.  Everyone is complaining now.  That was not the intended effect.  I wonder what went wrong?

But, to restore peace let’s take out the Flow Coordinator and give the Staff regular rest breaks.

H’mm.  We still seem to have queues.  Maybe we just have to live with the fact that patients have to queue.  So long as The Accountants are happy and the Staff  get their breaks then that’s as good as we can expect. Yes?

But … what if … we flex the Flow Coordinator to fill staggered Staff rest breaks and keep the flow moving calmly and smoothly all day without queues?

At last! Everyone is happy. Patients don’t wait. Staff are comfortably busy and also get regular rest breaks. And we actually have the most productive (value for money) design.

This is health care systems engineering (HCSE) in action.

PS. The Flaw of Averages error is a consequence of two widely held and invalid assumptions:

  1. That time is money. It isn’t. Time costs money but they are not interchangeable.
  2. That utilisation and efficiency are interchangeable.  They aren’t.  It is actually often possible to increase efficiency and reduce utilisation at the same time!

The Final Push

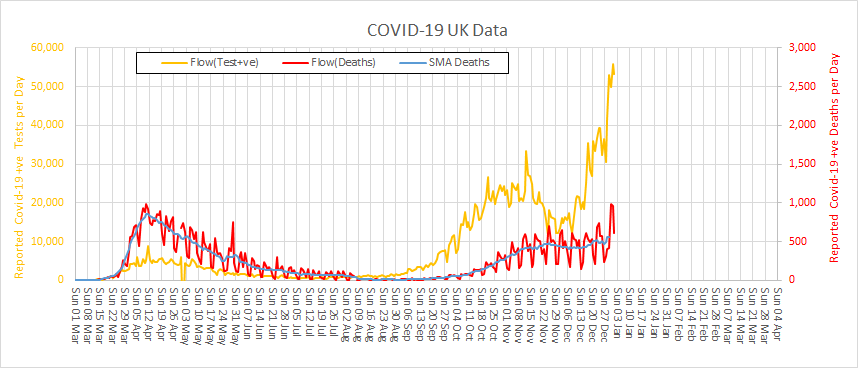
It is New Year 2021 and the spectre of COVID-4-Christmas came true.  We are now in the depths of winter and in the jaws of the Third Wave.  What happened?  Let us look back at the UK data for positive tests and deaths to see how this tragic story unfolded.

There was a Second Wave that started to build when Lock-down I was relaxed in July 2020.  And it looks like Lock-down II in November 2020 did indeed have a beneficial effect – but not as much as was needed.  So, when it too was relaxed at the start of December 2020 then … infections took off again … even faster than before!

That is the nature of epidemics and of exponential growth.  It seems we have not learned those painful lessons well enough.

And we all so desperately wanted a more normal Xmas that we conspired to let the COVID cat out of the bag again.  The steep rise in positive tests is real and we know that because a rise in deaths is following about three weeks behind.  And that means hospitals have filled up again.

Are we back to square one?

The emerging news of an even more contagious variant has only compounded our misery, but it is hard to separate the effect of that from all the other factors that are fuelling the Third Wave.

Is there no end to this recurring nightmare?

The short answer is – “It will end“.  It cannot continue forever.  All epidemics eventually burn themselves out when there are too few susceptible people left to infect and we enter the “endemic” phase.  When that happens the R number will gravitate to 1.0 again which some might find confusing.  The confusion is caused by mixing up Ro and Rt.

How close are we to that end game?

Well, we are certainly a lot closer than we were in July 2020 because millions more people have been exposed, infected and recovered and many of those were completely asymptomatic.  It is estimated that about a third of those who catch it do not have any symptoms – so they will not step forward to be tested and will not appear in the statistics.  But they can unwittingly and silently spread the virus while they are infectious.  And many who are symptomatic do not come get tested so they won’t appear in the statistics either.

And there are now two new players in the COVID-19 Game … the Pfizer vaccine and the Oxford vaccine.  They are the White Knights and they are on our side.

Hurrah!

Now we must manufacture, distribute and administer these sickness-and-death-preventing vaccines to 65 million people as soon as possible.  That alone is a massive logistical challenge when we are already fighting battles on many fronts.  It seems impossible.

Or do we?

It feels obvious but is it the most effective strategy?  Should we divert our limited, hard-pressed, exhausted health care staff to jabbing the worried-well?  Should we eke out our limited supplies of precious vaccine to give more people a first dose by delaying the second dose for others?

Will the White Knights save us?

The short answer is – “Not on their own“.

The maths is simple enough.

Over the last three weeks we have, through Herculean effort, managed to administer 1 million first doses of the Pfizer vaccine.  That sounds like a big number but when put into the context of a UK population of 65 million it represents less than 2% and offers only delayed and partial protection.  The trial evidence confirmed that two doses of the Pfizer vaccine given at a three week interval would confer about 90% protection.  That is the basis of the licence and the patient consent.

So, even if we delay second doses and double the rate of first dose delivery we can only hope to partially protect about 2-3% of the population by the end of January 2021.  That is orders of magnitude too slow.

And the vaccines are not a treatment.  The vaccine cannot mitigate the fact that a large number of people are already infected and will have to run the course of their illness.  Most will recover, but many will not.

So, how do we get our heads around all these interacting influences?  How do we predict how the Coronavirus Game is likely to play out over the next few weeks? How do we decide what to do for the best?

I believe it is already clear that trying to answer these questions using the 1.3 kg of wetware between our ears is fraught with problems.

We need to seek the assistance of some hardware, software and some knowledge of how to configure them to illuminate the terrain ahead.


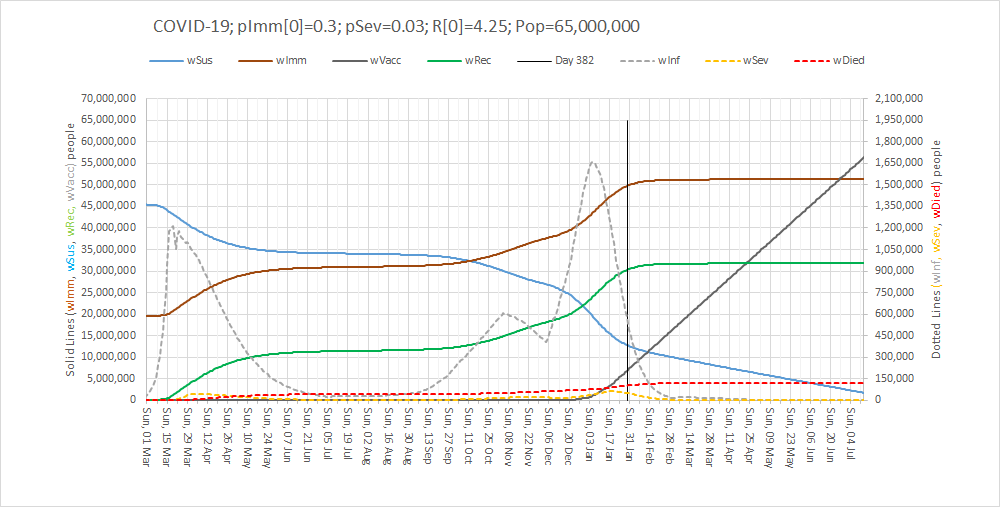
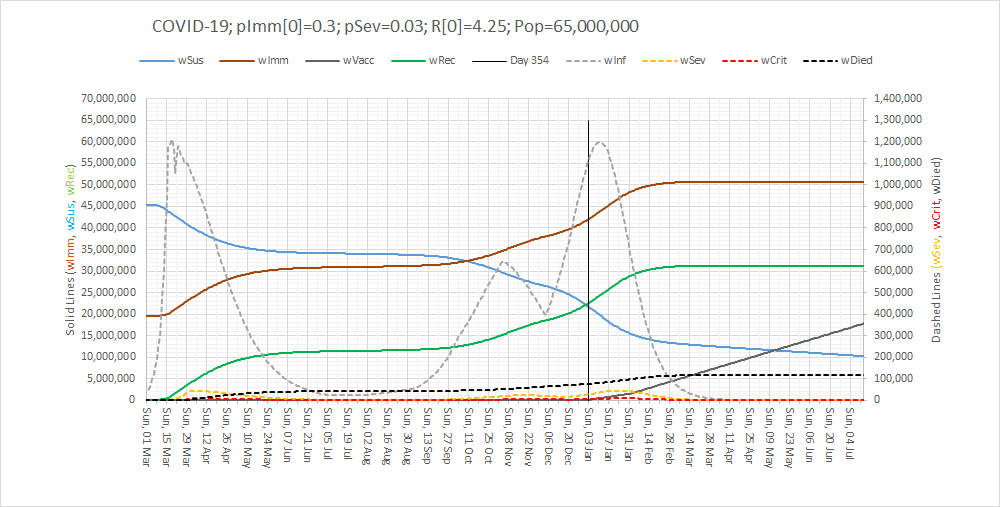
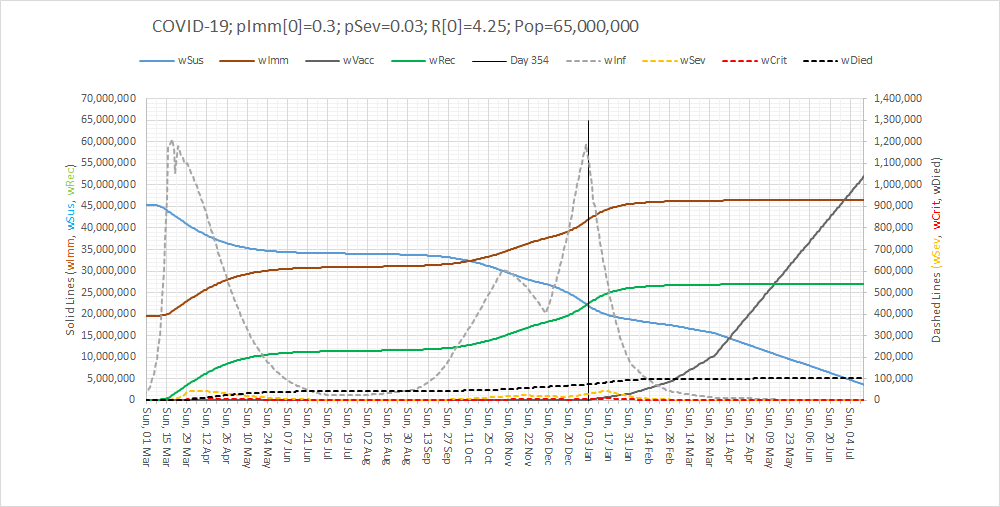
Here is what the updated SEIR-V model suggests will happen if we continue with the current restrictions and the current vaccination rate.  I’ve updated it with the latest data and added a Vaccination component.

The lines to focus on are the dotted ones: grey = number of infected cases, yellow = number ill enough to justify hospital treatment, red = critically ill and black = not survived.

The vertical black line is Now and the lines to the right of that is the most plausible prediction.

It says that a Third Wave is upon us and that it could be worse than the First Wave.  That is the bad news. The good news is that the reason that the infection rate drops is because the epidemic will finally burn itself out – irrespective of the vaccinations.

So, it would appear that the White Knights cannot rescue us on their own … but we can all help to accelerate the final phase and limit the damage – if we all step up and pull together, at the same time and in the same direction.

We need a three-pronged retaliation:

  1. Lock-down:  “Stay at home. Protect the NHS. Save Lives”.  It worked in the First Wave and it will work in the Third Wave.
  2. Care in the Community:  For those who will become unwell and who will need the support of family, friends, neighbours and the NHS.
  3. Volunteer to Vaccinate:  To protect everyone as soon as is practically feasible.

Here is what it could look like.  All over by Easter.

There is light at the end of the tunnel.  The end is in sight.  We just have to pull together in the final phase of the Game.


PS. For those interested in how an Excel-based SEIR-V model is designed, built and used here’s a short (7 minute) video of the highlights:

This is health care systems engineering (HCSE) in action.

And I believe that the UK will need a new generation of HCSEs to assist in the re-designing and re-building of our shattered care services.  So, if you are interested then click here to explore further.

Second Wave

The summer holidays are over and schools are open again – sort of.

Restaurants, pubs and nightclubs are open again – sort of.

Gyms and leisure facilities are open again – sort of.

And after two months of gradual easing of social restrictions and massive expansion of test-and-trace we now have the spectre of a Second Wave looming.  It has happened in Australia, Italy, Spain and France so it can happen here.

As usual, the UK media are hyping up the general hysteria and we now also have rioting disbelievers claiming it is all a conspiracy and that re-applying local restrictions is an infringement of their liberty.

So, what is all the fuss about?

We need to side-step the gossip and get some hard data from a reliable source (i.e. not a newspaper). Here is what worldometer is sharing …
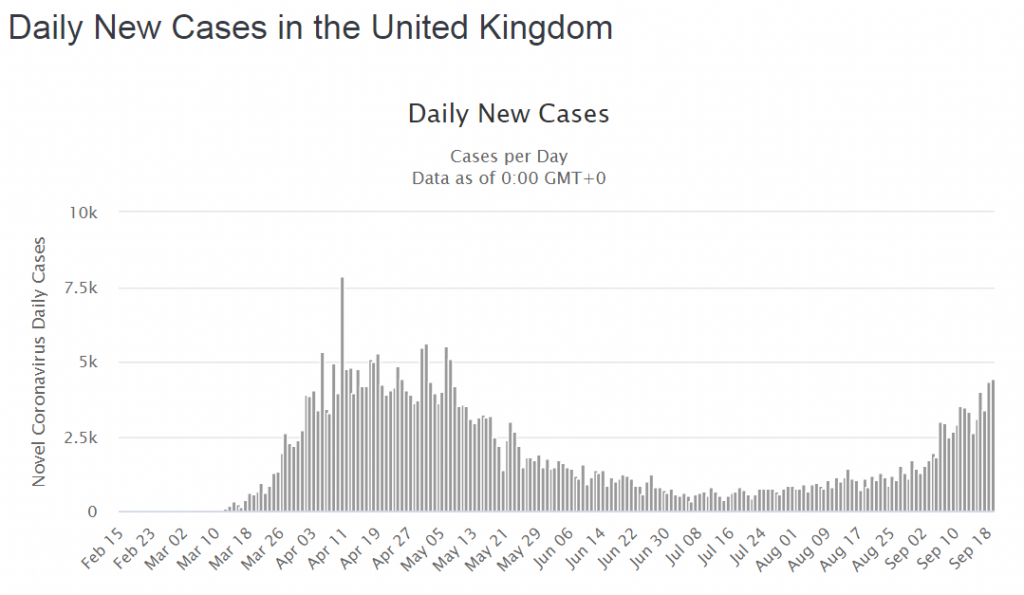
OMG!  It looks like The Second Wave is here already!  There are already as many cases now as in March and we still have the mantra “Stay At Home – Protect the NHS – Save Lives” ringing in our ears.  But something is not quite right.  No one is shouting that hospitals are bursting at the seams.  No one is reporting that the mortuaries are filling up.  Something is different.  What is going on?  We need more data.That is odd!  We can clearly see that cases and deaths went hand-in-hand in the First Wave with about 1:5 cases not making it.  But this time the deaths are not rising with the cases.
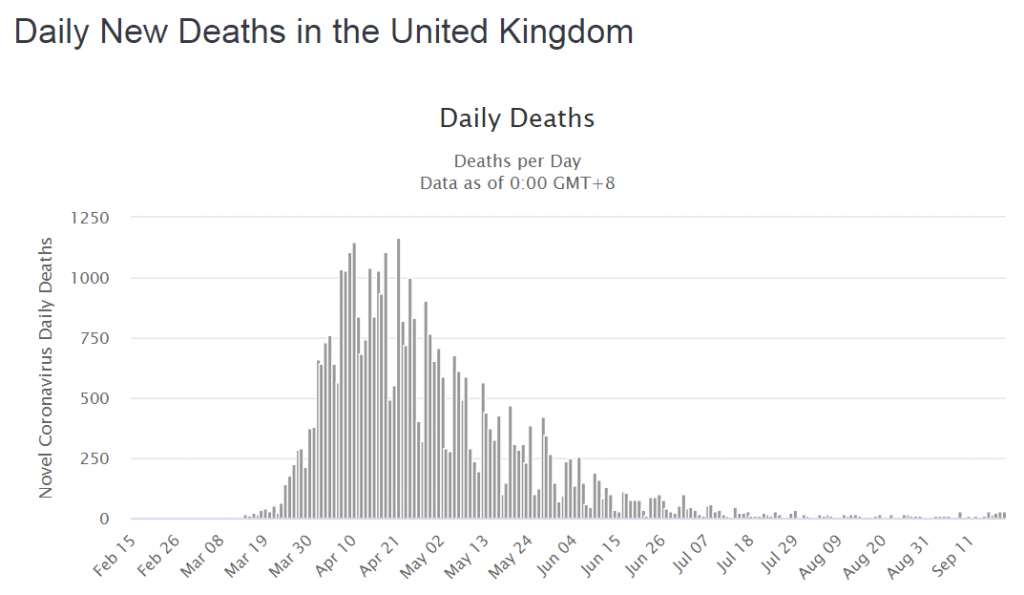
Ah ha!  Maybe that is because the virus has mutated into something much more benign and because we have got much better at diagnosing and treating this illness – the ventilators and steroids saved the day.  Hurrah!  It’s all a big fuss about nothing … we should still be able to have friends round for parties and go on pub crawls again!

But … what if there was a different explanation for the patterns on the charts above?

It is said that “data without context is meaningless” … and I’d go further than that … data without context is dangerous because if it leads to invalid conclusions and inappropriate decisions we can get well-intended actions that cause unintended harm.  Death.

So, we need to check the context of the data.

In the First Wave the availability of the antigen (swab) test was limited so it was only available to hospitals and the “daily new cases” were in patients admitted to hospital – the ones with severe enough symptoms to get through the NHS 111 telephone triage.  Most people with symptoms, even really bad ones, stayed at home to protect the NHS.  They didn’t appear in the statistics.

But did the collective sacrifice of our social lives save actual lives?

The original estimates of the plausible death toll in the UK ranged up to 500,000 from coronavirus alone (and no one knows how many more from the collateral effects of an overwhelmed NHS).  The COVID-19 body count to date is just under 50000, so putting a positive spin on that tragic statistic, 90% of the potential deaths were prevented.  The lock-down worked.  The NHS did not collapse.  The Nightingales stood ready and idle – an expensive insurance policy.  Lives were actually saved.

Why isn’t that being talked about?

And the context changed in another important way.  The antigen testing capacity was scaled up despite being mired in confusing jargon.  Who thought up the idea of calling them “pillars”?

But, if we dig about on the GOV.UK website long enough there is a definition:

So, Pillar 1 = NHS testing capacity Pillar 2 = commercial testing capacity and we don’t actually know how much was in-hospital testing and how much was in-community testing because the definitions seem to reflect budgets rather than patients.  Ever has it been thus in the NHS!

However, we can see from the chart below that testing activity (blue bars) has increased many-fold but the two testing streams (in hospital and outside hospital) are combined in one chart.  Well, it is one big pot of tax-payers cash after all and it is the same test.
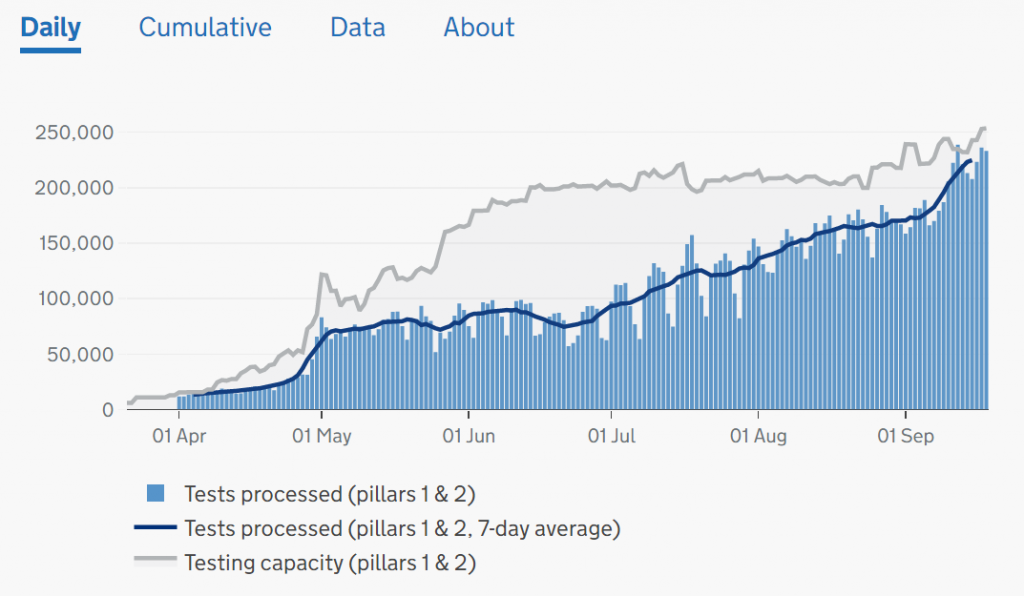
To unravel this a bit we have to dig into the website, download the raw data, and plot it ourselves.  Looking at Pillar 2 (commercial) we can see they had a late start, caught the tail of the First Wave, and then ramped up activity as the population testing caught up with the available capacity (because hospital activity has been falling since late April).
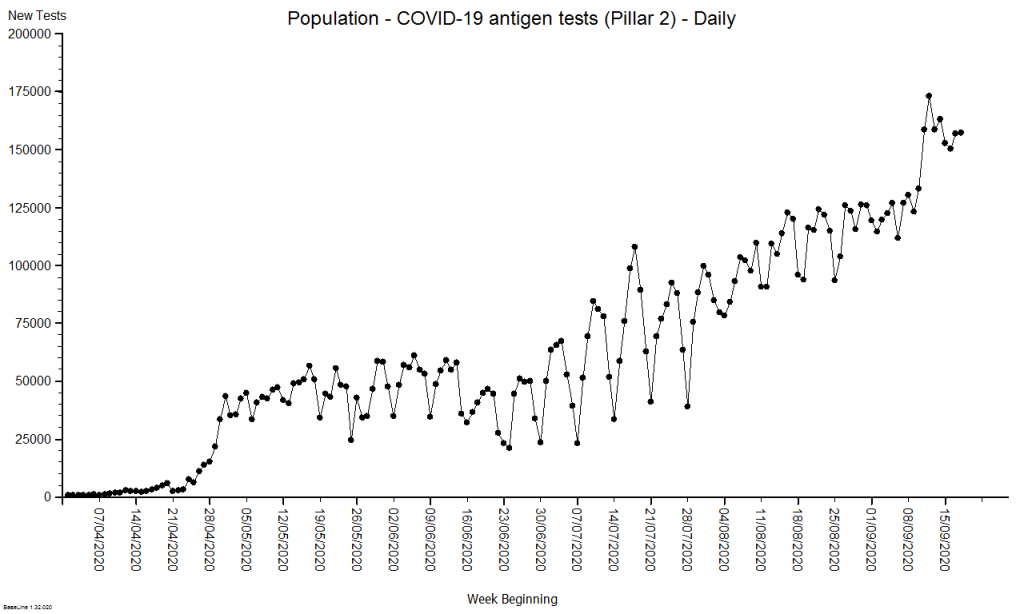
Now we can see that the increased number of positive tests could be explained by the fact that we are now testing anyone with possible COVID-19 symptoms who steps up – mainly in the community.  And we were unable to do this before because the testing capacity did not exist.

The important message is that in the First Wave we were not measuring what was happening in the community – it was happening though – it must have been.  We measured the knock on effects: hospital admissions with positive tests and deaths after positive tests.

So, to present the daily positive tests as one time-series chart that conflates both ‘pillars’ is both meaningless and dangerous and it is no surprise that people are confused.


This raises a question: Can we estimate how many people there would have been in the community in the First Wave so that we can get a sense of what the rising positive test rate means now?

The way that epidemiologists do this is to build a generic simulation of the system dynamics of an epidemic (a SEIR multi-compartment model) and then use the measured data to calibrate the this model so that it can then be used for specific prediction and planning.

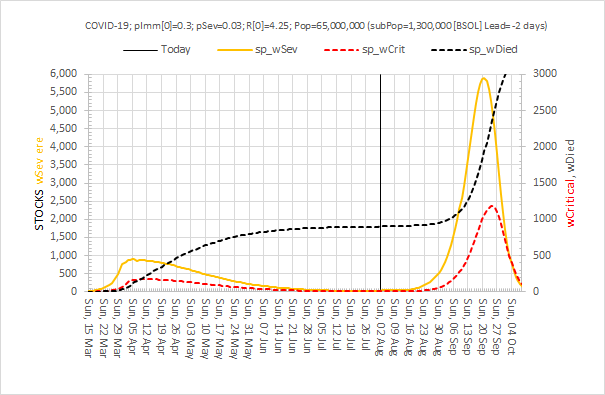
Here is an example of the output of a calibrated multi-compartment system dynamics model of the UK COVID-19 epidemic for a nominal 1.3 million population.  The compartments that are included are Susceptible, Exposed, Infectious, and Recovered (i.e. not infectious) and this model also simulates the severity of the illness i.e. Severe (in hospital), Critical (in ITU) and Died.

The difference in size of the various compartments is so great that the graph below requires two scales – the solid line (Infectious) is plotted on the left hand scale and the others are plotted on the right hand scale which is 10 times smaller.  The green line is today and the reported data up to that point has been used to calibrate the model and to estimate the historical metrics that we did not measure – such as how many people in the community were infectious (and would have tested positive).
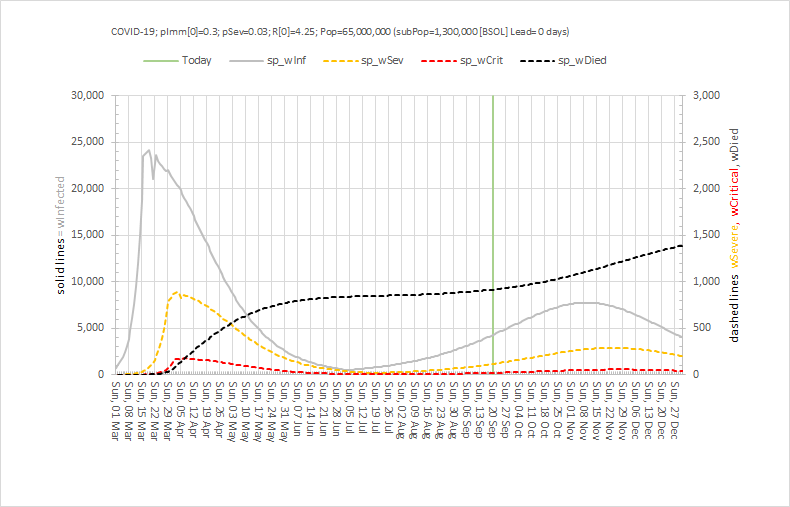
At the peak of the First Wave, for this population of 1.3 million, the model estimates there were about 800 patients in hospital (which there were) and 24,000 patients in the community who would have tested positive if we had been able to test them.  24,000/800 = 30 which means the peak of the grey line is 30 x higher than the peak of the orange line – hence the need for the two Y-axes with a 10-fold difference in scale.

Note the very rapid rise in the number of infectious people from the beginning of March when the first UK death was announced, before the global pandemic was declared and before the UK lock-down was enacted in law and implemented.  Coronavirus was already spreading very rapidly.

Note how this rapid rise in the number of infectious people came to an abrupt halt when the UK lock-down was put into place in the third week of March 2020.  Social distancing breaks the chain of transmission from one infectious person to many other susceptible ones.

Note how the peaks of hospital admissions, critical care admissions and deaths lag after the rise in infectious people (because it takes time for the coronavirus to do its damage) and how each peak is smaller (because only about 1:30 get sick enough to need admission, and only 1:5 of hospital admissions do not survive.

Note how the fall in the infectious group was more gradual than the rise (because the lock-down was partial,  because not everyone could stay at home (essential services like the NHS had to continue), and because there was already a big pool of infectious people in the community.


So, by early July 2020 it was possible to start a gradual relaxation of the lock down and from then we can see a gradual rise in infectious people again.  But now we were measuring them because of the growing capacity to perform antigen tests in the community.  The relatively low level and the relatively slow rise are much less dramatic than what was happening in March (because of the higher awareness and the continued social distancing and use of face coverings).  But it is all too easy to become impatient and complacent.

But by early September 2020 it was clear that the number on infectious people was growing faster in the community – and then we saw hospital admissions reach a minimum and start to rise again.  And then the number if deaths reach a minimum and start to rise again.  And this evidence proves that the current level of social distancing is not enough to keep a lid on this disease.  We are in the foothills of a Second Wave.


So what do we do next?

First, we must estimate the effect that the current social distancing policies are having and one way to do that would be to stop doing them and see what happens.  Clearly that is not an ethical experiment to perform given what we already know.  But, we can simulate that experiment using our calibrated SEIR model.  Here is what is predicted to happen if we went back to the pre-lockdown behaviours: There would be a very rapid spread of the virus followed by a Second Wave that would be many times bigger than the first!!  Then it would burn itself out and those who had survived could go back to some semblance of normality.  The human sacrifice would be considerable though.
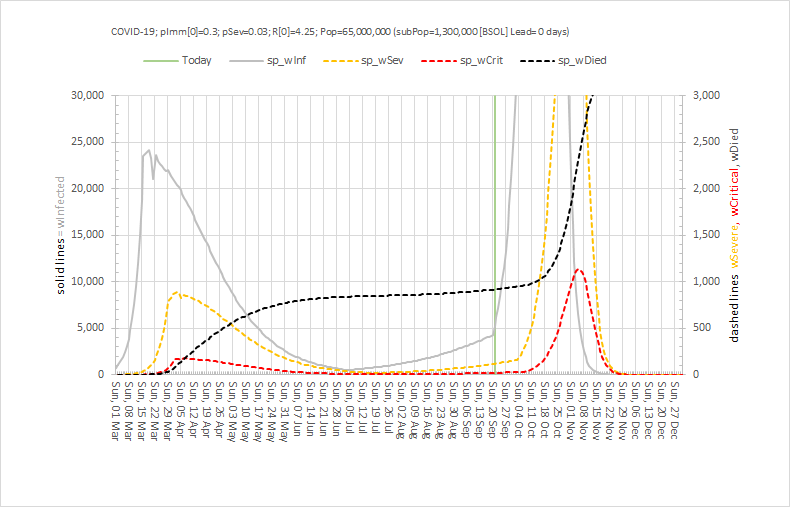
So, despite the problems that the current social distancing is causing, they pale into insignificance compared to what could happen if they were dropped.

The previous model shows what is predicted would happen if we continue as we are with no further easing of restrictions and assuming people stick to them.  In short, we will have COVID-for-Christmas and it could be a very nasty business indeed as it would come at the same time as other winter-associated infectious diseases such as influenza and norovirus.

The next chart shows what could happen if we squeeze the social distancing brake a bit harder by focusing only on the behaviours that the track-and-trace-and-test system is highlighting as the key drivers of the growth infections, admissions and deaths.
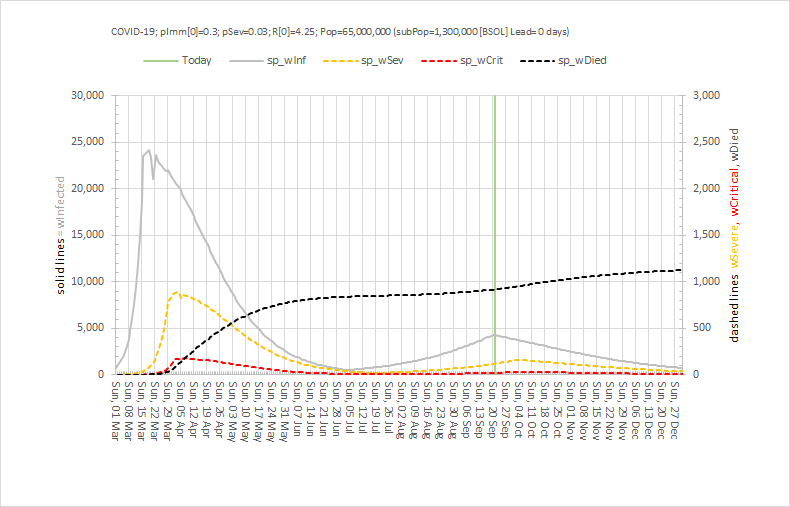
What we see is an arrest of the rise of the number of infectious people (as we saw before), a small and not sustained increase in hospital admissions, then a slow decline back to the levels that were achieved in early July – and at which point it would be reasonable to have a more normal Christmas.

And another potential benefit of a bit more social distancing might be a much less problematic annual flu epidemic because that virus would also find it harder to spread – plus we have a flu vaccination which we can use to reduce that risk further.


It is not going to be easy.  We will have to sacrifice a bit of face-to-face social life for a bit longer.  We will have to measure, monitor, model and tweak the plan as we go.

And one thing we can do immediately is to share the available information in a more informative and less histrionic way than we are seeing at the moment.


Update: Sunday 1st November 2020

Yesterday the Government had to concede that the policy of regional restrictions had failed and bluffing it out and ignoring the scientific advice was, with the clarity of hindsight, an unwise strategy.

In the face of the hard evidence of rapidly rising COVID+ve hospital admissions and deaths, the decision to re-impose a national 4-week lock-down was announced.  This is the only realistic option to prevent overwhelming the NHS at a time of year that it struggles with seasonal influenza causing a peak of admissions and deaths.

Paradoxically, this year the effect of influenza may be less because social distancing will reduce the spread of that as well and also because there is a vaccination for influenza.  Many will have had their flu jab early … I certainly did.

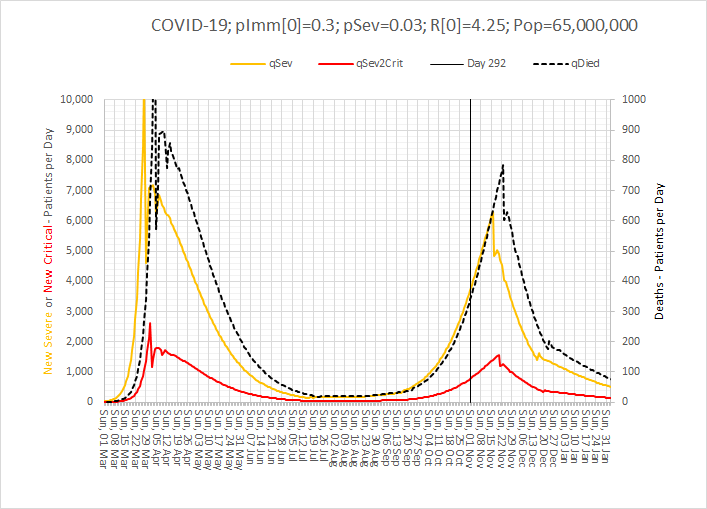
So, what is the predicted effect of a 4 week lock down?  Well, the calibrated model (also used to generate the charts above) estimates that it could indeed suppress the Second Wave and mitigate a nasty COVID-4-Christmas scenario.  But even with it the hospital admissions and associated mortality will continue to increase until the effect kicks in.

Brace yourselves.
Coronavirus


The start of a new year, decade, century or millennium is always associated with a sense of renewal and hope.  Little did we know that in January 2020 a global threat had hatched and was growing in the city of Wuhan, Hubei Province, China.  A virus of the family coronaviridae had mutated and jumped from animal to man where it found a new host and a vehicle to spread itself.   Several weeks later the World became aware of the new threat and in the West … we ignored it.  Maybe we still remember the SARS epidemic which was heralded as a potential global catastrophe but was contained in the Far East and fizzled out.  So, maybe we assumed this SARS-like virus would do the same.

It didn’t.  This mutant was different.  It caused a milder illness and unwitting victims were infectious before they were symptomatic.  And most got better on their own, so they spread the mutant to many other people.  Combine that mutant behaviour with the winter (when infectious diseases spread more easily because we spend more time together indoors), Chinese New Year and global air travel … and we have the perfect recipe for cooking up a global pandemic of a new infectious disease.  But we didn’t know that at the time and we carried on as normal, blissfully unaware of the catastrophe that was unfolding.

By February 2020 it became apparent that the mutant had escaped containment in China and was wreaking havoc in other countries – with Italy high on the casualty list.  We watched in horror at the scenes on television of Italian hospitals overwhelmed with severely ill people fighting for breath as the virus attacked their lungs.  The death toll rose sharply but we still went on our ski holidays and assumed that the English Channel and our Quarantine Policy would protect us.

They didn’t.  This mutant was different.  We now know that it had already silently gained access into the UK and was growing and spreading.  The first COVID-19 death reported in the UK was in early March 2020 and only then did we sit up and start to take notice.  This was getting too close to home.

But it was too late.  The mathematics of how epidemics spread was worked out 100 years ago, not long after the 1918 pandemic of Spanish Flu that killed tens of millions of people before it burned itself out.  An epidemic is like cancer.  By the time it is obvious it is already far advanced because the growth is not linear – it is exponential.

As a systems engineer I am used to building simulation models to reveal the complex and counter-intuitive behaviour of nonlinear systems using the methods first developed by Jay W. Forrester in the 1950’s.  And when I looked up the equations that describe epidemics (on Wikipedia) I saw that I could build a system dynamics model of a COVID-19 epidemic using no more than an Excel spreadsheet.

So I did.  And I got a nasty surprise.  Using the data emerging from China on the nature of the spread of the mutant virus, the incidence of severe illness and the mortality rate … my simple Excel model predicted that, if COVID-19 was left to run its natural course in the UK, then it would burn itself out over several months but the human cost would be 500,000 deaths and the NHS would be completely overwhelmed with a “tsunami of sick”.  And I could be one of them!  The fact that there is no treatment and no vaccine for this novel threat excluded those options.  My basic Excel model confirmed that the only effective option to mitigate this imminent catastrophe was to limit the spread of the virus through social engineering i.e. an immediate and drastic lock-down.  Everyone who was not essential to maintaining core services should “Stay at home, Protect the NHS and Save lives“.  That would become the mantra.  And others were already saying this – epidemiologists whose careers are spent planning for this sort of eventuality.  But despite all this there still seemed to be little sense of urgency, perhaps because their super-sophisticated models predicted that the peak of the UK epidemic would be in mid-June so there was time to prepare.  My basic model predicted that the peak would be in mid-April, in about 4 weeks, and that it was already too late to prevent about 50,000 deaths.

It turns out I was right.  That is exactly what happened.  By mid-March 2020 London was already seeing an exponential rise in hospital admissions, intensive care admissions and deaths and suddenly the UK woke up and panicked.  By that time I had enlisted the help of a trusted colleague who is a public health doctor and who had studied epidemiology, and together we wrote up and published the emerging story as we saw it:

An Acute Hospital Demand Surge Planning Model for the COVID-19 Epidemic using Stock-and-Flow Simulation in Excel: Part 1. Journal of Improvement Science 2020: 68; 1-20.  The link to download the full paper is here.

I also shared the draft paper with another trusted friend and colleague who works for my local clinical commissioning group (CCG) and I asked “Has the CCG a sense of the speed and magnitude of what is about to happen and has it prepared for the tsunami of sick that primary care will need to see?

What then ensued was an almost miraculous emergence of a coordinated and committed team of health care professionals and NHS managers with a single, crystal clear goal:  To design, build and deliver a high-flow, drive-through community-based facility to safely see-and-assess hundreds of patients per day with suspected COVID-19 who were too sick/worried to be managed on the phone, but not sick enough to go to A&E.  This was not a Nightingale Ward – that was a parallel, more public and much more expensive endeavour designed as a spillover for overwhelmed acute hospitals.  Our purpose was to help to prevent that and the time scale was short.  We had three weeks to do it because Easter weekend was the predicted peak of the COVID-19 surge if the national lock-down policy worked as hoped.  No one really had an accurate estimate how effective the lock-down would be and how big the peak of the tsunami of sick would rise as it crashed into the NHS.  So, we planned for the worst and hoped for the best.  The Covid Referral Centre (CRC) was an insurance policy and we deliberately over-engineered it use to every scrap of space we had been offered in a small car park on the south side of the NEC site.

The CRC needed to open by Sunday 12th April 2020 and we were ready, but the actual opening was delayed by NHS bureaucracy and politics.  It did eventually open on 22nd April 2020, just four weeks after we started, and it worked exactly as designed.  The demand was, fortunately, less than our worst case scenario; partly because we had missed the peak by 10 days and we opened the gates to a falling tide; and partly because the social distancing policy had been more effective than hoped; and partly because it takes time for risk-averse doctors to develop trust and to change their ingrained patterns of working.  A drive-thru COVID-19 see-and-treat facility? That was innovative and untested!!

The CRC expected to see a falling demand as the first wave of COVID-19 washed over, and that exactly is what happened.  So, as soon as that prediction was confirmed, the CRC was progressively repurposed to provide other much needed services such as drive-thru blood tests, drive-thru urgent care, and even outpatient clinics in the indoor part of the facility.

The CRC closed its gates to suspected COVID-19 patients on 31st July 2020, as planned and as guided by the simple Excel computer model.

This is health care systems engineering in action.

And the simple Excel model has been continuously re-calibrated as fresh evidence has emerged.  The latest version predicts that a second peak of COVID-19 (that is potentially worse than the first) will happen in late summer or autumn if social distancing is relaxed too far (see below).

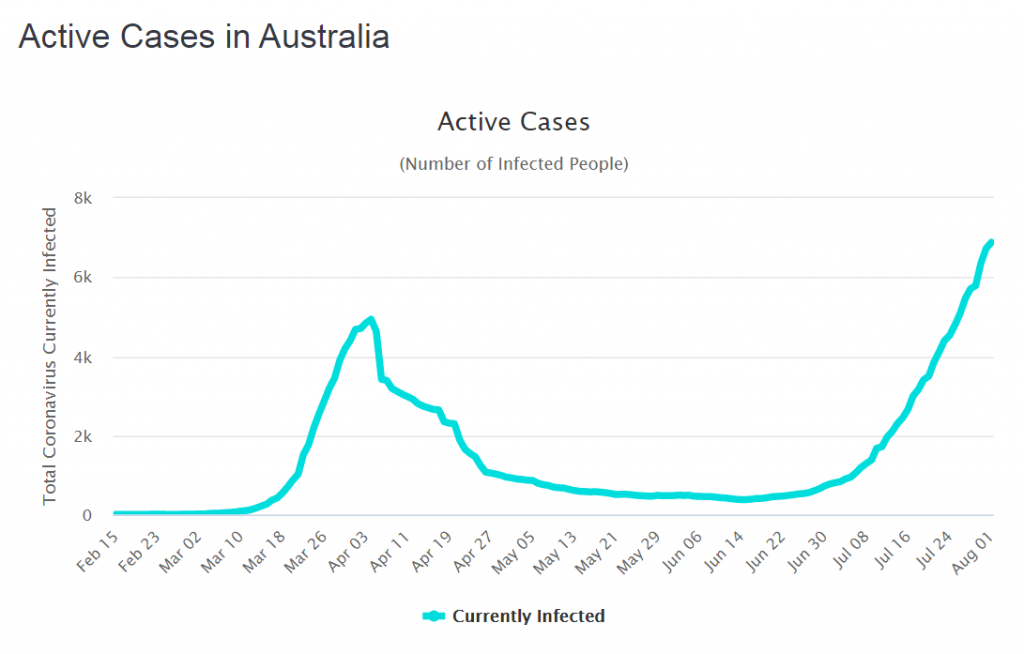
But we don’t know what “too far” looks like in practical terms.  Oh, and a second wave could kick off just just when we expect the annual wave of seasonal influenza to arrive.  Or will it?  Maybe the effect of social distancing for COVID-19 in other countries will suppress the spread of seasonal flu as well?  We don’t know that either but the data of the incidence of flu from Australia certainly supports that hypothesis.

We may need a bit more health care systems engineering in the coming months. We shall see.

Oh, and if we are complacent enough to think a second wave could never happen in the UK … here is what is happening in Australia.