One Step Back; Two Steps Forward.

This week a ground-breaking case study was published.

It describes how a team in South Wales discovered how to make the flows visible in a critical part of their cancer pathway.

Radiology.

And they did that by unintentionally falling into a trap!  A trap that many who set out to improve health care services fall into.  But they did not give up.  They sought guidance and learned some profound lessons.

Part 1 of their story is shared here.


One lesson they learned is that, as they take on more complex improvement challenges, they need to be equipped with the right tools, and they need to be trained to use them, and they need to have practiced using them.

Another lesson they learned is that making the flows in a system visible is necessary before the current behaviour of the system can be understood.

And they learned that they needed a clear diagnosis of how the current system is not performing; before they can attempt to design an intervention to deliver the intended improvement.

They learned how the Study-Plan-Do cycle works, and they learned the reason it starts with “Study”, and not with “Plan”.


They tried, failed, took one step back, asked, listened and learned.


Then with their new knowledge, more advanced tools, and deeper understanding they took two steps forward; diagnosed problem, designed an intervention, and delivered a significant improvement.

And visualised just how significant.

Then they shared Part 2 of their story … here.


Unknown-Knowns

This is the now-infamous statement that Donald Rumsfeld made at a Pentagon Press Conference which triggered some good-natured jesting from the assembled journalists.

But there is a problem with it.

There is a fourth combination that he does not mention: the Unknown-Knowns.

Which is a shame because they are actually the most important because they cause the most problems.  Avoidable problems.


Suppose there is a piece of knowledge that someone knows but that someone else does not; then we have an unknown-known.

None of us know everything and we do not need to, because knowledge that is of no value to us is irrelevant for us.

But what happens when the unknown-known is of value to us, and more than that; what happens when it would be reasonable for someone else to expect us to know it; because it is our job to know.


A surgeon would be not expected to know a lot about astronomy, but they would be expected to know a lot about anatomy.


So, what happens if we become aware that we are missing an important piece of knowledge that is actually already known?  What is our normal human reaction to that discovery?

Typically, our first reaction is fear-driven and we express defensive behaviour.  This is because we fear the potential loss-of-face from being exposed as inept.

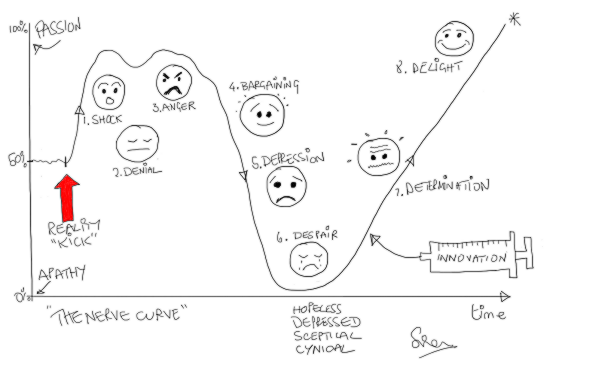
From this sudden shock we then enter a characteristic emotional pattern which is called the Nerve Curve.

After the shock of discovery we quickly flip into denial and, if that does not work then to anger (i.e. blame).  We ignore the message and if that does not work we shoot the messenger.


And when in this emotionally charged state, our rationality tends to take a back seat.  So, if we want to benefit from the discovery of an unknown-known, then we have to learn to bite-our-lip, wait, let the red mist dissipate, and then re-examine the available evidence with a cool, curious, open mind.  A state of mind that is receptive and open to learning.


Recently, I was reminded of this.


The context is health care improvement, and I was using a systems engineering framework to conduct some diagnostic data analysis.

My first task was to run a data-completeness-verification-test … and the data I had been sent did not pass the test.  There was some missing.  It was an error of omission (EOO) and they are the hardest ones to spot.  Hence the need for the verification test.

The cause of the EOO was an unknown-known in the department that holds the keys to the data warehouse.  And I have come across this EOO before, so I was not surprised.

Hence the need for the verification test.

I was not annoyed either.  I just fed back the results of the test, explained what the issue was, explained the cause, and they listened and learned.


The implication of this specific EOO is quite profound though because it appears to be ubiquitous across the NHS.

To be specific it relates to the precise details of how raw data on demand, activity, length of stay and bed occupancy is extracted from the NHS data warehouses.

So it is rather relevant to just about everything the NHS does!

And the error-of-omission leads to confusion at best; and at worst … to the following sequence … incomplete data =>  invalid analysis => incorrect conclusion => poor decision => counter-productive action => unintended outcome.

Does that sound at all familiar?


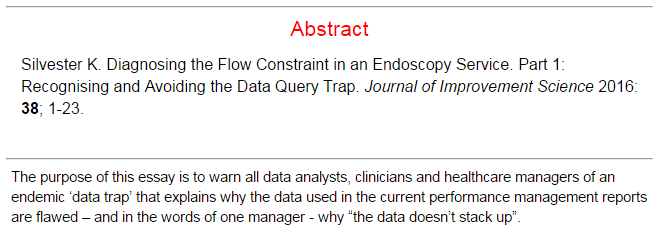
So, if would you like to learn about this valuable unknown-known is then I recommend the narrative by Dr Kate Silvester, an internationally recognised expert in healthcare improvement.  In it, Kate re-tells the story of her emotional roller-coaster ride when she discovered she was making the same error.


Here is the link to the full abstract and where you can download and read the full text of Kate’s excellent essay, and help to make it a known-known.

That is what system-wide improvement requires – sharing the knowledge.

Early Warning System

radar_screen_anim_300_clr_11649The most useful tool that a busy operational manager can have is a reliable and responsive early warning system (EWS).

One that alerts when something is changing and that, if missed or ignored, will cause a big headache in the future.

Rather like the radar system on an aircraft that beeps if something else is approaching … like another aircraft or the ground!


Operational managers are responsible for delivering stuff on time.  So they need a radar that tells them if they are going to deliver-on-time … or not.

And their on-time-delivery EWS needs to alert them soon enough that they have time to diagnose the ‘threat’, design effective plans to avoid it, decide which plan to use, and deliver it.

So what might an effective EWS for a busy operational manager look like?

  1. It needs to be reliable. No missed threats or false alarms.
  2. It needs to be visible. No tomes of text and tables of numbers.
  3. It needs to be simple. Easy to learn and quick to use.

And what is on offer at the moment?

The RAG Chart
This is a table that is coloured red, amber and green. Red means ‘failing’, green means ‘not failing’ and amber means ‘not sure’.  So this meets the specification of visible and simple, but it is reliable?

It appears not.  RAG charts do not appear to have helped to solve the problem.

A RAG chart is generated using historic data … so it tells us where we are now, not how we got here, where we are going or what else is heading our way.  It is a snapshot. One frame from the movie.  Better than complete blindness perhaps, but not much.

The SPC Chart
This is a statistical process control chart and is a more complicated beast.  It is a chart of how some measure of performance has changed over time in the past.  So like the RAG chart it is generated using historic data.  The advantage is that it is not just a snapshot of where were are now, it is a picture of story of how we got to where we are, so it offers the promise of pointing to where we may be heading.  It meets the specification of visible, and while more complicated than a RAG chart, it is relatively easy to learn and quick to use.

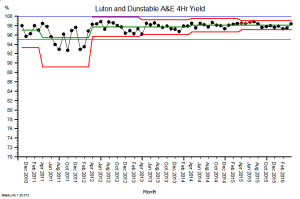
Luton_A&E_4Hr_YieldHere is an example. It is the SPC  chart of the monthly A&E 4-hour target yield performance of an acute NHS Trust.  The blue lines are the ‘required’ range (95% to 100%), the green line is the average and the red lines are a measure of variation over time.  What this charts says is: “This hospital’s A&E 4-hour target yield performance is currently acceptable, has been so since April 2012, and is improving over time.”

So that is much more helpful than a RAG chart (which in this case would have been green every month because the average was above the minimum acceptable level).


So why haven’t SPC charts replaced RAG charts in every NHS Trust Board Report?

Could there be a fly-in-the-ointment?

The answer is “Yes” … there is.

SPC charts are a quality audit tool.  They were designed nearly 100 years ago for monitoring the output quality of a process that is already delivering to specification (like the one above).  They are designed to alert the operator to early signals of deterioration, called ‘assignable cause signals’, and they prompt the operator to pay closer attention and to investigate plausible causes.

SPC charts are not designed for predicting if there is a flow problem looming over the horizon.  They are not designed for flow metrics that exhibit expected cyclical patterns.  They are not designed for monitoring metrics that have very skewed distributions (such as length of stay).  They are not designed for metrics where small shifts generate big cumulative effects.  They are not designed for metrics that change more slowly than the frequency of measurement.

And these are exactly the sorts of metrics that a busy operational manager needs to monitor, in reality, and in real-time.

Demand and activity both show strong cyclical patterns.

Lead-times (e.g. length of stay) are often very skewed by variation in case-mix and task-priority.

Waiting lists are like bank accounts … they show the cumulative sum of the difference between inflow and outflow.  That simple fact invalidates the use of the SPC chart.

Small shifts in demand, activity, income and expenditure can lead to big cumulative effects.

So if we abandon our RAG charts and we replace them with SPC charts … then we climb out of the RAG frying pan and fall into the SPC fire.

Oops!  No wonder the operational managers and financial controllers have not embraced SPC.


So is there an alternative that works better?  A more reliable EWS that busy operational managers and financial controllers can use?

Yes, there is, and here is a clue …

… but tread carefully …

… building one of these Flow-Productivity Early Warning Systems is not as obvious as it might first appear.  There are counter-intuitive traps for the unwary and the untrained.

You may need the assistance of a health care systems engineer (HCSE).

Precious Life Time

stick_figure_help_button_150_wht_9911Imagine this scenario:

You develop some non-specific symptoms.

You see your GP who refers you urgently to a 2 week clinic.

You are seen, assessed, investigated and informed that … you have cancer!


The shock, denial, anger, blame, bargaining, depression, acceptance sequence kicks off … it is sometimes called the Kübler-Ross grief reaction … and it is a normal part of the human psyche.

But there is better news. You also learn that your condition is probably treatable, but that it will require chemotherapy, and that there are no guarantees of success.

You know that time is of the essence … the cancer is growing.

And time has a new relevance for you … it is called life time … and you know that you may not have as much left as you had hoped.  Every hour is precious.


So now imagine your reaction when you attend your local chemotherapy day unit (CDU) for your first dose of chemotherapy and have to wait four hours for the toxic but potentially life-saving drugs.

They are very expensive and they have a short shelf-life so the NHS cannot afford to waste any.   The Aseptic Unit team wait until all the safety checks are OK before they proceed to prepare your chemotherapy.  That all takes time, about four hours.

Once the team get to know you it will go quicker. Hopefully.

It doesn’t.

The delays are not the result of unfamiliarity … they are the result of the design of the process.

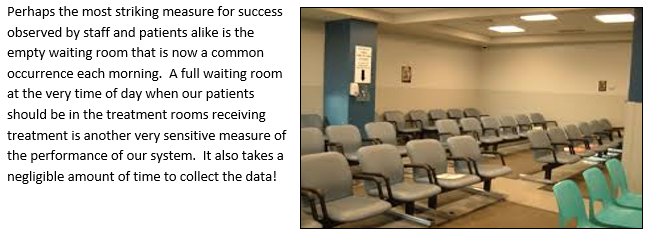
All your fellow patients seem to suffer repeated waiting too, and you learn that they have been doing so for a long time.  That seems to be the way it is.  The waiting room is well used.

Everyone seems resigned to the belief that this is the best it can be.

They are not happy about it but they feel powerless to do anything.


Then one day someone demonstrates that it is not the best it can be.

It can be better.  A lot better!

And they demonstrate that this better way can be designed.

And they demonstrate that they can learn how to design this better way.

And they demonstrate what happens when they apply their new learning …

… by doing it and by sharing their story of “what-we-did-and-how-we-did-it“.

CDU_Waiting_Room

If life time is so precious, why waste it?

And perhaps the most surprising outcome was that their safer, quicker, calmer design was also 20% more productive.

Does your job title say “Manager” or “Leader”?

by Julian Simcox

Actually, it doesn’t much matter because everyone needs to be able to choose between managing and leading – as distinct and yet mutually complementary action/ logics – and to argue that one is better than the other, or worse to try to school people about just one of them on its own, is inane. The UK’s National Health Service for example is currently keen on convincing medics that they should become “clinical leaders”, the term “clinical manager” being rarely heard, yet if anything the NHS suffers more from a shortage of management skill.

It is not only healthcare that is short on management. In the first half of my career I held the title “manager” in seven different roles, and in three different organisations, and had even completed an Exec MBA, but still didn’t properly get what it meant. The people I reported into also had little idea about what “managing well” actually meant, and even if they had possessed an inclination to coach me, would have merely added to my confusion.

If however you are fortunate enough to be working in an organisation that over time has been purposefully developed as a “Learning Culture” you will have acquired an appreciation of the vital distinction between managing and leading, and just what a massive difference this makes to your effectiveness, for it requires you, before you act, to understand (11) how your system is really flowing and performing. Only then will you be ready to choose whether to manage or to lead.

It is therefore not your role’s title that matters but whether the system you are running is stable, and whether it is capable of producing the outcomes needed by your customers. It also matters how risk is to be handled by you and your organisation when you are making changes. Outcomes will depend heavily upon you and your team’s accumulated levels of learning – as well, as it turns out, upon your personal world view/ developmental stage (more of which later).

Here is a diagram that illustrates that there are three basic learning contexts that a “managerial leader” (7) needs to be adept at operating within if they are to be able to nimbly choose between them.

JS_Blog_20160221_Fig1

Depending on one’s definitions of the processes of managing and leading, most people would agree that the first learning context pertains to the process of managing, and the third to the process of leading. The second context         (P-D-S-A) which helpfully for NHS employees is core to the NHS “Model of Improvement” turns out to be especially vital for effective managerial leadership for it binds the other two contexts together – as long as you know how?

Following the Mid-Staffs Hospital disaster, David Cameron asked Professor Don Berwick to recommend how to enhance public safety in the UK’s healthcare system. Unusually for a clinician he gets the importance of understanding your system and knowing moment-to-moment whether managing or leading is the right course of action. He recommends that to evolve a system to be as safe as it can be, all NHS employees should “Learn, master and apply the modern methods of quality control, quality improvement and quality planning” (1). He makes this recommendation because without the thinking that accompanies modern quality control methods, clinical managerial leadership is lame.

The Journal of Improvement Science has recently re-published my 10 year old essay called:

“Intervening into Personal and Organisational Systems by Powerfully Leading and Wisely Managing”

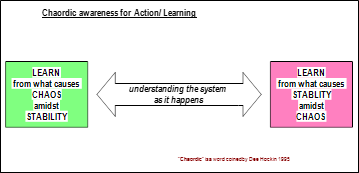
Originally written from the perspective of a practising executive coach, and as a retrospective on the work of W. Edwards Deming, the essay describes just what it is that a few extraordinary Managerial Leaders seem to possess that enables them to simultaneously Manage and Lead Transformation – first of themselves, and second of their organisation. The essay culminates in a comparison of “conventional” and “post-conventional” organisations. Toyota (9,12) in which Deming’s influence continues to be profound, is used as an example of the latter. Using the 3 generic intervention modes/ learning contexts, and the way that these corresponds to an executive’s evolving developmental stage I illustrate how this works and with it what a massive difference it makes. It is only in the later (post-conventional) stages for example that the processes of managing and leading are seen as two sides of the same coin. Dee Hock (6) called these heightened levels of awareness “chaordic” and Jim Collins (2) calls the level of power this brings “Level 5 Leadership”.

JS_Blog_20160221_Fig2

Berwick, borrowing from Deming (4,5) knows that to be structured-to-learn organisations need systems thinking (11) – and that organisations need Managerial Leaders who are sufficiently developed to know how to think and intervene systemically – in other words he recognises the need for personally developing the capability to lead and manage.

Deming in particular seemed to understand the importance of developing empathy for different worldviews – he knew that each contains coherence, just as in its own flat-earth world Euclidian geometry makes perfect sense. When consulting he spent much of his time listening and asking people questions that might develop paradigmatic understanding – theirs and his. Likewise in my own work, primed with knowledge about the developmental stage of key individual players, I am more able to give my interventions teeth.

Possessing a definition of managerial leadership that can work at all the stages is also vital:

Managing =  keeping things flowing, and stable – and hence predictable – so you can consistently and confidently deliver what you’re promising. Any improvement comes from noticing what causes instability and eliminating that cause, or from learning what causes it via experimentation.

Leading  =  changing things, or transforming them, which risks a temporary loss of stability/ predictability in order to shift performance to a new and better level – a level that can then be managed and sustained.

If you resonate with the first essay you need to know that after publishing it I continued to develop the managerial leadership model into one that would work equally well for Managerial Leaders in either developmental epoch – conventional and post-conventional – whilst simultaneously balancing the level of change needed with the level of risk that’s politically tolerable – and all framed by the paradigm-shifts that typically characterise these two epochs. This revised model is described in detail in the essay:

Managerial Leadership: Five action logics viewed via two developmental lenses

– also soon to be made available via the Journal of Improvement Science.

References

  1. Berwick Donald M. – Berwick Review into patient safety (2013)
  2. Collins J.C. – Level 5 Leadership: The triumph of Humility and Fierce Resolve – HBR Jan 2001
  3. Covey. S.R. – The 7 habits of Highly Effective People – 1989 (ISBN 0613191455)
  4. Deming W. Edwards – Out of the Crisis – 1986   (ISBN 0-911379-01-0)
  5. Deming W.E – The New Economics – 1993 (ISBN 0-911379-07-X) First edition
  6. Hock. D. – The birth of the Chaordic Age 2000 (ISBN: 1576750744)
  7. Jaques. E. – Requisite Organisation: A Total System for Effective Managerial Organisation and Managerial Leadership for the 21st Century 1998 (ISBN 1886436045)
  8. Kotter. J. P. – A Force for Change: How Leadership Differs from Management – 1990
  9. Liker J.K & Meier D. – The Toyota Way Fieldbook. 2006
  10. Scholtes Peter R. The Leader’s Handbook: Making Things Happen, Getting Things Done. 1998
  11. Senge. P. M. – The Fifth Discipline 1990   ISBN 10-0385260946
  12. Spear. S. – Learning to Lead at Toyota – Harvard Business Review – May 2004

The Improvement Pyramid

IS_PyramidDeveloping productive improvement capability in an organisation is like building a pyramid in the desert.

It is not easy and it takes time before there is any visible evidence of success.

The height of the pyramid is a measure of the level of improvement complexity that we can take on.

An improvement of a single step in a system would only require a small pyramid.

Improving the whole system will require a much taller one.


But if we rush and attempt to build a sky-scraper on top of the sand then we will not be surprised when it topples over before we have made very much progress.  The Egyptians knew this!

First, we need to dig down and to lay some foundations.  Stable enough and strong enough to support the whole structure.  We will never see the foundations so it is easy to forget them in our rush but they need to be there and they need to be there first.

It is the same when developing improvement science capability  … the foundations are laid first and when enough of that foundation knowledge is in place we can start to build the next layer of the pyramid: the practitioner layer.


It is the the Improvement Science Practitioners (ISPs) who start to generate tangible evidence of progress.  The first success stories help to spur us all on to continue to invest effort, time and money in widening our foundations to be able to build even higher – more layers of capability -until we can realistically take on a system wide improvement challenge.

So sharing the first hard evidence of improvement is an important milestone … it is proof of fitness for purpose … and that news should be shared with those toiling in the hot desert sun and with those watching from the safety of the shade.

So here is a real story of a real improvement pyramid achieving this magical and motivating milestone.


Look Out For The Time Trap!

There is a common system ailment which every Improvement Scientist needs to know how to manage.

In fact, it is probably the commonest.

The Symptoms: Disappointingly long waiting times and all resources running flat out.

The Diagnosis?  90%+ of managers say “It is obvious – lack of capacity!”.

The Treatment? 90%+ of managers say “It is obvious – more capacity!!”

Intuitively obvious maybe – but unfortunately these are incorrect answers. Which implies that 90%+ of managers do not understand how their systems work. That is a bit of a worry.  Lament not though – misunderstanding is a treatable symptom of an endemic system disease called agnosia (=not knowing).

The correct answer is “I do not yet have enough information to make a diagnosis“.

This answer is more helpful than it looks because it prompts four other questions:

Q1. “What other possible system diagnoses are there that could cause this pattern of symptoms?”
Q2. “What do I need to know to distinguish these system diagnoses?”
Q3. “How would I treat the different ones?”
Q4. “What is the risk of making the wrong system diagnosis and applying the wrong treatment?”


Before we start on this list we need to set out a few ground rules that will protect us from more intuitive errors (see last week).

The first Rule is this:

Rule #1: Data without context is meaningless.

For example 130  is a number – it is data. 130 what? 130 mmHg. Ah ha! The “mmHg” is the units – it means millimetres of mercury and it tells us this data is a pressure. But what, where, when,who, how and why? We need more context.

“The systolic blood pressure measured in the left arm of Joe Bloggs, a 52 year old male, using an Omron M2 oscillometric manometer on Saturday 20th October 2012 at 09:00 is 130 mmHg”.

The extra context makes the data much more informative. The data has become information.

To understand what the information actually means requires some prior knowledge. We need to know what “systolic” means and what an “oscillometric manometer” is and the relevance of the “52 year old male”.  This ability to extract meaning from information has two parts – the ability to recognise the language – the syntax; and the ability to understand the concepts that the words are just labels for; the semantics.

To use this deeper understanding to make a wise decision to do something (or not) requires something else. Exploring that would  distract us from our current purpose. The point is made.

Rule #1: Data without context is meaningless.

In fact it is worse than meaningless – it is dangerous. And it is dangerous because when the context is missing we rarely stop and ask for it – we rush ahead and fill the context gaps with assumptions. We fill the context gaps with beliefs, prejudices, gossip, intuitive leaps, and sometimes even plain guesses.

This is dangerous – because the same data in a different context may have a completely different meaning.

To illustrate.  If we change one word in the context – if we change “systolic” to “diastolic” then the whole meaning changes from one of likely normality that probably needs no action; to one of serious abnormality that definitely does.  If we missed that critical word out then we are in danger of assuming that the data is systolic blood pressure – because that is the most likely given the number.  And we run the risk of missing a common, potentially fatal and completely treatable disease called Stage 2 hypertension.

There is a second rule that we must always apply when using data from systems. It is this:

Rule #2: Plot time-series data as a chart – a system behaviour chart (SBC).

The reason for the second rule is because the first question we always ask about any system must be “Is our system stable?”

Q: What do we mean by the word “stable”? What is the concept that this word is a label for?

A: Stable means predictable-within-limits.

Q: What limits?

A: The limits of natural variation over time.

Q: What does that mean?

A: Let me show you.
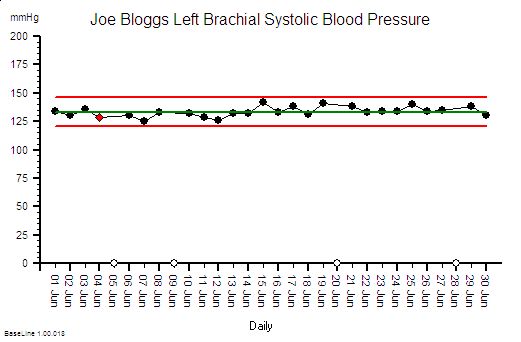
Joe Bloggs is disciplined. He measures his blood pressure almost every day and he plots the data on a chart together with some context .  The chart shows that his systolic blood pressure is stable. That does not mean that it is constant – it does vary from day to day. But over time a pattern emerges from which Joe Bloggs can see that, based on past behaviour, there is a range within which future behaviour is predicted to fall.  And Joe Bloggs has drawn these limits on his chart as two red lines and he has called them expectation lines. These are the limits of natural variation over time of his systolic blood pressure.

If one day he measured his blood pressure and it fell outside that expectation range  then he would say “I didn’t expect that!” and he could investigate further. Perhaps he made an error in the measurement? Perhaps something else has changed that could explain the unexpected result. Perhaps it is higher than expected because he is under a lot of emotional stress a work? Perhaps it is lower than expected because he is relaxing on holiday?

His chart does not tell him the cause – it just flags when to ask more “What might have caused that?” questions.

If you arrive at a hospital in an ambulance as an emergency then the first two questions the emergency care team will need to know the answer to are “How sick are you?” and “How stable are you?”. If you are sick and getting sicker then the first task is to stabilise you, and that process is called resuscitation.  There is no time to waste.


So how is all this relevant to the common pattern of symptoms from our sick system: disappointingly long waiting times and resources running flat out?

Using Rule#1 and Rule#2:  To start to establish the diagnosis we need to add the context to the data and then plot our waiting time information as a time series chart and ask the “Is our system stable?” question.
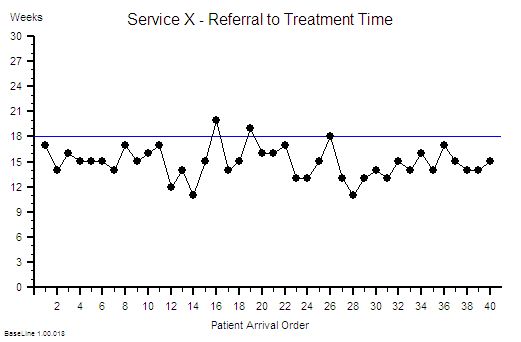
Suppose we do that and this is what we see. The context is that we are measuring the Referral-to-Treatment Time (RTT) for consecutive patients referred to a single service called X. We only know the actual RTT when the treatment happens and we want to be able to set the expectation for new patients when they are referred  – because we know that if patients know what to expect then they are less likely to be disappointed – so we plot our retrospective RTT information in the order of referral.  With the Mark I Eyeball Test (i.e. look at the chart) we form the subjective impression that our system is stable. It is delivering a predictable-within-limits RTT with an average of about 15 weeks and an expected range of about 10 to 20 weeks.

So far so good.

Unfortunately, the purchaser of our service has set a maximum limit for RTT of 18 weeks – a key performance indicator (KPI) target – and they have decided to “motivate” us by withholding payment for every patient that we do not deliver on time. We can now see from our chart that failures to meet the RTT target are expected, so to avoid the inevitable loss of income we have to come up with an improvement plan. Our jobs will depend on it!

Now we have a problem – because when we look at the resources that are delivering the service they are running flat out – 100% utilisation. They have no spare flow-capacity to do the extra work needed to reduce the waiting list. Efficiency drives and exhortation have got us this far but cannot take us any further. We conclude that our only option is “more capacity”. But we cannot afford it because we are operating very close to the edge. We are a not-for-profit organisation. The budgets are tight as a tick. Every penny is being spent. So spending more here will mean spending less somewhere else. And that will cause a big argument.

So the only obvious option left to us is to change the system – and the easiest thing to do is to monitor the waiting time closely on a patient-by-patient basis and if any patient starts to get close to the RTT Target then we bump them up the list so that they get priority. Obvious!

WARNING: We are now treating the symptoms before we have diagnosed the underlying disease!

In medicine that is a dangerous strategy.  Symptoms are often not-specific.  Different diseases can cause the same symptoms.  An early morning headache can be caused by a hangover after a long night on the town – it can also (much less commonly) be caused by a brain tumour. The risks are different and the treatment is different. Get that diagnosis wrong and disappointment will follow.  Do I need a hole in the head or will a paracetamol be enough?


Back to our list of questions.

What else can cause the same pattern of symptoms of a stable and disappointingly long waiting time and resources running at 100% utilisation?

There are several other process diseases that cause this symptom pattern and none of them are caused by lack of capacity.

Which is annoying because it challenges our assumption that this pattern is always caused by lack of capacity. Yes – that can sometimes be the cause – but not always.

But before we explore what these other system diseases are we need to understand why our current belief is so entrenched.

One reason is because we have learned, from experience, that if we throw flow-capacity at the problem then the waiting time will come down. When we do “waiting list initiatives” for example.  So if adding flow-capacity reduces the waiting time then the cause must be lack of capacity? Intuitively obvious.

Intuitively obvious it may be – but incorrect too.  We have been tricked again. This is flawed causal logic. It is called the illusion of causality.

To illustrate. If a patient complains of a headache and we give them paracetamol then the headache will usually get better.  That does not mean that the cause of headaches is a paracetamol deficiency.  The headache could be caused by lots of things and the response to treatment does not reliably tell us which possible cause is the actual cause. And by suppressing the symptoms we run the risk of missing the actual diagnosis while at the same time deluding ourselves that we are doing a good job.

If a system complains of  long waiting times and we add flow-capacity then the long waiting time will usually get better. That does not mean that the cause of long waiting time is lack of flow-capacity.  The long waiting time could be caused by lots of things. The response to treatment does not reliably tell us which possible cause is the actual cause – so by suppressing the symptoms we run the risk of missing the diagnosis while at the same time deluding ourselves that we are doing a good job.

The similarity is not a co-incidence. All systems behave in similar ways. Similar counter-intuitive ways.


So what other system diseases can cause a stable and disappointingly long waiting time and high resource utilisation?

The commonest system disease that is associated with these symptoms is a time trap – and they have nothing to do with capacity or flow.

They are part of the operational policy design of the system. And we actually design time traps into our systems deliberately! Oops!

We create a time trap when we deliberately delay doing something that we could do immediately – perhaps to give the impression that we are very busy or even overworked!  We create a time trap whenever we deferring until later something we could do today.

If the task does not seem important or urgent for us then it is a candidate for delaying with a time trap.

Unfortunately it may be very important and urgent for someone else – and a delay could be expensive for them.

Creating time traps gives us a sense of power – and it is for that reason they are much loved by bureaucrats.

To illustrate how time traps cause these symptoms consider the following scenario:

Suppose I have just enough resource-capacity to keep up with demand and flow is smooth and fault-free.  My resources are 100% utilised;  the flow-in equals the flow-out; and my waiting time is stable.  If I then add a time trap to my design then the waiting time will increase but over the long term nothing else will change: the flow-in,  the flow-out,  the resource-capacity, the cost and the utilisation of the resources will all remain stable.  I have increased waiting time without adding or removing capacity. So lack of resource-capacity is not always the cause of a longer waiting time.

This new insight creates a new problem; a BIG problem.

Suppose we are measuring flow-in (demand) and flow-out (activity) and time from-start-to-finish (lead time) and the resource usage (utilisation) and we are obeying Rule#1 and Rule#2 and plotting our data with its context as system behaviour charts.  If we have a time trap in our system then none of these charts will tell us that a time-trap is the cause of a longer-than-necessary lead time.

Aw Shucks!

And that is the primary reason why most systems are infested with time traps. The commonly reported performance metrics we use do not tell us that they are there.  We cannot improve what we cannot see.

Well actually the system behaviour charts do hold the clues we need – but we need to understand how systems work in order to know how to use the charts to make the time trap diagnosis.

Q: Why bother though?

A: Simple. It costs nothing to remove a time trap.  We just design it out of the process. Our flow-in will stay the same; our flow-out will stay the same; the capacity we need will stay the same; the cost will stay the same; the revenue will stay the same but the lead-time will fall.

Q: So how does that help me reduce my costs? That is what I’m being nailed to the floor with as well!

A: If a second process requires the output of the process that has a hidden time trap then the cost of the queue in the second process is the indirect cost of the time trap.  This is why time traps are such a fertile cause of excess cost – because they are hidden and because their impact is felt in a different part of the system – and usually in a different budget.

To illustrate. Suppose that 60 patients per day are discharged from our hospital and each one requires a prescription of to-take-out (TTO) medications to be completed before they can leave.  Suppose that there is a time trap in this drug dispensing and delivery process. The time trap is a policy where a porter is scheduled to collect and distribute all the prescriptions at 5 pm. The porter is busy for the whole day and this policy ensures that all the prescriptions for the day are ready before the porter arrives at 5 pm.  Suppose we get the event data from our electronic prescribing system (EPS) and we plot it as a system behaviour chart and it shows most of the sixty prescriptions are generated over a four hour period between 11 am and 3 pm. These prescriptions are delivered on paper (by our busy porter) and the pharmacy guarantees to complete each one within two hours of receipt although most take less than 30 minutes to complete. What is the cost of this one-delivery-per-day-porter-policy time trap? Suppose our hospital has 500 beds and the total annual expense is £182 million – that is £0.5 million per day.  So sixty patients are waiting for between 2 and 5 hours longer than necessary, because of the porter-policy-time-trap, and this adds up to about 5 bed-days per day – that is the cost of 5 beds – 1% of the total cost – about £1.8 million.  So the time trap is, indirectly, costing us the equivalent of £1.8 million per annum.  It would be much more cost-effective for the system to have a dedicated porter working from 12 am to 5 pm doing nothing else but delivering dispensed TTOs as soon as they are ready!  And assuming that there are no other time traps in the decision-to-discharge process;  such as the time trap created by batching all the TTO prescriptions to the end of the morning ward round; and the time trap created by the batch of delivered TTOs waiting for the nurses to distribute them to the queue of waiting patients!


Q: So how do we nail the diagnosis of a time trap and how do we differentiate it from a Batch or a Bottleneck or Carveout?

A: To learn how to do that will require a bit more explanation of the physics of processes.

And anyway if I just told you the answer you would know how but might not understand why it is the answer. Knowledge and understanding are not the same thing. Wise decisions do not follow from just knowledge – they require understanding. Especially when trying to make wise decisions in unfamiliar scenarios.

It is said that if we are shown we will understand 10%; if we can do we will understand 50%; and if we are able to teach then we will understand 90%.

So instead of showing how instead I will offer a hint. The first step of the path to knowing how and understanding why is in the following essay:

A Study of the Relative Value of Different Time-series Charts for Proactive Process Monitoring. JOIS 2012;3:1-18

Click here to visit JOIS

The Journal of Improvement Science

Improvement Science encompasses research, improvement and audit and includes both subjective and objective dimensions.  An essential part of collective improvement is sharing our questions and learning with others.

From the perspective of the learner it is necessary to be able to trust that what is shared is valid and from the perspective of the questioner it is necessary to be able to challenge with respect.

Sharing new knowledge is not the only purpose of publication: for academic organisations it is also a measure of performance so there is a academic peer pressure to publish both quantity and quality – an academic’s career progression depends on it.

This pressure has created a whole industry of its own – the academic journal – and to ensure quality is maintained it has created the scholastic peer review process.  The  intention is to filter submitted papers and to only publish those that are deemed worthy – those that are believed by the experts to be of most value and of highest quality.

There are several criteria that editors instruct their volunteer “independent reviewers” to apply such as originality, relevance, study design, data presentation and balanced discussion.  This process was designed over a hundred years ago and it has stood the test of time – but – it was designed specifically for research and before the invention of the Internet, of social media and the emergence of Improvement Science.

So fast-forward to the present and to a world where improvement is now seen to  be complementary to research and audit; where time-series statistics is viewed as a valid and complementary data analysis method; and where we are all able to globally share information with each other and learn from each other in seconds through the medium of modern electronic communication.

Given these changes is the traditional academic peer review journal system still fit for purpose?

One way to approach this question is from the perspective of the customers of the system – the people who read the published papers and the people who write them.  What niggles do they have that might point to opportunities for improvement?

Well, as a reader:

My first niggle is to have to pay a large fee to download an electronic copy of a published paper before I can read it. All I can see is the abstract which does not tell me what I really want to know – I want to see the details of the method and the data not just the authors edited highlights and conclusions.

My second niggle is the long lead time between the work being done and the paper being published – often measured in years!  This implies that the published news is old news  useful for reference maybe but useless for stimulating conversation and innovation.

My third niggle is what is not published.  The well-designed and well-conducted studies that have negative outcomes; lessons that offer as much opportunity for learning as the positive ones.  This is not all – many studies are never done or never published because the outcome might be perceived to adversely affect a commercial or “political” interest.

My fourth niggle is the almost complete insistence on the use of empirical data and comparative statistics – data from simulation studies being treated as “low-grade” and the use of time-series statistics as “invalid”.  Sometimes simulations and uncontrolled experiments are the only feasible way to answer real-world questions and there is more to improvement than a RCT (randomised controlled trial).

From the perspective of an author of papers I have some additional niggles – the secrecy that surrounds the review process (you are not allowed to know who has reviewed the paper); the lack of constructive feedback that could help an inexperienced author to improve their studies and submissions; and the insistence on assignment of copyright to the publisher – as an author you have to give up ownership of your creative output.

That all said there are many more nuggets to the peer review process than niggles and to a very large extent what is published can be trusted – which cannot be said for the more popular media of news, newspapers, blogs, tweets, and the continuous cacophony of partially informed prejudice, opinion and gossip that goes for “information”.

So, how do we keep the peer-reviewed baby and lose the publication-process bath water? How do we keep the nuggets and dump the niggles?

What about a Journal of Improvement Science along the lines of:

1. Fully electronic, online and free to download – no printed material.
2. Community of sponsors – who publically volunteer to support and assist authors.
3. Continuously updated ranking system – where readers vote for the most useful papers.
4. Authors can revise previously published papers – using feedback from peers and readers.
5. Authors retain the copyright – they can copy and distribute their own papers as much as they like.
6. Expected use of both time-series and comparative statistics where appropriate.
7. Short publication lead times – typically days.
8. All outcomes are publishable – warts and all.
9. Published authors are eligible to be sponsors for future submissions.
10. No commercial sponsorship or advertising.

STOP PRESS: JOIS is now launched: Click here to enter.