FrailSafe Design

frailsafeSafe means avoiding harm, and safety is an emergent property of a well-designed system.

Frail means infirm, poorly, wobbly and at higher risk of harm.

So we want our health care system to be a FrailSafe Design.

But is it? How would we know? And what could we do to improve it?


About ten years ago I was involved in a project to improve the safety design of a specific clinical stream flowing through the hospital that I work in.

The ‘at risk’ group of patients were frail elderly patients admitted as an emergency after a fall and who had suffered a fractured thigh bone. The neck of the femur.

Historically, the outcome for these patients was poor.  Many do not survive, and many of the survivors never returned to independent living. They become even more frail.


The project was undertaken during an organisational transition, the hospital was being ‘taken over’ by a bigger one.  This created a window of opportunity for some disruptive innovation, and the project was labelled as a ‘Lean’ one because we had been inspired by similar work done at Bolton some years before and Lean was the flavour of the month.

The actual change was small: it was a flow design tweak that cost nothing to implement.

First we asked two flow questions:
Q1: How many of these high-risk frail patients do we admit a year?
A1: About one per day on average.
Q2: What is the safety critical time for these patients?
A2: The first four days.  The sooner they have hip surgery and are able to be actively mobilise the better their outcome.

Second we applied Little’s Law which showed the average number of patients in this critical phase is four. This was the ‘work in progress’ or WIP.

And we knew that variation is always present, and we knew that having all these patients in one place would make it much easier for the multi-disciplinary teams to provide timely care and to avoid potentially harmful delays.

So we suggested that one six-bedded bay on one of the trauma wards be designated the Fractured Neck Of Femur bay.

That was the flow diagnosis and design done.

The safety design was created by the multi-disciplinary teams who looked after these patients: the geriatricians, the anaesthetists, the perioperative emergency care team (PECT), the trauma and orthopaedic team, the physiotherapists, and so on.

They designed checklists to ensure that all #NOF patients got what they needed when they needed it and so that nothing important was left to chance.

And that was basically it.

And the impact was remarkable. The stream flowed. And one measured outcome was a dramatic and highly statistically significant reduction in mortality.

Injury_2011_Results
The full paper was published in Injury 2011; 42: 1234-1237.

We had created a FrailSafe Design … which implied that what was happening before was clearly not safe for these frail patients!


And there was an improved outcome for the patients who survived: A far larger proportion rehabilitated and returned to independent living, and a far smaller proportion required long-term institutional care.

By learning how to create and implement a FrailSafe Design we had added both years-to-life and life-to-years.

It cost nothing to achieve and the message was clear, as this quote is from the 2011 paper illustrates …

Injury_2011_Message

What was a bit disappointing was the gap of four years between delivering this dramatic and highly significant patient safety and quality improvement and the sharing of the story.


What is more exciting is that the concept of FrailSafe is growing, evolving and spreading.

Type II Error

figure_pointing_out_chart_data_150_clr_8005It was the time for Bob and Leslie’s regular Improvement Science coaching session.

<Leslie> Hi Bob, how are you today?

<Bob> I am getting over a winter cold but otherwise I am good.  And you?

<Leslie> I am OK and I need to talk something through with you because I suspect you will be able to help.

<Bob> OK. What is the context?

<Leslie> Well, one of the projects that I am involved with is looking at the elderly unplanned admission stream which accounts for less than half of our unplanned admissions but more than half of our bed days.

<Bob> OK. So what were you looking to improve?

<Leslie> We want to reduce the average length of stay so that we free up beds to provide resilient space-capacity to ease the 4-hour A&E admission delay niggle.

<Bob> That sounds like a very reasonable strategy.  So have you made any changes and measured any improvements?

<Leslie> We worked through the 6M Design® sequence. We studied the current system, diagnosed some time traps and bottlenecks, redesigned the ones we could influence, modified the system, and continued to measure to monitor the effect.

<Bob> And?

<Leslie> It feels better but the system behaviour charts do not show an improvement.

<Bob> Which charts, specifically?

<Leslie> The BaseLine XmR charts of average length of stay for each week of activity.

<Bob> And you locked the limits when you made the changes?

<Leslie> Yes. And there still were no red flags. So that means our changes have not had a significant effect. But it definitely feels better. Am I deluding myself?

<Bob> I do not believe so. Your subjective assessment is very likely to be accurate. Our Chimp OS 1.0 is very good at some things! I think the issue is with the tool you are using to measure the change.

<Leslie> The XmR chart?  But I thought that was THE tool to use?

<Bob> Like all tools it is designed for a specific purpose.  Are you familiar with the term Type II Error.

<Leslie> Doesn’t that come from research? I seem to remember that is the error we make when we have an under-powered study.  When our sample size is too small to confidently detect the change in the mean that we are looking for.

<Bob> A perfect definition!  The same error can happen when we are doing before and after studies too.  And when it does, we see the pattern you have just described: the process feels better but we do not see any red flags on our BaseLine© chart.

<Leslie> But if our changes only have a small effect how can it feel better?

<Bob> Because some changes have cumulative effects and we omit to measure them.

<Leslie> OMG!  That makes complete sense!  For example, if my bank balance is stable my average income and average expenses are balanced over time. So if I make a small-but-sustained improvement to my expenses, like using lower cost generic label products, then I will see a cumulative benefit over time to the balance, but not the monthly expenses; because the noise swamps the signal on that chart!

<Bob> An excellent analogy!

<Leslie> So the XmR chart is not the tool for this job. And if this is the only tool we have then we risk making a Type II error. Is that correct?

<Bob> Yes. We do still use an XmR chart first though, because if there is a big enough and fast enough shift then the XmR chart will reveal it.  If there is not then we do not give up just yet; we reach for our more sensitive shift detector tool.

<Leslie> Which is?

<Bob> I will leave you to ponder on that question.  You are a trained designer now so it is time to put your designer hat on and first consider the purpose of this new tool, and then create the outline a fit-for-purpose design.

<Leslie> OK, I am on the case!

Grit in the Oyster

Pearl_and_OysterThe word pearl is a metaphor for something rare, beautiful, and valuable.

Pearls are formed inside the shell of certain mollusks as a defense mechanism against a potentially threatening irritant.

The mollusk creates a pearl sac to seal off the irritation.


And so it is with change and improvement.  The growth of precious pearls of improvement wisdom – the ones that develop slowly over time – are triggered by an irritant.

Someone asking an uncomfortable question perhaps, or presenting some information that implies that an uncomfortable question needs to be asked.


About seven years ago a question was asked “Would improving healthcare flow and quality result in lower costs?”

It is a good question because some believe that it would and some believe that it would not.  So an experiment to test the hypothesis was needed.

The Health Foundation stepped up to the challenge and funded a three year project to find the answer. The design of the experiment was simple. Take two oysters and introduce an irritant into them and see if pearls of wisdom appeared.

The two ‘oysters’ were Sheffield Hospital and Warwick Hospital and the irritant was Dr Kate Silvester who is a doctor and manufacturing system engineer and who has a bit-of-a-reputation for asking uncomfortable questions and backing them up with irrefutable information.


Two rare and precious pearls did indeed grow.

In Sheffield, it was proved that by improving the design of their elderly care process they improved the outcome for their frail, elderly patients.  More went back to their own homes and fewer left via the mortuary.  That was the quality and safety improvement. They also showed a shorter length of stay and a reduction in the number of beds needed to store the work in progress.  That was the flow and productivity improvement.

What was interesting to observe was how difficult it was to get these profoundly important findings published.  It appeared that a further irritant had been created for the academic peer review oyster!

The case study was eventually published in Age and Aging 2014; 43: 472-77.

The pearl that grew around this seed is the Sheffield Microsystems Academy.


In Warwick, it was proved that the A&E 4 hour performance could be improved by focussing on improving the design of the processes within the hospital, downstream of A&E.  For example, a redesign of the phlebotomy and laboratory process to ensure that clinical decisions on a ward round are based on todays blood results.

This specific case study was eventually published as well, but by a different path – one specifically designed for sharing improvement case studies – JOIS 2015; 22:1-30

And the pearls of wisdom that developed as a result of irritating many oysters in the Warwick bed are clearly described by Glen Burley, CEO of Warwick Hospital NHS Trust in this recent video.


Getting the results of all these oyster bed experiments published required irritating the Health Foundation oyster … but a pearl grew there too and emerged as the full Health Foundation report which can be downloaded here.


So if you want to grow a fistful of improvement and a bagful of pearls of wisdom … then you will need to introduce a bit of irritation … and Dr Kate Silvester is a proven source of grit for your oyster!

Learning How To Manage …

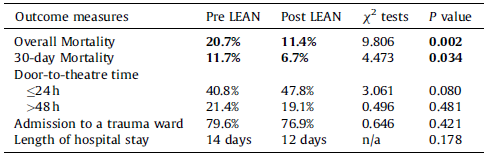
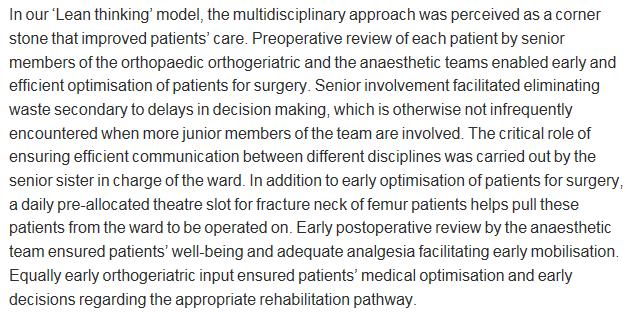
Learning how to manage is as vital as learning how to lead.

by Julian Simcox

Recently I blogged to introduce the re-publication of my 10 year old essay:

“Intervening into Personal and Organisational Systems by Powerfully Leading and Wisely Managing”

The key ideas in that essay were seven fold:

  1. Aiming to develop Leadership separately from Management is likely to confuse anyone targeted by a separatist training programme, the reality being that everyone in organisational life is necessarily and simultaneously both Managing and Leading (M/L) and often desperately trying to integrate them as two very different action-logics.
  2. Managing and Leading are not roles but ways of thinking and acting that need to be intently chosen, according to the particular learning context (one of three) that any Managerial Leader (12) is facing.
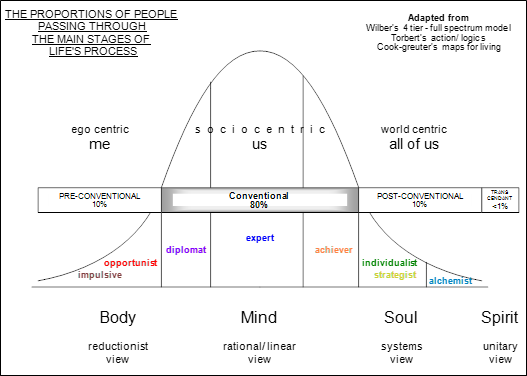
  3. Like in Stephen Covey’s “Maturity Continuum” (8) M/L capability evolves over time (see the diagram below) and makes possible a transformational outcome, if supported in one’s organisation by sufficient and timely post-conventional thinking.
  4. Such an outcome (9,10,11,14,17,19,20,21,23) occurred in Toyota from 1950, making it possible for the organisation to evolve into what Peter Senge (18) calls a “Learning Organisation” – one in which improvement science (4) ensues continually from the bottom-up, within a structure that has evolved top-down.
  5. In Toyota’s case it was W. Edwards Deming who is most credited with having been the catalyst. Jim Collins (6) evidences eleven other examples of an organisational transformation sparked by an individual with a post-conventional world view that transcended a pre-existing conventional one.
  6. Deming talked a lot about ways of thinking – paradigms – that, like Euclidian geometry, make sense in their own world, but not outside it. When speaking with anyone in a client organisation he always aimed at being empathic to a person’s individual frame of reference. He was interested in how individuals make their own common sense because he had learned that it is this that often negatively impacts an individual’s decision-making process and hence their impact on an organisational system that needs to continually learn – a phenomenon he called “tampering”.
  7. The diagram seeks to capture the ways in which paradigms (world views) collectively and sequentially evolve. It combines the research of several practitioners (2,7,15,16) who sought to empirically trace the archetypal evolution of individual sense-making.

JS_Blog_20160307_Fig1

In 2013, Don Berwick (5) recommended to the UK government that, in order to prioritise quality and safety, the National Health Service must become a Deming-style learning organisation. The NHS however is not one single organisation, it is a thousand organisations – both privately and publically owned.  Yet if structured with “Liberating Disciplines” (22) via appropriately set central standards (e.g. tools that prompt thinking that is scientifically methodical), each can be invited as a single organisation to transform themselves into a body with learning its core value. Berwick seems to appreciate that out of the apparently sufficient conventional thinking, enough post-conventional managerial leadership will then have a chance to take root, and in time bloom.

The purpose of this blog is to introduce a second essay:

“Managerial Leadership: Five action-logics viewed via two developmental lenses.”

In the first essay I used P-D-S-A as the integrative link between Managing and Leading – offering a total of just three learning contexts, but this always felt a little over-simplistic and in 2005 when coaching my daughter Josie – then in her sandwich year as an undergraduate trainee in the hospitality industry – I was persuaded by her to further sub-divide the two M/L modes – replacing two with four:

  1. maintaining
  2. continually improving
  3. innovating
  4. transforming.

Applying this new 4 action-logic model, Josie succeeded in transforming the fortunes of her hotel – winning a national award for her efforts – and this made me wonder if she might be on to something important?

I decided to use the new version of the model to explore what it would look like through first a “conventional” lens, and then second a “post-conventional” lens – illustrating the kinds of paradigm shifts that one might see in action when inside a learning organisation, in particular the way that accountabilities for performance are handled.

It is hard to describe a post-conventional way of seeing things to someone who developmentally has discovered only the conventional way – about 85% of adults. It is as if the instructions about how to get out of the box are on the outside. It is hoped that this essay may help some individuals unlock this conundrum. In a learning organisation for example it turns out that real-time data and feedback are essential for continually prompting individuals and organisations to rapidly evolve a new way of seeing.

BaseLine® for example is a tool that has been designed with this in mind. It allows conventional organisations and individuals, even those considering themselves relatively innumerate, to develop post-conventional habits; simply by using the time-series data that in many cases is already being collected – albeit usually for reasons of top-down accountability rather than methodical improvement. In this way, healthy developmental conversation gets sparked – and at all organisational levels: bottom, middle and top.

It also turns out that Continuous Improvement when seen though the second lens is not the same as Continual Improvement (mode 2) – and this is another one of the paradigm shifts that in the essay gets explained. Here is the model as it then appears:

JS_Blog_20160307_Fig2

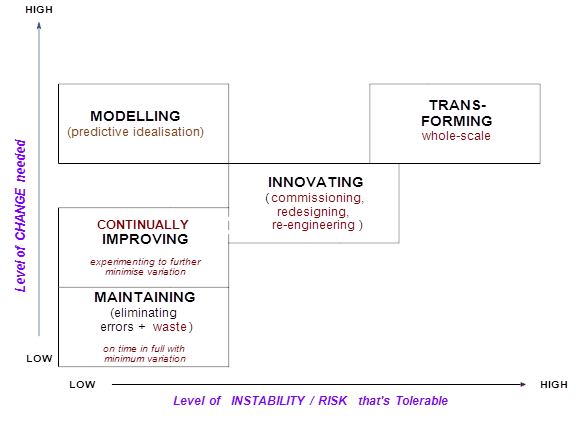
Note that a fifth action-logic mode, modelling, is also now included. This emerged out of conversations I was having with Simon Dodds when writing the final draft in 2011. The essence of this mode is embodied in a phrase coined by the late Russell Ackoff – “idealized design” (1) – using modern computing technology to facilitate transformative change within tolerable levels of risk.

People often readily admit to spending much of their life in mode 1 (maintaining), whilst really preferring to be in mode 3 (innovating) – even admitting to seeing mode 1 as relatively boring, or at best as overly bureaucratic. Such individuals are especially prone to tampering, and may even shun regimes in which they feel overly controlled. What the post-conventional worldview offers however is not the prospect of being controlled, but the prospect of being in control – whilst simultaneously letting go – a paradox that is not easy to get unless developmentally ready – hence the 2005 essay. This goes for the tools too – especially when being deployed with the full cultural support that can flow from an organisation imbued with sufficient post-conventional design.

If the organisation can be designed to sufficiently support the right people to take control of each critical process or sub-system, who at the right level (usually the lowest point in the hierarchy that accountability may be accepted), may feel safely equipped to make sound decisions, genuine empowerment then becomes possible. Essentially, people then feel safe enough to self-empower and take charge of their system.

Toyota are an exemplar “learning organisation” – actually a system of organisations that work so harmoniously as a whole that by continually adapting to its changing environment, risk can be smoothly managed. Their preoccupation from bottom to top is understanding in real time what is changing so that changes (to the system) can then be proactively and wisely made. Each employee at each organisational level is educated to both manage and lead.

This approach has enabled them to grow to become the largest volume car maker in the world – and largely via organic growth alone. They have achieved this simply by constantly delivering what the customer wants with low variation (hence high reliability) and by continually studying that variation to uncover the real causes of problems. Performance is continually assessed over time and seen largely as pertaining to the system rather than being down to any one individual. Job hoppers – who though charismatic may also be practiced at being able to avoid having to live with the longer-term consequences of their actions – are not appointed to key roles.

Some will read the essay and say to themselves that little of this applies to me or my organisation – “we’re not Toyota, we’re not a private company, and we’re not even in manufacturing”. That however is likely to be a conventional view. The post-conventional principles described in the essay apply as much to service industries as to the public sector – both commissioners and providers – some of whom would intentionally evolve a post-conventional culture if given the space to do so.

At the very least I hope to have succeeded in convincing you, even if you don’t buy in to the notion of a Berwick-style learning system, that schooling people in management or leadership separately, or without a workable definition of each, is likely to be both cruel to the individual and to court dysfunction in the organisation.

References

  1. Ackoff R. Why so few organisations adopt systems thinking – 2007
  2. Beck D.E & Cowan C.C. – Spiral Dynamics – Mastering Values, Leadership, and Change – 1996
  3. Berwick D. – The Science of Improvement – 2008 : http://www.allhealth.org/BriefingMaterials/JAMA-Berwick-1151.pdf
  4. Berwick D. – The Science of Improvement – 2008 : http://www.allhealth.org/BriefingMaterials/JAMA-Berwick-1151.pdf
  5. Berwick Donald M. – Berwick Review into patient safety – 2013
  6. Collins J.C. – Level 5 Leadership: The triumph of Humility and Fierce Resolve – HBR Jan 2001
  7. Cook-Greuter. S. – Maps for living: ego-Development Stages Symbiosis to Conscious Universal Embeddedness – 1990
  8. Covey. S.R. – The 7 habits of Highly Effective People – 1989   (ISBN 0613191455)
  9. Delavigne K.T & Robertson J. D. – Deming’s profound changes – 1994
  10. Deming W. Edwards – Out of the Crisis – 1986 (ISBN 0-911379-01-0)
  11. Deming W.Edwards – The New Economics – 1993 (ISBN 0-911379-07-X) First edition
  12. Jaques. E. – Requisite Organisation: A Total System for Effective Managerial Organisation and Managerial Leadership for the 21st Century 1998 (ISBN 1886436045)
  13. Kotter. J. P. – A Force for Change: How Leadership Differs from Management – 1990
  14. Liker J.K & Meier D. – The Toyota Way Fieldbook – 2006
  15. Rooke D and Torbert W.R. – Organisational Transformation as a function of CEO’s Development Stage 1998 (Organisation Development Journal, Vol. 6.1)
  16. Rooke D and Torbert W.R. – Seven Transformations of Leadership – Harvard Business Review April 2005
  17. Scholtes Peter R. The Leader’s Handbook: Making Things Happen, Getting Things Done – 1998
  18. Senge. P. M. – The Fifth Discipline 1990 ISBN 10 – 0385260946
  19. Spear. S and Bowen H. K- Decoding the DNA of the Toyota Production System – Harvard Business Review Sept/Oct 1999
  20. Spear. S. – Learning to Lead at Toyota – Harvard Business Review – May 2004
  21. Takeuchi H, Osono E, Shimizu N. The contradictions that drive Toyota’s success. Harvard Business Review: June 2008
  22. Torbert W.R. & Associates – Action Inquiry – The secret of timely and transforming leadership – 2004
  23. Wheeler Donald J. – Advanced Topics in Statistical Process Control – the power of Shewhart Charts – 1995


Raising Awareness

SaveTheNHSGameThe first step in the process of improvement is raising awareness, and this has to be done carefully.

Most of us spend most of our time in a mental state called blissful ignorance.  We are happily unaware of the problems, and of their solutions.

Some of us spend some of our time in a different mental state called denial.

And we enter that from yet another mental state called painful awareness.

By raising awareness we are deliberately nudging ourselves, and others, out of our comfort zones.

But suddenly moving from blissful ignorance to painful awareness is not a comfortable transition. It feels like a shock. We feel confused. We feel vulnerable. We feel frightened. And we have a choice: freeze, flee or fight.

Freeze is shock. We feel paralysed by the mismatch between rhetoric and reality.

Flee is denial.  We run away from a new and uncomfortable reality.

Fight is anger. Directed first at others (blame) and then at ourselves (guilt).

It is this anger-passion that we must learn to channel and focus as determination to listen, learn and then lead.


The picture is of a recent awareness-raising event; it happened this week.

The audience is a group of NHS staff from across the depth and breadth of a health and social care system.

On the screen is the ‘Save the NHS Game’.  It is an interactive, dynamic flow simulation of a whole health care system; and its purpose is educational.  It is designed to illustrate the complex and counter-intuitive flow behaviour of a system of interdependent parts: primary care, an acute hospital, intermediate care, residential care, and so on.

We all became aware of a lot of unfamiliar concepts in a short space of time!

We all learned that a flow system can flip from calm to chaotic very quickly.

We all learned that a small change in one part of a system of interdependent parts can have a big effect in another part – either harmful or beneficial and often both.

We all learned that there is often a long time-lag between the change and the effect.

We all learned that we cannot reverse the effect just by reversing the change.

And we all learned that this high sensitivity to small changes is the result of the design of our system; i.e. our design.


Learning all that in one go was a bit of a shock!  Especially the part where we realised that we had, unintentionally, created near perfect conditions for chaos to emerge. Oh dear!

Denial felt like a very reasonable option; as did blame and guilt.

What emerged was a collective sense of determination.  “Let’s Do It!” captured the mood.


puzzle_lightbulb_build_PA_150_wht_4587The second step in the process of improvement is to show the door to the next phase of learning; the phase called ‘know how’.

This requires demonstrating that there is an another way out of the zone of painful awareness.  An alternative to denial.

This is where how-to-diagnose-and-correct-the-design-flaws needs to be illustrated. A step-at-a-time.

And when that happens it feels like a light bulb has been switched on.  What before was obscure and confusing suddenly becomes clear and understandable; and we say ‘Ah ha!’


So, if we deliberately raise awareness about a problem then, as leaders of change and improvement, we also have the responsibility to raise awareness about feasible solutions.


Because only then are we able to ask “Would we like to learn how to do this ourselves!”

And ‘Yes, please’ is what 68% of the people said after attending the awareness raising event.  Only 15% said ‘No, thank you’ and only 17% abstained.

Raising awareness is the first step to improvement.
Choosing the path out of the pain towards knowledge is the second.
And taking the first step on that path is the third.