A New Decade of Hope

At the end of the decade it is the time to reflect on what has happened in the past before planning for the future.  As always, the hottest topic in health care is the status of the emergency care services, and we have the data – it is public.

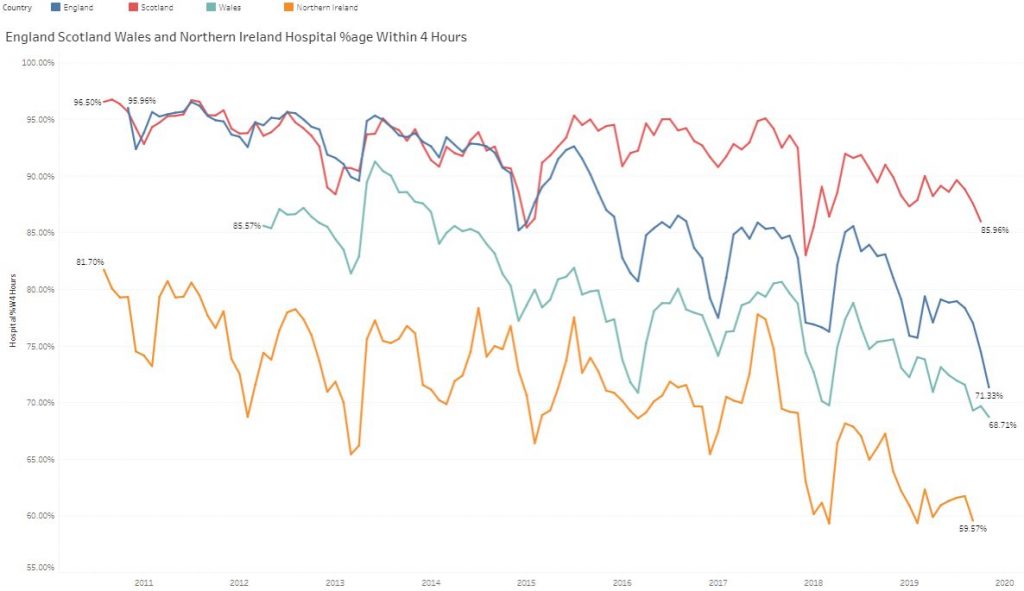
This shows the last 9 years of aggregate, monthly data for Scotland (red), England (blue), Wales (teal) and N.Ireland (orange).  It does not take a data scientist and a supercomputer to interpret – there is a progressive system-wide progressive deterioration year-on-year.  The winter dips are obvious and the worst of these affect all four countries indicating a systemic cause … the severity of the winter weather/illness cycle -i.e. the Flu Season.

What this chart also says is that all the effort and money being expended in winter planning is not working well enough – and the nagging question is “Why not?”

Many claim that it is the predicted demographic “time bomb” … but if it is predicted then how come it has not been mitigated?

Many claim that it is a growing funding gap … but most NHS funding is spent on staff and  and training nurses, doctors and allied health professionals (AHPs) takes time.  Again, a predicted eventuality that has not been mitigated.

This looming crisis in a lack of heath care workers is a global health challenge … and is described by Mark Britnell in “Human – Solving the global workforce crisis in healthcare“.

Mark was the CEO of University Hospitals Birmingham from 2000 and has worked for KPMG since 2009 in a global health role so is well placed to present a strategic overview.


But, health care workers deliver care to patients – one at a time.  They are not responsible for designing the system of health care delivery; or ensuring all the pieces of that vast jigsaw link up and work in a synchronised way; or for the long term planning needed to mitigate the predictable effects of demographic drift and technology advances.

Who is responsible for that challenge and are they adequately trained to do it?

The evidence would appear to suggest that there is a gap that either no one has noticed or that no one is prepared to discuss.  An Undiscussable?


The global gap in the healthcare workforce is predicted to be about 20% by 2030.  That is a big gap to fill because with the NHS workforce of 1.3 million people – that implies training 260,000 new staff of all types in the next 10 years, in addition to replacing those that leave.

Assuming the processes and productivity stay as they are now.

So, perhaps there is a parallel approach, one that works more quickly and a lower cost.


When current health care processes are examined through a flow engineering lens they are found to be poorly designed. They are both ineffective (do not reliably deliver the intended outcome) and inefficient (waste a lot of resources in delivering any outcome).  Further examination reveals that the processes have never been designed … they have evolved.

And just because something is described as current practice does not prove that it is good design.

An expected symptom of a poorly designed process is a combination of chronic queues, delays, chaos, reactive fire-fighting and burnout.  And the assumed cause is often lack of resources because when extra resource is added the queues and chaos subsides, for a while.

But, if the unintentional poor design of the process is addressed then a sequence of surprising things can happen. The chaos evaporates immediately without any extra resources. A feeling of calm is restored and the disruptive fire-fighting stops. The health care workers are able to focus on what they do best and pride-in-work is restored. Patient experience improves and staff feel that feedback and become more motivated. The complaining abates, sickness and absence falls, funded-but-hard-to-recruit-to posts are refilled and there are more hands on the handle of a more efficient/effective/productive pump.  The chronic queues and delays start to melt away – as if by magic.

And if that all sounds totally impossible then here are a couple of recent, real-world case studies written by different teams in different cities in different parts of the UK.  One from cancer care and one from complex diabetic care.

They confirm that this chaos-to-calm transformation is possible.

So, is there a common thread that links these two examples?

Yes, there is, and once again the spotlight is shone on the Undiscussable Gap … the fact that the NHS does not appear to have the embedded capability to redesign itself.

There is a hidden workforce gap that none of the existing programmes will address – because it is not a lack of health care workers – it is a lack of appropriately trained health care manager-designers.


The Undiscussable Elephant Is In The Room … the Undiscussable Emperor Has No Clothes.

And if history teaches us anything, Necessity is the Mother of Innovation and the chart at the top of the page shows starkly that there is an Growing Urgent Necessity.

And if two embedded teams can learn this magic trick of flipping chaos into calm at no cost, then perhaps others can too?

Welcome to the New Decade of Hope and Health Care Systems Engineering.

What Is In It For Me?

One of the questions we all ask ourselves, perhaps unconsciously, when we are considering change is: “What is in it for me?

And if we do not get a convincing enough answer, quickly enough, we move on.

Effective sales people know this, and anyone needing to engage and influence others needs to as well.


One approach is to ask the same questions as the person we seek to influence are asking themselves, perhaps unconsciously.

So if you have an interest in healthcare improvement … see if these questions resonate with you.

Value, Verify and Validate

thinker_figure_unsolve_puzzle_150_wht_18309Many of the challenges that we face in delivering effective and affordable health care do not have well understood and generally accepted solutions.

If they did there would be no discussion or debate about what to do and the results would speak for themselves.

This lack of understanding is leading us to try to solve a complicated system design challenge in our heads.  Intuitively.

And trying to do it this way is fraught with frustration and risk because our intuition tricks us. It was this sort of challenge that led Professor Rubik to invent his famous 3D Magic Cube puzzle.

It is difficult enough to learn how to solve the Magic Cube puzzle by trial and error; it is even more difficult to attempt to do it inside our heads! Intuitively.


And we know the Rubik Cube puzzle is solvable, so all we need are some techniques, tools and training to improve our Rubik Cube solving capability.  We can all learn how to do it.


Returning to the challenge of safe and affordable health care, and to the specific problem of unscheduled care, A&E targets, delayed transfers of care (DTOC), finance, fragmentation and chronic frustration.

This is a systems engineering challenge so we need some systems engineering techniques, tools and training before attempting it.  Not after failing repeatedly.

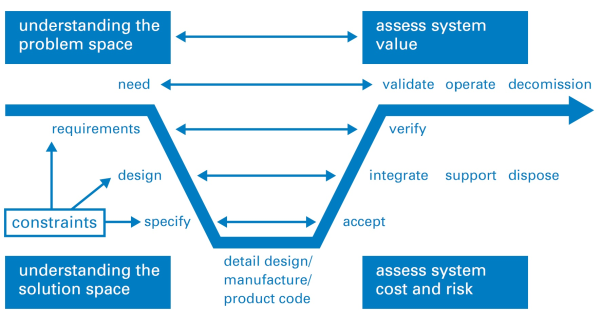
se_vee_diagram

One technique that a systems engineer will use is called a Vee Diagram such as the one shown above.  It shows the sequence of steps in the generic problem solving process and it has the same sequence that we use in medicine for solving problems that patients present to us …

Diagnose, Design and Deliver

which is also known as …

Study, Plan, Do.


Notice that there are three words in the diagram that start with the letter V … value, verify and validate.  These are probably the three most important words in the vocabulary of a systems engineer.


One tool that a systems engineer always uses is a model of the system under consideration.

Models come in many forms from conceptual to physical and are used in two main ways:

  1. To assist the understanding of the past (diagnosis)
  2. To predict the behaviour in the future (prognosis)

And the process of creating a system model, the sequence of steps, is shown in the Vee Diagram.  The systems engineer’s objective is a validated model that can be trusted to make good-enough predictions; ones that support making wiser decisions of which design options to implement, and which not to.


So if a systems engineer presented us with a conceptual model that is intended to assist our understanding, then we will require some evidence that all stages of the Vee Diagram process have been completed.  Evidence that provides assurance that the model predictions can be trusted.  And the scope over which they can be trusted.


Last month a report was published by the Nuffield Trust that is entitled “Understanding patient flow in hospitals”  and it asserts that traffic flow on a motorway is a valid conceptual model of patient flow through a hospital.  Here is a direct quote from the second paragraph in the Executive Summary:

nuffield_report_01
Unfortunately, no evidence is provided in the report to support the validity of the statement and that omission should ring an alarm bell.

The observation that “the hospitals with the least free space struggle the most” is not a validation of the conceptual model.  Validation requires a concrete experiment.


To illustrate why observation is not validation let us consider a scenario where I have a headache and I take a paracetamol and my headache goes away.  I now have some evidence that shows a temporal association between what I did (take paracetamol) and what I got (a reduction in head pain).

But this is not a valid experiment because I have not considered the other seven possible combinations of headache before (Y/N), paracetamol (Y/N) and headache after (Y/N).

An association cannot be used to prove causation; not even a temporal association.

When I do not understand the cause, and I am without evidence from a well-designed experiment, then I might be tempted to intuitively jump to the (invalid) conclusion that “headaches are caused by lack of paracetamol!” and if untested this invalid judgement may persist and even become a belief.


Understanding causality requires an approach called counterfactual analysis; otherwise known as “What if?” And we can start that process with a thought experiment using our rhetorical model.  But we must remember that we must always validate the outcome with a real experiment. That is how good science works.

A famous thought experiment was conducted by Albert Einstein when he asked the question “If I were sitting on a light beam and moving at the speed of light what would I see?” This question led him to the Theory of Relativity which completely changed the way we now think about space and time.  Einstein’s model has been repeatedly validated by careful experiment, and has allowed engineers to design and deliver valuable tools such as the Global Positioning System which uses relativity theory to achieve high positional precision and accuracy.


So let us conduct a thought experiment to explore the ‘faster movement requires more space‘ statement in the case of patient flow in a hospital.

First, we need to define what we mean by the words we are using.

The phrase ‘faster movement’ is ambiguous.  Does it mean higher flow (more patients per day being admitted and discharged) or does it mean shorter length of stage (the interval between the admission and discharge events for individual patients)?

The phrase ‘more space’ is also ambiguous. In a hospital that implies physical space i.e. floor-space that may be occupied by corridors, chairs, cubicles, trolleys, and beds.  So are we actually referring to flow-space or storage-space?

What we have in this over-simplified statement is the conflation of two concepts: flow-capacity and space-capacity. They are different things. They have different units. And the result of conflating them is meaningless and confusing.


However, our stated goal is to improve understanding so let us consider one combination, and let us be careful to be more precise with our terminology, “higher flow always requires more beds“. Does it? Can we disprove this assertion with an example where higher flow required less beds (i.e. space-capacity)?

The relationship between flow and space-capacity is well understood.

The starting point is Little’s Law which was proven mathematically in 1961 by J.D.C. Little and it states:

Average work in progress = Average lead time  X  Average flow.

In the hospital context, work in progress is the number of occupied beds, lead time is the length of stay and flow is admissions or discharges per time interval (which must be the same on average over a long period of time).

(NB. Engineers are rather pedantic about units so let us check that this makes sense: the unit of WIP is ‘patients’, the unit of lead time is ‘days’, and the unit of flow is ‘patients per day’ so ‘patients’ = ‘days’ * ‘patients / day’. Correct. Verified. Tick.)

So, is there a situation where flow can increase and WIP can decrease? Yes. When lead time decreases. Little’s Law says that is possible. We have disproved the assertion.


Let us take the other interpretation of higher flow as shorter length of stay: i.e. shorter length of stay always requires more beds.  Is this correct? No. If flow remains the same then Little’s Law states that we will require fewer beds. This assertion is disproved as well.

And we need to remember that Little’s Law is proven to be valid for averages, does that shed any light on the source of our confusion? Could the assertion about flow and beds actually be about the variation in flow over time and not about the average flow?


And this is also well understood. The original work on it was done almost exactly 100 years ago by Agner Krarup Erlang and the problem he looked at was the quality of customer service of the early telephone exchanges. Specifically, how likely was the caller to get the “all lines are busy, please try later” response.

What Erlang showed was there there is a mathematical relationship between the number of calls being made (the demand), the probability of a call being connected first time (the service quality) and the number of telephone circuits and switchboard operators available (the service cost).


So it appears that we already have a validated mathematical model that links flow, quality and cost that we might use if we substitute ‘patients’ for ‘calls’, ‘beds’ for ‘telephone circuits’, and ‘being connected’ for ‘being admitted’.

And this topic of patient flow, A&E performance and Erlang queues has been explored already … here.

So a telephone exchange is a more valid model of a hospital than a motorway.

We are now making progress in deepening our understanding.


The use of an invalid, untested, conceptual model is sloppy systems engineering.

So if the engineering is sloppy we would be unwise to fully trust the conclusions.

And I share this feedback in the spirit of black box thinking because I believe that there are some valuable lessons to be learned here – by us all.


To vote for this topic please click here.
To subscribe to the blog newsletter please click here.
To email the author please click here.

Jiggling

hurry_with_the_SFQP_kit[Dring] Bob’s laptop signaled the arrival of Leslie for their regular ISP remote coaching session.

<Bob> Hi Leslie. Thanks for emailing me with a long list of things to choose from. It looks like you have been having some challenging conversations.

<Leslie> Hi Bob. Yes indeed! The deepening gloom and the last few blog topics seem to be polarising opinion. Some are claiming it is all hopeless and others, perhaps out of desperation, are trying the FISH stuff for themselves and discovering that it works.  The ‘What Ifs’ are engaged in war of words with the ‘Yes Buts’.

<Bob> I like your metaphor! Where would you like to start on the long list of topics?

<Leslie> That is my problem. I do not know where to start. They all look equally important.

<Bob> So, first we need a way to prioritise the topics to get the horse-before-the-cart.

<Leslie> Sounds like a good plan to me!

<Bob> One of the problems with the traditional improvement approaches is that they seem to start at the most difficult point. They focus on ‘quality’ first – and to be fair that has been the mantra from the gurus like W.E.Deming. ‘Quality Improvement’ is the Holy Grail.

<Leslie>But quality IS important … are you saying they are wrong?

<Bob> Not at all. I am saying that it is not the place to start … it is actually the third step.

<Leslie>So what is the first step?

<Bob> Safety. Eliminating avoidable harm. Primum Non Nocere. The NoNos. The Never Events. The stuff that generates the most fear for everyone. The fear of failure.

<Leslie> You mean having a service that we can trust not to harm us unnecessarily?

<Bob> Yes. It is not a good idea to make an unsafe design more efficient – it will deliver even more cumulative harm!

<Leslie> OK. That makes perfect sense to me. So how do we do that?

<Bob> It does not actually matter.  Well-designed and thoroughly field-tested checklists have been proven to be very effective in the ‘ultra-safe’ industries like aerospace and nuclear.

<Leslie> OK. Something like the WHO Safe Surgery Checklist?

<Bob> Yes, that is a good example – and it is well worth reading Atul Gawande’s book about how that happened – “The Checklist Manifesto“.  Gawande is a surgeon who had published a lot on improvement and even so was quite skeptical that something as simple as a checklist could possibly work in the complex world of surgery. In his book he describes a number of personal ‘Ah Ha!’ moments that illustrate a phenomenon that I call Jiggling.

<Leslie> OK. I have made a note to read Checklist Manifesto and I am curious to learn more about Jiggling – but can we stick to the point? Does quality come after safety?

<Bob> Yes, but not immediately after. As I said, Quality is the third step.

<Leslie> So what is the second one?

<Bob> Flow.

There was a long pause – and just as Bob was about to check that the connection had not been lost – Leslie spoke.

<Leslie> But none of the Improvement Schools teach basic flow science.  They all focus on quality, waste and variation!

<Bob> I know. And attempting to improve quality before improving flow is like papering the walls before doing the plastering.  Quality cannot grow in a chaotic context. The flow must be smooth before that. And the fear of harm must be removed first.

<Leslie> So the ‘Improving Quality through Leadership‘ bandwagon that everyone is jumping on will not work?

<Bob> Well that depends on what the ‘Leaders’ are doing. If they are leading the way to learning how to design-for-safety and then design-for-flow then the bandwagon might be a wise choice. If they are only facilitating collaborative agreement and group-think then they may be making an unsafe and ineffective system more efficient which will steer it over the edge into faster decline.

<Leslie>So, if we can stabilize safety using checklists do we focus on flow next?

<Bob>Yup.

<Leslie> OK. That makes a lot of sense to me. So what is Jiggling?

<Bob> This is Jiggling. This conversation.

<Leslie> Ah, I see. I am jiggling my understanding through a series of ‘nudges’ from you.

<Bob>Yes. And when the learning cogs are a bit rusty, some Improvement Science Oil and a bit of Jiggling is more effective and much safer than whacking the caveman wetware with a big emotional hammer.

<Leslie>Well the conversation has certainly jiggled Safety-Flow-Quality-and-Productivity into a sensible order for me. That has helped a lot. I will sort my to-do list into that order and start at the beginning. Let me see. I have a plan for safety, now I can focus on flow. Here is my top flow niggle. How do I design the resource capacity I need to ensure the flow is smooth and the waiting times are short enough to avoid ‘persecution’ by the Target Time Police?

<Bob> An excellent question! I will send you the first ISP Brainteaser that will nudge us towards an answer to that question.

<Leslie> I am ready and waiting to have my brain-teased and my niggles-nudged!

Creep-Crack-Crunch

The current crisis of confidence in the NHS has all the hallmarks of a classic system behaviour called creep-crack-crunch.

The first obvious crunch may feel like a sudden shock but it is usually not a complete surprise and it is actually one of a series of cracks that are leading up to a BIG CRUNCH. These cracks are an early warning sign of pressure building up in parts of the system and causing localised failures. These cracks weaken the whole system. The underlying cause is called creep.

SanFrancisco_PostEarthquake

Earthquakes are a perfect example of this phenomemon. Geological time scales are measured in thousands of years and we now know that the surface of the earth is a dynamic structure with vast contient-sized plates of solid rock floating on a liquid core of molten magma. Over millions of years the continents have moved huge distances and the world we see today on our satellite images is just a single frame in a multi-billion year geological video.  That is the geological creep bit. The cracks first appear at the edges of these tectonic plates where they smash into each other, grind past each other or are pulled apart from each other.  The geological hot-spots are marked out on our global map by lofty mountain ranges, fissured earthquake zones, and deep mid-ocean trenches. And we know that when a geological crunch arrives it happens in a blink of the geological eye.

The panorama above shows the devastation of San Francisco caused by the 1906 earthquake. San Francisco is built on the San Andreas Fault – the junction between the Pacific plate and the North American plate. The dramatic volcanic eruption in Iceland in 2010 came and went in a matter of weeks but the irreversible disruption it caused for global air traffic will be felt for years. The undersea earthquakes that caused the devastating tsunamis in 2006 and 2011 lasted only a few minutes; the deadly shock waves crossed an ocean in a matter of hours; and when they arrived the silent killer wiped out whole shoreside communities in seconds. Tens of thousands of lives were lost and the social after-shocks of that geological-crunch will be felt for decades.

These are natural disasters. We have little or no influence over them. Human-engineered disasters are a different matter – and they are just as deadly.

The NHS is an example. We are all painfully aware of the recent crisis of confidence triggered by the Francis Report. Many could see the cracks appearing and tried to blow their warning whistles but with little effect – they were silenced with legal gagging clauses and the opening cracks were papered over. It was only after the crunch that we finally acknowledged what we already knew and we started to search for the creep. Remorse and revenge does not bring back those who have been lost.  We need to focus on the future and not just point at the past.

UK_PopulationPyramid_2013Socio-economic systems evolve at a pace that is measured in years. So when a social crunch happens it is necessary to look back several decades for the tell-tale symptoms of creep and the early signs of cracks appearing.

Two objective measures of a socio-economic system are population and expenditure.

Population is people-in-progress; and national expenditure is the flow of the cash required to keep the people-in-progress watered, fed, clothed, housed, healthy and occupied.

The diagram above is called a population pyramid and it shows the distribution by gender and age of the UK population in 2013. The wobbles tell a story. It does rather look like the profile of a bushy-eyebrowed, big-nosed, pointy-chinned old couple standing back-to-back and maybe there is a hidden message for us there?

The “eyebrow” between ages 67 and 62 is the increase in births that happened 62 to 67 years ago: betwee 1946 and 1951. The post WWII baby boom.  The “nose” of 42-52 year olds are the “children of the 60’s” which was a period of rapid economic growth and new optimism. The “upper lip” at 32-42 correlates with the 1970’s that was a period of stagnant growth,  high inflation, strikes, civil unrest and the dark threat of global thermonuclear war. This “stagflation” is now believed to have been triggered by political meddling in the Middle-East that led to the 1974 OPEC oil crisis and culminated in the “winter of discontent” in 1979.  The “chin” signals there was another population expansion in the 1980s when optimism returned (SALT-II was signed in 1979) and the economy was growing again. Then the “neck” contraction in the 1990’s after the 1987 Black Monday global stock market crash.  Perhaps the new optimism of the Third Millenium led to the “chest” expansion but the financial crisis that followed the sub-prime bubble to burst in 2008 has yet to show its impact on the population chart. This static chart only tells part of the story – the animated chart reveals a significant secondary expansion of the 20-30 year old age group over the last decade. This cannot have been caused by births and is evidence of immigration of a large number of young couples – probably from the expanding Europe Union.

If this “yo-yo” population pattern is repeated then the current economic downturn will be followed by a contraction at the birth end of the spectrum and possibly also net emigration. And that is a big worry because each population wave takes a 100 years to propagate through the system. The most economically productive population – the  20-60 year olds  – are the ones who pay the care bills for the rest. So having a population curve with lots of wobbles in it causes long term socio-economic instability.

Using this big-picture long-timescale perspective; evidence of an NHS safety and quality crunch; silenced voices of cracks being papered-over; let us look for the historical evidence of the creep.

Nowadays the data we need is literally at our fingertips – and there is a vast ocean of it to swim around in – and to drown in if we are not careful.  The Office of National Statistics (ONS) is a rich mine of UK socioeconomic data – it is the source of the histogram above.  The trick is to find the nuggets of knowledge in the haystack of facts and then to convert the tables of numbers into something that is a bit more digestible and meaningful. This is what Russ Ackoff descibes as the difference between Data and Information. The data-to-information conversion needs context.

Rule #1: Data without context is meaningless – and is at best worthless and at worse is dangerous.
boxes_connected_PA_150_wht_2762With respect to the NHS there is a Minotaur’s Labyrinth of data warehouses – it is fragmented but it is out there – in cyberspace. The Department of Health publishes some on public sites but it is a bit thin on context so it can be difficult to extract the meaning.

Relying on our memories to provide the necessary context is fraught with problems. Memories are subject to a whole range of distortions, deletions, denials and delusions.  The NHS has been in existence since 1948 and there are not many people who can personally remember the whole story with objective clarity.  Fortunately cyberspace again provides some of what we need and with a few minutes of surfing we can discover something like a website that chronicles the history of the NHS in decades from its creation in 1948 – http://www.nhshistory.net/ – created and maintained by one person and a goldmine of valuable context. The decade that is of particular interest is 1998-2007 – Chapter 6

With just some data and some context it is possible to pull together the outline of the bigger picture of the decade that led up to the Mid Staffordshire healthcare quality crunch.

We will look at this as a NHS system evolving over time within its broader UK context. Here is the time-series chart of the population of England – the source of the demand on the NHS.
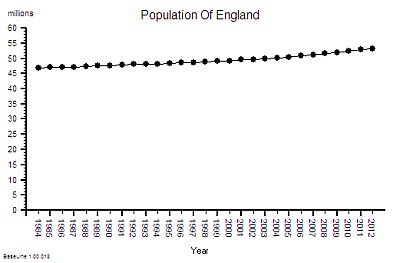
Population_of_England_1984-2010This shows a significant and steady increase in population – 12% overall between 1984 an 2012.

This aggregate hides a 9% increase in the under 65 population and 29% growth in the over 65 age group.

This is hard evidence of demographic creep – a ticking health and social care time bomb. And the curve is getting steeper. The pressure is building.

The next bit of the map we need is a measure of the flow through hospitals – the activity – and this data is available as the annual HES (Hospital Episodes Statistics) reports.  The full reports are hundreds of pages of fine detail but the headline summaries contain enough for our present purpose.

NHS_HES_Admissions_1997-2011

The time- series chart shows a steady increase in hospital admissions. Drilling into the summaries revealed that just over a third are emergency admissions and the rest are planned or maternity.

In the decade from 1998 to 2008 there was a 25% increase in hospital activity. This means more work for someone – but how much more and who for?

But does it imply more NHS beds?

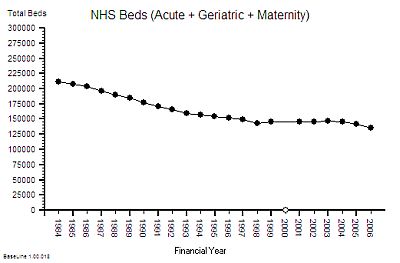
Beds require wards, buildings and infrastructure – but it is the staff that deliver the health care. The bed is just a means of storage.  One measure of capacity and cost is the number of staffed beds available to be filled.  But this like measuring the number of spaces in a car park – it does not say much about flow – it is a just measure of maximum possible work in progress – the available space to hold the queue of patients who are somewhere between admission and discharge.

Here is the time series chart of the number of NHS beds from 1984 to 2006. The was a big fall in the number of beds in the decade after 1984 [Why was that?]
NHS_Beds_1984-2006

Between 1997 and 2007 there was about a 10% fall in the number of beds. The NHS patient warehouse was getting smaller.

But the activity – the flow – grew by 25% over the same time period: so the Laws Of Physics say that the flow must have been faster.

The average length of stay must have been falling.

This insight has another implication – fewer beds must mean smaller hospitals and lower costs – yes?  After all everyone seems to equate beds-to-cost; more-beds-cost-more less-beds-cost-less. It sounds reasonable. But higher flow means more demand and more workload so that would require more staff – and that means higher costs. So which is it? Less, the same or more cost?
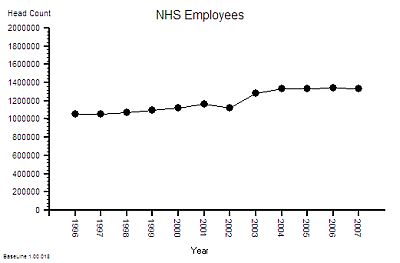
NHS_Employees_1996_2007The published data says that staff headcount  went up by 25% – which correlates with the increase in activity. That makes sense.

And it looks like it “jumped” up in 2003 so something must have triggered that. More cash pumped into the system perhaps? Was that the effect of the Wanless Report?

But what type of staff? Doctors? Nurses? Admin and Clerical? Managers?  The European Working Time Directive (EWTD) forced junior doctors hours down and prompted an expansion of consultants to take on the displaced service work. There was also a gradual move towards specialisation and multi-disciplinary teams. What impact would that have on cost? Higher most likely. The system is getting more complex.

Of course not all costs have the same impact on the system. About 4% of staff are classified as “management” and it is this group that are responsible for strategic and tactical planning. Managers plan the work – workers work the plan.  The cost and efficiency of the management component of the system is not as useful a metric as the effectiveness of its collective decision making. Unfortuately there does not appear to be any published data on management decision making qualty and effectiveness. So we cannot estimate cost-effectiveness. Perhaps that is because it is not as easy to measure effectiveness as it is to count admissions, discharges, head counts, costs and deaths. Some things that count cannot easily be counted. The 4% number is also meaningless. The human head represents about 4% of the bodyweight of an adult person – and we all know that it is not the size of our heads that is important it is the effectiveness of the decisions that it makes which really counts!  Effectiveness, efficiency and costs are not the same thing.

Back to the story. The number of beds went down by 10% and number of staff went up by 25% which means that the staff-per-bed ratio went up by nearly 40%.  Does this mean that each bed has become 25% more productive or 40% more productive or less productive? [What exactly do we mean by “productivity”?]

To answer that we need to know what the beds produced – the discharges from hospital and not just the total number, we need the “last discharges” that signal the end of an episode of hospital care.
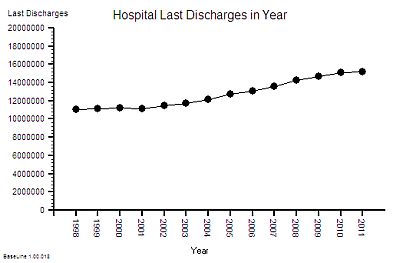
NHS_LastDischarges_1998-2011The time-series chart of last-discharges shows the same pattern as the admissions: as we would expect.

This output has two components – patients who leave alive and those who do not.

So what happened to the number of deaths per year over this period of time?

That data is also published annually in the Hospital Episode Statistics (HES) summaries.

This is what it shows ….
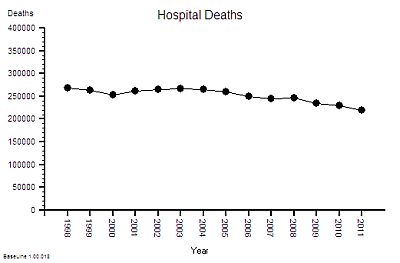
NHS_Absolute_Deaths_1998-2011The absolute hospital mortality is reducing over time – but not steadily. It went up and down between 2000 and 2005 – and has continued on a downward trend since then.

And to put this into context – the UK annual mortality is about 600,000 per year. That means that only about 40% of deaths happen in hospitals. UK annual mortality is falling and births are rising so the population is growing bigger and older.  [My head is now starting to ache trying to juggle all these numbers and pictures in it].

This is not the whole story though – if the absolute hospital activity is going up and the absolute hospital mortality is going down then this raw mortality number may not be telling the whole picture. To correct for those effects we need the ratio – the Hospital Mortality Ratio (HMR).
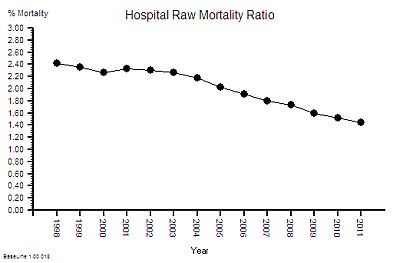
NHS_HospitalMortalityRatio_1998-2011This is the result of combining these two metrics – a 40% reduction in the hospital mortality ratio.

Does this mean that NHS hospitals are getting safer over time?

This observed behaviour can be caused by hospitals getting safer – it can also be caused by hospitals doing more low-risk work that creates a dilution effect. We would need to dig deeper to find out which. But that will distract us from telling the story.

Back to productivity.

The other part of the productivity equation is cost.

So what about NHS costs?  A bigger, older population, more activity, more staff, and better outcomes will all cost more taxpayer cash, surely! But how much more?  The activity and head count has gone up by 25% so has cost gone up by the same amount?
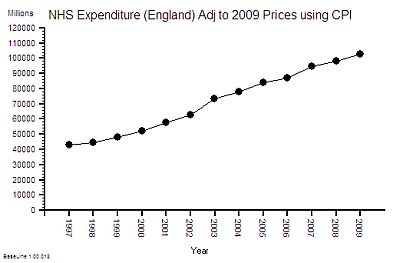
NHS_Annual_SpendThis is the time-series chart of the cost per year of the NHS and because buying power changes over time it has been adjusted using the Consumer Price Index using 2009 as the reference year – so the historical cost is roughly comparable with current prices.

The cost has gone up by 100% in one decade!  That is a lot more than 25%.

The published financial data for 2006-2010 shows that the proportion of NHS spending that goes to hospitals is about 50% and this has been relatively stable over that period – so it is reasonable to say that the increase in cash flowing to hospitals has been about 100% too.

So if the cost of hospitals is going up faster than the output then productivity is falling – and in this case it works out as a 37% drop in productivity (25% increase in activity for 100% increase in cost = 37% fall in productivity).

So the available data which anyone with a computer, an internet connection, and some curiosity can get; and with bit of spreadsheet noggin can turn into pictures shows that over the decade of growth that led up to the the Mid Staffs crunch we had:

1. A slightly bigger population; and a
2. significantly older population; and a
3. 25% increase in NHS hospital activity; and a
4. 10% fall in NHS beds; and a
5. 25% increase in NHS staff; which gives a
6. 40% increase in staff-per-bed ratio; an an
7. 8% reduction in absolute hospital mortality; which gives a
8. 40% reduction in relative hospital mortality; and a
9. 100% increase in NHS  hospital cost; which gives a
10. 37% fall drop in “hospital productivity”.

An experienced Improvement Scientist knows that a system that has been left to evolve by creep-crack-and-crunch can be re-designed to deliver higher quality and higher flow at lower total cost.

The safety creep at Mid-Staffs is now there for all to see. A crack has appeared in our confidence in the NHS – and raises a couple of crunch questions:

Where Has All The Extra Money Gone?

 How Will We Avoid The BIG CRUNCH?

The huge increase in NHS funding over the last decade was the recommendation of the Wanless Report but the impact of implementing the recommendations has never been fully explored. Healthcare is a service system that is designed to deliver two intangible products – health and care. So the major cost is staff-time – particularly the clinical staff.  A 25% increase in head count and a 100% increase in cost implies that the heads are getting more expensive.  Either a higher proportion of more expensive clinically trained and registered staff, or more pay for the existing staff or both.  The evidence shows that about 50% of NHS Staff are doctors and nurses and over the last decade there has been a bigger increase in the number of doctors than nurses. Added to that the Agenda for Change programme effectively increased the total wage bill and the new contracts for GPs and Consultants added more upward wage pressure.  This is cost creep and it adds up over time. The Kings Fund looked at the impact in 2006 and suggested that, in that year alone, 72% of the additional money was sucked up by bigger wage bills and other cost-pressures! The previous year they estimated 87% of the “new money” had disappeared hte same way. The extra cash is gushing though the cracks in the bottom of the fiscal bucket that had been clumsily papered-over. And these are recurring revenue costs so they add up over time into a future financial crunch.  The biggest one may be yet to come – the generous final-salary pensions that public-sector employees enjoy!

So it is even more important that the increasingly expensive clinical staff are not being forced to spend their time doing work that has no direct or indirect benefit to patients.

Trying to do a good job in a poorly designed system is both frustrating and demotivating – and the outcome can be a cynical attitude of “I only work here to pay the bills“. But as public sector wages go up and private sector pensions evaporate the cynics are stuck in a miserable job that they cannot afford to give up. And their negative behaviour poisons the whole pool. That is the long term cumulative cultural and financial cost of poor NHS process design. That is the outcome of not investing earlier in developing an Improvement Science capability.

The good news is that the time-series charts illustrate that the NHS is behaving like any other complex, adaptive, human-engineered value system. This means that the theory, techniques and tools of Improvement Science and value system design can be applied to answer these questions. It means that the root causes of the excessive costs can be diagnosed and selectively removed without compromising safety and quality. It means that the savings can be wisely re-invested to improve the resilience of some parts and to provide capacity in other parts to absorb the expected increases in demand that are coming down the population pipe.

This is Improvement Science. It is a learnable skill.

18/03/2013: Update

The question “Where Has The Money Gone?” has now been asked at the Public Accounts Committee


Look Out For The Time Trap!

There is a common system ailment which every Improvement Scientist needs to know how to manage.

In fact, it is probably the commonest.

The Symptoms: Disappointingly long waiting times and all resources running flat out.

The Diagnosis?  90%+ of managers say “It is obvious – lack of capacity!”.

The Treatment? 90%+ of managers say “It is obvious – more capacity!!”

Intuitively obvious maybe – but unfortunately these are incorrect answers. Which implies that 90%+ of managers do not understand how their systems work. That is a bit of a worry.  Lament not though – misunderstanding is a treatable symptom of an endemic system disease called agnosia (=not knowing).

The correct answer is “I do not yet have enough information to make a diagnosis“.

This answer is more helpful than it looks because it prompts four other questions:

Q1. “What other possible system diagnoses are there that could cause this pattern of symptoms?”
Q2. “What do I need to know to distinguish these system diagnoses?”
Q3. “How would I treat the different ones?”
Q4. “What is the risk of making the wrong system diagnosis and applying the wrong treatment?”


Before we start on this list we need to set out a few ground rules that will protect us from more intuitive errors (see last week).

The first Rule is this:

Rule #1: Data without context is meaningless.

For example 130  is a number – it is data. 130 what? 130 mmHg. Ah ha! The “mmHg” is the units – it means millimetres of mercury and it tells us this data is a pressure. But what, where, when,who, how and why? We need more context.

“The systolic blood pressure measured in the left arm of Joe Bloggs, a 52 year old male, using an Omron M2 oscillometric manometer on Saturday 20th October 2012 at 09:00 is 130 mmHg”.

The extra context makes the data much more informative. The data has become information.

To understand what the information actually means requires some prior knowledge. We need to know what “systolic” means and what an “oscillometric manometer” is and the relevance of the “52 year old male”.  This ability to extract meaning from information has two parts – the ability to recognise the language – the syntax; and the ability to understand the concepts that the words are just labels for; the semantics.

To use this deeper understanding to make a wise decision to do something (or not) requires something else. Exploring that would  distract us from our current purpose. The point is made.

Rule #1: Data without context is meaningless.

In fact it is worse than meaningless – it is dangerous. And it is dangerous because when the context is missing we rarely stop and ask for it – we rush ahead and fill the context gaps with assumptions. We fill the context gaps with beliefs, prejudices, gossip, intuitive leaps, and sometimes even plain guesses.

This is dangerous – because the same data in a different context may have a completely different meaning.

To illustrate.  If we change one word in the context – if we change “systolic” to “diastolic” then the whole meaning changes from one of likely normality that probably needs no action; to one of serious abnormality that definitely does.  If we missed that critical word out then we are in danger of assuming that the data is systolic blood pressure – because that is the most likely given the number.  And we run the risk of missing a common, potentially fatal and completely treatable disease called Stage 2 hypertension.

There is a second rule that we must always apply when using data from systems. It is this:

Rule #2: Plot time-series data as a chart – a system behaviour chart (SBC).

The reason for the second rule is because the first question we always ask about any system must be “Is our system stable?”

Q: What do we mean by the word “stable”? What is the concept that this word is a label for?

A: Stable means predictable-within-limits.

Q: What limits?

A: The limits of natural variation over time.

Q: What does that mean?

A: Let me show you.

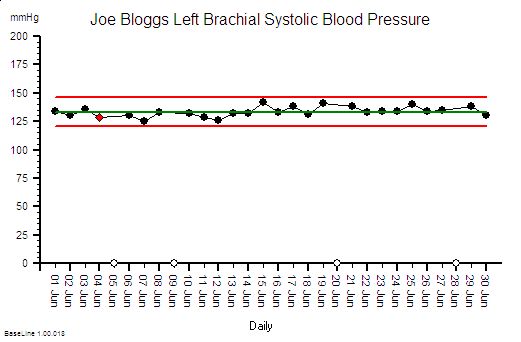
Joe Bloggs is disciplined. He measures his blood pressure almost every day and he plots the data on a chart together with some context .  The chart shows that his systolic blood pressure is stable. That does not mean that it is constant – it does vary from day to day. But over time a pattern emerges from which Joe Bloggs can see that, based on past behaviour, there is a range within which future behaviour is predicted to fall.  And Joe Bloggs has drawn these limits on his chart as two red lines and he has called them expectation lines. These are the limits of natural variation over time of his systolic blood pressure.

If one day he measured his blood pressure and it fell outside that expectation range  then he would say “I didn’t expect that!” and he could investigate further. Perhaps he made an error in the measurement? Perhaps something else has changed that could explain the unexpected result. Perhaps it is higher than expected because he is under a lot of emotional stress a work? Perhaps it is lower than expected because he is relaxing on holiday?

His chart does not tell him the cause – it just flags when to ask more “What might have caused that?” questions.

If you arrive at a hospital in an ambulance as an emergency then the first two questions the emergency care team will need to know the answer to are “How sick are you?” and “How stable are you?”. If you are sick and getting sicker then the first task is to stabilise you, and that process is called resuscitation.  There is no time to waste.


So how is all this relevant to the common pattern of symptoms from our sick system: disappointingly long waiting times and resources running flat out?

Using Rule#1 and Rule#2:  To start to establish the diagnosis we need to add the context to the data and then plot our waiting time information as a time series chart and ask the “Is our system stable?” question.

Suppose we do that and this is what we see. The context is that we are measuring the Referral-to-Treatment Time (RTT) for consecutive patients referred to a single service called X. We only know the actual RTT when the treatment happens and we want to be able to set the expectation for new patients when they are referred  – because we know that if patients know what to expect then they are less likely to be disappointed – so we plot our retrospective RTT information in the order of referral.  With the Mark I Eyeball Test (i.e. look at the chart) we form the subjective impression that our system is stable. It is delivering a predictable-within-limits RTT with an average of about 15 weeks and an expected range of about 10 to 20 weeks.

So far so good.

Unfortunately, the purchaser of our service has set a maximum limit for RTT of 18 weeks – a key performance indicator (KPI) target – and they have decided to “motivate” us by withholding payment for every patient that we do not deliver on time. We can now see from our chart that failures to meet the RTT target are expected, so to avoid the inevitable loss of income we have to come up with an improvement plan. Our jobs will depend on it!

Now we have a problem – because when we look at the resources that are delivering the service they are running flat out – 100% utilisation. They have no spare flow-capacity to do the extra work needed to reduce the waiting list. Efficiency drives and exhortation have got us this far but cannot take us any further. We conclude that our only option is “more capacity”. But we cannot afford it because we are operating very close to the edge. We are a not-for-profit organisation. The budgets are tight as a tick. Every penny is being spent. So spending more here will mean spending less somewhere else. And that will cause a big argument.

So the only obvious option left to us is to change the system – and the easiest thing to do is to monitor the waiting time closely on a patient-by-patient basis and if any patient starts to get close to the RTT Target then we bump them up the list so that they get priority. Obvious!

WARNING: We are now treating the symptoms before we have diagnosed the underlying disease!

In medicine that is a dangerous strategy.  Symptoms are often not-specific.  Different diseases can cause the same symptoms.  An early morning headache can be caused by a hangover after a long night on the town – it can also (much less commonly) be caused by a brain tumour. The risks are different and the treatment is different. Get that diagnosis wrong and disappointment will follow.  Do I need a hole in the head or will a paracetamol be enough?


Back to our list of questions.

What else can cause the same pattern of symptoms of a stable and disappointingly long waiting time and resources running at 100% utilisation?

There are several other process diseases that cause this symptom pattern and none of them are caused by lack of capacity.

Which is annoying because it challenges our assumption that this pattern is always caused by lack of capacity. Yes – that can sometimes be the cause – but not always.

But before we explore what these other system diseases are we need to understand why our current belief is so entrenched.

One reason is because we have learned, from experience, that if we throw flow-capacity at the problem then the waiting time will come down. When we do “waiting list initiatives” for example.  So if adding flow-capacity reduces the waiting time then the cause must be lack of capacity? Intuitively obvious.

Intuitively obvious it may be – but incorrect too.  We have been tricked again. This is flawed causal logic. It is called the illusion of causality.

To illustrate. If a patient complains of a headache and we give them paracetamol then the headache will usually get better.  That does not mean that the cause of headaches is a paracetamol deficiency.  The headache could be caused by lots of things and the response to treatment does not reliably tell us which possible cause is the actual cause. And by suppressing the symptoms we run the risk of missing the actual diagnosis while at the same time deluding ourselves that we are doing a good job.

If a system complains of  long waiting times and we add flow-capacity then the long waiting time will usually get better. That does not mean that the cause of long waiting time is lack of flow-capacity.  The long waiting time could be caused by lots of things. The response to treatment does not reliably tell us which possible cause is the actual cause – so by suppressing the symptoms we run the risk of missing the diagnosis while at the same time deluding ourselves that we are doing a good job.

The similarity is not a co-incidence. All systems behave in similar ways. Similar counter-intuitive ways.


So what other system diseases can cause a stable and disappointingly long waiting time and high resource utilisation?

The commonest system disease that is associated with these symptoms is a time trap – and they have nothing to do with capacity or flow.

They are part of the operational policy design of the system. And we actually design time traps into our systems deliberately! Oops!

We create a time trap when we deliberately delay doing something that we could do immediately – perhaps to give the impression that we are very busy or even overworked!  We create a time trap whenever we deferring until later something we could do today.

If the task does not seem important or urgent for us then it is a candidate for delaying with a time trap.

Unfortunately it may be very important and urgent for someone else – and a delay could be expensive for them.

Creating time traps gives us a sense of power – and it is for that reason they are much loved by bureaucrats.

To illustrate how time traps cause these symptoms consider the following scenario:

Suppose I have just enough resource-capacity to keep up with demand and flow is smooth and fault-free.  My resources are 100% utilised;  the flow-in equals the flow-out; and my waiting time is stable.  If I then add a time trap to my design then the waiting time will increase but over the long term nothing else will change: the flow-in,  the flow-out,  the resource-capacity, the cost and the utilisation of the resources will all remain stable.  I have increased waiting time without adding or removing capacity. So lack of resource-capacity is not always the cause of a longer waiting time.

This new insight creates a new problem; a BIG problem.

Suppose we are measuring flow-in (demand) and flow-out (activity) and time from-start-to-finish (lead time) and the resource usage (utilisation) and we are obeying Rule#1 and Rule#2 and plotting our data with its context as system behaviour charts.  If we have a time trap in our system then none of these charts will tell us that a time-trap is the cause of a longer-than-necessary lead time.

Aw Shucks!

And that is the primary reason why most systems are infested with time traps. The commonly reported performance metrics we use do not tell us that they are there.  We cannot improve what we cannot see.

Well actually the system behaviour charts do hold the clues we need – but we need to understand how systems work in order to know how to use the charts to make the time trap diagnosis.

Q: Why bother though?

A: Simple. It costs nothing to remove a time trap.  We just design it out of the process. Our flow-in will stay the same; our flow-out will stay the same; the capacity we need will stay the same; the cost will stay the same; the revenue will stay the same but the lead-time will fall.

Q: So how does that help me reduce my costs? That is what I’m being nailed to the floor with as well!

A: If a second process requires the output of the process that has a hidden time trap then the cost of the queue in the second process is the indirect cost of the time trap.  This is why time traps are such a fertile cause of excess cost – because they are hidden and because their impact is felt in a different part of the system – and usually in a different budget.

To illustrate. Suppose that 60 patients per day are discharged from our hospital and each one requires a prescription of to-take-out (TTO) medications to be completed before they can leave.  Suppose that there is a time trap in this drug dispensing and delivery process. The time trap is a policy where a porter is scheduled to collect and distribute all the prescriptions at 5 pm. The porter is busy for the whole day and this policy ensures that all the prescriptions for the day are ready before the porter arrives at 5 pm.  Suppose we get the event data from our electronic prescribing system (EPS) and we plot it as a system behaviour chart and it shows most of the sixty prescriptions are generated over a four hour period between 11 am and 3 pm. These prescriptions are delivered on paper (by our busy porter) and the pharmacy guarantees to complete each one within two hours of receipt although most take less than 30 minutes to complete. What is the cost of this one-delivery-per-day-porter-policy time trap? Suppose our hospital has 500 beds and the total annual expense is £182 million – that is £0.5 million per day.  So sixty patients are waiting for between 2 and 5 hours longer than necessary, because of the porter-policy-time-trap, and this adds up to about 5 bed-days per day – that is the cost of 5 beds – 1% of the total cost – about £1.8 million.  So the time trap is, indirectly, costing us the equivalent of £1.8 million per annum.  It would be much more cost-effective for the system to have a dedicated porter working from 12 am to 5 pm doing nothing else but delivering dispensed TTOs as soon as they are ready!  And assuming that there are no other time traps in the decision-to-discharge process;  such as the time trap created by batching all the TTO prescriptions to the end of the morning ward round; and the time trap created by the batch of delivered TTOs waiting for the nurses to distribute them to the queue of waiting patients!


Q: So how do we nail the diagnosis of a time trap and how do we differentiate it from a Batch or a Bottleneck or Carveout?

A: To learn how to do that will require a bit more explanation of the physics of processes.

And anyway if I just told you the answer you would know how but might not understand why it is the answer. Knowledge and understanding are not the same thing. Wise decisions do not follow from just knowledge – they require understanding. Especially when trying to make wise decisions in unfamiliar scenarios.

It is said that if we are shown we will understand 10%; if we can do we will understand 50%; and if we are able to teach then we will understand 90%.

So instead of showing how instead I will offer a hint. The first step of the path to knowing how and understanding why is in the following essay:

A Study of the Relative Value of Different Time-series Charts for Proactive Process Monitoring. JOIS 2012;3:1-18

Click here to visit JOIS

Little and Often

There seem to be two extremes to building the momentum for improvement – One Big Whack or Many Small Nudges.


The One Big Whack can come at the start and is a shock tactic designed to generate an emotional flip – a Road to Damascus moment – one that people remember very clearly. This is the stuff that newspapers fall over themselves to find – the Big Front Page Story – because it is emotive so it sells newspapers.  The One Big Whack can also come later – as an act of desperation by those in power who originally broadcast The Big Idea and who are disappointed and frustrated by lack of measurable improvement as the time ticks by and the money is consumed.


Many Small Nudges do not generate a big emotional impact; they are unthreatening; they go almost unnoticed; they do not sell newspapers, and they accumulate over time.  The surprise comes when those in power are delighted to discover that significant improvement has been achieved at almost no cost and with no cajoling.

So how is the Many Small Nudge method implemented?

The essential element is The Purpose – and this must not be confused with A Process.  The Purpose is what is intended; A Process is how it is achieved.  And answering the “What is my/our purpose?” question is surprisingly difficult to do.

For example I often ask doctors “What is our purpose?”  The first reaction is usually “What a dumb question – it is obvious”.  “OK – so if it is obvious can you describe it?”  The reply is usually “Well, err, um, I suppose, um – ah yes – our purpose is to heal the sick!”  “OK – so if that is our purpose how well are we doing?”  Embarrassed silence. We do not know because we do not all measure our outcomes as a matter of course. We measure activity and utilisation – which are measures of our process not of our purpose – and we justify not measuring outcome by being too busy – measuring activity and utilisation.

Sometimes I ask the purpose question a different way. There is a Latin phrase that is often used in medicine: primum non nocere which means “First do no harm”.  So I ask – “Is that our purpose?”.  The reply is usually something like “No but safety is more important than efficiency!”  “OK – safety and efficiency are both important but are they our purpose?”.  It is not an easy question to answer.

A Process can be designed – because it has to obey the Laws of Physics. The Purpose relates to People not to Physics – so we cannot design The Purpose, we can only design a process to achieve The Purpose. We can define The Purpose though – and in so doing we achieve clarity of purpose.  For a healthcare organisation a possible Clear Statement of Purpose might be “WE want a system that protects, improves and restores health“.

Purpose statements state what we want to have. They do not state what we want to do, to not do or to not have.  This may seem like a splitting hairs but it is important because the Statement of Purpose is key to the Many Small Nudges approach.

Whenever we have a decision to make we can ask “How will this decision contribute to The Purpose?”.  If an option would move us in the direction of The Purpose then it gets a higher ranking to a choice that would steer us away from The Purpose.  There is only one On Purpose direction and many Off Purpose ones – and this insight explains why avoiding what we do not want (i.e. harm) is not the same as achieving what we do want.  We can avoid doing harm and yet not achieve health and be very busy all at the same time.


Leaders often assume that it is their job to define The Purpose for their Organisation – to create the Vision Statement, or the Mission Statement. Experience suggests that clarifying the existing but unspoken purpose is all that is needed – just by asking one little question – “What is our purpose?” – and asking it often and of everyone – and not being satisfied with a “process” answer.

Iconoclasts and Iconoblasts

The human body is an amazing self-repairing system. It does this by being able to detect damage and to repair just the damaged part while still continuing to function. One visible example of this is how it repairs a broken bone. The skeleton is the hard, jointed framework that protects and supports the soft bits. Some of the soft bits, the muscles, both stablise and move this framework of bones. Together they form the musculoskeletal system that gives us the power to move ourselves.  So when, by accident, we break a bone how do we repair the damage?  The secret is in the microscopic structure of the bone. Bone is not like concrete, solid and inert, it is a living tissue. Two of the microsopic cells that live in the bone are the osteoclasts and the osteoblasts (osteo- is Greek for “bone”; -clast is Greek for “break” and -blast is Greek for “germ” in the sense of something that grows).  Osteoclasts dissolve the old bone and osteoblasts deposit new bone – so when they work together they can create bone, remodel bone, and repair bone. It is humbling when we consider that millions of microscopic cells are able to coordinate this continuous, dynamic, adaptive, reparative behaviour with no central command-and-control system, no decision makers, no designers, no blue-prints, no project managers. How is this biological miracle achieved? We are not sure – but we know that there must be a process.

Organisations are systems that face a similar challenge. They have relatively rigid operational and cultural structures of roles, responsibilities, lines of accountability, rules, regulations, values, beliefs, attitudes and behaviours.  These formal and informal structures are the conceptual “bones” of the organisation – the structure that enables the organisation to function.  Organisations also need to grow and to develop – which means that their virtual bones need to be remodelled continuously. Occasionally organisations have accidents – and their bones break – and sometimes the breaks are deliberate: it is called “re-structuring”.

There are people within organisations that have the same role as the osteoblast in the body. These people are called iconoclasts and what they do is dissolve dogma. They break up the rigid rules and regulations that create the corporate equivalent of concrete – but they are selective. Iconoclasts are sensitive to stress and to strain and they only dissolve the cultural concrete where it is getting in the way of improvement. That is where dogma is blocking innovation.  Iconoclasts question the status quo, and at the same time explain how it is causing a problem, offer alternatives, and predict the benefits of the innovation. Iconoclasts are not skeptics or cynics – they prepare the ground for change – they are facilitators.

There is a second group people who we could call the iconoblasts. They are the ones who create the new rules, the new designs, the new recipes, the new processes, the new operating standards – and they work alongside the iconoclasts to ensure the structure remains strong and stable as it evolves. The iconoblasts are called Improvement Scientists.

Improvement Scientists are like builders – they use the raw materials of ideas, experience, knowledge, understanding, creativity and enthusiasm and assemble them into new organisational structures.  In doing so they fully accept that one day these structures will in turn be dismantled and rebuilt. That is the way of improvement.  The dogma is relative and temporary rather than absolute and permanent. And the faster the structures can be disassembled and reassembled the more agile the organisation becomes and the more able it is to survive change.

So how are the iconoclasts and iconoblasts coordinated? Can they also work effectively and efficiently without a command-and-control system? If millions if microscopic cells in our bones can achieve it then maybe the individuals within organisations can do it too. We just need to understand what makes an iconoclast and an iconoblast and effective partnership and an essential part of an organisation.

The Power of the Positive Deviants

It is neither reasonable nor sensible to expect anyone to be a font of all knowledge.

And gurus with their group-think are useful but potentially dangerous when they suppress competitive paradigms.

So where does an Improvement Scientist seek reliable and trustworthy inspiration?

Guessing is a poor guide; gut-instinct can seriously mislead; and mind-altering substances are illegal, unreliable or both!

So who are the sources of tested ideas and where do we find them?

They are called Positive Deviants and they are everywhere.


But, the phrase positive deviant does not feel quite right does it? The word “deviant” has a strong negative emotional association. We are socially programmed from birth to treat deviations from the norm with distrust and for good reason. Social animals view conformity and similarity as security – it is our herd instinct. Anyone who looks or behaves too far from the norm is perceived as odd and therefore a potential threat and discounted or shunned.

So why consider deviants at all? Well, because anyone who behaves significantly differently from the majority is a potential source of new insight – so long as we know how to separate the positive deviants from the negative ones.

Negative deviants display behaviours that we could all benefit from by actively discouraging!  The NoNo or thou-shalt-not behaviours that are usually embodied in Law.  Killing, stealing, lying, speeding, dropping litter – that sort of thing. The anti-social trust-eroding conflict-generating behaviour that poisons the pond that we all swim in.

Positive deviants display behaviours that we could all benefit from actively encouraging! The NiceIf behaviours. But we are habitually focussed more on self-protection than self-development and we generalise from specifics. So we treat all deviants the same – we are wary of them. And by so doing we miss many valuable opportunities to learn and to improve.


How then do we identify the Positive Deviants?

The first step is to decide the dimension we want to improve and choose a suitable metric to measure it.

The second step is to measure the metric for everyone and do it over time – not just at a point in time. Single point-in-time measurements (snapshots) are almost useless – we can be tricked by the noise in the system into poor decisions.

The third step is to plot our measure-for-improvement as a time-series chart and look at it.  Are there points at the positive end of the scale that deviate significantly from the average? If so – where and who do they come from? Is there a pattern? Is there anything we might use as a predictor of positive deviance?

Now we separate the data into groups guided by our proposed predictors and compare the groups. Do the Positive Deviants now stick out like a sore thumb? Did our predictors separate the wheat from the chaff?

If so we next go and investigate.  We need to compare and contrast the Positive Deviants with the Norms. We need to compare and contrast both their context and their content. We need to know what is similar and what is different. There is something that is causing the sustained deviation and we need to search until we find it – and then we need know how and why it is happening.

We need to separate associations from causations … we need to understand the chains of events that lead to the better outcomes.

Only then will a new Door to Opportunity magically appear in our Black Wall of Ignorance – a door that leads to a proven path of improvement. A path that has been trodden before by a Positive Deviant – or by a whole tribe of them.

And only we ourselves can choose to open the door and explore the path – we cannot be pushed through by someone else.

When our system is designed to identify and celebrate the Positive Deviants then the negative deviants will be identified too! And that helps too because they will light the path to more NoNos that we can all learn to avoid.

For more about positive deviance from Wikipedia click here

For a case study on positive deviance click here

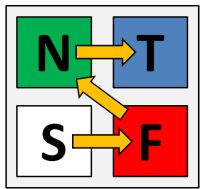
NB: The terms NiceIfs  and NoNos are two of the N’s on The 4N Chart® – the other two are Nuggets and Niggles.

The Journal of Improvement Science

Improvement Science encompasses research, improvement and audit and includes both subjective and objective dimensions.  An essential part of collective improvement is sharing our questions and learning with others.

From the perspective of the learner it is necessary to be able to trust that what is shared is valid and from the perspective of the questioner it is necessary to be able to challenge with respect.

Sharing new knowledge is not the only purpose of publication: for academic organisations it is also a measure of performance so there is a academic peer pressure to publish both quantity and quality – an academic’s career progression depends on it.

This pressure has created a whole industry of its own – the academic journal – and to ensure quality is maintained it has created the scholastic peer review process.  The  intention is to filter submitted papers and to only publish those that are deemed worthy – those that are believed by the experts to be of most value and of highest quality.

There are several criteria that editors instruct their volunteer “independent reviewers” to apply such as originality, relevance, study design, data presentation and balanced discussion.  This process was designed over a hundred years ago and it has stood the test of time – but – it was designed specifically for research and before the invention of the Internet, of social media and the emergence of Improvement Science.

So fast-forward to the present and to a world where improvement is now seen to  be complementary to research and audit; where time-series statistics is viewed as a valid and complementary data analysis method; and where we are all able to globally share information with each other and learn from each other in seconds through the medium of modern electronic communication.

Given these changes is the traditional academic peer review journal system still fit for purpose?

One way to approach this question is from the perspective of the customers of the system – the people who read the published papers and the people who write them.  What niggles do they have that might point to opportunities for improvement?

Well, as a reader:

My first niggle is to have to pay a large fee to download an electronic copy of a published paper before I can read it. All I can see is the abstract which does not tell me what I really want to know – I want to see the details of the method and the data not just the authors edited highlights and conclusions.

My second niggle is the long lead time between the work being done and the paper being published – often measured in years!  This implies that the published news is old news  useful for reference maybe but useless for stimulating conversation and innovation.

My third niggle is what is not published.  The well-designed and well-conducted studies that have negative outcomes; lessons that offer as much opportunity for learning as the positive ones.  This is not all – many studies are never done or never published because the outcome might be perceived to adversely affect a commercial or “political” interest.

My fourth niggle is the almost complete insistence on the use of empirical data and comparative statistics – data from simulation studies being treated as “low-grade” and the use of time-series statistics as “invalid”.  Sometimes simulations and uncontrolled experiments are the only feasible way to answer real-world questions and there is more to improvement than a RCT (randomised controlled trial).

From the perspective of an author of papers I have some additional niggles – the secrecy that surrounds the review process (you are not allowed to know who has reviewed the paper); the lack of constructive feedback that could help an inexperienced author to improve their studies and submissions; and the insistence on assignment of copyright to the publisher – as an author you have to give up ownership of your creative output.

That all said there are many more nuggets to the peer review process than niggles and to a very large extent what is published can be trusted – which cannot be said for the more popular media of news, newspapers, blogs, tweets, and the continuous cacophony of partially informed prejudice, opinion and gossip that goes for “information”.

So, how do we keep the peer-reviewed baby and lose the publication-process bath water? How do we keep the nuggets and dump the niggles?

What about a Journal of Improvement Science along the lines of:

1. Fully electronic, online and free to download – no printed material.
2. Community of sponsors – who publically volunteer to support and assist authors.
3. Continuously updated ranking system – where readers vote for the most useful papers.
4. Authors can revise previously published papers – using feedback from peers and readers.
5. Authors retain the copyright – they can copy and distribute their own papers as much as they like.
6. Expected use of both time-series and comparative statistics where appropriate.
7. Short publication lead times – typically days.
8. All outcomes are publishable – warts and all.
9. Published authors are eligible to be sponsors for future submissions.
10. No commercial sponsorship or advertising.

STOP PRESS: JOIS is now launched: Click here to enter.

The Cost of Distrust

Previously we have explored “costs” associated with processes and systems – costs that could be avoided through the effective application of Improvement Science. The Cost of Errors. The Cost of Queues. The Cost of Variation.

These costs are large, additive and cumulative and yet they pale into insignificance when compared with the most potent source of cost. The Cost of Distrust.

The picture is of Sue Sheridan and the link below is to a video of Sue telling her story of betrayed trust: in a health care system.  She describes the tragic consequences of trust-eroding health care system behaviour.  Sue is not bitter though – she remains hopeful that her story will bring everyone to the table of Safety Improvement

View the Video

The symptoms of distrust are easy to find. They are written on the faces of the people; broadcast in the way they behave with each other; heard in what they say; and felt in how they say it. The clues are also in what they do not do and what they do not say. What is missing is as important as what is present.

There are also tangible signs of distrust too – checklists, application-for-permission forms, authorisation protocols, exception logs, risk registers, investigation reports, guidelines, policies, directives, contracts and all the other machinery of the Bureaucracy of Distrust. 

The intangible symptoms of distrust and the tangible signs of distrust both have an impact on the flow of work. The untrustworthy behaviour creates dissatisfaction, demotivation and conflict; the bureaucracy creates handoffs, delays and queues.  All  are potent sources of more errors, delays and waste.

The Cost of Distrust is is counted on all three dimensions – emotional, temporal and financial.

It may appear impossible to assign a finanical cost of distrust because of the complex interactions between the three dimensions in a real system; so one way to approach it is to estimate the cost of a high-trust system.  A system in which the trustworthy behaviour is explicit and trust eroding behaviour is promptly and respectfully challenged.

Picture such a system and consider these questions:

  • How would it feel to work in a high-trust  system where you know that trust-eroding-behaviour will be challenged with respect?
  • How would it feel to be the customer of a high-trust system?
               
  • What would be the cost of a system that did not need the Bureaucracy of Distrust to deliver safety and quality?

Trust eroding behaviours are not reduced by decree, threat, exhortation, name-shame-blame, or pleading because all these behaviours are based on the assumption of distrust and say “I do not trust you to do this without my external motivation”. These attitudes behaviours give away the “I am OK but You are Not OK” belief.

Trust eroding behaviours are most effectively reduced by a collective charter which is when a group of people state what behaviours they do not expect and individually commit to avoiding and challenging. The charter is the tangible sign of the peer support that empowers everyone to challenge with respect because they have collective authority to do so. Authority that is made explicit through the collective charter: “We the undersigned commit to respectfully challenge the following trust eroding behaviours …”.

It requires confidence and competence to open a conversation about distrust with someone else and that confidence comes from insight, instruction and practice. The easiest person to practice with is ourselves – it takes courage to do and it is worth the investment – which is asking and answering two questions:

Q1: What behaviours would erode my trust in someone else?

Make a list and rank on order with the most trust-eroding at the top. 

Q2: Do I ever exhibit any of the behaviours I have just listed?

Choose just one  from your list that you feel you can commit to – and make a promose to yourself – every time you demonstrate the behaviour make a mental note of:

  • When it happened?
  • Where it happened?
  • Who was present?
  • What just happened?
  • How did you feel?

You do not need to actively challange your motives,  or to actively change your behaviour – you just need to connect up your own emotional feedback loop.  The change will happen as if by magic!

Doing Our Way to New Thinking.

Most of our thinking happens out of awareness – it is unconscious. Most of the data that pours in through our senses never reaches awareness either – but that does not mean it does not have an impact on what we remember, how we feel and what we decide and do in the future. It does.

Improvement Science is the knowledge of how to achieve sustained change for the better; and doing that requires an ability to unlearn unconscious knowledge that blocks our path to improvement – and to unlearn selectively.

So how can we do that if it is unconscious? Well, there are  at least two ways:

1. Bring the unconscious knowledge to the surface so it can be examined, sorted, kept or discarded. This is done through the social process of debate and discussion. It does work though it can be a slow and difficult process.

2. Do the unlearning at the unconscious level – and we can do that by using reality rather than rhetoric. The easiest way to connect ourselves to reality is to go out there and try doing things.

When we deliberately do things  we are learning unconsciously because most of our sensory data never reaches awareness.  When we are just thinking the unconscious is relatively unaffected: talking and thinking are the same conscious process. Discussion and dialog operate at the conscious level but differ in style – discussion is more competitive; dialog is more collaborative. 

The door to the unconscious is controlled by emotions – and it appears that learning happens more effectively and more efficiently in certain emotional states. Some emotional states can impair learning; such as depression, frustration and anxiety. Strong emotional states associated with dramatic experiences can result in profound but unselective learning – the emotionally vivid memories that are often associated with unpleasant events.  Sometimes the conscious memory is so emotionally charged and unpleasant that it is suppressed – but the unconscious memory is not so easily erased – so it continues to influence but out of awareness. The same is true for pleasant emotional experiences – they can create profound learning experiences – and the conscious memory may be called an inspirational or “eureka” moment – a sudden emotional shift for the better. And it too is unselective and difficult to erase.

An emotionally safe environment for doing new things and having fun at the same time comes close to the ideal context for learning. In such an enviroment we learn without effort. It does not feel like work – yet we know we have done work because we feel tired afterwards.  And if we were to record the way that we behave and talk before the doing; and again afterwards then we will measure a change even though we may not notice the change ourselves. Other people may notice before we do – particularly if the change is significant – or if they only interact with us occasionally.

It is for this reason that keeping a personal journal is an effective way to capture the change in ourselves over time.  

The Jungian model of personality types states that there are three dimensions to personality (Isabel Briggs Myers added a fourth later to create the MBTI®).

One dimension describes where we prefer to go for input data – sensors (S) use external reality as their reference – intuitors (N) use their internal rhetoric.

Another dimension is how we make decisions –  thinkers (T) prefer a conscious, logical, rational, sequential decision process while feelers (F) favour an unconscious, emotional, “irrational”, parallel approach.

The third dimension is where we direct the output of our decisions – extraverts (E) direct it outwards into the public outside world while intraverts (I) direct it inwards to their private inner world.

Irrespective of our individual preferences, experience suggests that an effective learning sequence starts with our experience of reality (S) and depending how emotionally loaded it is (F) we may then internalise the message as a general intuitive concept (N) or a specific logical construct (T).

The implication of this is that to learn effectively and efficiently we need to be able to access all four modes of thinking and to do that we might design our teaching methods to resonate with this natural learning sequence, focussing on creating surprisingly positive reality based emotional experiences first. And we must be mindful that if we skip steps or create too many emotionally negative experiences we we may unintentionally impair the effectiveness of the learning process.

A carefully designed practical exercise that takes just a few minutes to complete can be a much more effective and efficient way to teach a profound principle than to read libraries of books or to listen to hours of rhetoric.  Indeed some of the most dramatic shifts in our understanding of the Universe have been facilitated by easily repeatable experiments.

Intuition and emotions can trick us – so Doing Our Way to New Thinking may be a better improvement strategy.

The Seven Flows

Improvement Science is the knowledge and experience required to improve … but to improve what?

Improve safety, delivery, quality, and productivity?

Yes – ultimately – but they are the outputs. What has to be improved to achieve these improved outputs? That is a much more interesting question.

The simple answer is “flow”. But flow of what? That is an even better question!

Let us consider a real example. Suppose we want to improve the safety, quality, delivery and productivity of our healthcare system – which we do – what “flows” do we need to consider?

The flow of patients is the obvious one – the observable, tangible flow of people with health issues who arrive and leave healthcare facilities such as GP practices, outpatient departments, wards, theatres, accident units, nursing homes, chemists, etc.

What other flows?

Healthcare is a service with an intangible product that is produced and consumed at the same time – and in for those reasons it is very different from manufacturing. The interaction between the patients and the carers is where the value is added and this implies that “flow of carers” is critical too. Carers are people – no one had yet invented a machine that cares.

As soon as we have two flows that interact we have a new consideration – how do we ensure that they are coordinated so that they are able to interact at the same place, same time, in the right way and is the right amount?

The flows are linked – they are interdependent – we have a system of flows and we cannot just focus on one flow or ignore the inter-dependencies. OK, so far so good. What other flows do we need to consider?

Healthcare is a problem-solving process and it is reliant on data – so the flow of data is essential – some of this is clinical data and related to the practice of care, and some of it is operational data and related to the process of care. Data flow supports the patient and carer flows.

What else?

Solving problems has two stages – making decisions and taking actions – in healthcare the decision is called diagnosis and the action is called treatment. Both may involve the use of materials (e.g. consumables, paper, sheets, drugs, dressings, food, etc) and equipment (e.g. beds, CT scanners, instruments, waste bins etc). The provision of materials and equipment are flows that require data and people to support and coordinate as well.

So far we have flows of patients, people, data, materials and equipment and all the flows are interconnected. This is getting complicated!

Anything else?

The work has to be done in a suitable environment so the buildings and estate need to be provided. This may not seem like a flow but it is – it just has a longer time scale and is more jerky than the other flows – planning-building-using a new hospital has a time span of decades.

Are we finished yet? Is anything needed to support the these flows?

Yes – the flow that links them all is money. Money flowing in is called revenue and investment and money flowing out is called costs and dividends and so long as revenue equals or exceeds costs over the long term the system can function. Money is like energy – work only happens when it is flowing – and if the money doesn’t flow to the right part at the right time and in the right amount then the performance of the whole system can suffer – because all the parts and flows are interdependent.

So, we have Seven Flows – Patients, People, Data, Materials, Equipment, Estate and Money – and when considering any process or system improvement we must remain mindful of all Seven because they are interdependent.

And that is a challenge for us because our caveman brains are not designed to solve seven-dimensional time-dependent problems! We are OK with one dimension, struggle with two, really struggle with three and that is about it. We have to face the reality that we cannot do this in our heads – we need assistance – we need tools to help us handle the Seven Flows simultaneously.

Fortunately these tools exist – so we just need to learn how to use them – and that is what Improvement Science is all about.

The Ten Billion Barrier

I love history – not the dry boring history of learning lists of dates – the inspiring history of how leaps in understanding happen after decades of apparently fruitless search.  One of the patterns that stands out for me in recent history is how the growth of the human population has mirrored the changes in our understanding of the Universe.  This pattern struck me as curious – given that this has happened only in the last 10,000 years – and it cannot be genetic evolution because the timescale is to short. So what has fuelled this population growth? On further investigation I discovered that the population growth is exponential rather than linear – and very recent – within the last 1000 years.  Exponential growth is a characteristic feature of a system that has a positive feedback loop in it that is not balanced by an equal and opposite negative feedback loop. So, what is being fed back into the system that is creating this unbalanced behaviour? My conclusion so far is “collective improvement in understanding”.

However, exponential growth has a dark side – it is not sustainable. At some point a negative feedback loop will exert itself – and there are two extremes to how fast this can happen: gradual or sudden. Sudden negative feedback is a shock is the one to avoid because it is usually followed by a dramatic reversal of growth which if catastrophic enough is fatal to the system.  When it is less sudden and less severe it can lead into repeating cycles  of growth and decline – boom and bust – which is just a more painful path to the same end.  This somewhat disquieting conclusion led me to conduct the thought experiment that is illustrated by the diagram: If our growth is fuelled by our ability to learn, to use and to maintain our collective knowledge what changes in how we do this must have happened over the last 1000 years?  Biologically we are social animals and using our genetic inheritance we seem only able to maintain about 100 active relationships – which explains the natural size of family groups where face-to-face communication is paramount.  To support a stable group that is larger than 100 we must have developed learned behaviours and social structures. History tells us that we created communities by differentiating into specialised functions and to be stable these were cooperative rather than competitive and the natural multiplier seems to be about 100.  A community with more than 10,000 people is difficult to sustain with an ad hoc power structure with a powerful leader and we develop collective “rules” and a more democratic design – which fuels another 100 fold expansion to 1 million – the order of magnitide of a country or city. Multiply by 100 again and we get the size that is typical of a country and the social structures required to achieve stablity on this scale are different again – we needed to develop a way of actively seeking new knowledge, continuously re-writing the rule books, and industrialising our knowkedge. This has only happened over the last 300 years.  The next multipler takes us to Ten Billion – the order of magnitude of the current global population – and it is at this stage that  our current systems seem to be struggling again.

From this geometric perspective we appear to be approaching a natural human system barrier that our current knowledge management methods seem inadequate to dismantle – and if we press on in denial then we face the prospect of a sudden and catastrophic change – for the worse. Regression to a bygone age would have the same effect because those systems are not designed to suport the global economy.

So, what would have to change in the way we manage our collective knowledge that would avoid a Big Crunch and would steer us to a stable and sustainable future?

Small Step or Giant Leap?

This iconic image of Earthrise over the Moonscape reveals the dynamic complexity of the living Earth contrasting starkly with the static simplicity of the dead Moon. The feeling of fragility that this picture evokes sounds a warning bell for us – “Death is Irreversible and Life is not Inevitable”. In reality this image was a small technical step that created a giant cultural leap.

And so it is with much of Improvement Science – the perception of the size of the challenge changes once the challenge is overcome. With the benefit of hindsight it was easy, even obvious – but with only the limit of foresight it looked difficult and obscure.  Our ability to challenge, learn and adopt a new perspective is the source of much gain and much pain. We gain the excitement of new understanding and we feel the pain of being forced to face our old ignorance.  Many of us deny ourselves the gain because we cannot face the pain – but it does not have to be that way. We have a tendency to store the pain up until we are forced to face it – and by this means we create what feel like insurmountable barriers to improvement.  There is an alternative – bite sized improvement – taking small steps towards a realistic goal that is on a path to our distant objective.  The small-step method has many advantages – we can do things that matter to us and are within our circle of influence; we can learn and practice the skills in safety; and we can start immediately.

In prospect it will feel like a giant leap and in retrospect it will look like a small step – that is the way of Improvement Science – and as our confidence and curiosity grow we take bigger steps and make smaller leaps.  

Do You Have A Miserable Job?

If you feel miserable at work and do not know what to do then then take heart because you could be suffering from a treatable organisational disease called CRAP (cynically resistant arrogant pessimism).

To achieve a healthier work-life then it is useful to understand the root cause of CRAP and the rationale of how to diagnose and treat it.

Organisations have three interdependent dimensions of performance: value, time and money.  All organisations require both the people and the processes to be working in synergy to reliably deliver value-for-money over time.  To create a productive system it is necessary to understand the relationships between  value, money and time. Money is easier because it is tangible and durable; value is harder because it is intangible and transient. This means that the focus of attention is usually on the money – and it is often assumed that if the money is OK then the value must be OK too.  This assumption is incorrect.

Value and money are interdependent but have different “rates of change”  and can operate in different “directions”.  A common example is when a dip in financial performance triggers an urgent “drive” to improve the “bottom line”.  Reactive revenue generation and cost cutting results in a small, quick, and tangible improvement on the money dimension but at the same time sets off a large, slow, and intangible deterioration on the value dimension.  Money, time and  value are interdependent and the inevitable outcome is a later and larger deterioration in the money – as illustrated in the doodle. If only money is measured the deteriorating value is not detected, and by the time the money starts to falter the momentum of the falling value is so great that even heroic efforts to recover are futile. As the money starts to fall the value falls even further and even faster – the lose-lose-lose spiral of organisational failure is now underway.

People who demonstrate in their attitude and behaviour that they are miserable at work provide the cardinal sign of falling system value. A miserable, sceptical and cynical employee poisons the emotional atmosphere for everyone around them. Misery is both defective and infective.  The primary cause of a miserable job is the behaviour exhibited by people in positions of authority – and the more the focus is only on money the more misery their behaviour generates.

Fortunately there is an antidote; a way to break out of the vicious tail spin – measure both value and money, focus on improving value and observe the positive effect on the money.  The critical behaviour is to actively test the emotional temperature and to take action to keep it moving in a positive direction.  “The Three Signs of a Miserable Job” by Patrick Lencioni tells a story of how an experienced executive learns that the three things a successful managerial leader must do to achieve system health are:
1) ensure employees know their unique place, role and value in the whole system;
2) ensure employees can consciously connect their work with a worthwhile system goal; and
3) ensure employees can objectively measure how they are doing.

Miserable jobs are those where the people feel anonymous, where people feel their work is valueless, and where people feel that they get no feedback from their seniors, peers or juniors. And it does not matter if it is the cleaner or the chief executive – everyone needs a role, a goal and to know all their interdependencies.

We do not have to endure a Miserable Job – we all have the power to transform it into Worthwhile Work.

In Whom and in What do We Trust?

The issue of trust has been a recurring theme again this week – and it has appeared in many guises.  In one situation it was a case of distrust – I observed an overt display of suspicious, sceptical, and cynical behaviour. In another situation it was a case of mistrust – a misplaced confidence in my own intuition. My illogical and irrational heart said one thing but when my mind worked through the problem logically and rationally my intuition was proved incorrect. In another it was a case of rewarded-trust: positive feedback that showed a respectful challenge had resulted in a win-win-win outcome. And in yet another a case of extended-trust: an expression of delighted surprise from someone whose default position was to distrust.

Improvement Science rests on two Foundation stones Trust and Capability. First to trust oneself to have the confidence and humility to challenge, to learn, to change, to improve, to celebrate and to share; second to extend trust to others with a clear explanation of the consequences of betraying that trust; and third in building collective trust by having the courage to challenge trust-eroding behaviour.

At heart we are all curious, friendly, social animals – our natural desire is to want to trust. Distrust is a learned behaviour that, ironically, is the result of the instinctive trust and respect that, as children, we have for our parents.  We are taught to distrust by observing and copying distrustful and disrepectful behaviour by our role models. So with this insight we gain access to an antidote to the emotional poison of distrust: our innate child-like curiosity, desire to explore, appetite for fun, and thirst for knowledge and meaning. To dissolve distrust we only need to reconnect to our own inner child: One half of the foundation of Improvement Science.

Do Bosses need Hugs too?

The foundation on which Improvement Science is built is invisible – or rather intangible – and without this foundation the whole construction is unstable and unsustainable.  Rather like an iceberg – mostly under the surface with only a small part that is visible and measurable – and that small visible part is called Performance.

What is underneath?  To push our Performance through the surface so that it gets noticed we know we must synergise the People with the Processes but there is more to it than just that. The deepest part of the foundation, the part that provides the core strength and stability, is our Paradigm – our set of unconscious  beliefs, values, attitudes and habits that comprises our psycho-gyro-scope: our stabiliser. 

Our Paradigm creates inertia: the tendency to keep going in the same direction even when the winds of change have shifted permamantly and are blowing us off course.  Paradigms resist change – and for good reason – inertia is a useful thing when there are minor bumps on the journey and we need to avoid stalling at each one. Inertia becomes a less useful thing when we meet an immovable object such as a Law of Physics – because if we hit one of these then Reality will provide us with some painful feedback. Inertia is also less useful when we have stopped and have no momentum,  because it takes a bigger push for a longer time to get us moving again.

An elephant has a lot of inertia because it is big – and perhaps this is the reason why we refer to  attitudes and beliefs that represent resistance to change as Elephants in the Room.  The ringleader of a herd of organisational elephants is an elephant called Distrust which is the offspring an elephant called Discounting who in turn was born of an elephant called Disrespect.  We see this in organisationswhen we display and cultivate a disrepectful attitudes towards our peers, reports workers and our seniors. The old time-worn and cracked “us-versus-them” record.

So let us break into the cycle and push the Elephant called Distrust into spotlight – what is our alternative. Respect -> Acknowledgement -> Trust.   It doesn’t make any difference who you are: the most valuable form of respect is feedback:  Honest, Unbiassed and Genuine (HUG).  So if we regularly experience the Elephant called Distrust making a Toxic Swamp in our organisations and we feel discounted and disrespected then part of the reason may be that we are not giving ourselves enough HUGs. And that means the bosses too.

Sentenced to Death-by-Meeting!

Do you ever feel a sense of dread when you are summoned to an urgent meeting; or when you get the minutes and agenda the day before your monthly team meeting; or when you see your diary full of meetings for weeks in advance – like a slow and painful punishment?

If so then you may have unwittingly sentenced yourself to Death by Meeting.  What?  We do it to ourselves? No way! That would be madness!

But think about it. We consciously and deliberately ingest all sorts of other toxins: chemicals like caffeine, alcohol and cigarette smoke – so what is so different about immersing ourselves in the emotional toxic waste that many meetings seem to generate?

Perhaps we have learned to believe that there is no other way and because we have never experienced focussed, fun, and effective meetings where problems are surfaced, shared and solved quickly – problems that thwart us as individuals. Meetings where the problem-solving sum is greater than the problem-accumulating parts.

A meeting is a system that is designed to solve  problems.  We can improve our system incrementally but it is a slow process; to achieve a breakthrough we need to radically redesign the system.  There are three steps to doing this:

1. First decide what sort of problems the meeting is required to solve: strategic, operational or tactical;
2. Second design, test and practice a problem solving process for each category of problem; and
3. Third, select the appropriate tool for the task.

In his illuminating book Death by Meeting, Patrick Lencioni describes three meeting designs and illustrates with a story why meetings don’t work if the wrong tool is used for the wrong task. It is a sobering story.

There is another dimension to the design of meetings; that is how we solve problems as groups – and how, as a group, we seem to waste a lot of effort and time in unproductive discussion.  In his book Six Thinking Hats Edward De Bono provides an explanation for our habitual behaviour and a design for a radically different group problem solving process – one that a group would not arrive at by evolution – but one that has been proven to work.

If  we feel sentenced to death-by-meetings then we could buy and read these two small books – a zero-risk, one-off investment of effort, time and money for a guaranteed regular reward of fun, free time and success!

So if I complain to myself and others about pointless meetings and I have not bothered to do something about it myself then I now know that it is I who sentenced myself to Death-by-Meeting. Unintentionally and unconsciously perhaps – but me nevertheless.

Is a Queue an Asset or a Liability?

Many believe that a queue is a good thing.

To a supplier a queue is tangible evidence that there is demand for their product or service and reassurance that their resources will not sit idle, waiting for work and consuming profit rather than creating it.  To a customer a queue is tangible evidence that the product or service is in demand and therefore must be worth having. They may have to wait but the wait will be worth it.  Both suppliers and customers unconsciously collude in the Great Deception and even give it a name – “The Law of Supply and Demand”. By doing so they unwittingly open the door for charlatans and tricksters who deliberately create and maintain queues to make themselves appear more worthy or efficient than they really are.

Even though we all know this intuitively we seem unable to do anything about it. “That is just the way it is” we say with a shrug of resignation. But it does not have to be so – there is a path out of this dead end.

Let us look at this problem from a different perspective. Is a product actually any better because we have waited to get it? No. A longer wait does not increase the quality of the product or service and may indeed impair it.  So, if  a queue does not increase quality does it reduce the cost?  The answer again is “No”. A queue always increases the cost and often in many ways.  Exactly how much the cost increases by depends on what is on the queue, where the queue is, and how long it is. This may sound counter-intitutive and didactic so I need to explain in a bit more detail the reason this statement is an inevitable consequence of the Laws of Physics.

Suppose the queue comprises perishable goods; goods that require constant maintenance; goods that command a fixed price when they leave the queue; goods that are required to be held in a container of limited capacity with fixed overhead costs (i.e. costs that are fixed irrespective of how full the container is).  Patients in a hospital or passengers on an aeroplane are typical examples because the patient/passenger is deprived of their ability to look after themselves; they are totally dependent on others for supplying all their basic needs; and they are perishable in the sense that a patient cannot wait forever for treatment and an aeroplane cannot fly around forever waiting to land. A queue of patients waiting to leave hospital or an aeroplane full of passsengers circling to land at an airport represents an expensive queue – the queue has a cost – and the bigger the queue is and the longer it persists the greater the cost.

So how does a queue form in the first place? The answer is: when the flow in exceeds the flow out. The instant that happens the queue starts to grow bigger.  When flow in is less than flow out the queue is getting smaller – but we cannot have a negative queue – so when the flow out exceeds the flow in AND the size of the queue reaches zero the system suddenly changes behaviour – the work dries up and the resources become idle.  This creates a different cost – the cost of idle resources consuming money but not producing revenue. So a queue/work costs and no queue/no work costs too.  The least cost situation is when the work arrives at exactly the same rate that it can be done: there is no waiting by anyone – no queue and no idle resources.  Note however that this does not imply that the work has to arrive at a constant rate – only that rate at which the work arrives matches the rate at which it is done – it is the difference between the two that should be zero at all times. And where we have several steps – the flow must be the same through all steps of the stream at all times.  Remember the second condition for minimum cost – the size of the queue must be zero as well – this is the zero inventory goal of the “perfect process”.

So, if any deviation from this perfect balance of flow creates some form of cost, why do we ever tolerate queues? The reason is that the perfect world above implies that it is possible to predict the flow in and the flow out with complete accuracy and reliabilty.  We all know from experience that this is impossible: there is always some degree of  natural variation which is unpredictable and which we often call “noise” or “chaos”. For that single reason the lowest cost (not zero cost) situation is when there is just enough breathing space for a queue to wax and wane – smoothing out the unpredictable variation between inflow and outflow. This healthy queue is called a buffer.

The less “noise” the less breathing space is needed and the closer you can get to zero queue cost.

So, given this logical explanation it might surprise you to learn that most of the flow variation we observe in real processes is neither natural nor unpredictable – we deliberately and persistently inject predictable flow variation into our processes.  This unnatural variation is created by own policies – for example, accumulating DIY jobs until there are enough to justify doing them.   The reason we do this is because we have been bamboozled into believing it is a good thing for the financial health of our system. We have been beguiled by the accountants – the Money Magicians.  Actually that is not precise enough – the accountants themselves  are the innocent messengers – the deception comes from the Accounting Policies.  The major niggle is one convention that has become ossified into Accounting Practice – the convention that a queue of work waiting to be finished or sold represents an asset – sort of frozen-for-now-cash that can be thawed out or “liquidated” when the product is sold.  This convention is not incorrect it is just incomplete because, as we have demonstrated, every queue incurs a cost.  In accountant-speak a cost is called a liability and unfortunately this queue-cost-liability is never included in the accounts and this makes a very, very, big difference to the outcome. To assess the financial health of an organisation at a point in time an accountant will use a balance sheet to subtract the liabilities from the assets and come up with a number that is called equity. If that number is zero or negative then the business is financially dead – the technical name is bankruptcy and no accountant likes to utter the B word.  Denial is not a reliable long term buisness strategy and if our Accounting Policies do not include the cost of the queue as a liability on the balance sheet then our finanical reports will be a distortion of reality and will present the business as healthier than it really is.  This is an Error of Omission and has grave negative consequences.  One of which is that it can create a sense of complacency, a blindness to the early warning signs of financial illness and reactive rather than proactive behaviour. The problem is compounded when a large and complex organisation is split into smaller, simpler mini-businesses that all suffer from the same financial blindspot. It becomes even more difficult to see the problem when everyone is making the same error of omission and when it is easier to blame someone else for the inevitable problems that ensue.

We all know from experience that prevention is better than cure and we also know that the future is not predictable with certainty: so in addition to prevention we need vigilence, prompt action, decisive action and appropriate action at the earliest detectable sign of a significant deterioration. Complacency is not a reliable long term survival strategy.

So what is the way forward? Dispense with the accountants? NO! You need them – they are very good at what they do – it is just that what they are doing is not exactly what we all need them to be doing – and that is because the Accounting Policies that they diligently enforce are incomplete.  A safer strategy would be for us to set our accountants the task of learning how to count the cost of a queue and to include that in our internal finanical reporting. The quality of business decisions based on financial data will improve and that is good for everyone – the business, the customers and the reputation of the Accounting Profession. Win-win-win.

The question was “Is a queue and asset or a liability?” The answer is “Both”.

The Drama Triangle

Have you ever had the experience of trying to help someone with a problem, not succeeding, and being left with a sense of irritation, disappointment, frustration and even anger?

Was the dialog that led up to this unhappy outcome something along the lines of:

A: I have a problem with …
B: What about trying …
A: Yes, but ….
B: What about trying ….
A: Yes, but …

… and so on until you run out of ideas, patience or both.

If this sounds familiar then it is likely that you have been unwittingly sucked into a Drama Triangle – an unconscious, habitual pattern of behaviour that we all use to some degree.

This endemic behaviour has a hidden purpose: to feed our belonging need for social interaction.

The theory goes something like this – we are social animals and we need social interaction just as much as we need oxygen, water and food.  Without it we become psychologically malnourished and this insight explains why prolonged solitary confinement is such an effective punishment – it is the psychological equivalent to starvation.

The emotional sustenance we want most is unconditional love (UCL) – the sort we usually get from our parents, family and close friends.  Repeated affirmation that we are ‘OK’ with no strings attached.

The downside of our unconscious desire for UCL is that it offers a way for others to control our behaviour and those who choose to abuse that power are termed ‘manipulative’.  This control is done by adding conditions: “I will give you the affirmation you crave IF you do what I want“.  This is conditional love (CL).

When we are born we are completely powerless, and completely dependent on our parents – in particular our mother.  As we get older and start to exert our free will we learn that our society has rules – we cannot just follow every selfish desire.

Our parents unconsciously employ CL as a form of behavioural control and it is surprisingly effective: “If you are a good boy/girl then …“.  So, as children, we learn the technique from our parents.

This in itself  is not a problem; but it can become a problem when CL is the only sort available and when the intention is to further only the interests of the giver.  When this happens it becomes … manipulation.

The apparently harmless playground threat of “If you don’t do what I want then I won’t be your friend anymore” is the practice script of a future manipulator – and it feeds on a limiting-belief in the unconscious mind of the child – the belief that there is a limited supply of UCL and that someone else controls it.

And because we make this assumption at the pre-verbal stage of child development, it becomes unconscious, habitual, unspoken and second nature.


Our invalid childhood belief has a knock-on effect; we learn to survive on CL because “No Love” is the worst of all options; it is the psychological equivalent of starvation.

And we learn to put up with second best, and because CL offers inferior emotional nourishment we need a way of generating as much as we want, on-demand.

So we employ the behaviour we were unwittingly taught by our patents – and the Drama Triangle becomes our on-demand-generator-of-second-rate-emotional-sustenance.

The tangible evidence of this “programming” is an observable behaviour that is called “game playing” and was first described by Eric Berne in the famous book “Games People Play“.

Berne described many different Games and they all have a common pattern and a common objective – to generate second-rate emotional food (or ‘transactions’ to use Berne’s language).  But our harvest comes at a price – the transactions are unhealthy – not enough to harm us immediately – but enough to leave us feeling dissatisfied and unhappy.

But what choice do we believe we have?

If we were given the options of breathing stale air or suffocating what would we do?

If we assume our options are to die of thirst or drink stagnant pond-water what would we do?

If we believe our only options are to starve or eat rubbish what would we do?

Our survival instinct is much stronger than our belonging need, so we choose unhealthy over deadly and eventually we become so habituated to game-playing that we do not notice it any more.

Excessive and prolonged exposure to the Drama Triangle is the psychological equivalent of alcoholic liver cirrhosis.  Permanent and irreversible psychological scarring called cynicism.


It is important to remember that this is learned behaviour – and therefore it can be unlearned – or rather overwritten with a healthier habit.

Just by becoming aware of the problem, and understanding the root cause of the Drama Triangle, an alternative pathway appears.

We can challenge our untested assumption that UCL is limited and that someone else controls the supply.  We can consider the alternative hypothesis: that the supply of UCL is unlimited and that we control the supply.

Q: How easy is it for us to offer someone else UCL?

Easy – we see it all the time. How do you feel when someone gives a genuine “Thank You”, cheers you on, celebrates your success, seeks your opinion, and recommends you to others – with no strings attached.  These are all forms of UCL that anyone can practice; by making a conscious choice to give with no expectation of a return.

For many people it feels uncomfortable at first because the game-playing behaviour is so deeply ingrained – and game-playing is particularly prevalent in the corridors of power where it is called “politics”.

Game-free behaviour gets easier with practice because UCL benefits both the giver and the receiver – it feels healthier – there is no need for a payback, there is no score to be kept, no emotional account to balance.  It feels like a breath of fresh air.


So, next time you feel that brief flash of irritation at the start of a conversation or are left with a negative feeling after a conversation just stop and ask yourself  “Was I just sucked into a Drama Triangle?”

Anyone who is able to “press your button” is hooking you into a game, and it takes two to play.

Now consider the question “And to what extent was I unconsciously colluding?


The tactic to avoid the Drama Triangle is to learn to sense the emotional “hook” that signals the invitation to play the Game; and to consciously deflect it before it embeds into your unconscious mind and triggers an unconscious, habitual, reflex, emotional reaction.

One of the most potent barriers to change is when we unconsciously compute that our previously reliable sources of CL are threatened by the change.  We have no choice but to oppose the change – and that choice is made unconsciously. So, we unwittingly undermine the plan.

The symptoms of this unconscious behaviour are obvious when you know what to look for … and the commonest reaction is:

“Yes … but …”

and the more intelligent and invested the person the more cogent and rational the argument will sound.

The most effective response is to provide evidence that disproves the defensive assertion – not the person’s opinion – and before taking on this challenge we need to prepare the evidence.

By demonstrating that their game-playing behaviour no longer leads to the expected payoff, and at the same time demonstrating that game-free behaviour is both possible and better – we demonstrate that the underlying, unconscious, limiting belief is invalid.

And by that route we develop our capability for game-free social interactions.

Simple enough in theory, and it does works in practice, though it can be difficult to learn because game-playing is such an ingrained behaviour.  It does get easier with practice and the ultimate reward is worth the investment  – a healthier emotional environment.  And that is transformational.

Lies, Damned Lies and Statistics!

Most people are confused by statistics and because of this experts often regard them as ignorant, stupid or both.  However, those who claim to be experts in statistics need to proceed with caution – and here is why.

The people who are confused by statistics are confused for a reason – the statistics they see presented do not make sense to them in their world.  They are not stupid – many are graduates and have high IQ’s – so this means they must be ignorant and the obvious solution is to tell them to go and learn statistics. This is the strategy adopted in medicine: Trainees are expected to invest some time doing research and in the process they are expected to learn how to use statistics in order to develop their critical thinking and decision making.  So far so good, so what  is the outcome?

Well, we have been running this experiment for decades now – there are millions of peer reviewed papers published – each one having passed the scrutiny of a statistical expert – and yet we still have a health care system that is not delivering what we need at a cost we can afford.  So, there must be someone else at fault – maybe the managers! They are not expected to learn or use statistics so that statistically-ignorant rabble must be the problem -so the next plan is “Beat up the managers” and “Put statistically trained doctors in charge”.

Hang on a minute! Before we nail the managers and restructure the system let us step back and consider another more radical hypothesis. What if there is something not right about the statistics we are using? The medical statistics experts will rise immediately and state “Research statistics is a rigorous science derived from first principles and is mathematically robust!”  They are correct. It is. But all mathematical derivations are based on some initial fundamental assumptions so when the output does not seem to work in all cases then it is always worth re-examining the initial assumptions. That is the tried-and-tested path to new breakthroughs and new understanding.

The basic assumption that underlies research statistics is that all measurements are independent of each other which also implies that order and time can be ignored.  This is the reason that so much effort, time and money is invested in the design of a research trial – to ensure that the statistical analysis will be correct and the conclusions will be valid. In other words the research trial is designed around the statistical analysis method and its founding assumption. And that is OK when we are doing research.

However, when we come to apply the output of our research trials to the Real World we have a problem.

How do we demonstrate that implementing the research recommendation has resulted in an improvement? We are outside the controlled environment of research now and we cannot distort the Real World to suit our statistical paradigm.  Are the statistical tools we used for the research still OK? Is the founding assumption still valid? Can we still ignore time? Our answer is clearly “NO” because we are looking for a change over time! So can we assume the measurements are independent – again our answer is “NO” because for a process the measurement we make now is influenced by the system before, and the same system will also influence the next measurement. The measurements are NOT independent of each other.

Our statistical paradigm suddenly falls apart because the founding assumption on which it is built is no longer valid. We cannot use the statistics that we used in the research when we attempt to apply the output of the research to the Real World. We need a new and complementary statistical approach.

Fortunately for us it already exists and it is called improvement statistics and we use it all the time – unconsciously. No doctor would manage the blood pressure of a patient on Ward A  based on the average blood pressure of the patients on Ward B – it does not make sense and would not be safe.  This single flash of insight is enough to explain our confusion. There is more than one type of statistics!

New insights also offer new options and new actions. One action would be that the Academics learn improvement statistics so that they can understand better the world outside research; another action would be that the Pragmatists learn improvement statistics so that they can apply the output of well-conducted research in the Real World in a rational, robust and safe way. When both groups have a common language the opportunities for systemic improvment increase. 

BaseLine© is a tool designed specifically to offer the novice a path into the world of improvement statistics.

When Is Seeing Believing?

One of the problems with our caveman brains is that they are a bit slow. It may not feel that way but they are – and if you don’t believe me try this experiment: Stand up, get a book, hold it in your left hand open it at any page, hold a coin in your right hand between finger and thumb so that it will land on the floor when you drop it. Then close your eyes and count to three. Open your eyes, drop the coin, and immediately start reading the book. How long is it before you are consciously aware of the meaning of the words. My guess is that the coin hits the floor about the same time that you start to making sense of what is on the page. That means it takes about half a second to start perceiving what you are seeing. That long delay is a problem because the world around us is often changing much faster than that and, to survive, we need to keep up. So what we do is fill in the gaps – what we perceive is a combination of what we actually see and what we expect to see – the process is seamless, automatic and unconscious. And that is OK so long as expectation and reality stay in tune – but what happens when they don’t? We experience the “Eh?” effect which signals that we are temporarily confused – an uncomfortable and scary feeling which resolves when we re-align our perception with reality. Over time we all learn to avoid that uncomfortable confusion feeling with a simple mind trick – we just filter out the things we see that do not fit our expectation. Psychologists call this “perceptual distortion” and the effect is even greater when we look with our minds-eye rather than our real eyes – then we only perceive  what we expect to see and we avoid the uncomfortable “Eh?” effect completely.  This unconscious behaviour we all demonstrate is called self-delusion and it is a powerful barrier to improvement – because to improve we have to first accept that what we have is not good enough and that reality does not match our expectation.

To become a master of improvement it is necessary to learn to be comfortable with the “eh?” feeling – to disconnect it from the negative emotion of fear that drives the denial reaction and self-justifying behaviour – and instead to reconnect it to the positive emotion of excitement that drives the curiosity action and exploratory behaviour.  One ewasy way to generate the “eh?” effect is to perform reality checks – to consciously compare what we actually see with what we expect to see.  That is not easy because our perception is very slippery – we are all very,very good at perceptual distortion. A way around this is to present ourselves with a picture of realilty over time, using the past as a baseline, and our understanding of the system, we can predict what we believe will happen in the near future. We then compare what actually happens with our expectation.  Any significant deviations are “eh?” effects that we can use to focus our curiosity – for there hide the nuggets of new knowledge.  But how do we know what is a “signifcant” deviation? To answer that we must avoid using our slippery self-delusional perception system – we need a tool that is designed to do this interpretation safely, easily, and quickly.  Click here for an example of such a tool.

Must We Unlearn First?

In the famous “Star Wars” films when Luke Skywalker is learning to master the Force – his trainer, Jedi Master Yoda, says the famous line:

You must unlearn what you have learned“.

These seven words capture a fundamental principle of Improvement Science – that very often we have to unlearn before we can improve.

Unlearning is not the same as forgetting – because much of what we have learned is unconscious – so to unlearn we first have to make our assumptions conscious.

Unlearning is not just erasing a memory, it is preparing the mental ground to replace the learning with something else.

And we do not want to unlearn everything – we want to keep the nexus of knowledge nuggets that form the solid foundation of new learning.  We only want to unlearn what is preventing us adding new understanding, concepts and skills – the invisible layer of psychological grease that smears our vision and leaves our minds slippery and unable to grasp new concepts.

We need to apply some cognitive detergent and ad some heated debate to strip off the psycho-slime.  The best detergent is I have found is called Reality and the good news is that Reality is widely available, completely free and supplies will never run out.

Watch the video on YouTube

Will the Cuts Cure the Problem or Kill the Patient?

Times are hard. Severe austerity measures are being imposed to plug the hole in the national finances. Cuts are being made.  But will these cuts cure the problem or kill the patient?  How would we know before it is too late? Is there an alternative to sticking the fiscal knife in and hoping we don’t damage a vital part of the system? Is a single bold slash or a series of planned incisions a better strategy?  How deep, how far and how fast is it safe to cut? The answer to these questions is “we don’t know” – or rather that we find it very hard to predict with confidence what will happen.  The reason for this is that we are dealing with a complex system of interdependent parts that connect to each other through causal links; some links are accelerators, some are brakes, some work faster and some slower.  Our caveman brains were not designed to solve this sort of predicting-the-future-behaviour-of-a-complex-system problem: our brains evolved to spot potential danger quickly and to manage a network of social relationships.  So to our caveman way of thinking complex systems behave in counter-intuitive ways.  However, all physical systems are constrained by the Laws of Nature – so if we don’t understand how they behave then the limitation is with the caveman wetware between our ears.

We do have an amazing skill though – we have the ability to develop tools that extend our limited biological capabilites. We have mastered technology – in particular the technology of data and information. We have  learned how to recode and record our expereince and our understanding so that each generation can build on the knowledge of the previous ones.  The tricky problems we are facing are ones that we have never encountered before so we have to learn as we go.

So our current problem of understanding the dynamics of our economic and social system is this: we cannot do this unconsciously and intuitively in our heads. Instead we have developed tools that can extend our predictive capability. Our challenge is to learn how to use these tools – how to wield the fiscal scalpel so that it is quick, safe and effective. We need to excise the cancer of waste while preserving our vital social and economic structures and processes.  We need the best tools available – diagnostic tools, decision tools, treatment planning tools, and progress monitoring tools.  These tools exist – we just need to learn to use them.

A perfect example of this is the reining in of public spending and the impact of cutting social service budgets.  One thing that these budgets provide are services that some people need to maintain independent living in the community.  Very often elderly people are only just coping and even a minor illness can be enough to tip them over the edge and into hospital – where they can get stuck because to discharge them safely requires extra social support – support that if provided earlier might have prevented a hospital admission. So boldly slashing the social care budget will not magically excise the waste – it means that there will be less social support capacity and patients will get stuck in the hospital part of the health and social care system. This is not good for them – or anyone else. Hospitals are not hotels and getting stuck in one is not a holiday! Hospitals are for people who are very ill – and if the hospital is full of not-so-ill people who are stuck then we have an even bigger problem – because the very ill people get even more ill – and then they need even more resources to get them well again. Some do not make it. A bold slash in just one part of the health and  social care system can, unintentionally, bring the whole health and social care system crashing down.

Fortunately there is a way to avoid this – and it is counter-intuitive – otherwise we would have done it already. And because it is counter-intuitive I cannot just explain it – the only way to understand it is to discover and demonstrate  it to ourselves.  And in the process of learning to master the tools we need we will make a lot of errors. Clearly, we do not want to impose those errors on the real system – so we need something to practice with that is not the real system yet behaves realistically enough to allow us to develop our skills. That something is a system simulation. To experience an example of a healthcare system simulation and to play the game please follow the link: click here to play the game

Reactive or Proactive?

Improvement Science is about solving problems – so looking at how we solve problems is a useful exercise – and there is a continuous spectrum from 100% reactive to 100% proactive.

The reactive paradigm implies waiting until the problem is real and urgent and then acting quickly and decisively – hence the picture of the fire-fighter.  Observe the equipment that the fire-fighter needs:  a hat and suit to keep him safe and a big axe! It is basically a destructive and unsafe job based on the “our purpose is to stop the problem getting worse”.

The proactive paradigm implies looking for the earliest signs of the problem and planning the minimum action required to prevent the problem – hence the picture of the clinician. Observe the equipment that the clinician needs: a clean white coat to keep her patients safe and a stethoscope – a tool designed to increase her sensitivity so that subtle diagnostic sounds can be detected.

If we never do the proactive we will only ever do the reactive – and that is destructive and unsafe. If we never do the reactive we run the risk of losing everything – and that is destructive and unsafe too.

To practice safe and effective Improvement Science we must be able to do both in any combination and know which and when: we need to be impatient, decisive and reactive when a system is unstable, and we need to be patient, reflective and proactive when the system is stable.  To choose our paradigm we must listen to the voice of the process. It will speak to us if we are prepared to listen and if we are prepared to learn it’s language.

Is it OK to Fail First Time?

Improvement Science is about learning from when what actually happens is different to that which we expected to happen.  Is this surprise a failure or is this a success? It depends on our perspective. If we always get what we expect then we could conclude that we have succeeded – yet we have neither learned anything nor improved. So have we failed to learn? In contrast, if we never get what we expected then we could conclude that we  always fail – yet we do not report what we have learned and improved.  Our expectation might be too high! So comparing outcome with expectation seems a poor way to measure our progress with learning and improvement.

When we try something new we should expect to be surprised – otherwise it would not be new.  It is what we learn from that expected surprise that is of most value. Sometime life turns out better than we expected – what can we learn from those experiences and how can we ensure that outcome happens again – predictably? Sometimes life turns out worse than we expected – what can we learn from those experiences and how can we ensure that outcome does not happen again, predictably?  So, yes it is OK for us to fail and to not get what we expected – first time.  What is not OK is for us to fail to learn from the lesson and to make an avoidable mistake more than once or miss an opportunity for improvement more than once.

Do We have a Wealth of Data and a Dearth of Information?

Sustained improvement only follows from effective actions; which follow from well-informed decisions – not from blind guessing.  A well-informed decision imples good information – and good information is not just good data. Good information implies that good data is presented in a format that is both undistorted and meaningful to the recipient.  How we present data is, in my experience, one of the weakest links in the improvement process.  We rarely see data presented in a clear, undistorted, and informative way and commonly we see it presented in a way that obscures or distorts our perception of reality. We are presented with partial facts quoted without context – so we unconsciously fill in the gaps with our own assumptions and prejudices and in so doing distort our perception further.  And the more emotive the subject the more durable the memory that we create – which means it continues to distort our future perception even more.

The primary purpose of the news media is survival – by selling news – so the more emotive and memorable the news the better it sells.  Accuracy and completeness can render news less attractive: by generating the “that’s obvious, it is not news” response.  Catchy headlines sell news and to do that they need to generate a specific emotional reaction quickly – and that emotion is curiosity! Once alerted, they must hold the readers attention by quickly creating a sense of drama and suspense – like a good joke – by being just ambiguous enough to resonate with many different pepole – playing on their prejudices to build the emotional intensity.

The purpose of politicians is survival – to stay in power long enough to achieve their goals – so the less negative press they attract the better – but Politicians and the Press need each other because their purpose is the same – to survive by selling an idea to the masses – and to do that they must distort reality and create ambiguity.  This has the unfortunate side effect of also generating less-than-wise decisions.

So if our goal is to cut through the emotive fog and get to a good decision quickly so that we can act effectively we need just the right data presented in context and in an unambiguous format that we, the decision-maker, can interpret quickly. The most accessible format is as a picture that tells a story – the past, the present and the likely future – a future that is shaped by the actions that come from the decisions we make in the present that we make using information from the past.  The skill is to convert data into a story … and one simple and effective tool for doing that is a process behaviour chart.

Egomatosis

There is a common, and often fatal, organisational disease called “egomatosis”.

It starts as a swelling of the Egocentre in the Executive Organ that is triggered by a deficiency in the Humility Feedback Loop (HFL), which in turn is linked to underdevelopment or dysfunction of the phonic sensory input system – selective deafness.

Unfortunately, the Egocentre is located next to other perception centres – specifically insight – so as the egoma develops the visual perception also becomes progressively distorted until a secondary cultural blind-spot develops.

In effect, the Executive organ becomes progressively cut off from objective reality – and this lack of accurate information impairs the Humility Feedback Loop further – accelerating the further enlargement of the egoma.

A dangerous positive feedback loop is now created that leads to a self-amplifying spiral of distorted perception and a progressive decline of judgement and effective decision making.

The external manifestation of this state is a characteristic behaviour called “dystrustosis” – or difficulty in extending trust to others combined with a progressive loss of self-trust.

The unwitting sufferer becomes progressively deaf, blind, fearful, delusional, paranoid and insecure – often distancing themselves emotionally and physically and communicating only via intermediaries using One-Way-Directives.

Those who attempt to communicate with the sufferer of this insidious condition often resort to SHOUTING and using BIG LETTERS which, unfortunately, only mirrors the same behaviour.  As the sufferer’s perception of reality becomes more distorted their lack of insight and humility blocks them from considering themselves as a contributor to the problem.

The ensuing conflict only serves to accelerate their decline and the sufferer progresses to the stage of “fulminant egomatosis”.


“Fulminant egomatosis” is a condition that is easy to identify and to diagnose.  Just listen for the shouting, observe the dystrustosis and feel the fear.

Unfortunately, it is a difficult condition to manage because of the lack of awareness and insight that are the cardinal signs.

Many affected leaders and their organisations now enter a state of Denial – unconsciously hoping that the problem will resolve itself – which is indeed what happens eventually – though not in the way they desperately hope for.

In the interim, the health of the organisation deteriorates and many executives succumb, unaware of, or unwilling to acknowledge the illness that claimed them; meekly accepting the “inevitable fate” and submitting to the terminal option – usually delivered by the Chair of the Board – Retire or Resign!

The circling corporate vultures squabble over the fiscal remains – leaving no tangible sign to mark the passing of the sufferer and their hapless organisation.  There are no graveyards for the victims of fulminant egomatosis and the memory of their passing soon fades from the collective memory.  Failure is a taboo subject – an undiscussable.


Some organisations become aware of their affliction while they are still alive, but only after they have reached the terminal stage and are too sick to save.  The death throes are destructive and unpleasant to watch – and unfortunately fuel the self-justifying delusion of other infected organisations who erroneously conclude that “it could never happen to them” and then unwittingly follow the same path.


Unfortunately, egomatosis is an infectious cultural disease.  The spores, or “memes” as they are called, can spread to other organisations.  Just as Dr Ignaz Semmelweis discovered in 1847, the agents-of-destruction are often carried on the hands of those who perform organisational postmortems.  These meme vectors are often the very people brought into assist the ailing organisation, and so become chronically infected themselves and gravitate to others who share their delusions.  They are excluded by healthy organisations, but their siren-calls sound plausible and they gain entry to weaker organisations who are unaware that they carry the dangerous memes!  Actively employing the services of management consultants in preference to encouraging organisational innovation incurs a high risk of silent infection!  Appearance of the symptoms and signs is often delayed and by then it may be too late. 


The organisations that are naturally immune to egomatosis were “built to last” because they were born with a well-developed sense of purpose, vision, humility, confidence and humour.  They habitually and unconsciously look for, detect, and defuse the early signs of egomatosis.  They do not fear failure, and they have learned to leverage the gap between intent and impact.  These organisations have a strong cultural immune system and are able to both prevent infection and disarm the toxic-memes they inevitably encounter.  They are safe,  fun, challenging, exciting, innovative and motivating, places to work – characteristics that serve to strengthen their immunity, boost their resilience, and secure their future.


Some infected organisations are fortunate enough to become aware of their infection before it is too late, and they are able to escape the vicious cycle of decline.  These “good to great” organisations have enough natural humility to learn by observing the fate of others and are able to detect the early symptoms and to seek help from someone who understands their illness and can guide their diagnosis and treatment.  Such healers facilitate and demonstrate rather than direct and delegate.


All organisations are susceptible to egomatosis, so prevention is preferable to cure.

To prevent the disease, organisations must consciously and actively develop their internal and external feedback loops – using all their senses – including their olfactory organ.  Cultural and political bull**** has a characteristic odour!

They also regularly exercise their Humility Feedback Loop to keep it healthy – and they have discovered that the easiest way to do that is to challenge themselves – to actively look for their own gaps and gaffes – to look for their own positive deviants – to search out opportunities to improve – and to practice the very things that they know they are not good at.

They are prepared to be proved lacking and have learned to stop, look, laugh at themselves – then listen, learn, act, improve and share.

There is no known cure for egomatosis – it is a consequence of the 1.3 kg of ChimpWare between our ears that we have inherited from our ancestors – so vigilance must be maintained throughout the life of the organisation. 


Is Good Design Easy to See?

Doh! What a non-question! Good design is obvious. But is it?  Bad design is certainly obvious because it trips you up, it does something you do not expect or doesn’t do something that you do expect – you become consciously aware of bad design and it is a niggle because bad design is effort wasting, time wasting and money wasting.  Bad design generates niggles and toxic emotional waste swamps.  So what was your feeling when you first saw an iPhone, or an iPod, or used iTunes or touched an iPad? Was it was “Wow!” That is the first impact of good design – you notice the difference immediately. However, after that it becomes gradually invisible because the old niggle goes away, and before long you are taking the good design for granted because there is nothing to consciously remind you of it. Your expectation has changed – what previosuly delighted now only satifies. Good design is an invisible nugget. So here is something to try – look around you now and identify all the examples of good and bad design that you can see. What differentiates the two?  For a niggle free existence you will have to actively seek out good design by looking for what is there but not making itself obvious.  Refocus from what doesn’t work to what does work and learn to understand how and why it works. You may find it a humbling experience!!

Which Checkout do We Choose?

When we are approaching the checkout in the supermarket how do we decide which queue to join?  Is it the shortest? Is it the one with the fewest number of full trollies? Is it the one that is staffed by the most competent looking operative? Or is it the new-fangled computerised one that technophobes like me avoid like the plague? If our goal is to get out of the shop as quickly as possible then this is an important yet tricky decision. Once we have committed to a specific queue then we are bound by the social norms to stick it out.

Technically speaking the queue to join is not the shortest one, or the one with the where there are the smallest number of individual items that need to be scanned, or the one with the fastest operative – it is the queue with the smallest load – the cumulative product of the number of items and cycle time of the operative. Hence our quick mental calculation of length of queue * average size of trollies * speed of operative.  Even then it can go wrong if someone throws a spanner in – such as picking up the only item on the shelf with a missing barcode – triggering the need to call a “supervisor”!

Are we completely powerless in this process? Not at all – we each can ensure all our purchases have barcodes and we can also influence the cycle time of the operative. Observe what they are doing – picking up each item in turn, finding the bar code, and turning the item so that the bar code can be easily scanned by the computer.  To shorten the cycle time all we have to do is make the work for the operative as easy as possible by placing each item on the moving belt in the correct orientation and spaced so that the speed of the belt delivers the items at the same rate that the operative can scan.  This sounds counter-intuitive but it works!  It is just like the variable speed limits on some motorways – by slowing down you get there faster because the flow is smoother – there is less “turbulence” created.

There are two potential flaws in this counter-intuitive strategy though – the people in the queue behind you may start “tutting” because they believe you are playing childish games and slowing the process down (which is incorrect but we are social animals and we copy other people’s behaviour and react to “social deviants”).  The other flaw is that, if I am shopping alone I cannot both stream my purchases for optimal scanning and also pack my scanned purchases into my reusable shopping bag!  So, I may only be able to use this strategy when accompanied by a trained assistant and have access to my fast getaway car!  Of course I might get even more radical – and offer to stream the shopping for the person in front of me while they pack their scanned items. But that would mean that we work together to achieve a common goal – to reduce the (life)time we all spend waiting in the shopping queue. This way we do not need an assistant or a getaway car and shopping might even become more sociable.  Everyone wins. What everyone? How is that possible?

Can We See the Wood for the Trees?

“The Map is not the Territory” but it is a very useful because it provides a sense of perspective; the bigger picture; where you are; and what you would need to do to get from A to B.  A map can also provide the the fine detail, they way-points on your journey, and what to expect to see along the way.  I remember the first computer programs that would find a route from A to B for me and present it as a printed recipe for the journey; how far it was and, best of all, how long it would take – so I knew when to set off to be reasonably confident I could arrive on time.  Of course, there might always be unexpected holdups along the way but it was a big step forward. One problem was using the recipe as I drove, and another was when I accidently took a wrong turn, which is easy in unfamiliar surroundings with only a list of instructions to go by.  If I came off the intended track I would get lost – so I still needed the paper map as a backup. The trouble now was I did not alwasy know where I was on the map – because I was lost.  Two steps forward and one step backwards.  Now we have Google Maps and we can see what we will actually see on the way – before we even leave home!  And with SatNav we can get this map-reading-and-route-planning done for us in real time so if we choose to, are forced to, or accidentially take a wrong turn it can get us back-on-track. The days of heated debate between the map reader and the map needer have gone and it seems the only need we have for a map now is as a backup if the SatNav breaks down. (This did happen to me once, I didn’t have a map in the car and the only information I had was the postcode of my destination. I was pressed for time so I drove around randomly until I passed a shop that sold SatNavs and bought a new/spare one – entered the postcode and arrived at my intended destination just in time!).

So is the map dead?  Not at all – the value of a map in providing a sense of perspective, context and location is just as useful as ever. And there are many sorts of maps apart from the static, structural, geographical maps ones we are used to.  The really exciting maps are the dynamic ones – the functional maps.  These are maps that show how things are working and flowing, not only where they are.  Imagine if your SatNav had both a static map and was able to access a real time dynamic map of traffic flow. Just think how much more useful it could be? However, to achieve that implies that each person on the road would have to contribute both their position and their intended destination to a central system – isn’t that Big Brother back. Air traffic control (ATC) systems have done this for years for a very good reason: aeroplanes full of passengers are perishable goods – they can’t land anywhere they like and they can’t stay up there waiting to land for ever.  You can’t afford to have traffic jams with aeroplanes – so every pilot has to file a flight plan and will only be given ATC clearance to take off if their destination is capable of offering them a landing slot in an acceptable time frame – i.e. before the plane runs out of fuel! Static maps will always be needed to provide us with a sense of perspective – and in the future dynamic maps will revolutionise the way that we do everything – but only if we are prepared to behave collectively and share our data.  We want to see the wood, the trees and even the breeze through the leaves!

What Happens if We Cut the Red Tape?

Later in his career, the famous artist William Heath-Robinson (1872-1944) created works of great ingenuity that showed complex inventions that were created to solve real everyday problems.  The genius of his work was that his held-together-with-string contraptions looked comically plausible. This genre of harmless mad-inventorism has endured, for example as the eccentric Wallace and Grommet characters.

The problem arises when this seat-of-the-pants incremental invent-patch-and-fix approach is applied to real systems – in particular a healthcare system. We end up with the same result – a Heath-Robinson contraption that is held together with Red Tape.

The complex bureaucracy both holds the system together and clogs up the working – and everyone knows it. It is not harmless though – it is expensive, slow and lethal.  How then do we remove the Red Tape to allow the machine to work more quickly, more safely and more affordably – without the whole contraption falling apart?

A good first step would be to stop adding yet more Red Tape. A sensible next step would be to learn how to make the Red Tap redundant before removing it. However, if we knew how to do that already we would not have let the Red Tapeworms infest our healthcare system in the first place!  This uncomfortable conclusion raises some questions …

What insight, knowledge and skill are we missing?
Where do we need to look to find the skills we lack?
Who knows how to safely eliminate the Red Tapeworms?
Can they teach the rest of us?
How long will it take us to learn and apply the knowledge?
Why might we justify continuing as we are?
Why might we want to maintain the status quo?
Why might we ignore the symptoms and not seek advice?
What are we scared of? Having to accept some humility?

That doesn’t sound like a large price to pay for improvement!

Are we Stuck in a Toxic Emotional Waste Swamp?

Have you ever had the uncomfortable experience of joining a new group of people and discovering that your usual modus operandi does not seem to fit?  Have you ever experienced the pain of a behavioural expectation mismatch – a clash of culture? What do we do when that happens? Do we keep quiet, listen and try to work out the expected behaviours by observing others and then mimic their behaviour to fit in? Do we hold our ground, stay true to our norms and habits and challenge the group? Do we just shrug, leave and not return?

The other side of this common experience is the effect on the group of a person who does not match the behavioural norms of the group.  Are they regarded as a threat or an opportunity? Usually a threat. But a threat to whom? It depends. And it primarily depends on the emotional state of the chief, chair or boss of the group – the person who holds the social power. We are social animals and we have evolved over millions of years to be hard-wired to tune in to the emotional state of the pack leader – because it is a proven survival strategy!

If the chief is in a negative emotional state then the group will be too and a newcomer expressing a positive emotional outlook will create an emotional tension. People prefer leaders who broadcast a positive emotional state because it makes them feel happier; and leaders are attracted by power – so in this situation the chief will perceive a challenge to the balance of power and will react by putting the happy newcomer firmly in their place in the pecking order. The group observe the mauling and learn that a positive emotional attitude is an unsuccessful strategy to gain favour with the chief – and so the status quo is maintained. The toxic emotional waste swamp gets a bit deeper, the sides get a bit more slippery, and the emotional crocodiles who lurk in the murk get a tasty snack. Yum yum – that’ll teach you to be happy around here!

If the chief has a uniformly positive emotional approach then the group will echo that and a newcomer expressing a negative emotional state creates a different tension. The whole group makes it clear that this negative behaviour is unwelcome – they don’t want someone spoiling their cosy emotional oasis! And the status quo is maintained again. Unfortunately, the only difference between this and the previous example is that this only-happy-people-allowed-here group is drowning in emotional treacle rather than emotional turds. It is still an emotional swamp and the outcome is the same – you get stuck in it.

This either-or model is not a successful long-term strategy because it does not foster learning – it maintains the status quo – tough-minded or touch-feely – pessimistic or optimistic – but not realistic.

Effective learning only happens when the status quo is challenged in a way that respects both the power and authority of the chief and of the group – and the safest way to do that is to turn to reality for feedback and to provide the challenge to the group.  To do this in practice requires a combination of confidence and humility by both the chief and the group: the confidence to reject complacency and to face up to reality and the humility to employ what is discovered to keep moving on, to keep learning, to keep improving.

Reality will provide both positive and negative feedback (“Nuggets” and “Niggles”) and the future will hold both positive and negative challenges (“Nice-Ifs” and “Noo-Noos”).  Effective leaders know this and are able to maintain the creative tension. For those of us who are learning to be more effective leaders perhaps the routes out of our Toxic Emotional Waste Swamps are drawn on our 4N charts?

Is this Second Nature or Blissful Ignorance?

Four stages of learningI haven’t done a Post-It doodle for a while so here is one of my favourites that I was reminded of this week.  Recently my organisation has mandated that we complete a 360-feedback exercise – which for me generated some anxiety – even fear. Why? What am I scared of? Could it be that I am unconsciously aware that there are things I am not very good – I just don’t know what they are – and by asking for feedback I will become painfully aware of my limitations? What then? Will I able to address those weaknesses or do I have to live with them? And even more painful to consider; what if I believed I was good at something because I have been doing it so long it has become second nature – and I discover that what I was good at is not longer appropriate or needed? Wow! That is not going to feel much fun.  I think I’ll avoid the whole process by keeping too busy to complete the online questionnaire.  That strategy did not work of course – a head-in-the-sand approach often doesn’t.  So I completed it and await my fate with trepidation.

The model of learning that I have sketched is called the Conscious-Competence model or – as I prefer to call it – Capability Awareness.  We all start bottom left – not aware of our lack of capablity – let’s call that Blissful Ignorance.  Then something happens that challenges our complacency – we become aware of our lack of capability – ouch! That is Painful Awareness.  From there we have three choices – retreat (denial), stay where we are (distress) or move forward (discovery).  If we choose the path of discovery we must actively invest time and effort to develop our capability to get to the top right position – where we are aware of what we can do – the state of Know How.  Then as we practice or new capability and build our experience we gradually become less aware of out new capability – it becomes Second Nature.  We can now do it without thinking – it becomes sort of hard-wired.  Of course, this is a very useful place to get to: it does conceal a danger though – we start to take our capability for granted as we focus our attention on new challenges. We become complacent – and as the world around us is constantly changing we may be unaware our once-appropriate capability may be growing less useful.  Being a wizard with a set of log-tables and a slide-rule became an unnecessary skill when digital calculators appeared – that was fairly obvious.  The silent danger is that we slowly slide from Second-Nature to Blissful-Ignorance; usually as we get older, become more senior, acquire more influence, more money and more power.  We now have the dramatic context for a nasty shock when, as a once capable and respected leader, we suddenly and painfully become aware of our irrelevance. Many leaders do not survive the shock and many organisations do not survive it either – especially if a once-powerful leader switches to self-justifying denial and the blame-others behaviour.

To protect ourselves from this unhappy fate just requires that we understand the dynamic of this deceptively simple model; it requires actively fostering a curious mindset; it requires a willingness to continuously challenge ourselves; to openly learn from a wide network of others who have more capability in the area we want to develop; and to be open to sharing with others what we have learned.  Maybe 360 feedback is not such a scary idea?

Are we SELFish enough?

Improvement is selfish behaviour because if I improve (win) it must be at the detriment (lose) of someone else, surely? Ergo – improvement is not an attractive behaviour because we don’t like to be regarded as selfish by others.  What assumptions are driving this conclusion? The obvious one is the zero-sum-game assumption – that if I improve (win) then everyone else must deteriorate (lose).  The Laws of Conservation give us this idea – energy is conserved, momentum is conserved, money is conserved (that’s what accountants are for – to balance the accounts). But do the Laws of Conservation also apply to qualitative measures such as happiness, fun, curiosity, sadness, anger, fear?  If I am having fun does that imply that someone else must be angry?  Our intuition suggests “no” – if we can both be having fun and we can both be angry then the Laws of Conservation does not apply to qualitative measures siuch as feelings.  Therefore, if we focus attention on qualitative improvement then we can be selfish so long as we conciously abandon the Win-Lose constraint and consciously adopt the Win-Win goal.  Selfishness is OK if your goal is qualitative improvement for everyone.  Win-Win-Win.

Sounds great! The trouble is when we look around us we don’t seem to see the Win-Win-Win principle in action very often. What’s missing? Our quantitative measures obey the Conservation Laws, our qualitative measures do not so maybe we are confusing the two somewhere? What measure can be viewed as both qualitative and quantitative? Time maybe? Time is a definitely a quantitative metric and “Time is Money” is a familiar phrase that equates these two quantities. When it is MY time we are referring to it feels different and “Quality of Life” is a phrase that springs to mind.  So is that where I am confusing quality and quantity? When I am talking about my time and my life – my lifetime.  Is it OK for me to be selfish with my life-time so long as the goal is a Win-Win-Win one?

But Why?

Just two, innocent-looking, three-letter words.

So what is the big deal? If you’ve been a parent of young children you’ll recognise the feeling of desperation that happens when your pre-schooler keeps asking the “But why?” question. You start off patiently attempting to explain in language that you hope they will understand, and the better you do that the more likely you are to get the next “But why?” response. Eventually you reach the point where you’re down to two options: “I don’t know!” or “Just because!”.  How are you feeling now about yourself and your young interrogator?

The troublemaker word is “but”. A common use of the word “but” in normal conversation is “Yes … but …” such as in “I hear what you are saying but …”.

What happens inside your head when you hear that?  Does it niggle? Does the red mist start to rise?

Used in this way the word “but” reveals a mental process called discounting – and the message that you registered unconsciously is closer to “I don’t care about you and your opinion, I only care about me and my opinion and here it comes so listen up!”.  This is a form of disrespectful behaviour that often stimulates a defensive response – even an argument – which only serves to further polarise the separate opinions, to deepen the mutual disrespect, and to erode trust.

It is a self-reinforcing negative-outcome counter-productive behaviour.

The trickster word is “why?”  When someone asks you this open-ended question they are often just using it as a shortcut for a longer series of closed, factual questions such as “how, what, where, when, who …”.  We are tricked because we often unconsciously translate “why?” into “what are your motives for …” which is an emotive question and can unconsciously trigger a negative emotional response. We then associate the negative feeling with the person and that hardens prejudices, erodes trust, reinforces resistance and fuels conflict.

My intention in this post is only to raise conscious awareness of this niggle.

If you are curious to test this youself – try consciously tuning in to the “but” and “why” words in conversation and in emails.  See if you can consciously register your initial emotional response – the one that happens in the split second before your conscious thoughts catch up. Then ask youself the question “Did I just have a positive or a negative feeling?

Why Do We Need Two Ears?

What a curious question! We can hear almost just as well with one ear as two so that is not the reason. Our glasses would fall off obviously though ears evolved long before glasses so that’s probably not the reason.  Just in case we lose one ear by accident? That sounds reasonable but then why don’t we have a have a spare heart or spare brain too – they are more critical organs? Physiologists will explain that we need two ears to accurately determine the direction that a sound is coming from – and we do that by detecting very slight differences between what one ear hears compared with the other. What a neat bit of biodesign! So what relevance does this have for Improvement Science?  Well, to improve a process or system we need to listen to two separate voices – the Voice of the Customer (VoC) and the Voice of the Process (VoP) – and if we compare them the slight difference points us in the direction of improvement. The problem is, when there is a big difference between the two sounds they will interfere with each other and we cannot hear either clearly. In that situation we adopt a policy of selective deafness – some of us choose the Voice of the Process because it can be measured objectively; and some of us choose the Voice of the Customer.  The outcome is disagreement because we are hearing different things. Confusion becomes conflict.

With this insight one way out of this impasse might be for everyone to use both ears alternately: everyone listening to the Voice of the Customer for a while and then everyone changing channel and listening to the Voice of the Process for a while, and back again.  The direction of improvement would become visible and the steps needed to align the Two Voices would emerge naturally.  The Two Voices are trying to tell us something and we only need to learn to tune into both of them. When the Two Voices match we hear harmony not cacophony!

To Push or Not to Push? Is that the Question?

Improvement implies change;

… change implies learning;

… learning implies asking questions;

… and asking questions implies listening with both humility and confidence.

The humility of knowing that their are many things we do not yet understand; and the confidence of knowing that there are many ways we can grow our understanding.

Change is a force – and when we apply a force to a system we meet resistance.

The natural response to feeling resistance is to push harder; and when we do that the force of resistance increases. With each escalation the amount of effort required for both sides to maintain the stalemate increases and the outcome of the trial is decided by the strength and stamina of the protagonists.

One may break, tire or give up …. eventually.

The counter-intuitive reaction to meeting resistance is to push less and to learn more; and it is more effective strategy.


We can observe this principle in the behaviour of a system that is required to deliver a specific performance – such as a delivery time.  The required performance is often labelled a “target” and is usually enforced with a carrot-flavoured-stick wrapped in a legal contract.

The characteristic sign on the performance chart of pushing against an immovable target is the Horned Gaussian – the natural behaviour of the system painfully distorted by the target.

Our natural reaction is to push harder; and initially we may be rewarded with some progress.  And with a Herculean effort we may actually achieve the target – though at what cost?

Our front-line fighters are engaged in a never-ending trial of strength, holding back the Horn that towers over them and that threatens to tip over the target at any moment.

The effort, time, and money expended is out of all proportion to the improvement gained and just maintaining the status quo is exhausting.

Our unconscious belief is that if we weather the storm and push hard enough we will “break” the resistance, and after that it will be plain sailing. This strategy might work in the affairs of Man – it doesn’t work with Nature.

We won’t break the Laws of Nature by pushing harder. They will break us.

So, consider what might happen if we did the opposite?

When we feel resistance we pull back a bit; we ask questions; we seek to see from the opposite perspective and to broaden our own perspective; we seek to expand our knowledge and to deepen our understanding.

When we redirect our effort, time and money into understanding the source of the resistance we uncover novel options; we get those golden “eureka!” moments that lead to synergism rather than to antagonism; to win-win rather than lose-lose outcomes.

Those options were there all along – they were just not visible with our push mindset.

Change is a force – so “May the 4th be with you“.

Can We See a Story in the Data?

I often hear the comments “I cannot see the wood for the trees”, “I am drowning in an ocean of data” and “I cannot identify the cause of the problem”.  We have data, we know there is a problem and we sense there is a soluton; the gap seems to be using the data to find a solution to the problem.

Most quantitative data is presented as tables of columns and rows of numbers; and is indigestable by the majority of people.  Numbers are a recent invention on a biological timescale and we have not yet evolved to effortlessly process data presented in that format. We are visual animals and we have evolved to be very good at seeing patterns in pictures – because it was critical to survival.  Another recent invention is spoken language and, long before writing was invented, accumulated knowledge and wisdom was passed down by word of mouth as legends, myths and stories. Stories are general descriptions that suggest specific solutions. So why do we have such difficulty in extracting the story from the data? Perhaps it is because we use our ears to hear stories that are communicated in words and we use our eyes to see patterns in pictures.  Presenting quantitative data as streams of printed symbols just doesn’t work as well.  To see the story in the data we need to present it as a picture and then talk about what we perceive.

Here are some data – a series of numbers recorded over a period of time – what is the story?

47, 55, 40, 52, 55, 70, 60, 43, 51, 41, 73, 73, 79, 89, 83, 86, 78, 85, 71, 70

Here is the same data converted into a picture.  You can see the message in the data … something changed between measurement 10 and 11.  The chart does not tell us why it changed – it only tells us when it happened and sugegsts what to look for – anything that is capable of causing the effect we can see.  We now have a story and our curiosity is aroused. We want an explanation; we want to understand; we want to learn; and we want to improve.  (For source of data and image visit www.valuesystemdesign.com).

A picture can save a thousand words and ten thousand numbers!

What is the Quickest way to Paralyse a System?

Create confusion by introducing a new factor that the system has little experience of how to manage. And to get the message to spread make it really scary; life-threatening-for-innocent-bystanders-scary; because bad news travels faster than good news. What happens next is predictable; a safety alarm goes off, someone hits the brakes and everything stops. We need time to focus on the new factor, to observe it, investigate it, work out what it is, how it behaves and what to do. We have switched from doing to learning. There is a perfect example of this principle operating on a global scale as I write – a volcano in Iceland that has been dormant since 1821 suddenly spews a cloud of dust high into the sky. There are volcanic eruptions all the time so why is this different? Well, because of a combination of factors that when they combine creates a BIG system-wide impact. First the location of the volcano – on the north-west corner of Europe; then the weather – the prevailing winds are carrying the volcanic plume south and east over the whole of Europe; then the effect – to create a hazard for high altitude commercial jets. Europe is one of the most congested airspaces in the world with around 28,000 flights per day – mostly short haul – but the large European hubs serve as the end points of the trans-global long haul routes. If you want to paralyse global air travel for a completely reversible yet uncontrollable and unpredictable length of time then you probably couldn’t come up with a better plan! The trouble is that the longer the paralysis persists the greater and more irreversible the long term damage. Air travel is an essential component of many industries; so loss of flying capacity not only means loss of revenue and increased costs for airlines – the effects will be felt in every corner of commerce. What triggered this chaos was not just a volcano – it required something else – fear of the unknown. Limited, accidental experience of the interaction of high altitude volcanic plumes and commercial jets shows that all the engines of the jet can shut down – clogged by the volcanic ash. Not an attractive option for anyone. The problem is we simply do not know what the limits of safety are? We are on the horns of an uncomfortable dilemma. The experts and the press who normally feed off each other are uncharacteristically quiet at the moment … everyone is watching, waiting and hoping it will just blow away and we can get back to normal. It won’t and we can’t. Our worldview has just been changed and there is no going back – we have to evolve.

Update 25/04/2010 – I got stranded abroad for a week. It could have been much worse and what was interesting to observe was how the situation was managed. After the initial shock everyone just watched and waited. After a few days it was clear that the problem wasn’t just blowing away. The airlines were haemorrhaging money and were forced to act – by testing if the fear of engine failure was justified. It appeared not to be. A reduction in the volcanic ash being generated, and a shift of the wind, and increasing confidence led to flight activity begin resumed after 7 days. Long before the Authorities could gain any meaningful “scientific” data. The current tasks are to sort out the backlog of displaced passengers; find someone to blame and to sue for compensation. If past behaviour is anything to go by the Authorities will be blamed and the Taxpayers will pick up the bill.  Have we learned anything of lasting benefit from this experience? If not then the same lesson will be repeated; sometime, somewhere, somehow – until we do.

Are your Targets a Pain in the #*&!?

If your delivery time targets are giving you a pain in the #*&! then you may be sitting on a Horned Gaussian and do not realise it. What is a Horned Gaussian? How do you detect one? And what causes it?  To establish the diagnosis you need to gather the data from the most recent couple of hundred jobs and from it calculate the interval from receipt to delivery. Next create a tally chart with Delivery Time on the vertical axis and Counts on the horizontal axis; mark your Delivery Time Target as a horizontal line about two thirds of the way up the vertical axis; draw ten equally spaced lines between it and the X axis and five more above the Target. Finally, sort your delivery times into these “bins” and look at the profile of the histogram that results. If there is a clearly separate “hump” and “horn” and the horn is just under the target then you have confirmed the diagnosis of a Horned Gaussian. The cause is the Delivery Time Target, or more specifically its effect on your behaviour.  If the Target is externally imposed  and enforced using either a reward or a punishment then when the delivery time for a request approaches the Target, you will increase the priority of the request and the job leapfrogs to the front of the queue, pushing all the other jobs back. The order of the jobs is changing and in a severe case the large number of changing priorities generates a lot of extra work to check and reschedule the jobs.  This extra work exacerbates the delays and makes the problem worse, the horn gets taller and sharper, and the pain gets worse. Does that sound a familiar story? So what is the treatment? Well, to decide that you need to create a graph of delivery times in time order and look at the pattern (using charting tool such as BaseLine© www.valuesystemdesign.com makes this easier and quicker). What you do depends on what the chart says to you … it is the Voice of the Process.  Improvement Science is learning to understand the voice of the process.

Are We in Heated Agreement?

Do you ever feel that during a heated debate you are actually arguing the same point? You are in agreement, or rather “heated agreement”. Why does that happen and how can you distinguish this from an real disagreement? Some years ago I came across the concept of “worldviews” while looking for guidance on managing conflict. The idea is that two different people can look at the same thing and see something different; or rather perceive something different. The apparent difference leads to the debate or argument, which if carried to its conclusion demonstrates the zones of both agreement and difference.  When this is done both protagonists can learn from each other and expand their worldviews and their common ground.  If the debate never takes place then their views remain polarised, no exchange happens, no learning takes place and the common ground does not grow. So is heated debate a good thing? Well it depends on the outcome you want.  If you want to improve, learn, change and expand your perspective then “yes”; if you want to change someone else’s opinion to match yours then “no”.  Improvement implies change; change imples learning; and learning implies an altered perspective.  So engaging in heated debate and achieving heated agreement is a sensible improvement strategy!

Am I in a Battle or a Race?

Do you see the challenges that Life presents to you as a series of fight-to-the-death battles or a series of stretch-for-the-finish races? Why does it matter which approach you choose? After all, each has a winner and a loser. Yes, one wins relative to other – but what is the absolute cost for both?  The doodle illustrates the point visually. In a Battle you are in opposition and your effort, time and money are spent and dissipated against each other.  The strong/angry/big will prevail over the weak/timid/small though when the protagnoists are closely matched the outcome takes longer to decide and costs more in absolute terms for both.  One will eventually win while both are weakened from the effort, time and money that is spent.  Contrast this with the race; the investment on both sides is in preparing for the race; in learning, training, and improving.  On the day of the race the more fit/focussed/skilled competitor will win yet both are strengthened from the invested effort, time and money.  In a race the more closely you are matched the more you both improve and get stronger and the quicker the outcome is decided. Exactly the opposite of the battle. It appears that Life will present us with enough new challenges to keep us occupied for the forseeable future; and to rise to those challenges will require that we all learn, train, and practice so that we have the strength, skills and stamina for the challenges we will encounter and cannot yet see.  So, it seems to me to be suicidal to choose to battle with each other and to waste our limited resources of effort, time and money to the point where we are all too weak to survive the inevitable challenges that are over the horizon.  So how would you know which approach you are using?  Well, your feelings are more often sadness, anger or fear then you are probably using the battle metaphor; if in contrast they are feelings of confidence, determination and excitement then you probably see yourself in a race.  The choice is yours.

Delusional Ratios and Arbitrary Targets

This week a friend of mine shared an interesting story.

They were told that their recent performance data showed that performance was improving. “That sounds good” they thought as they started to look at the data which was presented as a table of numbers, one number per time period, as a percentage ratio, and colour coded red, amber or green. The last number in the sequence was green; the previous ones were either red or amber. “See! Our performance has improved and is now acceptable“.

But it did not feel quite right to my friend who did not want to dampen the celebration without good reason, so enquired further “What is the ratio measuring exactly?” “H’mm, let me check, the number of failures divided by the number of customer requests.”  “And what does the red, amber and green signify?” “Oh that’s easy, whether we are above, near or below our target.” “And how was the target set and by whom?” “Um, I don’t know how it was set, we were just told what the target is and the consequences if we don’t meet it.” “And what are the consequences?” No answer – just a finger-across-the-throat gesture.  “Can I see the raw data used to calculate this ratio?” “Eh? I think so, but no one has ever asked us for that before.

My friend could now see the origin of his niggle of doubt.  The raw data showed that the number of customer requests was falling progressively over time while the number of successful requests was not changing.  They were calculating failures from the difference between demand and activity and then dividing the result by the demand to give a percentage that was intended to show their performance. And then setting an arbitrary target for acceptability.

The raw data told a very different story – their customers were going elsewhere – which meant their future income was progressively walking away.  They were blind to it; their ratio was deluding them.

And by setting an arbitrary target for this “delusional ratio” implied that so long as they were “in the green” they didn’t need to do anything, they could sit back and relax. They could not see the nasty surprise coming.

This story led me to wonder how many organsiations get into trouble by following delusional ratios linked to arbitrary targets? How many never see the storm coming until it is too late to avoid it?  Where do these delusional ratios and arbitrary targets come from?  Do they have a valid and useful purpose? And if so, how do we know when to use a ratio or a target and when not to?

It also gave me a new acronym – D.R.A.T. – which seems rather appropriate.

What is the Dis-Ease?

Dis-EaseDo you ever go into places where there is a feeling of uneasiness?

You can feel it almost immediately – there is something in the room that no one is talking about.

An invisible elephant in the room, a rotting something under the table.

This week I have been pondering the cause of this dis-ease and my eureka moment happened while re-reading a book called “The Speed of Trust” by Stephen R. Covey.

A common elephant-in-the-room appears to be distrust and this got me thinking about both the causes of distrust and the effects of distrust.  My doodle captures the output of my musing.  For me, a potent cause of distrust is to be discounted; and discounting comes from disrespect.  This can happen both within yourself and between yourself and others. If you feel un-trust-worthy then you tend to disengage; and by disengaging the system functions less well – it becomes dysfunctional.  Dysfunction erodes respect and so on around the vicious circle.

This then led me to the question: Why haven’t we all drowned in our own distrust by now?  I believe what happens is that we reach an equilibrium where our level of trust is stable; so there must be a counteracting trust-building force that balances the trust-eroding force. That trust-building force seem to comes from our day-to-day social interactions with others.

The Achilles Heel of negative-cause-effect circles is that you can break into them at many points to sap their power and reduce their influence.  So, one strategy might be to identify the Errors of Commission that create the Disease of Distrust.

Consider the question: “If I have developed a high level of trust then what could I do to erode it as quickly as possible?”.

Disrespectful attitude and discounting behaviour would be all that is needed to start the vicious downward spiral of distrust disease.

Who of us never disrespects or discounts others?

Are we all infected with the same disease?

Is there a cure or can we only expect to hold it in remission?

How can we strengthen our emotional immune systems and neutralise the infective agents of the Disease of Distrust?

Do we just need to identify and stop our trust eroding behaviour?

That would be a start.

Can the Finance tail wag the Quality dog?

Money is the “fuel” that all organisations need to survive because all endeavours incur costs. It is the flow of money that is important – static money is just a number.  Money is used to buy time – more specifically LIFE-time.  We trade our life-time for money which we then use to buy the goods and services that we need to survive in the modern world.  These goods and services are delivered by processes that require people’s time to design, implement, operate and improve.  So we all want the best value-for-money that we can get; the best value-for-lifetime. So what happens when the flow of money is constrained? Value, Lifetime and Money are interdependent – restrict the flow of any of the three and all three slow down. It is inevitable. With this perspective it does appear that the finance tail can wag the quality dog; and the lifetime tail can wag the quality dog too. So when you experience low quality goods or services try asking this question: “Is it the flow of money, motivation or both that is the root cause?” Stories please ….

The Effect of Feedback?

Feedback?I find that I have to draw pictures when I am thinking – it seems to help.

One thing I have been thinking about this week is how to predict the outcome of an action; because I don’t want to do something that has a negative outcome that I did not anticipate.

I know that whatever I do will change the “system” and may have an ongoing effect that may be positive and negative; and once I have set the ball rolling even reversing my action may not change the course.

So the problem I have is this: although I can work out what I feel is the best thing to do now, I do not seem to be able to predict the knock-on effects of my actions.  I know from experience that I may be the recipient of the future effect of my actions today. I will get feedback one way or the other.

So how do we work out what is the best thing to do now? How do we get good feedback?