From Push to Pull

One of the most frequent niggles that I hear from patients is the difficultly they have getting an appointment with their general practitioner.  I too have personal experience of the distress caused by the ubiquitous “Phone at 8AM for an Appointment” policy, so in June 2018 when I was approached to help a group of local practices redesign their appointment booking system I said “Yes, please!


What has emerged is a fascinating, enjoyable and rewarding journey of co-evolution of learning and co-production of an improved design.  The multi-skilled design team (MDT) we pulled together included general practitioners, receptionists and practice managers and my job was to show them how to use the health care systems engineering (HCSE) framework to diagnose, design, decide and deliver what they wanted: A safe, calm, efficient, high quality, value-4-money appointment booking service for their combined list of 50,000 patients.


This week they reached the start of the ‘decide and deliver‘ phase.  We have established the diagnosis of why the current booking system is not delivering what we all want (i.e. patients and practices), and we have assembled and verified the essential elements of an improved design.

And the most important outcome for me is that the Primary Care MDT now feel confident and capable to decide what and how to deliver it themselves.   That is what I call embedded capability and achieving it is always an emotional roller coaster ride that we call The Nerve Curve.

What we are dealing with here is called a complex adaptive system (CAS) which has two main components: Processes and People.  Both are complicated and behave in complex ways.  Both will adapt and co-evolve over time.  The processes are the result of the policies that the people produce.  The policies are the result of the experiences that the people have and the explanations that they create to make intuitive sense of them.

But, complex systems often behave in counter-intuitive ways, so our intuition can actually lead us to make unwise decisions that unintentionally perpetuate the problem we are trying to solve.  The name given to this is a wicked problem.

A health care systems engineer needs to be able to demonstrate where these hidden intuitive traps lurk, and to explain what causes them and how to avoid them.  That is the reason the diagnosis and design phase is always a bit of a bumpy ride – emotionally – our Inner Chimp does not like to be challenged!  We all resist change.  Fear of the unknown is hard-wired into us by millions of years of evolution.

But we know when we are making progress because the “ah ha” moments signal a slight shift of perception and a sudden new clarity of insight.  The cognitive fog clears a bit and a some more of the unfamiliar terrain ahead comes into view.  We are learning.

The Primary Care MDT have experienced many of these penny-drop moments over the last six months and unfortunately there is not space here to describe them all, but I can share one pivotal example.


A common symptom of a poorly designed process is a chronically chaotic queue.

[NB. In medicine the term chronic means “long standing”.  The opposite term is acute which means “recent onset”].

Many assume, intuitively, that the cause of a chronically chaotic queue is lack of capacity; hence the incessant calls for ‘more capacity’.  And it appears that we have learned this reflex response by observing the effect of adding capacity – which is that the queue and chaos abate (for a while).  So that proves that lack of capacity was the cause. Yes?

Well actually it doesn’t.  Proving causality requires a bit more work.  And to illustrate this “temporal association does not prove causality trap” I invite you to consider this scenario.

I have a headache => I take a paracetamol => my headache goes away => so the cause of my headache was lack of paracetamol. Yes?

Errr .. No!

There are many contributory causes of chronically chaotic queues and lack of capacity is not one of them because the queue is chronic.  What actually happens is that something else triggers the onset of chaos which then consumes the very resource we require to avoid the chaos.  And once we slip into this trap we cannot escape!  The chaos-perpretuating behaviour we observe is called fire-fighting and the necessary resource it consumes is called resilience.


Six months ago, the Primary Care MDT believed that the cause of their chronic appointment booking chaos was a mismatch between demand and capacity – i.e. too much patient demand for the appointment capacity available.  So, there was a very reasonable resistance to the idea of making the appointment booking process easier for patients – they justifiably feared being overwhelmed by a tsunami of unmet need!

Six months on, the Primary Care MDT understand what actually causes chronic queues and that awareness has been achieved by a step-by-step process of explanation and experimentation in the relative safety of the weekly design sessions.

We played simulation games – lots of them.

One particularly memorable “Ah Ha!” moment happened when we played the Carveout Game which is done using dice, tiddly-winks, paper and coloured-pens.  No computers.  No statistics.  No queue theory gobbledygook.  No smoke-and-mirrors.  No magic.

What the Carveout Game demonstrates, practically and visually, is that an easy way to trigger the transition from calm-efficiency to chaotic-ineffectiveness is … to impose a carveout policy on a system that has been designed to achieve optimum efficiency by using averages.  Boom!  We slip on the twin banana skins of the Flaw-of-Averages and Sub-Optimisation, slide off the performance cliff, and career down the rocky slope of Chronic Chaos into the Depths of Despair – from which we cannot then escape.

This visual demonstration was a cognitive turning point for the MDT.  They now believed that there is a rational science to improvement and from there we were on the step-by-step climb to building the necessary embedded capability.


It now felt like the team were pulling what they needed to know.  I was no longer pushing.  We had flipped from push-to-pull.  That is called the tipping point.

And that is how health care systems engineering (HCSE) works.


Health care is a complex adaptive system, and what a health care systems engineer actually “designs” is a context-sensitive  incubator that nurtures the seeds of innovation that already exist in the system and encourages them to germinate, grow and become strong enough to establish themselves.

That is called “embedded improvement-by-design capability“.

And each incubator need to be different – because each system is different.  One-solution-fits-all-problems does not work here just as it does not in medicine.  Each patient is both similar and unique.


Just as in medicine, first we need to diagnose the actual cause;  second we need to design some effective solutions; third we need to decide which design to implement and fourth we need to deliver it.

But the how-to-do-it feels a bit counter-intuitive, and if it were not we would already be doing it. But the good news is that anyone can learn how to do HCSE.

The Turkeys Voting For Xmas Trap

One of the quickest and easiest ways to kill an improvement initiative stone dead is to label it as a “cost improvement program” or C.I.P.

Everyone knows that the biggest single contributor to cost is salaries.

So cost reduction means head count reduction which mean people lose their jobs and their livelihood.

Who is going to sign up to that?

It would be like turkeys voting for Xmas.

There must be a better approach?

Yes. There is.


Over the last few weeks, groups of curious skeptics have experienced the immediate impact of systems engineering theory, techniques and tools in a health care context.

They experienced queues, delays and chaos evaporate in front of their eyes … and it cost nothing to achieve. No extra resources. No extra capacity. No extra cash.

Their reaction was “surprise and delight”.

But … it also exposed a problem.  An undiscussable problem.


Queues and chaos require expensive resources to manage.

We call them triagers, progress-chasers, and fire-fighters.  And when the queues and chaos evaporate then their jobs do too.

The problem is that the very people who are needed to make the change happen are the ones who become surplus-to-requirement as a result of the change.

So change does not happen.

It would like turkeys voting for Xmas.


The way around this impasse is to anticipate the effect and to proactively plan to re-invest the resource that is released.  And to re-invest it doing a more interesting and more worthwhile jobs than queue-and-chaos management.

One opportunity for re-investment is called time-buffering which is an effective way to improve resilience to variation, especially in an unscheduled care context.

Another opportunity for re-investment is tail-gunning the chronic backlogs until they are down to a safe and sensible size.

And many complain that they do not have time to learn about improvement because they are too busy managing the current chaos.

So, another opportunity for re-investment is training – oneself first and then others.


R.I.P.    C.I.P.

The Storyboard

This week about thirty managers and clinicians in South Wales conducted two experiments to test the design of the Flow Design Practical Skills One Day Workshop.

Their collective challenge was to diagnose and treat a “chronically sick” clinic and the majority had no prior exposure to health care systems engineering (HCSE) theory, techniques, tools or training.

Two of the group, Chris and Jat, had been delegates at a previous ODWS, and had then completed their Level-1 HCSE training and real-world projects.

They had seen it and done it, so this experiment was to test if they could now teach it.

Could they replicate the “OMG effect” that they had experienced and that fired up their passion for learning and using the science of improvement?

Continue reading “The Storyboard”

The Cream of the Crap Trap

database_transferring_data_150_wht_10400It has been a busy week.

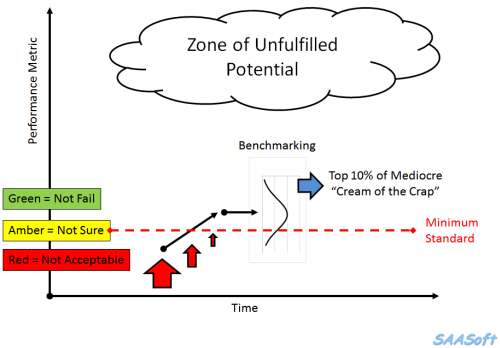
And a common theme has cropped up which I have attempted to capture in the diagram below.

It relates to how the NHS measures itself and how it “drives” improvement.

The measures are called “failure metrics” – mortality, infections, pressure sores, waiting time breaches, falls, complaints, budget overspends.  The list is long.

The data for a specific trust are compared with an arbitrary minimum acceptable standard to decide where the organisation is on the Red-Amber-Green scale.

If we are in the red zone on the RAG chart … we get a kick.  If not we don’t.

The fear of being bullied and beaten raises the emotional temperature and the internal pressure … which drives movement to get away from the pain.  A nematode worm will behave this way. They are not stupid either.

As as we approach the target line our RAG indicator turns “amber” … this is the “not statistically significant zone” … and now the stick is being waggled, ready in case the light goes red again.

So we muster our reserves of emotional energy and we PUSH until our RAG chart light goes green … but then we have to hold it there … which is exhausting.  One pain is replaced by another.

The next step is for the population of NHS nematodes to be compared with each other … they must be “bench-marked”, and some are doing better than others … as we might expect. We have done our “sadistics” training courses.

The bottom 5% or 10% line is used to set the “arbitrary minimum standard target” … and the top 10% are feted at national award ceremonies … and feast on the envy of the other 90 or 95% of “losers”.

The Cream of the Crop now have a big tick in their mission statement objectives box “To be in the Top 10% of Trusts in the UK“.  Hip hip huzzah.

And what has this system design actually achieved? The Cream of the Crap.

Oops!


It is said that every system is perfectly designed to deliver what it delivers.

And a system that has been designed to only use failure and fear to push improvement can only ever achieve chronic mediocrity – either chaotic mediocrity or complacent mediocrity.

So, if we want to tap into the vast zone of unfulfilled potential, and if we want to escape the perpetual pain of the Cream of the Crap Trap … we need a better system design.

And maybe we might need a splash of humility and some system engineers to help us do that.

This week I met some at the Royal Academy of Engineering in London, and it felt like finding a candle of hope amidst the darkness of despair.

I said it had been a busy week!

Fragmentation Cost

figure_falling_with_arrow_17621The late Russell Ackoff used to tell a great story. It goes like this:

“A team set themselves the stretch goal of building the World’s Best Car.  So the put their heads together and came up with a plan.

First they talked to drivers and drew up a list of all the things that the World’s Best Car would need to have. Safety, speed, low fuel consumption, comfort, good looks, low emissions and so on.

Then they drew up a list of all the components that go into building a car. The engine, the wheels, the bodywork, the seats, and so on.

Then they set out on a quest … to search the world for the best components … and to bring the best one of each back.

Then they could build the World’s Best Car.

Or could they?

No.  All they built was a pile of incompatible parts. The WBC did not work. It was a futile exercise.


Then the penny dropped. The features in their wish-list were not associated with any of the separate parts. Their desired performance emerged from the way the parts worked together. The working relationships between the parts were as necessary as the parts themselves.

And a pile of average parts that work together will deliver a better performance than a pile of best parts that do not.

So the relationships were more important than the parts!


From this they learned that the quickest, easiest and cheapest way to degrade performance is to make working-well-together a bit more difficult.  Irrespective of the quality of the parts.


Q: So how do we reverse this degradation of performance?

A: Add more failure-avoidance targets of course!

But we just discovered that the performance is the effect of how the parts work well together?  Will another failure-metric-fueled performance target help? How will each part know what it needs to do differently – if anything?  How will each part know if the changes they have made are having the intended impact?

Fragmentation has a cost.  Fear, frustration, futility and ultimately financial failure.

So if performance is fading … the quality of the working relationships is a good place to look for opportunities for improvement.

Raising Awareness

SaveTheNHSGameThe first step in the process of improvement is raising awareness, and this has to be done carefully.

Most of us spend most of our time in a mental state called blissful ignorance.  We are happily unaware of the problems, and of their solutions.

Some of us spend some of our time in a different mental state called denial.

And we enter that from yet another mental state called painful awareness.

By raising awareness we are deliberately nudging ourselves, and others, out of our comfort zones.

But suddenly moving from blissful ignorance to painful awareness is not a comfortable transition. It feels like a shock. We feel confused. We feel vulnerable. We feel frightened. And we have a choice: freeze, flee or fight.

Freeze is shock. We feel paralysed by the mismatch between rhetoric and reality.

Flee is denial.  We run away from a new and uncomfortable reality.

Fight is anger. Directed first at others (blame) and then at ourselves (guilt).

It is this anger-passion that we must learn to channel and focus as determination to listen, learn and then lead.


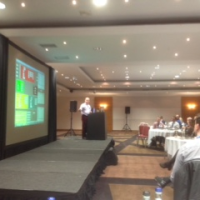
The picture is of a recent awareness-raising event; it happened this week.

The audience is a group of NHS staff from across the depth and breadth of a health and social care system.

On the screen is the ‘Save the NHS Game’.  It is an interactive, dynamic flow simulation of a whole health care system; and its purpose is educational.  It is designed to illustrate the complex and counter-intuitive flow behaviour of a system of interdependent parts: primary care, an acute hospital, intermediate care, residential care, and so on.

We all became aware of a lot of unfamiliar concepts in a short space of time!

We all learned that a flow system can flip from calm to chaotic very quickly.

We all learned that a small change in one part of a system of interdependent parts can have a big effect in another part – either harmful or beneficial and often both.

We all learned that there is often a long time-lag between the change and the effect.

We all learned that we cannot reverse the effect just by reversing the change.

And we all learned that this high sensitivity to small changes is the result of the design of our system; i.e. our design.


Learning all that in one go was a bit of a shock!  Especially the part where we realised that we had, unintentionally, created near perfect conditions for chaos to emerge. Oh dear!

Denial felt like a very reasonable option; as did blame and guilt.

What emerged was a collective sense of determination.  “Let’s Do It!” captured the mood.


puzzle_lightbulb_build_PA_150_wht_4587The second step in the process of improvement is to show the door to the next phase of learning; the phase called ‘know how’.

This requires demonstrating that there is an another way out of the zone of painful awareness.  An alternative to denial.

This is where how-to-diagnose-and-correct-the-design-flaws needs to be illustrated. A step-at-a-time.

And when that happens it feels like a light bulb has been switched on.  What before was obscure and confusing suddenly becomes clear and understandable; and we say ‘Ah ha!’


So, if we deliberately raise awareness about a problem then, as leaders of change and improvement, we also have the responsibility to raise awareness about feasible solutions.


Because only then are we able to ask “Would we like to learn how to do this ourselves!”

And ‘Yes, please’ is what 68% of the people said after attending the awareness raising event.  Only 15% said ‘No, thank you’ and only 17% abstained.

Raising awareness is the first step to improvement.
Choosing the path out of the pain towards knowledge is the second.
And taking the first step on that path is the third.

Measure and Matter

stick_figure_balance_mind_heart_150_wht_9344Improvement implies learning.  And to learn we need feedback from reality because without it we will continue to believe our own rhetoric.

So reality feedback requires both sensation and consideration.

There are many things we might sense, measure and study … so we need to be selective … we need to choose those things that will help us to make the wise decisions.


Wise decisions lead to effective actions which lead to intended outcomes.


Many measures generate objective data that we can plot and share as time-series charts.  Pictures that tell an evolving story.

There are some measures that matter – our intended outcomes for example. Our safety, flow, quality and productivity charts.

There are some measures that do not matter – the measures of compliance for example – the back-covering blame-avoiding management-by-fear bureaucracy.


And there are some things that matter but are hard to measure … objectively at least.

We can sense them subjectively though.  We can feel them. If we choose to.

And to do that we only need to go to where the people are and the action happens and just watch, listen, feel and learn.  We do not need to do or say anything else.

And it is amazing what we learn in a very short period of time. If we choose to.


If we enter a place where a team is working well we will see smiles and hear laughs. It feels magical.  They will be busy and focused and they will show synergism. The team will be efficient, effective and productive.

If we enter place where is team is not working well we will see grimaces and hear gripes. It feels miserable. They will be busy and focused but they will display antagonism. The team will be inefficient, ineffective and unproductive.


So what makes the difference between magical and miserable?

The difference is the assumptions, attitudes, prejudices, beliefs and behaviours of those that they report to. Their leaders and managers.

If the culture is management-by-fear (a.k.a bullying) then the outcome is unproductive and miserable.

If the culture is management-by-fearlessness (a.k.a. inspiring) then the outcome is productive and magical.

It really is that simple.

The Improvement Pyramid

IS_PyramidDeveloping productive improvement capability in an organisation is like building a pyramid in the desert.

It is not easy and it takes time before there is any visible evidence of success.

The height of the pyramid is a measure of the level of improvement complexity that we can take on.

An improvement of a single step in a system would only require a small pyramid.

Improving the whole system will require a much taller one.


But if we rush and attempt to build a sky-scraper on top of the sand then we will not be surprised when it topples over before we have made very much progress.  The Egyptians knew this!

First, we need to dig down and to lay some foundations.  Stable enough and strong enough to support the whole structure.  We will never see the foundations so it is easy to forget them in our rush but they need to be there and they need to be there first.

It is the same when developing improvement science capability  … the foundations are laid first and when enough of that foundation knowledge is in place we can start to build the next layer of the pyramid: the practitioner layer.


It is the the Improvement Science Practitioners (ISPs) who start to generate tangible evidence of progress.  The first success stories help to spur us all on to continue to invest effort, time and money in widening our foundations to be able to build even higher – more layers of capability -until we can realistically take on a system wide improvement challenge.

So sharing the first hard evidence of improvement is an important milestone … it is proof of fitness for purpose … and that news should be shared with those toiling in the hot desert sun and with those watching from the safety of the shade.

So here is a real story of a real improvement pyramid achieving this magical and motivating milestone.


Learning Loops

campfire_burning_150_wht_174[Beep Beep] Bob’s phone reminded him that it was time for the remote coaching session with Leslie, one of the CHIPs (community of healthcare improvement science practitioners). He flipped open his laptop and logged in. Leslie was already there.

<Leslie> Hi Bob.  I hope you had a good Xmas.

<Bob> Thank you Leslie. Yes, I did. I was about to ask the same question.

<Leslie> Not so good here I am afraid to say. The whole urgent care system is in meltdown. The hospital is gridlocked, the 4-hour target performance has crashed like the Stock Market on Black Wednesday, emergency admissions have spilled over into the Day Surgery Unit, hundreds of operations have been cancelled, waiting lists are spiralling upwards and the fragile 18-week performance ceiling has been smashed. It is chaos. Dangerous chaos.

<Bob> Oh dear. It sounds as if the butterfly has flapped its wings. Do you remember seeing this pattern of behaviour before?

<Leslie> Sadly yes. When I saw you demonstrate the Save the NHS Game.  This is exactly the chaos I created when I attempted to solve the 4-hour target problem, and the chaos I have seen every doctor, manager and executive create when they do too. We seem to be the root cause!

<Bob> Please do not be too hard on yourself Leslie. I am no different. I had to realise that I was contributing to the chaos I was complaining about, by complaining about it. Paradoxically not complaining about it made no difference. My error was one of omission. I was not learning. I was stuck in a self-justifying delusional blame-bubble of my own making. My humility and curiosity disabled by my disappointment, frustration and anxiety. My inner chimp was running the show!

<Leslie> Wow! That is just how everyone is feeling and behaving. Including me. So how did you escape from the blame-bubble?

<Bob> Well first of all I haven’t completely escaped. I just spend less time there. It is always possible to get sucked back in. The way out started to appear when I installed a “learning loop”.

<Leslie> A what? Is that  like a hearing loop for the partially deaf?

<Bob> Ha! Yes! A very apt metaphor.  Yes, just like that. Very good. I will borrow that if I may.

<Leslie> So what did your learning loop consist of?

<Bob> A journal.  I started a journal. I invested a few minutes each day reflecting and writing it down. The first entries were short and rather “ranty”. I cannot possibly share them in public. It is too embarrassing. But it was therapeutic and over time the anger subsided and a quieter, calmer inner voice could be heard. The voice of curiosity. It was asking one question over and over again. “How?” … not “Why?”.

<Leslie> Like “How did I get myself into this state?

<Bob> Exactly so.  And also “How come I cannot get myself out of this mess?

<Leslie> And what happened next?

<Bob> I started to take more notice of things that I had discounted before. Apparently insignificant things that I discovered had profound implications. Like the “butterflies wing” effect … I discovered that small changes can have big effects.  I also learned to tune in to specific feelings because they were my warning signals.

<Leslie> Niggles you mean?

<Bob> Yes. Niggles are flashes of negative emotion that signal a design flaw. They are usually followed by an untested assumption, an invalid conclusion, an unwise decision and a counter-productive action. It all happens unconsciously and very fast so we are only aware of the final action – the MR ANGRY reply to the email that we stupidly broadcast via the Reply All button!

<Leslie> So you learned to tune into the niggle to avoid the chain reaction that led to hitting the Red Button.

<Bob> Sort of. What actually happened is that the passion unleashed by the niggle got redirected into a more constructive channel – via my Curiosity Centre to power up the Improvement Engine. It was a bit rusty! It had not been used for a long while.

<Leslie> And once the “engine” was running it sucked in niggles that were now a source of fuel! You started harvesting them using the 4N Chart! So what was the output?

<Bob> Purposeful, focused, constructive, rational actions. Not random, destructive, emotional explosions.

<Leslie> Constructive actions such as?

<Bob> Well designing and building the FISH course is one, and this ISP programme is another.

<Leslie> More learning loops!

<Bob> Yup.

<Leslie> OK. So I can see that a private journal can help an individual to build their own learning loop. How does that work with groups? We do not all need to design and build a FISH-equivalent surely!

<Bob> No indeed. What we do is we share stories. We gather together in small groups around camp fires and we share what we are learning … as we are learning it. We contribute our perspective to the collective awareness … and we all gain from everyone’s learning. We learn and teach together.

<Leslie> So the stories are about what we are learning, not what we achieved with that learning.

<Bob> Well put! The “how” we achieved it is more valuable knowledge than “what” we achieved. The “how” is the process, the “what” is just the product. And the “how” we failed to achieve is even more valuable.

<Leslie> Wow! So are you saying that the chaos we are experiencing is the expected effect of not installing enough learning loops! A system-wide error of omission.

<Bob> I would say that is a reasonable diagnosis.

<Leslie> So a rational and reasonable course of treatment becomes clear.  I am on the case!

Spring the Trap

trapped_in_question_PA_300_wht_3174[Beeeeeep] It was time for the weekly coaching chat.  Bob, a seasoned practitioner of flow science, dialled into the teleconference with Lesley.

<Bob> Good afternoon Lesley, can I suggest a topic today?

<Lesley> Hi Bob. That would be great, and I am sure you have a good reason for suggesting it.

<Bob> I would like to explore the concept of time-traps again because it something that many find confusing. Which is a shame because it is often the key to delivering surprisingly dramatic and rapid improvements; at no cost.

<Lesley> Well doing exactly that is what everyone seems to be clamouring for so it sounds like a good topic to me.  I confess that I am still not confident to teach others about time-traps.

<Bob> OK. Let us start there. Can you describe what happens when you try to teach it?

<Lesley> Well, it seems to be when I say that the essence of a time-trap is that the lead time and the flow are independent.  For example, the lead time stays the same even though the flow is changing.  That really seems to confuse people; and me too if I am brutally honest.

<Bob> OK.  Can you share the example that you use?

<Lesley> Well it depends on who I am talking to.  I prefer to use an example that they are familiar with.  If it is a doctor I might use the example of the ward round.  If it is a manager I might use the example of emails or meetings.

<Bob> Assume I am a doctor then – an urgent care physician.

<Lesley> OK.  Let us take it that I have done the 4N Chart and the  top niggle is ‘Frustration because the post-take ward round takes so long that it delays the discharge of patients who then often have to stay an extra night which then fills up the unit with waiting patients and we get blamed for blocking flow from A&E and causing A&E breaches‘.

<Bob> That sounds like a good example. What is the time-trap in that design?

<Lesley> The  post-take ward round.

<Bob> And what justification is usually offered for using that design?

<Lesley> That it is a more efficient use of the expensive doctor’s time if the whole team congregate once a day and work through all the patients admitted over the previous 24 hours.  They review the presentation, results of tests, diagnosis, management plans, response to treatment, decide the next steps and do the paperwork.

<Bob> And why is that a time-trap design?

<Lesley> Because  it does not matter if one patient is admitted or ten, the average lead time from the perspective of the patient is the same – about one day.

<Bob> Correct. So why is the doctor complaining that there are always lots of patients to see?

<Lesley> Because there are. The emergency short stay ward is usually full by the time the post take ward round happens.

<Bob> And how do you present the data that shows the lead time is independent of the flow?

<Lesley> I use a Gantt chart, but the problem I find is that there is so much variation and queue jumping it is not blindingly obvious from the Gantt chart that there is a time-trap. There is so much else clouding the picture.

<Bob>Is that where the ‘but I do not understand‘ conversation starts?

<Lesley> Yes. And that is where I get stuck too.

<Bob> OK.  The issue here is that a Gantt chart is not the ideal visualisation tool when there are lots of crossed-streams, frequently changing priorities, and many other sources of variation.  The Gantt chart gets ‘messy’.   The trick here is to use a Vitals Chart – and you can derive that from the same data you used for the Gantt chart.

<Lesley> You are right about the Gantt chart getting messy. I have seen massive wall-sized Gantt charts that are veritable works-of-art and that have taken hours to create; and everyone standing looking at it and saying ‘Wow! That is an impressive piece of work.  So what does it tell us? How does it help?

<Bob> Yes, I have experienced that too. I think what happens is that those who do the foundation training and discover the Gantt chart then try to use it to solve every flow problem – and in their enthusiasm they discount any warning advice.  Desperation drives over-inflated expectation which is often the pre-cursor to disappointment, and then disillusionment.  The Nerve Curve again.

<Lesley> But a Vitals Chart is an HCSE level technique and you said that we do not need to put everyone through HCSE training.

<Bob>That is correct. I am advocating an HCSE-in-training using a Vitals Chart to explain the concept of a time-trap so that everyone understands it well enough to see the flaw in the design.

<Lesley> Ah ha!  Yes, I see.  So what is my next step?

<Bob> I will let you answer that.

<Lesley> Um, let me think.

The outcome I want is everyone understands the concept of a time-trap well enough to feel comfortable with trying a time-trap-free design because they can see the benefits for them.

And to get that depth of understanding I need to design a table top exercise that starts with a time-trap design and generates raw data that we can use to build both a Gantt chart and the Vitals Chart; so I can point out and explain the characteristic finger-print of a time trap.

And then we can ‘test’ an alternative time-trap-free design and generate the prognostic Gantt and Vitals Chart and compare with the baseline diagnostic charts to reveal the improvement.

<Bob> That sounds like a good plan to me.  And if you do that, and your team apply it to a real improvement exercise, and you see the improvement and you share the story, then that will earn you a coveted HCSE Certificate of Competency.

<Lesley>Ah ha! Now I understand the reason you suggested this topic!  I am on the case!

A Little Law and Order

teamwork_puzzle_build_PA_150_wht_2341[Bing bong]. The sound heralded Lesley logging on to the weekly Webex coaching session with Bob, an experienced Improvement Science Practitioner.

<Bob> Good afternoon Lesley.  How has your week been and what topic shall we explore today?

<Lesley> Hi Bob. Well in a nutshell, the bit of the system that I have control over feels like a fragile oasis of calm in a perpetual desert of chaos.  It is hard work keeping the oasis clear of the toxic sand that blows in!

<Bob> A compelling metaphor. I can just picture it.  Maintaining order amidst chaos requires energy. So what would you like to talk about?

<Lesley> Well, I have a small shoal of FISHees who I am guiding  through the foundation shallows and they are getting stuck on Little’s Law.  I confess I am not very good at explaining it and that suggests to me that I do not really understand it well enough either.

<Bob> OK. So shall we link those two theme – chaos and Little’s Law?

<Lesley> That sounds like an excellent plan!

<Bob> OK. So let us refresh the foundation knowledge. What is Little’s Law?

<Lesley>It is a fundamental Law of process physics that relates flow, with lead time and work in progress.

<Bob> Good. And specifically?

<Lesley> Average lead time is equal to the average flow multiplied by the average work in progress.

<Bob>Yes. And what are the units of flow in your equation?

<Lesley> Ah yes! That is  a trap for the unwary. We need to be clear how we express flow. The usual way is to state it as number of tasks in a defined period of time, such as patients admitted per day.  In Little’s Law the convention is to use the inverse of that which is the average interval between consecutive flow events. This is an unfamiliar way to present flow to most people.

<Bob> Good. And what is the reason that we use the ‘interval between events’ form?

<Leslie> Because it is easier to compare it with two critically important  flow metrics … the takt time and the cycle time.

<Bob> And what is the takt time?

<Leslie> It is the average interval between new tasks arriving … the average demand interval.

<Bob> And the cycle time?

<Leslie> It is the shortest average interval between tasks departing …. and is determined by the design of the flow constraint step.

<Bob> Excellent. And what is the essence of a stable flow design?

<Lesley> That the cycle time is less than the takt time.

<Bob>Why less than? Why not equal to?

<Leslie> Because all realistic systems need some flow resilience to exhibit stable and predictable-within-limits behaviour.

<Bob> Excellent. Now describe the design requirements for creating chronically chaotic system behaviour?

<Leslie> This is a bit trickier to explain. The essence is that for chronically chaotic behaviour to happen then there must be two feedback loops – a destabilising loop and a stabilising loop.  The destabilising loop creates the chaos, the stabilising loop ensures it is chronic.

<Bob> Good … so can you give me an example of a destabilising feedback loop?

<Leslie> A common one that I see is when there is a long delay between detecting a safety risk and the diagnosis, decision and corrective action.  The risks are often transitory so if the corrective action arrives long after the root cause has gone away then it can actually destabilise the process and paradoxically increase the risk of harm.

<Bob> Can you give me an example?

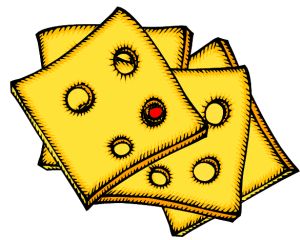
<Leslie>Yes. Suppose a safety risk is exposed by a near miss.  A delay in communicating the niggle and a root cause analysis means that the specific combination of factors that led to the near miss has gone. The holes in the Swiss cheese are not static … they move about in the chaos.  So the action that follows the accumulation of many undiagnosed near misses is usually the non-specific mantra of adding yet another safety-check to the already burgeoning check-list. The longer check-list takes more time to do, and is often repeated many times, so the whole flow slows down, queues grow bigger, waiting times get longer and as pressure comes from the delivery targets corners start being cut, and new near misses start to occur; on top of the other ones. So more checks are added and so on.

<Bob> An excellent example! And what is the outcome?

<Leslie> Chronic chaos which is more dangerous, more disordered and more expensive. Lose lose lose.

<Bob> And how do the people feel who work in the system?

<Leslie> Chronically naffed off! Angry. Demotivated. Cynical.

<Bob>And those feelings are the key symptoms.  Niggles are not only symptoms of poor process design, they are also symptoms of a much deeper problem: a violation of values.

<Leslie> I get the first bit about poor design; but what is that second bit about values?

<Bob>  We all have a set of values that we learned when we were very young and that have bee shaped by life experience.  They are our source of emotional energy, and our guiding lights in an uncertain world. Our internal unconscious check-list.  So when one of our values is violated we know because we feel angry. How that anger is directed varies from person to person … some internalise it and some externalise it.

<Leslie> OK. That explains the commonest emotion that people report when they feel a niggle … frustration which is the same as anger.

<Bob>Yes.  And we reveal our values by uncovering the specific root causes of our niggles.  For example if I value ‘Hard Work’ then I will be niggled by laziness. If you value ‘Experimentation’ then you may be niggled by ‘Rigid Rules’.  If someone else values ‘Safety’ then they may value ‘Rigid Rules’ and be niggled by ‘Innovation’ which they interpret as risky.

<Leslie> Ahhhh! Yes, I see.  This explains why there is so much impassioned discussion when we do a 4N Chart! But if this behaviour is so innate then it must be impossible to resolve!

<Bob> Understanding  how our values motivate us actually helps a lot because we are naturally attracted to others who share the same values – because we have learned that it reduces conflict and stress and improves our chance of survival. We are tribal and tribes share the same values.

<Leslie> Is that why different  departments appear to have different cultures and behaviours and why they fight each other?

<Bob> It is one factor in the Silo Wars that are a characteristic of some large organisations.  But Silo Wars are not inevitable.

<Leslie> So how are they avoided?

<Bob> By everyone knowing what common purpose of the organisation is and by being clear about what values are aligned with that purpose.

<Leslie> So in the healthcare context one purpose is avoidance of harm … primum non nocere … so ‘safety’ is a core value.  Which implies anything that is felt to be unsafe generates niggles and well-intended but potentially self-destructive negative behaviour.

<Bob> Indeed so, as you described very well.

<Leslie> So how does all this link to Little’s Law?

<Bob>Let us go back to the foundation knowledge. What are the four interdependent dimensions of system improvement?

<Leslie> Safety, Flow, Quality and Productivity.

<Bob> And one measure of  productivity is profit.  So organisations that have only short term profit as their primary goal are at risk of making poor long term safety, flow and quality decisions.

<Leslie> And flow is the key dimension – because profit is just  the difference between two cash flows: income and expenses.

<Bob> Exactly. One way or another it all comes down to flow … and Little’s Law is a fundamental Law of flow physics. So if you want all the other outcomes … without the emotionally painful disorder and chaos … then you cannot avoid learning to use Little’s Law.

<Leslie> Wow!  That is a profound insight.  I will need to lie down in a darkened room and meditate on that!

<Bob> An oasis of calm is the perfect place to pause, rest and reflect.

Actions Speak

media_video_icon_anim_150_wht_14142In a recent blog we explored the subject of learning styles and how a balance of complementary learning styles is needed to get the wheel-of-change turning.

Experience shows that many of us show a relative weakness in the ‘Activist’ quadrant of the cycle.

That implies we are less comfortable with learning-by-doing. Experimenting.

This behaviour is driven by a learned fear.  The fear-of-failure.

So when did we learn this fear?

Typically it is learned during childhood and is reinforced throughout adulthood.

The fear comes not from the failure though  … it comes from the emotional reaction of others to our supposed failure. The emotional backlash of significant others. Parents and parent-like figures such as school teachers.

Children are naturally curious and experimental and fearless.  That is how they learn. They make lots of mistakes – but they learn from them. Walking, talking, tying a shoelace, and so on.  Small mistakes do not created fear. We learn fear from others.

Full-of-fear others.

To an adult who has learned how to do many things it becomes easy to be impatient with the trial-and-error approach of a child … and typically we react in three ways:

1) We say “Don’t do that” when we see our child attempt something in a way we believe will not work or we believe could cause an accident. We teach them our fears.

2) We say “No” when we disagree with an idea or an answer that a child has offered. We discount them by discounting their ideas.

3) We say “I’ll do it” when we see a child try and fail. We discount their ability to learn how to solve problems and we discount our ability to let them.

Our emotional reaction is negative in all three cases and that is what teaches our child the fear of failure.

So they stop trying as hard.

And bit-by-bit they lose their curiosity and their courage.

We have now put them on the path to scepticism and cynicism.  Which is how we were taught.


This fear-of-failure brainwashing continues at school.

But now it is more than just fear of disappointing our parents; now it is fear of failing tests and exams … fear of the negative emotional backlash from peers, teachers and parents.

Some give up: they flee.  Others become competitive: they fight.

Neither strategies dissolve the source of the fear though … they just exacerbate it.


So it is rather too common to see very accomplished people paralysed with fear when circumstances dictate that they need to change in some way … to learn a new skill for example … to self-improve maybe.

Their deeply ingrained fear-of-failure surfaces and takes over control – and the fright/flight/fight behaviour is manifest.


So to get to the elusive win-win-win outcomes we want we have to weaken the fear-of-failure reflex … we need to develop a new habit … learning-by-doing.

The trick to this is to focus on things that fall 100% inside our circle of control … the Niggles that rank highest on our Niggle-o-Gram®.

And when we Study the top niggle; and then Plan the change; and then Do what we planned, and then Study effect of our action … then we learn-by-doing.

But not just by doing …. by Studying, Planning, Doing and Studying again.

Actions Speak not just to us but to everyone else too.

The Jigsaw

6MDesignJigsawSystems are made of interdependent parts that link together – rather like a jigsaw.

If pieces are distorted, missing, or in the wrong place then the picture is distorted and the system does not work as well as it could.

And if pieces of one jigsaw are mixed up with those of another then it is even more difficult to see any clear picture.

A system of improvement is just the same.

There are many improvement jigsaws each of which have pieces that fit well together and form a synergistic whole. Lean, Six Sigma, and Theory of Constraints are three well known ones.

Each improvement jigsaw evolved in a different context so naturally the picture that emerges is from a particular perspective: such as manufacturing.

So when the improvement context changes then the familiar jigsaws may not work as well: such as when we shift context from products to services, and from commercial to public.

A public service such as healthcare requires a modified improvement jigsaw … so how do we go about getting that?


One way is to ‘evolve’ an old jigsaw into a new context. That is tricky because it means adding new pieces and changing old pieces and the ‘zealots’ do not like changing their familiar jigsaw so they resist.

Another way is to ‘combine’ several old jigsaws in the hope that together they will provide enough perspectives. That is even more tricky because now you have several tribes of zealots who resist having their familiar jigsaws modified.

What about starting with a blank canvas and painting a new picture from scratch? Well it is actually very difficult to create a blank canvas for learning because we cannot erase what we already know. Our current mental model is the context we need for learning new knowledge.


So what about using a combination of the above?

What about first learning a new creative approach called design? And within that framework we can then create a new improvement jigsaw that better suits our specific context using some of the pieces of the existing ones. We may need to modify the pieces a bit to allow them to fit better together, and we may need to fashion new pieces to fill the gaps that we expose. But that is part of the fun.


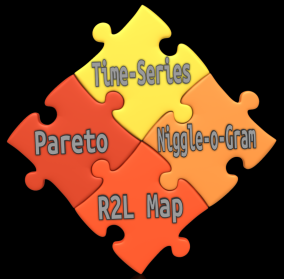
6MDesignJigsawThe improvement jigsaw shown here is a new hybrid.

It has been created from a combination of existing improvement knowledge and some innovative stuff.

Pareto analysis was described by Vilfredo Pareto over 100 years ago.  So that is tried and tested!

Time-series charts were invented by Walter Shewhart almost 100 years ago. So they are tried and tested too!

The combination of Pareto and Shewhart tools have been used very effectively for over 50 years. The combination is well proven.

The other two pieces are innovative. They have different parents and different pedigrees. And different purposes.

The Niggle-o-Gram® is related to 2-by-2, FMEA and EIQ and the 4N Chart®.  It is the synthesis of them that creates a powerful lens for focussing our improvement efforts on where the greatest return-on-investment will be.

The Right-2-Left Map® is a descendent of the Design family and has been crossed with Graph Theory and Causal Network exemplars to introduce their best features.  Its purpose is to expose errors of omission.

The emergent system is synergistic … much more effective than each part individually … and more even than their linear sum.


So when learning this new Science of Improvement we have to focus first on learning about the individual pieces and we do that by seeing examples of them used in practice.  That in itself is illuminating!

As we learn about more pieces a fog of confusion starts to form and we run the risk of mutating into a ‘tool-head’.  We know about the pieces in detail but we still do not see the bigger picture.

To avoid the tool-head trap we must balance our learning wheel and ensure that we invest enough time in learning-by-doing.

Then one day something apparently random will happen that triggers a ‘click’.  Familiar pieces start to fit together in a unfamiliar way and as we see the relationships, the sequences, and the synergy – then a bigger picture will start to emerge. Slowly at first and then more quickly as more pieces aggregate.

Suddenly we feel a big CLICK as the final pieces fall into place.  The fog of confusion evaporates in the bright sunlight of a paradigm shift in our thinking.

The way forward that was previously obscured becomes clearly visible.

Ah ha!

And we are off on the next stage  of our purposeful journey of improvement.

N-N-N-N Feedback

4NChartOne of the essential components of an adaptive system is effective feedback.

Without feedback we cannot learn – we can only guess and hope.

So the design of our feedback loops is critical-to-success.

Many people do not like getting feedback because they live in a state of fear: fear of criticism. This is a learned behaviour.

Many people do not like giving feedback because they too live in a state of fear: fear of conflict. This is a learned behaviour.

And what is learned can be unlearned; with training, practice and time.

But before we will engage in unlearning our current habit we need to see the new habit that will replace it. The one that will work better for us. The one that is more effective.  The one that will require less effort. The one that is more efficient use of our most precious resource: life-time.

There is an effective and efficient feedback technique called The 4N Chart®.  And I know it works because I have used it and demonstrated to myself and others that  it works. And I have seen others use it and demonstrate to themselves and others that it works too.

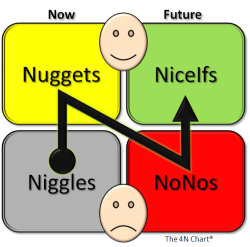
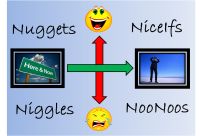
The 4N Chart® has two dimensions – Time (Now and Future) and Emotion (Happy and Unhappy).

This gives four combinations each of which is given a label that begins with the letter ‘N’ – Niggles, Nuggets, NoNos and NiceIfs.

The N has a further significance … it reminds us which order to move through the  chart.

We start bottom left with the Niggles.  What is happening now that causes us to feel unhappy. What are these root causes of our niggles? And more importantly, which of these do we have control over?  Knowing that gives us a list of actions that we can do that will have the effect of reducing our niggles. And we can start that immediately because we do not need permission.

Next we move top-left to the Nuggets. What is happening now that causes us to feel happy? What are the root causes of our nuggets? Which of these do we control? We need to recognise these too and to celebrate them.  We need to give ourselves a pat on the back for them because that helps reinforce the habit to keep doing them.

Now we look to the future – and we need to consider two things: what we do not want to feel in the future and what we do want to feel in the future. These are our NoNos and our NiceIfs. It does not matter which order we do this … but  we must consider both.

Many prefer to consider dangers and threats first … that is SAFETY FIRST  thinking and is OK. First Do No Harm. Primum non nocere.

So with the four corners of our 4N Chart® filled in we have a balanced perspective and we can set off on the journey of improvement with confidence. Our 4N Chart® will help us stay on track. And we will update it as we go, as we study, as we plan and as we do things. As we convert NiceIfs into Nuggets and  Niggles into NoNos.

It sounds simple.  It is in theory. It is not quite as easy to do.

It takes practice … particularly the working backwards from the effect (the feeling) to the cause (the facts). This is done step-by-step using Reality as a guide – not our rhetoric. And we must be careful not to make assumptions in lieu of evidence. We must be careful not to jump to unsupported conclusions. That is called pre-judging.  Prejudice.

But when you get the hang of using The 4N Chart® you will be amazed at how much more easily and more quickly you make progress.

The Improvement Pyramid

tornada_150_wht_10155The image of a tornado is what many associate with improvement.  An unpredictable, powerful, force that sweeps away the wood in its path. It certainly transforms – but it leaves a trail of destruction and disappointment in its wake. It does not discriminate  between the green wood and the dead wood.

A whirlwind is created by a combination of powerful forces – but the trigger that unleashes the beast is innocuous. The classic ‘butterfly wing effect’. A spark that creates an inferno.

This is not the safest way to achieve significant and sustained improvement. A transformation tornado is a blunt and destructive tool.  All it can hope to achieve is to clear the way for something more elegant. Improvement Science.

We need to build the capability for improvement progressively and to build it effective, efficient, strong, reliable, and resilient. In a word  – trustworthy. We need a durable structure.

But what sort of structure?  A tower from whose lofty penthouse we can peer far into the distance?  A bridge between the past and the future? A house with foundations, walls and a roof? Do these man-made edifices meet our criteria?  Well partly.

Let us see what nature suggests. What are the naturally durable designs?

Suppose we have a bag of dry sand – an unstructured mix of individual grains – and that each grain represents an improvement idea.

Suppose we have a specific issue that we would like to improve – a Niggle.

Let us try dropping the Improvement Sand on the Niggle – not in a great big reactive dollop – but in a proactive, exploratory bit-at-a-time way.  What shape emerges?

hourglass_150_wht_8762What we see is illustrated by the hourglass.  We get a pyramid.

The shape of the pyramid is determined by two factors: how sticky the sand is and how fast we pour it.

What we want is a tall pyramid – one whose sturdy pinnacle gives us the capability to see far and to do much.

The stickier the sand the steeper the sides of our pyramid.  The faster we pour the quicker we get the height we need. But there is a limit. If we pour too quickly we create instability – we create avalanches.

So we need to give the sand time to settle into its stable configuration; time for it to trickle to where it feels most comfortable.

And, in translating this metaphor to building improvement capability in system we could suggest that the ‘stickiness’ factor is how well ideas hang together and how well individuals get on with each other and how well they share ideas and learning. How cohesive our people are.  Distrust and conflict represent repulsive forces.  Repulsion creates a large, wide, flat structure  – stable maybe but incapable of vision and improvement. That is not what we need

So when developing a strategy for building improvement capability we build small pyramids where the niggles point to. Over time they will merge and bigger pyramids will appear and merge – until we achieve the height. Then was have a stable and capable improvement structure. One that we can use and we can trust.

Just from sprinkling Improvement Science Sand on our Niggles.

Miserable or Motivated?

stick_figure_scribble_pen_150_wht_6418[Beep Beep] The alarm on Bob’s smartphone was the reminder that in a few minutes his e-mentoring session with Lesley was due. Bob had just finished the e-mail he was composing so he sent it and then fired-up the Webex session. Lesley was already logged in and on line.

<Bob> Hi Lesley. What aspect of Improvement Science shall we talk about today? What is next on your map?

<Lesley> Hi Bob. Let me see. It looks like ‘Employee Engagement‘ is the one that we have explored least yet – and it links to lots of other things.

<Bob> OK. What would you say the average level of Employee Engagement is in your organisation at the moment? On a scale of zero to ten where zero is defined as ‘complete apathy’.

<Lesley> Good question. I see a wide range of engagement and I would say the average is about four out of ten.  There are some very visible, fully-engaged, energetic, action-focused  movers-and-shakers.  There are many more nearer the apathy end of the spectrum. Most employees seem to turn up, do their jobs well enough to avoid being disciplined, and then go home.

<Bob> OK. And do you feel that is a problem?

<Lesley> You betcha!  Improvement means change and change means action.  Disengaged employees are a deadweight. They do not actively block change – they will go along with it if pushed  – but they do not contribute to making it happen. And that creates a different problem. The movers-and-shakers get frustrated and eventually get tired trying to move the deadweight up hill and give up  and then can become increasingly critical and then cynical. After they give up in despair they then actively block any new ideas saying – “Do not try you will fail.”

<Bob> So how would you describe the emotional state of those you describe as “disengaged”?

<Lesley> Miserable.

<Bob> And who is making them feel miserable?

<Lesley> That is another good question. They appear to be making themselves feel miserable. And it is not what is happening that triggers this emotion. It is what is not happening. Apathy seems to be self-sustaining.

<Bob> Can you explain in a bit more about what you mean by that and maybe share an example?

<Lesley> An example is easier.  I have reflected on this a bit and I have used one of the 6M Design® techniques to help me understand it better.  I used a Right-2-Left® map to compare a personal example of when I felt really motivated and delivered a significant and measurable improvement; with one where I felt miserable and no change happened.

<Bob> Excellent. What did you discover?

<Lesley> I discovered that there were four classes of  difference between the two examples. And I then understood what you mean by ‘Acts and Errors of  Omission and Commission’.

<Bob> OK. And which was the commonest of the four combinations in your example?

<Lesley> The Errors of Omission. And within just that group there were three different types that were most obvious.

<Bob> Can you list them for me?

<Lesley> For sure. The first is the miserableness I felt when what I was doing felt to me that it was irrelevant. When what I was being asked to do had no worthwhile purpose that I was aware of.

<Bob> So which was it? No worth or not being aware of the worth?

<Lesley>Me not being aware of the worth. I hoped it was of value to someone higher up the corporate food chain otherwise I would not have been asked to do it! But I was never sure. And that uncertainty generated some questions. What if what I am doing is of no worth to anyoneWhat if I am just wasting my lifetime doing it? That fearful thought left me feeling more miserable than motivated.

<Bob> OK. What was the second Error of Omission?

<Lesley> It is linked to the first one. I had no objective way of knowing if I was doing a worthwhile job.  And the word objective is important.  I am not asking for subjective feedback – there is too much expectation, variation, assumption, prejudgement and politics mixed up in opinions of what I achieve.  I needed specific, objective and timely feedback. I associated my feeling of miserableness with not getting objective feedback that told me what I was doing was making a worthwhile difference to someone else. Anyone else!

<Bob> I thought that you get a lot of objective feedback on a whole raft of organisational performance metrics?

<Lesley> Oh yes! We do!! The problem is that it is high level, aggregated, anonymous, and delayed. To get a copy of a report that says as an organisation we did or did not meet last quarters arbitrary performance target for x, y or z usually generates a ‘So what? How does that relate to what I do?’ reaction. I need objective, specific and timely feedback about the effects of my work. Good or bad.

<Bob> OK.  And Error of Omission Three?

<Lesley> This was the trickiest one to nail down. What it came down to was being treated as a process and not as a person.  I felt anonymous.  I was just  a headcount, a number on a payroll ledger, an overhead cost. That feeling was actually the most demotivating of all.

<Bob> And did it require all Three Errors of Omission to be present for the ‘miserableness’ to become manifest?

<Lesley> Alas no! Any one of them was enough. The more of them at the same time the deeper the feeling of misery the less motivated I felt.

<Bob> Thank you for being so frank and open. So what have you ‘abstracted’ from your ‘reflection’?

<Lesley> That employee engagement requires that these Three Errors of Omission must be deliberately checked for and proactively addressed if discovered.

<Bob> And who would, could or should do this check-and-correct work?

<Lesley> H’mm. Another very god question. The employee could do it but it is difficult for them because a lot of the purpose-setting and feedback comes from outside their circle of control and from higher up. Approaching  a line-manager with a list of their Errors of Omission will be too much of a challenge!

<Bob> So?

<Lesley> The manager should do it.  They should ask themselves these questions.  Only they can correct their  own Errors of Omission.  I doubt if that would happen spontaneously though! Humility seems a bit of a rare commodity.

<Bob> I agree. So what can the employee do to help their boss?

<Lesley> They could ask how they can be of most value to their boss and they could ask for objective and timely feedback on how well they are performing as an individual on those measures of worth. It sounds so simple and obvious when said out loud. So why does no one do it?

<Bob> A very good question. Some do and they are the often described as ‘motivating leaders’. So does this insight suggest to you any strategies for grasping the ‘Employee Engagement’ nettle without getting stung?

<Lesley> Yes indeed! I am already planning my next action. A chat with my line-manager about what I could do. Thanks Bob.

<Bob> My pleasure. And remember that the same principle works for everyone that we work directly with – especially those immediately ‘upstream’ and ‘downstream’ of us in our daily work.

Jiggling

hurry_with_the_SFQP_kit[Dring] Bob’s laptop signaled the arrival of Leslie for their regular ISP remote coaching session.

<Bob> Hi Leslie. Thanks for emailing me with a long list of things to choose from. It looks like you have been having some challenging conversations.

<Leslie> Hi Bob. Yes indeed! The deepening gloom and the last few blog topics seem to be polarising opinion. Some are claiming it is all hopeless and others, perhaps out of desperation, are trying the FISH stuff for themselves and discovering that it works.  The ‘What Ifs’ are engaged in war of words with the ‘Yes Buts’.

<Bob> I like your metaphor! Where would you like to start on the long list of topics?

<Leslie> That is my problem. I do not know where to start. They all look equally important.

<Bob> So, first we need a way to prioritise the topics to get the horse-before-the-cart.

<Leslie> Sounds like a good plan to me!

<Bob> One of the problems with the traditional improvement approaches is that they seem to start at the most difficult point. They focus on ‘quality’ first – and to be fair that has been the mantra from the gurus like W.E.Deming. ‘Quality Improvement’ is the Holy Grail.

<Leslie>But quality IS important … are you saying they are wrong?

<Bob> Not at all. I am saying that it is not the place to start … it is actually the third step.

<Leslie>So what is the first step?

<Bob> Safety. Eliminating avoidable harm. Primum Non Nocere. The NoNos. The Never Events. The stuff that generates the most fear for everyone. The fear of failure.

<Leslie> You mean having a service that we can trust not to harm us unnecessarily?

<Bob> Yes. It is not a good idea to make an unsafe design more efficient – it will deliver even more cumulative harm!

<Leslie> OK. That makes perfect sense to me. So how do we do that?

<Bob> It does not actually matter.  Well-designed and thoroughly field-tested checklists have been proven to be very effective in the ‘ultra-safe’ industries like aerospace and nuclear.

<Leslie> OK. Something like the WHO Safe Surgery Checklist?

<Bob> Yes, that is a good example – and it is well worth reading Atul Gawande’s book about how that happened – “The Checklist Manifesto“.  Gawande is a surgeon who had published a lot on improvement and even so was quite skeptical that something as simple as a checklist could possibly work in the complex world of surgery. In his book he describes a number of personal ‘Ah Ha!’ moments that illustrate a phenomenon that I call Jiggling.

<Leslie> OK. I have made a note to read Checklist Manifesto and I am curious to learn more about Jiggling – but can we stick to the point? Does quality come after safety?

<Bob> Yes, but not immediately after. As I said, Quality is the third step.

<Leslie> So what is the second one?

<Bob> Flow.

There was a long pause – and just as Bob was about to check that the connection had not been lost – Leslie spoke.

<Leslie> But none of the Improvement Schools teach basic flow science.  They all focus on quality, waste and variation!

<Bob> I know. And attempting to improve quality before improving flow is like papering the walls before doing the plastering.  Quality cannot grow in a chaotic context. The flow must be smooth before that. And the fear of harm must be removed first.

<Leslie> So the ‘Improving Quality through Leadership‘ bandwagon that everyone is jumping on will not work?

<Bob> Well that depends on what the ‘Leaders’ are doing. If they are leading the way to learning how to design-for-safety and then design-for-flow then the bandwagon might be a wise choice. If they are only facilitating collaborative agreement and group-think then they may be making an unsafe and ineffective system more efficient which will steer it over the edge into faster decline.

<Leslie>So, if we can stabilize safety using checklists do we focus on flow next?

<Bob>Yup.

<Leslie> OK. That makes a lot of sense to me. So what is Jiggling?

<Bob> This is Jiggling. This conversation.

<Leslie> Ah, I see. I am jiggling my understanding through a series of ‘nudges’ from you.

<Bob>Yes. And when the learning cogs are a bit rusty, some Improvement Science Oil and a bit of Jiggling is more effective and much safer than whacking the caveman wetware with a big emotional hammer.

<Leslie>Well the conversation has certainly jiggled Safety-Flow-Quality-and-Productivity into a sensible order for me. That has helped a lot. I will sort my to-do list into that order and start at the beginning. Let me see. I have a plan for safety, now I can focus on flow. Here is my top flow niggle. How do I design the resource capacity I need to ensure the flow is smooth and the waiting times are short enough to avoid ‘persecution’ by the Target Time Police?

<Bob> An excellent question! I will send you the first ISP Brainteaser that will nudge us towards an answer to that question.

<Leslie> I am ready and waiting to have my brain-teased and my niggles-nudged!

What is my P.A.R.T?

four_way_puzzle_people_200_wht_4883Improvement implies change, but change does not imply improvement.

Change follows action. Action follows planning. Effective planning follows from an understanding of the system because it is required to make the wise decisions needed to achieve the purpose.

The purpose is the intended outcome.

Learning follows from observing the effect of change – whatever it is. Understanding follows from learning to predict the effect of both actions and in-actions.

All these pieces of the change jigsaw are different and they are inter-dependent. They fit together. They are a system.

And we can pick out four pieces: the Plan piece, the Action piece, the Observation piece and the Learning piece – and they seem to follow that sequence – it looks like a learning cycle.

This is not a new idea.

It is the same sequence as the Scientific Method: hypothesis, experiment, analysis, conclusion. The preferred tool of  Academics – the Thinkers.

It is also the same sequence as the Shewhart Cycle: plan, do, check, act. The preferred tool of the Pragmatists – the Doers.

So where does all the change conflict come from? What is the reason for the perpetual debate between theorists and activists? The incessant game of “Yes … but!”

One possible cause was highlighted by David Kolb  in his work on ‘experiential learning’ which showed that individuals demonstrate a learning style preference.

We tend to be thinkers or doers and only a small proportion us say that we are equally comfortable with both.

The effect of this natural preference is that real problems bounce back-and-forth between the Tribe of Thinkers and the Tribe of Doers.  Together we are providing separate parts of the big picture – but as two tribes we appear to be unaware of the synergistic power of the two parts. We are blocked by a power struggle.

The Experiential Learning Model (ELM) was promoted and developed by Peter Honey and Alan Mumford (see learning styles) and their work forms the evidence behind the Learning Style Questionnaire that anyone can use to get their ‘score’ on the four dimensions:

  • Pragmatist – the designer and planner
  • Activist – the action person
  • Reflector – the observer and analyst
  • Theorist – the abstracter and hypothesis generator

The evidence from population studies showed that individuals have a preference for one of these styles, sometimes two, occasionally three and rarely all four.

That observation, together with the fact that learning from experience requires moving around the whole cycle, leads to an awareness that both individuals and groups can get ‘stuck’ in their learning preference comfort zone. If the learning wheel is unbalanced it will deliver a bumpy ride when it turns! So it may be more comfortable just to remain stationary and not to learn.

Which means not to change. Which means not to improve.


So if we are embarking on an improvement exercise – be it individual or collective – then we are committed to learning. So where do we start on the learning cycle?

The first step is action. To do something – and the easiest and safest thing to do is just look. Observe what is actually happening out there in the real world – outside the office – outside our comfort zone. We need to look outside our rhetorical inner world of assumptions, intuition and pre-judgements. The process starts with Study.

The next step is to reflect on what we see – we look in the mirror – and we compare what are actually seeing with what we expected to see. That is not as easy as it sounds – and a useful tool to help is to draw charts. To make it visual. All sorts of charts.

The result is often a shock. There is often a big gap between what we see and what we perceive; between what we expect and what we experience; between what we want and what we get; between our intent and our impact.

That emotional shock is actually what we need to power us through the next phase – the Realm of the Theorist – where we ask three simple questions:
Q1: What could be causing the reality that I am seeing?
Q2: How would I know which of the plausible causes is the actual cause?
Q3: What experiment can I do to answer my question and clarify my understanding of Reality?

This is the world of the Academic.

The third step is design an experiment to test our new hypothesis.  The real world is messy and complicated and we need to be comfortable with ‘good enough’ and ‘reasonable uncertainty’.  Design is about practicalities – making something that works well enough in practice – in the real world. Something that is fit-for-purpose. We are not expecting perfection; not looking for optimum; not striving for best – just significantly better than what we have now. And the more we can test our design before we implement it the better because we want to know what to expect before we make the change and we want to avoid unintended negative consequences – the NoNos. This is Plan.

twisting_arrow_200_wht_11738Then we act … and the cycle of learning has come one revolution … but we are not back at the start – we have moved forward. Our understanding is already different from when were were at this stage before: it is deeper and wider.  We are following the trajectory of a spiral – our capability for improvement is expanding over time.

So we need to balance our learning wheel before we start the journey or we will have a slow, bumpy and painful ride!

We need to study, then plan, then do, then study the impact.


One plausible approach is to stay inside our comfort zones, play to our strengths and to say “What we need is a team made of people with complementary strengths. We need a Department of Action for the Activists; a Department of Analysis for the Reflectors; a Department of Research for the Theorists and a Department of Planning for the Pragmatists.

But that is what we have now and what is the impact? The Four Departments have become super-specialised and more polarised.  There is little common ground or shared language.  There is no common direction, no co-ordination, no oil on the axle of the wheel of change. We have ground to a halt. We have chaos. Each part is working but independently of the others in an unsynchronised mess.

We have cultural fibrillation. Change output has dropped to zero.


A better design is for everyone to focus first on balancing their own learning wheel by actively redirecting emotional energy from their comfort zone, their strength,  into developing the next step in their learning cycle.

Pragmatists develop their capability for Action.
Activists develop their capability for Reflection.
Reflectors develop their capability for Hypothesis.
Theorists develop their capability for Design.

The first step in the improvement spiral is Action – so if you are committed to improvement then investing £10 and 20 minutes in the 80-question Learning Style Questionnaire will demonstrate your commitment to yourself.  And that is where change always starts.

Space-and-Time

line_figure_phone_400_wht_9858<Lesley>Hi Bob! How are you today?

<Bob>OK thanks Lesley. And you?

<Lesley>I am looking forward to our conversation. I have two questions this week.

<Bob>OK. What is the first one?

<Lesley>You have taught me that improvement-by-design starts with the “purpose” question and that makes sense to me. But when I ask that question in a session I get an “eh?” reaction and I get nowhere.

<Bob>Quod facere bonum opus et quomodo te cognovi unum?

<Lesley>Eh?

<Bob>I asked you a purpose question.

<Lesley>Did you? What language is that? Latin? I do not understand Latin.

<Bob>So although you recognize the language you do not understand what I asked, the words have no meaning. So you are unable to answer my question and your reaction is “eh?”. I suspect the same is happening with your audience. Who are they?

<Lesley>Front-line clinicians and managers who have come to me to ask how to solve their problems. There Niggles. They want a how-to-recipe and they want it yesterday!

<Bob>OK. Remember the Temperament Treacle conversation last week. What is the commonest Myers-Briggs Type preference in your audience?

<Lesley>It is xSTJ – tough minded Guardians.  We did that exercise. It was good fun! Lots of OMG moments!

<Bob>OK – is your “purpose” question framed in a language that the xSTJ preference will understand naturally?

<Lesley>Ah! Probably not! The “purpose” question is future-focused, conceptual , strategic, value-loaded and subjective.

<Bob>Indeed – it is an iNtuitor question. xNTx or xNFx. Pose that question to a roomful of academics or executives and they will debate it ad infinitum.

<Lesley>More Latin – but that phrase I understand. You are right.  And my own preference is xNTP so I need to translate my xNTP “purpose” question into their xSTJ language?

<Bob>Yes. And what language do they use?

<Lesley>The language of facts, figures, jobs-to-do, work-schedules, targets, budgets, rational, logical, problem-solving, tough-decisions, and action-plans. Objective, pragmatic, necessary stuff that keep the operational-wheels-turning.

<Bob>OK – so what would “purpose” look like in xSTJ language?

<Lesley>Um. Good question. Let me start at the beginning. They came to me in desperation because they are now scared enough to ask for help.

<Bob>Scared of what?

<Lesley>Unintentionally failing. They do not want to fail and they do not need beating with sticks. They are tough enough on themselves and each other.

<Bob>OK that is part of their purpose. The “Avoid” part. The bit they do not want. What do they want? What is the “Achieve” part? What is their “Nice If”?

<Lesley>To do a good job.

<Bob>Yes. And that is what I asked you – but in an unfamiliar language. Translated into English I asked “What is a good job and how do you know you are doing one?”

<Lesley>Ah ha! That is it! That is the question I need to ask. And that links in the first map – The 4N Chart®. And it links in measurement, time-series charts and BaseLine© too. Wow!

<Bob>OK. So what is your second question?

<Lesley>Oh yes! I keep getting asked “How do we work out how much extra capacity we need?” and I answer “I doubt that you need any more capacity.”

<Bob>And their response is?

<Lesley>Anger and frustration! They say “That is obvious rubbish! We have a constant stream of complaints from patients about waiting too long and we are all maxed out so of course we need more capacity! We just need to know the minimum we can get away with – the what, where and when so we can work out how much it will cost for the business case.

<Bob>OK. So what do they mean by the word “capacity”. And what do you mean?

<Lesley>Capacity to do a good job?

<Bob>Very quick! Ho ho! That is a bit imprecise and subjective for a process designer though. The Laws of Physics need the terms “capacity”, “good” and “job” clearly defined – with units of measurement that are meaningful.

<Lesley>OK. Let us define “good” as “delivered on time” and “job” as “a patient with a health problem”.

<Bob>OK. So how do we define and measure capacity? What are the units of measurement?

<Lesley>Ah yes – I see what you mean. We touched on that in FISH but did not go into much depth.

<Bob>Now we dig deeper.

<Lesley>OK. FISH talks about three interdependent forms of capacity: flow-capacity, resource-capacity, and space-capacity.

<Bob>Yes. They are the space-and-time capacities. If we are too loose with our use of these and treat them as interchangeable then we will create the confusion and conflict that you have experienced. What are the units of measurement of each?

<Lesley>Um. Flow-capacity will be in the same units as flow, the same units as demand and activity – tasks per unit time.

<Bob>Yes. Good. And space-capacity?

<Lesley>That will be in the same units as work in progress or inventory – tasks.

<Bob>Good! And what about resource-capacity?

<Lesley>Um – Will that be resource-time – so time?

<Bob>Actually it is resource-time per unit time. So they have different units of measurement. It is invalid to mix them up any-old-way. It would be meaningless to add them for example.

<Lesley>OK. So I cannot see how to create a valid combination from these three! I cannot get the units of measurement to work.

<Bob>This is a critical insight. So what does that mean?

<Lesley>There is something missing?

<Bob>Yes. Excellent! Your homework this week is to work out what the missing pieces of the capacity-jigsaw are.

<Lesley>You are not going to tell me the answer?

<Bob>Nope. You are doing ISP training now. You already know enough to work it out.

<Lesley>OK. Now you have got me thinking. I like it. Until next week then.

<Bob>Have a good week.

Fear and Fuel

stick_figure_open_cupboard_150_wht_8038Improvement implies change.

Change requires motivation.

And there are two flavours of motivation juice – Fear and Fuel

Fear is the emotion that comes from anticipated loss in the future.  Loss means some form of damage. Physical, psychological or social harm.  We fear loss of peer-esteem and we fear loss of self-esteem … almost more than we fear physical harm.

Our fear of anticipated loss may be based on reality. Our experience of actual loss in the past.  We remember the emotional pain and we learn from past pain to fear future loss.

Our fear of anticipated loss may also be fueled by rhetoric.  The doom-mongering of the Shroud-Wavers, the Nay-Sayers, the Skeptics and the Cynics.


And there are examples where the rhetorical fear is deliberately generated to drive the fear-of-reality to “the solution” – which of course we have to pay dearly for. This is Machiavellian mass manipulation for commercial gain.

“Fear of germs, fear of fatness, fear of the invisible enemies outside and inside”.

Generating and ameliorating fear is big business. It is a Burn-and-Scrape design.

What we are seeing here is the Drama Triangle operating on a massive scale. The Persecutors create the fear, the Victims run away and the Persecutors then switch role to Rescuers and offer to sell the terrified-and-now-compliant Victims “the  solution” to their fear.  The Victims do not learn.  That is not the purpose – because that would end the Game and derail the Gravy Train.


So fear is not an effective way to motivate for sustained improvement,  and we have ample evidence to support that statement!  It might get us started, but it won’t keep us going.

The Burn-and-Scrape design that we see everywhere is a fear-driven-design.

Any improvements are transitory and usually only achieved at the emotional expense of a passionate idealist. When they get too tired to push any more the toast gets burnt again because the toaster is perfectly designed to burn toast.  Not intentionally designed to burn the toast but perfectly designed to nevertheless.

The use of Delusional Ratios and Arbitrary Targets (DRATs) is a fear-based-design-strategy. It ensures the Fear Game and Gravy Train continue.

And fear has a frightening cost. The cost of checking-and-correcting. The cost of the defensive-bureaucracy that may catch errors before too much local harm results but which itself creates unmeasurable global harm in a different way – by hoovering up the priceless human resource of life-time – like an emotional black hole.

The cost of errors. The cost of queues. The list of fear-based-design costs is long.

A fear-based-design for delivering improvement is a poor design.


So we need a better design.


And a better one is based on a positive-attractive-emotional force pulling us forwards into the future. The anticipation of gains for all. A win-win-win design.

Win-win-win design starts with the Common Purpose: the outcomes that everyone wants; and the outcomes that no-one wants.  We need both.  This balance creates alignment of effort on getting the NiceIfs (the wants) while avoiding the NoNos (the do not wants).

Then we ask the simple question: “What is preventing us having our win-win-win outcome now?

The blockers are the parts of our current design that we need to change: our errors of omission and our errors of commission.  Our gaps and our gaffes.

And to change them we need to be clear what they are; where they are and how they came to be there … and that requires a diagnostic skill that is one of our errors of omission. We have never learned how to diagnose our process design flaws.

Another common blocker is that we believe that a win-win-win outcome is impossible. This is a learned belief. And it is a self-fulfilling prophesy.

We may also believe that all swans are white because we have never seen a black swan – even though we know, in principle, that a black swan could be possible.

Rhetoric and Reality are not the same thing.  Feeling it could be possible and knowing that it actually is possible are different emotions. We need real evidence to challenge our life-limiting rhetoric.

Weary and wary skeptics crave real evidence not rhetorical exhortation.

So when that evidence is presented – and the Impossibility Hypothesis is disproved – then an emotional shock is inevitable.  We are now on the emotional roller-coaster called the Nerve Curve.  And the deeper our skepticism the bigger the shock.


After the shock we characteristically do one of three things:

1. We discount the evidence and go into denial.  We refuse to challenge our own rhetoric. Blissful ignorance is attractive.  The gap between intent and impact is scary.

2. We go quiet because we are now stuck in the the painful awareness of the transition zone between the past and the future. The feelings associated with the transition are anxiety and depression. We don’t want to go back and we don’t know how to go forwards.

3. We sit up, we take notice, we listen harder, we rub our chins, our minds race as we become more and more excited. The feelings associated with the stage of resolution are curiosity, excitement and hope.

It is actually a sequence and it is completely normal.


And those who reach Stage 3 of the Nerve Curve say things like “We have food for thought;  we feel inspired; our passion is re-ignited; we now have a beacon of hope for the future.

That is the flavour of motivation-juice that is needed to fuel the improvement-by-design engine and to deliver win-win-win designs that are both surprising and self-sustaining.

And what actually changes our belief of what is possible is when we learn to do it for ourselves. For real.

That is Improvement Science in action. It is a pragmatic science.

To begin have an end in mind – Steve Peak

My head is a buzzing this morning with poems by John Godfrey Saxe, Theory of Constraints, Six Thinking Hats®, managing transitions and discrete event simulations!

It is not because of the rather lovely bottle of red yesterday evening nor as a result of an episode of the hitchhikers guide to the galaxy but rather my start on the Foundations of Improvement Science in Healthcare course.

The Three Wins book that kicks off the course should be offered to all those folks who are trying to bring about improvements to patients but finding it frustrating and about to consider giving it up. You know who you are and I have been there on a few occasions myself. The book plots the journey of the vascular team at Good Hope Hospital who deliver some fantastic changes to improve the service to patients and in doing so achieve the Three Wins: quality, performance and motivation. John’s story fills your heart with joy!

So it is Saturday morning and sporting events are happening around me. I am delighted to have started my course and have an end in mind. My G-R-O-W outline is done and I have my Niggles that I will convert to NoNos and my NiceIfs that I want to end up as Nuggets. I have played the Post It® Note and Six Dice games and begun ‘learning’ the concepts behind improvement science that I know will complement any people skills I might possess. The human side of change, the key goals of quality and performance are all wrapped up together as we all know well and here it is becoming clearer how these things can and must be pulled off simultaneously.

I am excited about all this and having chatted to a cracking CEO leader yesterday I can see more and more clearly how his goals of deeper engagement and involvement with the hospitals teams, his desire to improvement the patient’s view of the services offered and also sorry to say this but how the money can be made to work harder can be delivered.

I have programmed some further time next week to hit the next stage of the course where the more technical bits get explained and illustrated using the exercises, examples and language that thus far are making this fun.

Next Friday sees the arrival of a friend from Australia who has not been seen in 10 years. The next blog might be interesting!

Steve Peak

Middle-Aware

line_figure_phone_400_wht_9858[Dring Dring]

<Bob> Hi Leslie, how are you today?

<Leslie> Really good thanks. We are making progress and it is really exciting to see tangible and measurable improvement in safety, delivery, quality and financial stability.

<Bob> That is good to hear. So what topic shall we explore today?

<Leslie> I would like to return to the topic of engagement.

<Bob> OK. I am sensing that you have a specific Niggle that you would like to share.

<Leslie> Yes.  Specifically it is engaging the Board.

<Bob> Ah ha. I wondered when we would get to that. Can you describe your Niggle?

<Leslie> Well, the feeling is fear and that follows from the risk of being identified as a trouble-maker which follows from exposing gaps in knowledge and understanding of seniors.

<Bob> Well put.  This is an expected hurdle that all Improvement Scientists have to learn to leap reliably. What is the barrier that you see?

<Leslie> That I do not know how to do it and I have seen a  lot of people try and commit career-suicide – like moths on a flame.

<Bob> OK – so it is a real fear based on real evidence. What methods did the “toasted moths” try?

<Leslie> Some got angry and blasted off angry send-to-all emails.  They just succeeded in identifying themselves as “terrorists” and were dismissed – politically and actually. Others channeled  their passion more effectively by heroic acts that held the system together for a while – and they succeeded in burning themselves out. The end result was the same: toasted!

<Bob> So with your understanding of design principles what does that say?

<Leslie> That the design of their engagement process is wrong.

<Bob> Wrong?

<Leslie> I mean “not fit for purpose”.

<Bob> And the difference is?

<Leslie> “Wrong” is a subjective judgement, “not fit for purpose” is an objective assessment.

<Bob> Yes. We need to be careful with words. So what is the “purpose”?

<Leslie> An organisation that is capable of consistently delivering improvement on all dimensions, safety, delivery, quality and affordability.

<Bob> Which requires?

<Leslie> All the parts working in synergy to a common purpose.

<Bob> So what are the parts?

<Leslie> The departments.

<Bob> They are the stages that the streams cross – they are parts of system structure. I am thinking more broadly.

<Leslie> The workers, the managers and the executives?

<Bob> Yes.  And how is that usually perceived?

<Leslie> As a power hierarchy.

<Bob> And do physical systems have power hierarchies?

<Leslie> No … they have components with different and complementary roles.

<Bob> So does that help?

<Leslie> Yes! To achieve synergy each component has to know its complementary role and be competent to do it.

<Bob> And each must understand the roles of the others,  respect the difference, and develop trust in their competence.

<Leslie> And the concepts of understanding, respect and trust appears again.

<Bob> Indeed.  They are always there in one form or another.

<Leslie> So as learning and improvement is a challenge then engagement is respectful challenge …

<Bob> … uh huh …

<Leslie> … and each part is different so requires a different form of respectful challenge?

<Bob> Yes. And with three parts there are six relationships between them – so six different ways of one part respectfully challenging another. Six different designs that have the same purpose but a different context.

<Leslie> Ah ha!  And if we do not use the context-dependent-fit-for-purpose-respectful-challenge-design we do not achieve our purpose?

<Bob> Correct. The principles of design are generic.

<Leslie> So what are the six designs?

<Bob> Let us explore three of them. First the context of a manager respectfully challenging a worker to improve.

<Leslie> That would require some form of training. Either the manager trains the worker or employs someone else to.

<Bob> Yes – and when might a manager delegate training?

<Leslie> When they do not have time to or do not know how to.

<Bob> Yes. So how would the flaw in that design be avoided?

<Leslie> By the manager maintaining their own know-how by doing enough training themselves and delegating the rest.

<Bob> Yup. Well done. OK let us consider a manager respectfully challenging other managers to improve.

<Leslie> I see what you mean. That is a completely different dynamic. The closest I can think of is a coaching arrangement.

<Bob> Yes. Coaching is quite different from training. It is more of a two-way relationship and I prefer to refer to it as “informal co-coaching” because both respectfully challenge each other in different ways; both share knowledge; and both learn and develop.

<Leslie> And that is what you are doing now?

<Bob> Yes. The only difference is that we have agreed a formal coaching contract. So what about a worker respectfully challenging a manager or a manager respectfully challenging an executive?

<Leslie>That is a very different dynamic. It is not training and it is not coaching.

<Bob> What other options are there?

<Leslie>Not formal coaching!  An executive is not going to ask a middle manager to coach them!

<Bob> You are right on both counts – so what is the essence of informal coaching?

<Leslie> An informal coach provides a different perspective and will say what they see if asked and will ask questions that help to illustrate alternative perspectives and offer evidence of alternative options. This is just well-structured, judgement-free feedback.

<Bob> Yes. We do it all the time. And we are often “coached” by those much younger than ourselves who have a more modern perspective. Our children for instance.

<Leslie> So the judgement free feedback metaphor is the one that a manager can use to engage an executive.

<Bob> Yes. And look at it from the perspective of the executive – they want feedback that can help them made wiser strategic decisions. That is their role. Boards are always asking for customer feedback, staff feedback and performance feedback.  They want to know the Nuggets, the Niggles, the Nice Ifs and the NoNos.  They just do not ask for it like that.

<Leslie> So they are no different from the rest of us?

<Bob> Not in respect of an insatiable appetite for unfiltered and undistorted feedback. What is different is their role. They are responsible for the strategic decisions – the ones that affect us all – so we can help ourselves by helping them make those decisions. A well-designed feedback model is fit-for-that-purpose.

<Leslie> And an Improvement Scientist needs to be able to do all three – training, coaching and communicating in a collaborative informal style. Is that leadership?

<Bob> I call it “middle-aware”.

<Leslie> It makes complete sense to me. There is a lot of new stuff here and I will need to reflect on it. Thank you once again for showing me a different perspective on the problem.

<Bob> I enjoyed it too – talking it through helps me to learn to explain it better – and I look forward to hearing the conclusions from your reflections because I know I will learn from that too.

Burn-and-Scrape


telephone_ringing_300_wht_14975[Ring Ring]

<Bob> Hi Leslie how are you to today?

<Leslie> I am good thanks Bob and looking forward to today’s session. What is the topic?

<Bob> We will use your Niggle-o-Gram® to choose something. What is top of the list?

<Leslie> Let me see.  We have done “Engagement” and “Productivity” so it looks like “Near-Misses” is next.

<Bob> OK. That is an excellent topic. What is the specific Niggle?

<Leslie> “We feel scared when we have a safety near-miss because we know that there is a catastrophe waiting to happen.”

<Bob> OK so the Purpose is to have a system that we can trust not to generate avoidable harm. Is that OK?

<Leslie> Yes – well put. When I ask myself the purpose question I got a “do” answer rather than a “have” one. The word trust is key too.

<Bob> OK – what is the current safety design used in your organisation?

<Leslie> We have a computer system for reporting near misses – but it does not deliver the purpose above. If the issue is ranked as low harm it is just counted, if medium harm then it may be mentioned in a report, and if serious harm then all hell breaks loose and there is a root cause investigation conducted by a committee that usually results in a new “you must do this extra check” policy.

<Bob> Ah! The Burn-and-Scrape model.

<Leslie>Pardon? What was that? Our Governance Department call it the Swiss Cheese model.

<Bob> Burn-and-Scrape is where we wait for something to go wrong – we burn the toast – and then we attempt to fix it – we scrape the burnt toast to make it look better. It still tastes burnt though and badly burnt toast is not salvageable.

<Leslie>Yes! That is exactly what happens all the time – most issues never get reported – we just “scrape the burnt toast” at all levels.

fire_blaze_s_150_clr_618 fire_blaze_h_150_clr_671 fire_blaze_n_150_clr_674<Bob> One flaw with the Burn-and-Scrape design is that harm has to happen for the design to work.

It is all reactive.

Another design flaw is that it focuses attention on the serious harm first – avoidable mortality for example.  Counting the extra body bags completely misses the purpose.  Avoidable death means avoidably shortened lifetime.  Avoidable non-fatal will also shorten lifetime – and it is even harder to measure.  Just consider the cumulative effect of all that non-fatal life-shortening avoidable-but-ignored harm?

Most of the reasons that we live longer today is because we have removed a lot of lifetime shortening hazards – like infectious disease and severe malnutrition.

Take health care as an example – accurately measuring avoidable mortality in an inherently high-risk system is rather difficult.  And to conclude “no action needed” from “no statistically significant difference in mortality between us and the global average” is invalid and it leads to a complacent delusion that what we have is good enough.  When it comes to harm it is never “good enough”.

<Leslie> But we do not have the resources to investigate the thousands of cases of minor harm – we have to concentrate on the biggies.

<Bob> And do the near misses keep happening?

<Leslie> Yes – that is why they are top rank  on the Niggle-o-Gram®.

<Bob> So the Burn-and-Scrape design is not fit-for-purpose.

<Leslie> So it seems. But what is the alternative? If there was one we would be using it – surely?

<Bob> Look back Leslie. How many of the Improvement Science methods that you have already learned are business-as-usual?

<Leslie> Good point. Almost none.

<Bob> And do they work?

<Leslie> You betcha!

<Bob> This is another example.  It is possible to design systems to be safe – so the frequent near misses become rare events.

<Leslie> Is it?  Wow! That know-how would be really useful to have. Can you teach me?

<Bob> Yes. First we need to explore what the benefits would be.

<Leslie> OK – well first there would be no avoidable serious harm and we could trust in the safety of our system – which is the purpose.

<Bob> Yes …. and?

<Leslie> And … all the effort, time and cost spent “scraping the burnt toast” would be released.

<Bob> Yes …. and?

<Leslie> The safer-by-design processes would be quicker and smoother, a more enjoyable experience for both customers and suppliers, and probably less expensive as well!

<Bob> Yes. So what does that all add up to?

<Leslie> A win-win-win-win outcome!

<Bob> Indeed. So a one-off investment of effort, time and money in learning Safety-by-Design methods would appear to be a wise business decision.

<Leslie> Yes indeed!  When do we start?

<Bob> We have already started.


For a real-world example of this approach delivering a significant and sustained improvement in safety click here.

The Tyranny of Choice

[Ding-a-Ling]
Bob’s new all-singing-and-dancing touchscreen phone pronounced the arrival of an email from an Improvement Science apprentice. This was always an opportunity for learning so he swiped the flashing icon and read the email. It was from Leslie.

<Leslie>Hi Bob, I have come across a new challenge that I never thought I would see – the team that I am working with are generating so many improvement-by-design ideas that we cannot decide what to try. Can you help?

Bob thumbed a reply immediately:
<Bob>Ah ha! The Tyranny of Choice challenge. Yes, I believe I can help. I am free to talk now if you are.

[“You have a call from Leslie”]
Bob’s new all-singing-and-dancing touchscreen phone said that it was Leslie on the line – (it actually said it in the synthetic robot voice that Bob had set as the default).

<Bob>Hello Leslie.

<Leslie>Hi Bob, thank you for replying so quickly. I gather that you have encountered this challenge before?

<Bob>Yes. It usually appears when a team are nearing the end of a bumpy ride on the Nerve Curve and are starting to see new possibilities that previously were there but hidden.

<Leslie>That is just where we are. The problem is we have flipped from no options to so many we cannot decide what to do.

<Bob>It is often assumed that choice is a good thing, but you can have too much of a good thing. Many studies have shown that when the number of innovative choices are limited then people are more likely to make a decision and actually do something. As the number of choices increase it gets much harder to choose so we default to the more comfortable and familiar status quo. We avoid making a decision and we do nothing. That is the Tyranny of Choice.

<Leslie>Yes, that is just how it feels. Paralyzed by indecision. So how do we get past this barrier?

<Bob>The same way we get past all barriers. We step back,  broaden our situational awareness and list all the obvious things and then consider doing exactly the opposite of what out intuition tells us. We just follow the tried-and-tested 6M Design script.

<Leslie>Arrgh! Yes, of course. We start with a 4N Chart.

<Bob>Yes, and specifically we start with the Nuggets.  We look for what is working despite the odds. The positive deviants. Who do you know is decisive when faced with a host of confusing and conflicting options? Not tyrannized by choice.

<Leslie>Other than you?

<Bob>It does not matter who. How do they do it?

<Leslie>Well – “they” use a special sort of map that I confess I have not mastered yet – the Right-2-Left Map.

<Bob>Yes, an effective way to avoid getting lost in the Labyrinth of Options. What else?

<Leslie>“They” know what the critical steps are and “they” give clear step-by-step guidance of what to do to complete them.

<Bob>This is called “story-boarding”.  It is rather like sketching each scene of a play – then practicing each scene script individually until they are second nature and ready when needed.

<Leslie>That is just like what the emergency medical teams do. They have scripts that they use for emergent situations where it is dangerous to try to plan what to do in the moment.  They call them “care bundles”. It avoids a lot of time-wasting, debate, prevarication and the evidence shows that it delivers better outcomes and saves lives.

<Bob>In an emergency situation the natural feeling of fear creates the emotional drive to act; but without a well-designed and fully-tested script the same fear can paralyze the decision process. It is the rabbit-in-the-headlights effect.  When the feeling of urgency is less a different approach is needed to engage the emotional-power-train.

<Leslie>Do you mean build engagement?

<Bob>Yes, and how do we do that?

<Leslie>We use a combination of subjective stories and objective evidence – heart stuff and head stuff. It is a very effective combination to break through the Carapace of Complacency as you call it. I have seen that work really well in practice.

<Bob>And the 4N Chart comes in handy here again because it helps us see the emotional-terrain in perspective and to align us in moving away from the Niggles towards the NiceIfs while avoiding the NoNos and leveraging the Nuggets.

<Leslie>Yes! I have seen that too. But what do we do when we are in new territory; when we are faced with a swarm of novel options; when we have no pre-designed scripts to help us?

<Bob>We use a meta-script?

<Leslie>A what?

<Bob>A meta-script is one that we use to design a novel action script when we need it.

<Leslie>You mean a single method for creating a plan that we are confident will work?

<Bob>Yes.

<Leslie>That is what the Right-2-Left Map is!

<Bob>Yes.

<Leslie>So the Tyranny of Choice is the result of our habitual Left-2-Right thinking.

<Bob>Yes.

<Leslie>And when the future choices we see are also shrouded in ambiguity it is even harder to make a decision!

<Bob>Yes. We cannot see past the barrier of uncertainty – so we stop and debate because it feels safer.

<Leslie>Which is why so many really clever people seem get stuck in the paralysis of analysis and valueless discussion.

<Bob>Yes.

<Leslie>So all we need to do is switch to the counter-intuitive Right-2-Left thinking and the path becomes clear?

<Bob>Not quite.  The choices become a lot easier so the Tyranny of Choice disappears. We still have choices. There are still many possible paths. But it does not matter which we choose because they all lead to the common goal.

<Leslie>Thank you Bob. I am going to have to mull this one over for a while – red wine may help.

<Bob>Yes – mulled wine is a favorite of mine too. Ching-ching!

Time-Reversed Insight

stick_figure_wheels_turning_150_wht_4572Thinking-in-reverse sounds like an odd thing to do but it delivers more insight and solves tougher problems than thinking forwards.  That is the reason it is called Time-Reversed Insight.   And once we have mastered how to do it, we discover that it comes in handy in all sorts of problematic situations where thinking forwards only hits a barrier or even makes things worse.

Time-reversed thinking is not the same thing as undoing what you just did. It is reverse thinking – not reverse acting.

We often hear the advice “Start with the end in mind …” and that certainly sounds like it might be time-reversed thinking, but it is often followed by “… to help guide your first step.” The second part tells us it is not. Jumping from outcome to choosing the first step is actually time-forward thinking.

Time-forward thinking comes in many other disguises: “Seeking your True North” is one and “Blue Sky Thinking” is another. They are certainly better than discounting the future and they certainly do help us to focus and to align our efforts – but they are still time-forward thinking. We know that because the next question is always “What do we do first? And then? And then?” in other words “What is our Plan?”.

This is not time-reversed insightful thinking: it is good old, tried-and-tested, cause-and-effect thinking. Great for implementation but a largely-ineffective, and a hugely-inefficient way to dissolve “difficult” problems. In those situation it becomes keep-busy behaviour. Plan-Do-Plan-Do-Plan-Do ……..


In time-reversed thinking the first question looks similar. It is a question about outcome but it is very specific.  It is “What outcome do we want? When do we want it? and How would we know we have got it?”  It is not a direction. It is a destination. The second question in time-reversed thinking is the clincher. It is  “What happened just before?” and is followed by “And before that? And before that?“.

We actually do this all the time but we do it unconsciously and we do it very fast.  It is called the “blindingly obvious in hindsight” phenomenon.  What happens is we feel the good or bad outcome and then we flip to the cause in one unconscious mental leap. Ah ha!

And we do this because thinking backwards in a deliberate, conscious, sequential way is counter-intuitive.

Our unconscious mind seems to have no problem doing it though. And that is because it is wired differently. Some psychologists believe that we literally have “two brains”: one that works sequentially in the direction of forward time – and one that works in parallel and in a forward-and backward in time fashion. It is the sequential one that we associate with conscious thinking; it is the parallel one that we associate with unconscious feeling. We do both and usually they work in synergy – but not always. Sometimes they antagonise each other.

The problem is that our sequential, conscious brain does not  like working backwards. Just like we do not like walking backwards, or driving backwards.  We have evolved to look, think, and move forwards. In time.

So what is so useful about deliberate, conscious, time-reversed thinking?

It can give us an uniquely different perspective – one that generates fresh insight – and that new view enables us to solve problems that we believed were impossible when looked at in a time-forward way.


An example of time-reverse thinking:

The 4N Chart is an emotional mapping tool.  More specifically it is an emotion-over-time mapping technique. The way it is used is quite specific and quite counter-intuitive.  If we ask ourselves the question “What is my top Niggle?” our reply is usually something like “Not enough time!” or “Person x!” or “Too much work!“.  This is not how The 4N Chart is designed to be used.  The question is “What is my commonest negative feeling?” and then the question “What happened just before I felt it?“.  What was the immediately preceding cause of  the Niggle? And then the questions continue deliberately and consciously to think backwards: “And before that?”, “And before that?” until the root causes are laid bare.

A typical Niggle-cause exposing dialog might be:

Q: What is my most commonest negative feeling?
A: I feel angry!
Q: What happened just before?
A: My boss gives me urgent jobs to do at half past 4 on Friday afternoon!
Q: And before that?
A: Reactive crisis management meetings are arranged at very short notice!
Q: And before that?
A: We have regular avoidable crises!
Q: And before that?
A: We are too distracted with other important work to spot each crisis developing!
Q: And before that?
A: We were not able to recruit when a valuable member of staff left.
Q: And before that?
A: Our budget was cut!

This is time-reversed  thinking and we can do this reasonably easily because we are working backwards from the present – so we can use our memory to help us. And we can do this individually and collectively. Working backwards from the actual outcome is safer because we cannot change the past.

It is surprisingly effective though because by doing this time-reverse thinking consciously we uncover where best to intervene in the cause-and-effect pathway that generates our negative emotions. Where it crosses the boundary of our Circle of Control. And all of us have the choice to step-in just before the feeling is triggered. We can all choose if we are going to allow the last cause to trigger to a negative feeling in us. We can all learn to dodge the emotional hooks. It takes practice but it is possible. And having deflected the stimulus and avoided being hijacked by our negative emotional response we are then able to focus our emotional effort into designing a way to break the cause-effect-sequence further upstream.

We might leave ourselves a reminder to check on something that could develop into a crisis without us noticing. Averting just one crisis would justify all the checking!

This is what calm-in-a-crisis people do. They disconnect their feelings. It is very helpful but it has a risk.

robot_builder_textThe downside is that they can disconnect all their feelings – including the positive ones. They can become emotionless, rational, logical, tough-minded robots.  And that can be destructive to individual and team morale. It is the antithesis of improvement.

So be careful when disconnecting emotional responses – do it only for defense – never for attack.


A more difficult form of time-reversed thinking is thinking backwards from future-to-present.  It is more difficult for many reasons, one of which is because we do not have a record of what actually happened to help us.  We do however have experience of  similar things from the past so we can make a good guess at the sort of things that could cause a future outcome.

Many people do this sort of thinking in a risk-avoidance way with the objective of blocking all potential threats to safety at an early stage. When taken to extreme it can manifest as turgid, red-taped, blind bureaucracy that impedes all change. For better or worse.

Future-to-present thinking can be used as an improvement engine – by unlocking potential opportunity at an early stage. Innovation is a fragile flower and can easily be crushed. Creative thinking needs to be nurtured long enough to be tested.

Change is deliberately destablising so this positive form of future-to-present thinking can also be counter-productive if taken to extreme when it becomes incessant meddling. Change for change sake is also damaging to morale.

So, either form of future-to-present thinking is OK in moderation and when used in synergy the effect is like magic!

Synergistic future-to-present time-reversed thinking is called Design Thinking and one formulation is called 6M Design.

What Can I Do To Help?

stick_figures_moving_net_150_wht_8609The growing debate about the safety of our health care systems is gaining momentum.

This is not just a UK phenomenon.

The same question was being asked 10 years ago across the pond by many people – perhaps the most familiar name is Don Berwick.

The term Improvement Science has been buzzing around for a long time. This is a global – not just a local challenge.

Seeing the shameful reality in black-and-white [the Francis Report] is a nasty shock to everyone. There are no winners here. Our blissful ignorance is gone. Painful awareness has arrived.

The usual emotional reaction to being shoved from blissful ignorance into painful awareness is characteristic;  and it does not matter if it is discovering horse in your beef pie or hearing of 1200 avoidable deaths in a UK hospital.

Our emotional reaction is a predictable sequence that goes something like:

Shock => Denial => Anger =>Bargaining =>Depression =>Acceptance

=> Resolution.

It is the psychological healing process that is called the grief reaction and it is a normal part of the human psyche. We all do it. And we do it both individually and collectively. I remember well the global grief reactions that followed the sudden explosion of Challenger; the sudden death of Princess Diana; and the sudden collapse of the Twin Towers.

Fortunately such avoidable tragedies are uncommon.

The same chain-reaction happens to a lesser degree in any sudden change. We grieve the loss of our old way of thinking – we mourn the passing away our comfortable rhetoric that has been rudely and suddenly disproved by harsh reality. This is the Nerve Curve.  And learning to ride it safely is a critical-to-survival life skill.  Especially in turbulent times.

The UK population has suffered two psychological shocks in recent weeks – the discovery of horse in the beef pie and the fuller public disclosure of the story behind the 1000’s of avoidable deaths in one of our Trust hospitals. Both are now escalating and the finger of blame is pointing squarely at a common cause: the money-tail-wagging-the-safety-dog.

So what will happen next?  The Wall of Denial has been dynamited with hard evidence. We are now into the Collective Anger phase.

First there will be widespread righteous indignation and a strong desire to blame, to hunt down the evil ones, and to crucify the responsible and accountable. Partly as punishment, partly as a lesson to others, and partly to prevent them doing harm again.  Uncontrolled anger is dangerous especially when there is a lethal weapon to hand. The more controlled, action-oriented and future-focused will want to do something about it. Now! There will be rallies, and soap-boxes, and megaphones. The We-Told-You-So brigade will get shoved aside and trampled in the rush to do something – ANYTHING. Conferences will be hastily arranged and those most fearful for their reputations and jobs will cough up the cash and clear their diaries. They will be expected to be there. They will be. Desperately looking for answers. Anxiously seeking credible leaders. And the snake-oil salesmen will have a bonanza! The calmer, more reflective, phlegmatic, academic types will call for more money for more research so that we can fully analyse and fully understand the problem before we do anything.

And while the noisy bargaining for more cash keeps everyone busy the harm will continue to happen.

Eventually the message will sink in as the majority accept that there is no way to change the past; that we cannot cling to what is out-of-date thinking; and that all of our new-reality-avoiding tactics are fruitless. And we are forced to accept that there is no more cash. Now we are in danger of becoming helpless and hopeless, slipping into depression, and then into despair. We are at risk of giving up and letting ourselves wallow and drown in self-pity. This is a dangerous phase. Depression is understandable but it is avoidable because there is always something than can be done. We can always ask the elephant-in-the-room questions. Inside we usually know the answers.

We accept the new reality; we accept that we cannot change the past, we accept that we have some learning to do; we accept that we have to adjust; and we accept that all of us can do something.

Now we have reached the most important stage – resolution. This is the test of our resolve. Are we all-talk or can we convert talk-to-walk?

stick_figure_help_button_150_wht_9911We can all ask ourselves one question: “What can I do to help?”

I have asked myself that question and my first answer was “As a system designer I can help by looking at this challenge as a design assignment and describe what I see “.

Design starts with the intended outcome, the vision, the goal, the objective, the specification, the target.

The design goal is: Significant reduction in avoidable harm in the NHS, quickly, and at no extra cost.

[Please note that a design goal is a “what we get” not a “what we do”. It is a purpose and not just a process.]

Now we can invite, gather, dream-up, brain-storm any number of design options and then we can consider logically and rationally how well they might meet our design goal.

What are some of the design options on the table?

Design Option 1. Create a cadre of hospital inspectors.

Nope – that will take time and money and inspection alone does not guarantee better outcomes. We have enough evidence of that.

Design Option 2. Get lots more PhDs funded, do high quality academic research, write papers, publish them and hope the evidence is put into practice.

Nope – that will take time and money too and publication alone does not guarantee adoption of the lessons and delivery of better outcomes. We have enough evidence of that too. What is proven to be efficacious in a research trial is not necessarily effective, practical or affordable  in reality.  

Design Option 3. Put together conferences and courses to teach/train a new generation of competent healthcare improvement practitioners.

Maybe – it has the potential to deliver the outcome but it too will take time and money. We have been doing conferences and courses for decades – they are not very cost-effective. The Internet may have changed things though. 

Design Option 4. All of the above plus broadcast via the Internet the current pragmatic know-how of the basics of safe system design to everyone in the NHS so that they know what is possible and they know how to get started.

Promising – it has the greatest potential to deliver the required outcome, a broadcast will cost nothing and it can start working immediately.

OK – Option 4 it is – here we go …

The Basics of How To Design a Safe System

Definition 1: Safe means free of risk of harm.

Definition 2Harm is the result of hazards combining with risks.

There are two components to safe system design – the people stuff and the process stuff.

For example a busy main road is designed to facilitate the transport of stuff from A to B. It also represents a hazard – the potential for harm. If the vehicles bump into each other or other things then harm will result. So a lot of the design of the vehicles and the roads is about reducing the risk of bumps or mitigating the effects (e.g. seat-belts).

The risk is multi-factorial. If you drive at high speed, under the influence of recreational drugs, at night, on an icy road then the probability of having a bump is high.  If you step into a busy road without looking then the risk of getting bumped into is high too.

So the path to better safety is to eliminate as many hazards as possible and to reduce the risks as much as possible. And we have to do that without unintentionally creating more hazards, higher risks, excessive delays and higher costs.

So how is this done outside healthcare?

One tried-and-tested method for designing safer processes is called FMEA – Failure Modes and Effects Analysis.

Now that sounds really nerdy and it is.  It is an attention-to-detail exercise that will make your brain ache and your eyes bleed. But it works – so it is worthwhile learning the basic principles.

For the people part there is the whole body of Human Factors Research to access. This is also a bit nerdy for us hands-on oily-rag pragmatists so if you want something more practical immediately then have a go with The 4N Chart and the Niggle-o-Gram (which is a form of emotional FMEA). This short summary is also free to download, read, print, copy, share, discuss and use.

OK – I am off to design and build something else – an online course for teaching safety-by-design.

What are you going to do to help improve safety in the NHS?

The Writing on the Wall – Part II

Who_Is_To_BlameThe retrospectoscope is the favourite instrument of the forensic cynic – the expert in the after-the-event-and-I-told-you-so rhetoric. The rabble-rouser for the lynch-mob.

It feels better to retrospectively nail-to-a-cross the person who committed the Cardinal Error of Omission, and leave them there in emotional and financial pain as a visible lesson to everyone else.

This form of public feedback has been used for centuries.

It is called barbarism, and it has no place in a modern civilised society.


A more constructive question to ask is:

Could the evolving Mid-Staffordshire crisis have been detected earlier … and avoided?”

And this question exposes a tricky problem: it is much more difficult to predict the future than to explain the past.  And if it could have been detected and avoided earlier, then how is that done?  And if the how-is-known then is everyone else in the NHS using this know-how to detect and avoid their own evolving Mid-Staffs crisis?

To illustrate how it is currently done let us use the actual Mid-Staffs data. It is conveniently available in Figure 1 embedded in Figure 5 on Page 360 in Appendix G of Volume 1 of the first Francis Report.  If you do not have it at your fingertips I have put a copy of it below.
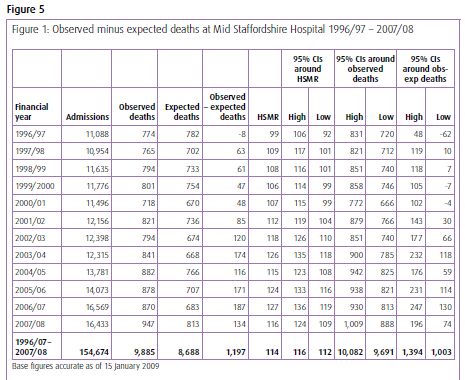
MS_RawData

The message does not exactly leap off the page and smack us between the eyes does it? Even with the benefit of hindsight.  So what is the problem here?

The problem is one of ergonomics. Tables of numbers like this are very difficult for most people to interpret, so they create a risk that we ignore the data or that we just jump to the bottom line and miss the real message. And It is very easy to miss the message when we compare the results for the current period with the previous one – a very bad habit that is spread by accountants.

This was a slowly emerging crisis so we need a way of seeing it evolving and the better way to present this data is as a time-series chart.

As we are most interested in safety and outcomes, then we would reasonably look at the outcome we do not want – i.e. mortality.  I think we will all agree that it is an easy enough one to measure.
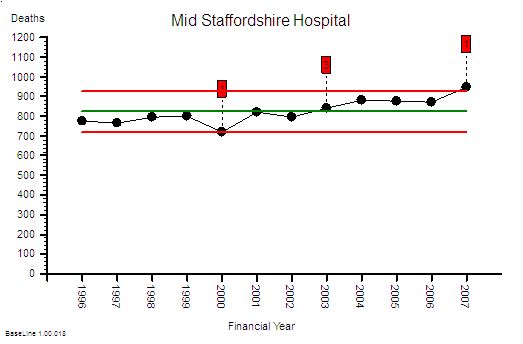
MS_RawDeathsThis is the raw mortality data from the table above, plotted as a time-series chart.  The green line is the average and the red-lines are a measure of variation-over-time. We can all see that the raw mortality is increasing and the red flags say that this is a statistically significant increase. Oh dear!

But hang on just a minute – using raw mortality data like this is invalid because we all know that the people are getting older, demand on our hospitals is rising, A&Es are busier, older people have more illnesses, and more of them will not survive their visit to our hospital. This rise in mortality may actually just be because we are doing more work.

Good point! Let us plot the activity data and see if there has been an increase.
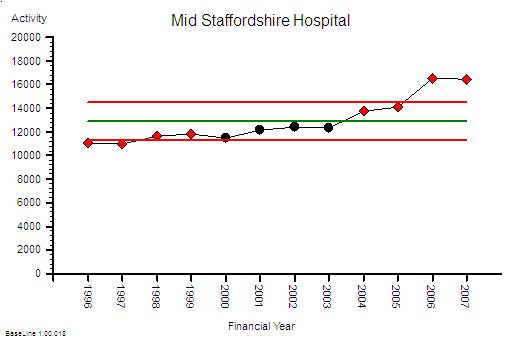
MS_Activity

Yes – indeed the activity has increased significantly too.

Told you so! And it looks like the activity has gone up more than the mortality. Does that mean we are actually doing a better job at keeping people alive? That sounds like a more positive message for the Board and the Annual Report. But how do we present that message? What about as a ratio of mortality to activity? That will make it easier to compare ourselves with other hospitals.

Good idea! Here is the Raw Mortality Ratio chart.
MS_RawMortality_RatioAh ha. See! The % mortality is falling significantly over time. Told you so.

Careful. There is an unstated assumption here. The assumption that the case mix is staying the same over time. This pattern could also be the impact of us doing a greater proportion of lower complexity and lower risk work.  So we need to correct this raw mortality data for case mix complexity – and we can do that by using data from all NHS hospitals to give us a frame of reference. Dr Foster can help us with that because it is quite a complicated statistical modelling process. What comes out of Dr Fosters black magic box is the Global Hospital Raw Mortality (GHRM) which is the expected number of deaths for our case mix if we were an ‘average’ NHS hospital.
MS_ExpectedMortality_Ratio

What this says is that the NHS-wide raw mortality risk appears to be falling over time (which may be for a wide variety of reasons but that is outside the scope of this conversation). So what we now need to do is compare this global raw mortality risk with our local raw mortality risk  … to give the Hospital Standardised Mortality Ratio.
MS_HSMRThis gives us the Mid Staffordshire Hospital HSMR chart.  The blue line at 100 is the reference average – and what this chart says is that Mid Staffordshire hospital had a consistently higher risk than the average case-mix adjusted mortality risk for the whole NHS. And it says that it got even worse after 2001 and that it stayed consistently 20% higher after 2003.

Ah! Oh dear! That is not such a positive message for the Board and the Annual Report. But how did we miss this evolving safety catastrophe?  We had the Dr Foster data from 2001

This is not a new problem – a similar thing happened in Vienna between 1820 and 1850 with maternal deaths caused by Childbed Fever. The problem was detected by Dr Ignaz Semmelweis who also discovered a simple, pragmatic solution to the problem: hand washing.  He blew the whistle but unfortunately those in power did not like the implication that they had been the cause of thousands of avoidable mother and baby deaths.  Semmelweis was vilified and ignored, and he did not publish his data until 1861. And even then the story was buried in tables of numbers.  Semmelweis went mad trying to convince the World that there was a problem.  Here is the full story.

Also, time-series charts were not invented until 1924 – and it was not in healthcare – it was in manufacturing. These tried-and-tested safety and quality improvement tools are only slowly diffusing into healthcare because the barriers to innovation appear somewhat impervious.

And the pores have been clogged even more by the social poison called “cynicide” – the emotional and political toxin exuded by cynics.

So how could we detect a developing crisis earlier – in time to avoid a catastrophe?

The first step is to estimate the excess-death-equivalent. Dr Foster does this for you.MS_ExcessDeathsHere is the data from the table plotted as a time-series chart that shows that the estimated-excess-death-equivalent per year. It has an average of 100 (that is two per week) and the average should be close to zero. More worryingly the number was increasing steadily over time up to 200 per year in 2006 – that is about four excess deaths per week – on average.  It is important to remember that HSMR is a risk ratio and mortality is a multi-factorial outcome. So the excess-death-equivalent estimate does not imply that a clear causal chain will be evident in specific deaths. That is a complete misunderstanding of the method.
I am sorry – you are losing me with the statistical jargon here. Can you explain in plain English what you mean?

OK. Let us use an example.

Suppose we set up a tombola at the village fete and we sell 50 tickets with the expectation that the winner bags all the money. Each ticket holder has the same 1 in 50 risk of winning the wad-of-wonga and a 49 in 50 risk of losing their small stake. At the appointed time we spin the barrel to mix up the ticket stubs then we blindly draw one ticket out. At that instant the 50 people with an equal risk changes to one winner and 49 losers. It is as if the grey fog of risk instantly condenses into a precise, black-and-white, yes-or-no, winner-or-loser, reality.

Translating this concept back into HSMR and Mid Staffs – the estimated 1200 deaths are the just the “condensed risk of harm equivalent”.  So, to then conduct a retrospective case note analysis of specific deaths looking for the specific cause would be equivalent to trying to retrospectively work out the reason the particular winning ticket in the tombola was picked out. It is a search that is doomed to fail. To then conclude from this fruitless search that HSMR is invalid, is only to compound the delusion further.  The actual problem here is ignorance and misunderstanding of the basic Laws of Physics and Probability, because our brains are not good at solving these sort of problems.

But Mid Staffs is a particularly severe example and  it only shows up after years of data has accumulated. How would a hospital that was not as bad as this know they had a risk problem and know sooner? Waiting for years to accumulate enough data to prove there was a avoidable problem in the past is not much help. 

That is an excellent question. This type of time-series chart is not very sensitive to small changes when the data is noisy and sparse – such as when you plot the data on a month-by-month timescale and avoidable deaths are actually an uncommon outcome. Plotting the annual sum smooths out this variation and makes the trend easier to see, but it delays the diagnosis further. One way to increase the sensitivity is to plot the data as a cusum (cumulative sum) chart – which is conspicuous by its absence from the data table. It is the running total of the estimated excess deaths. Rather like the running total of swings in a game of golf.
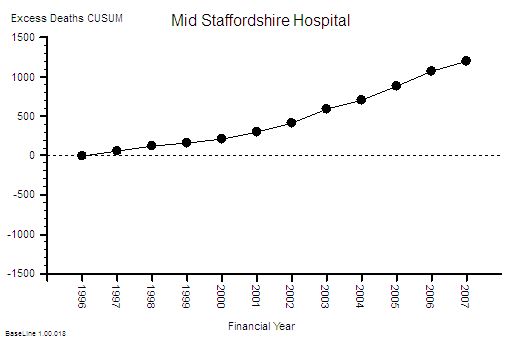
MS_ExcessDeaths_CUSUMThis is the cusum chart of excess deaths and you will notice that it is not plotted with control limits. That is because it is invalid to use standard control limits for cumulative data.  The important feature of the cusum chart is the slope and the deviation from zero. What is usually done is an alert threshold is plotted on the cusum chart and if the measured cusum crosses this alert-line then the alarm bell should go off – and the search then focuses on the precursor events: the Near Misses, the Not Agains and the Niggles.

I see. You make it look easy when the data is presented as pictures. But aren’t we still missing the point? Isn’t this still after-the-avoidable-event analysis?

Yes! An avoidable death should be a Never-Event in a designed-to-be-safe healthcare system. It should never happen. There should be no coffins to count. To get to that stage we need to apply exactly the same approach to the Near-Misses, and then the Not-Agains, and eventually the Niggles.

You mean we have to use the SUI data and the IR1 data and the complaint data to do this – and also ask our staff and patients about their Niggles?

Yes. And it is not the number of complaints that is the most useful metric – it is the appearance of the cumulative sum of the complaint severity score. And we need a method for diagnosing and treating the cause of the Niggles too. We need to convert the feedback information into effective action.

Ah ha! Now I understand what the role of the Governance Department is: to apply the tools and techniques of Improvement Science proactively.  But our Governance Department have not been trained to do this!

Then that is one place to start – and their role needs to evolve from Inspectors and Supervisors to Demonstrators and Educators – ultimately everyone in the organisation needs to be a competent Healthcare Improvementologist.

OK – I now now what to do next. But wait a minute. This is going to cost a fortune!

This is just one small first step.  The next step is to redesign the processes so the errors do not happen in the first place. The cumulative cost saving from eliminating the repeated checking, correcting, box-ticking, documenting, investigating, compensating and insuring is much much more than the one-off investment in learning safe system design.

So the Finance Director should be a champion for safety and quality too.

Yup!

Brill. Thanks. And can I ask one more question? I do not want to appear to skeptical but how do we know we can trust that this risk-estimation system has been designed and implemented correctly? How do we know we are not being bamboozled by statisticians? It has happened before!

That is the best question yet.  It is important to remember that HSMR is counting deaths in hospital which means that it is not actually the risk of harm to the patient that is measured – it is the risk to the reputation of hospital! So the answer to your question is that you demonstrate your deep understanding of the rationle and method of risk-of-harm estimation by listing all the ways that such a system could be deliberately “gamed” to make the figures look better for the hospital. And then go out and look for hard evidence of all the “games” that you can invent. It is a sort of creative poacher-becomes-gamekeeper detective exercise.

OK – I sort of get what you mean. Can you give me some examples?

Yes. The HSMR method is based on deaths-in-hospital so discharging a patient from hospital before they die will make the figures look better. Suppose one hospital has more access to end-of-life care in the community than another: their HSMR figures would look better even though exactly the same number of people died. Another is that the HSMR method is weighted towards admissions classified as “emergencies” – so if a hospital admits more patients as “emergencies” who are not actually very sick and discharges them quickly then this will inflated their estimated deaths and make their actual mortality ratio look better – even though the risk-of-harm to patients has not changed.

OMG – so if we have pressure to meet 4 hour A&E targets and we get paid more for an emergency admission than an A&E attendance then admitting to an Assessmen Area and discharging within one day will actually reward the hospital financially, operationally and by apparently reducing their HSMR even though there has been no difference at all to the care that patients actually recieve?

Yes. It is an inevitable outcome of the current system design.

But that means that if I am gaming the system and my HSMR is not getting better then the risk-of-harm to patients is actually increasing and my HSMR system is giving me false reassurance that everything is OK.   Wow! I can see why some people might not want that realisation to be public knowledge. So what do we do?

Design the system so that the rewards are aligned with lower risk of harm to patients and improved outcomes.

Is that possible?

Yes. It is called a Win-Win-Win design.

How do we learn how to do that?

Improvement Science.

Footnote I:

The graphs tell a story but they may not create a useful sense of perspective. It has been said that there is a 1 in 300 chance that if you go to hospital you will not leave alive for avoidable causes. What! It cannot be as high as 1 in 300 surely?

OK – let us use the published Mid-Staffs data to test this hypothesis. Over 12 years there were about 150,000 admissions and an estimated 1,200 excess deaths (if all the risk were concentrated into the excess deaths which is not what actually happens). That means a 1 in 130 odds of an avoidable death for every admission! That is twice as bad as the estimated average.

The Mid Staffordshire statistics are bad enough; but the NHS-as-a-whole statistics are cumulatively worse because there are 100’s of other hospitals that are each generating not-as-obvious avoidable mortality. The data is very ‘noisy’ so it is difficult even for a statistical expert to separate the message from the morass.

And remember – that  the “expected” mortality is estimated from the average for the whole NHS – which means that if this average is higher than it could be then there is a statistical bias and we are being falsely reassured by being ‘not statistically significantly different’ from the pack.

And remember too – for every patient and family that suffers and avoidable death there are many more that have to live with the consequences of avoidable but non-fatal harm.  That is called avoidable morbidity.  This is what the risk really means – everyone has a higher risk of some degree of avoidable harm. Psychological and physical harm.

This challenge is not just about preventing another Mid Staffs – it is about preventing 1000’s of avoidable deaths and 100,000s of patients avoidably harmed every year in ‘average’ NHS trusts.

It is not a mass conspiracy of bad nurses, bad doctors, bad managers or bad policians that is the root cause.

It is poorly designed processes – and they are poorly designed because the nurses, doctors and managers have not learned how to design better ones.  And we do not know how because we were not trained to.  And that education gap was an accident – an unintended error of omission.  

Our urgently-improve-NHS-safety-challenge requires a system-wide safety-by-design educational and cultural transformation.

And that is possible because the knowledge of how to design, test and implement inherently safe processes exists. But it exists outside healthcare.

And that safety-by-design training is a worthwhile investment because safer-by-design processes cost less to run because they require less checking, less documenting, less correcting – and all the valuable nurse, doctor and manager time freed up by that can be reinvested in more care, better care and designing even better processes and systems.

Everyone Wins – except the cynics who have a choice: to eat humble pie or leave.

Footnote II:

In the debate that has followed the publication of the Francis Report a lot of scrutiny has been applied to the method by which an estimated excess mortality number is created and it is necessary to explore this in a bit more detail.

The HSMR is an estimate of relative risk – it does not say that a set of specific patients were the ones who came to harm and the rest were OK. So looking at individual deaths and looking for the specific causes is to completely misunderstand the method. So looking at the actual deaths individually and looking for identifiable cause-and-effect paths is an misuse of the message.  When very few if any are found to conclude that HSMR is flawed is an error of logic and exposes the ignorance of the analyst further.

HSMR is not perfect though – it has weaknesses.  It is a benchmarking process the”standard” of 100 is always moving because the collective goal posts are moving – the reference is always changing . HSMR is estimated using data submitted by hospitals themselves – the clinical coding data.  So the main weakness is that it is dependent on the quality of the clinicial coding – the errors of comission (wrong codes) and the errors of omission (missing codes). Garbage In Garbage Out.

Hospitals use clinically coded data for other reasons – payment. The way hospitals are now paid is based on the volume and complexity of that activity – Payment By Results (PbR) – using what are called Health Resource Groups (HRGs). This is a better and fairer design because hospitals with more complex (i.e. costly to manage) case loads get paid more per patient on average.  The HRG for each patient is determined by their clinical codes – including what are called the comorbidities – the other things that the patient has wrong with them. More comorbidites means more complex and more risky so more money and more risk of death – roughly speaking.  So when PbR came in it becamevery important to code fully in order to get paid “properly”.  The problem was that before PbR the coding errors went largely unnoticed – especially the comorbidity coding. And the errors were biassed – it is more likely to omit a code than to have an incorrect code. Errors of omission are harder to detect. This meant that by more complete coding (to attract more money) the estimated casemix complexity would have gone up compared with the historical reference. So as actual (not estimated) NHS mortality has gone down slightly then the HSMR yardstick becomes even more distorted.  Hospitals that did not keep up with the Coding Game would look worse even though  their actual risk and mortality may be unchanged.  This is the fundamental design flaw in all types of  benchmarking based on self-reported data.

The actual problem here is even more serious. PbR is actually a payment for activity – not a payment for outcomes. It is calculated from what it cost to run the average NHS hospital using a technique called Reference Costing which is the same method that manufacturing companies used to decide what price to charge for their products. It has another name – Absorption Costing.  The highest performers in the manufacturing world no longer use this out-of-date method. The implication of using Reference Costing and PbR in the NHS are profound and dangerous:

If NHS hospitals in general have poorly designed processes that create internal queues and require more bed days than actually necessary then the cost of that “waste” becomes built into the future PbR tariff. This means average length of stay (LOS) is financially rewarded. Above average LOS is financially penalised and below average LOS makes a profit.  There is no financial pressure to improve beyound average. This is called the Regression to the Mean effect.  Also LOS is not a measure of quality – so there is a to shorten length of stay for purely financial reasons – to generate a surplus to use to fund growth and capital investment.  That pressure is non-specific and indiscrimiate.  PbR is necessary but it is not sufficient – it requires an quality of outcome metric to complete it.    

So the PbR system is based on an out-of-date cost-allocation model and therefore leads to the very problems that are contributing to the MidStaffs crisis – financial pressure causing quality failures and increased risk of mortality.  MidStaffs may be a chance victim of a combination of factors coming together like a perfect storm – but those same factors are present throughout the NHS because they are built into the current design.

One solution is to move towards a more up-to-date financial model called stream costing. This uses the similar data to reference costing but it estimates the “ideal” cost of the “necessary” work to achieve the intended outcome. This stream cost becomes the focus for improvement – the streams where there is the biggest gap between the stream cost and the reference cost are the focus of the redesign activity. Very often the root cause is just poor operational policy design; sometimes it is quality and safety design problems. Both are solvable without investment in extra capacity. The result is a higher quality, quicker, lower-cost stream. Win-win-win. And in the short term that  is rewarded by a tariff income that exceeds cost and a lower HSMR.

Radically redesigning the financial model for healthcare is not a quick fix – and it requires a lot of other changes to happen first. So the sooner we start the sooner we will arrive. 

The Six Dice Game

<Ring Ring><Ring Ring>

?Hello, you are through to the Improvement Science Helpline. How can we help?

This is Leslie, one of your FISH apprentices.  Could I speak to Bob – my ISP coach?

?Yes, Bob is free. I will connect you now.

<Ring Ring><Ring Ring>

?Hello Leslie, Bob here. How can I help?

Hi Bob, I have a problem that I do not feel my Foundation training has equipped me to solve. Can I talk it through with you?

?Of course. Can you outline the context for me?

Yes. The context is a department that is delivering an acceptable quality-of-service and is delivering on-time but is failing financially. As you know we are all being forced to adopt austerity measures and I am concerned that if their budget is cut then they will fail on delivery and may start cutting corners and then fail on quality too.  We need a win-win-win outcome and I do not know where to start with this one.

?OK – are you using the 6M Design method?

Yes – of course!

?OK – have you done The 4N Chart for the customer of their service?

Yes – it was their customers who asked me if I could help and that is what I used to get the context.

?OK – have you done The 4N Chart for the department?

Yes. And that is where my major concerns come from. They feel under extreme pressure; they feel they are working flat out just to maintain the current level of quality and on-time delivery; they feel undervalued and frustrated that their requests for more resources are refused; they feel demoralized; demotivated and scared that their service may be ‘outsourced’. On the positive side they feel that they work well as a team and are willing to learn. I do not know what to do next.

?OK. Do not panic. This sounds like a very common and treatable system illness.  It is a stream design problem which may be the reason your Foundation training feels insufficient. Would you like to see how a Practitioner would approach this?

Yes please!

?OK. Have you mapped their internal process?

Yes. It is a six-step process for each job. Each step has different requirements and are done by different people with different skills. In the past they had a problem with poor service quality so extra safety and quality checks were imposed by the Governance department.  Now the quality of each step is measured on a 1-6 scale and the quality of the whole process is the sum of the individual steps so is measured on a scale of 6 to 36. They now have been given a minimum quality target of 21 to achieve for every job. How they achieve that is not specified – it was left up to them.

?OK – do they record their quality measurement data?

Yes – I have their report.

?OK – how is the information presented?

As an average for the previous month which is reported up to the Quality Performance Committee.

?OK – what was the average for last month?

Their results were 24 – so they do not have an issue delivering the required quality. The problem is the costs they are incurring and they are being labelled by others as ‘inefficient’. Especially the departments who are in budget and are annoyed that this department keeps getting ‘bailed out’.

?OK. One issue here is the quality reporting process is not alerting you to the real issue. It sounds from what you say that you have fallen into the Flaw of Averages trap.

I don’t understand. What is the Flaw of Averages trap?

?The answer to your question will become clear. The finance issue is a symptom – an effect – it is unlikely to be the cause. When did this finance issue appear?

Just after the Safety and Quality Review. They needed to employ more agency staff to do the extra work created by having to meet the new Minimum Quality target.

?OK. I need to ask you a personal question. Do you believe that improving quality always costs more?

I have to say that I am coming to that conclusion. Our Governance and Finance departments are always arguing about it. Governance state ‘a minimum standard of safety and quality is not optional’ and finance say ‘but we are going out of business’. They are at loggerheads. The departments get caught in the cross-fire.

?OK. We will need to use reality to demonstrate that this belief is incorrect. Rhetoric alone does not work. If it did then we would not be having this conversation. Do you have the raw data from which the averages are calculated?

Yes. We have the data. The quality inspectors are very thorough!

?OK – can you plot the quality scores for the last fifty jobs as a BaseLine chart?

Yes – give me a second. The average is 24 as I said.

?OK – is the process stable?

Yes – there is only one flag for the fifty. I know from my FISH training that is not a cause for alarm.

?OK – what is the process capability?

I am sorry – I don’t know what you mean by that?

?My apologies. I forgot that you have not completed the Practitioner training yet. The capability is the range between the red lines on the chart.

Um – the lower line is at 17 and the upper line is at 31.

?OK – how many points lie below the target of 21.

None of course. They are meeting their Minimum Quality target. The issue is not quality – it is money.

There was a pause.  Leslie knew from experience that when Bob paused there was a surprise coming.

?Can you email me your chart?

A cold-shiver went down Leslie’s back. What was the problem here? Bob had never asked to see the data before.

Sure. I will send it now.  The recent fifty is on the right, the data on the left is from after the quality inspectors went in and before the the Minimum Quality target was imposed. This is the chart that Governance has been using as evidence to justify their existence because they are claiming the credit for improving the quality.

?OK – thanks. I have got it – let me see.  Oh dear.

Leslie was shocked. She had never heard Bob use language like ‘Oh dear’.

There was another pause.

?Leslie, what is the context for this data? What does the X-axis represent?

Leslie looked at the chart again – more closely this time. Then she saw what Bob was getting at. There were fifty points in the first group, and about the same number in the second group. That was not the interesting part. In the first group the X-axis went up to 50 in regular steps of five; in the second group it went from 50 to just over 149 and was no longer regularly spaced. Eventually she replied.

Bob, that is a really good question. My guess it is that this is the quality of the completed work.

?It is unwise to guess. It is better to go and see reality.

You are right. I knew that. It is drummed into us during the Foundation training! I will go and ask. Can I call you back?

?Of course. I will email you my direct number.


[reveal heading=”Click here to read the rest of the story“]


<Ring Ring><Ring Ring>

?Hello, Bob here.

Bob – it is Leslie. I am  so excited! I have discovered something amazing.

?Hello Leslie. That is good to hear. Can you tell me what you have discovered?

I have discovered that better quality does not always cost more.

?That is a good discovery. Can you prove it with data?

Yes I can!  I am emailing you the chart now.

?OK – I am looking at your chart. Can you explain to me what you have discovered?

Yes. When I went to see for myself I saw that when a job failed the Minimum Quality check at the end then the whole job had to be re-done because there was no time to investigate and correct the causes of the failure.  The people doing the work said that they were helpless victims of errors that were made upstream of them – and they could not predict from one job to the next what the error would be. They said it felt like quality was a lottery and that they were just firefighting all the time. They knew that just repeating the work was not solving the problem but they had no other choice because they were under enormous pressure to deliver on-time as well. The only solution they could see is was to get more resources but their requests were being refused by Finance on the grounds that there is no more money. They felt completely trapped.

?OK. Can you describe what you did?

Yes. I saw immediately that there were so many sources of errors that it would be impossible for me to tackle them all. So I used the tool that I had learned in the Foundation training: the Niggle-o-Gram. That focussed us and led to a surprisingly simple, quick, zero-cost process design change. We deliberately did not remove the Inspection-and-Correction policy because we needed to know what the impact of the change would be. Oh, and we did one other thing that challenged the current methods. We plotted both the successes and the failures on the BaseLine chart so we could see both the the quality and the work done on one chart.  And we updated the chart every day and posted it chart on the notice board so everyone in the department could see the effect of the change that they had designed. It worked like magic! They have already slashed their agency staff costs, the whole department feels calmer and they are still delivering on-time. And best of all they now feel that they have the energy and time to start looking at the next niggle. Thank you so much! Now I see how the tools and techniques I learned in FISH school are so powerful and now I understand better the reason we learned them first.

?Well done Leslie. You have taken an important step to becoming a fully fledged Improvement Science Practitioner. There are many more but you have learned some critical lessons in this challenge.


This scenario is fictional but realistic.

And it has been designed so that it can be replicated easily using a simple game that requires only pencil, paper and some dice.

If you do not have some dice handy then you can use this little program that simulates rolling six dice.

The Six Digital Dice program (for PC only).

Instructions
1. Prepare a piece of A4 squared paper with the Y-axis marked from zero to 40 and the X-axis from 1 to 80.
2. Roll six dice and record the score on each (or one die six times) – then calculate the total.
3. Plot the total on your graph. Left-to-right in time order. Link the dots with lines.
4. After 25 dots look at the chart. It should resemble the leftmost data in the charts above.
5. Now draw a horizontal line at 21. This is the Minimum Quality Target.
6. Keep rolling the dice – six per cycle, adding the totals to the right of your previous data.

But this time if the total is less than 21 then repeat the cycle of six dice rolls until the score is 21 or more. Record on your chart the output of all the cycles – not just the acceptable ones.

7. Keep going until you have 25 acceptable outcomes. As long as it takes.

Now count how many cycles you needed to complete in order to get 25 acceptable outcomes.  You should find that it is about twice as many as before you “imposed” the Inspect-and-Correct QI policy.

This illustrates the problem of an Inspection-and-Correction design for quality improvement.  It does improve the quality of the output – but at a higher cost.  We are treating the symptoms and ignoring the disease.

The internal design of the process is unchanged – and it is still generating mistakes.

How much quality improvement you get and how much it costs you is determined by the design of the underlying process – which has not changed. There is a Law of Diminishing returns here – and a risk.

The risk is that if quality improves as the result of applying a quality target then it encourages the Governance thumbscrews to be tightened further and forces the people further into cross-fire between Governance and Finance.

The other negative consequence of the Inspection-and-Correction approach is that it increases both the average and the variation in lead time which also fuels the calls for more targets, more sticks, calls for  more resources and pushes costs up even further.

The lesson from this simple reality check seems clear.

The better strategy for improving quality is to design the root causes of errors out of the processes  because then we will get improved quality and improved delivery and improved productivity and we will discover that we have improved safety as well.

The Six Dice Game is a simpler version of the famous Red Bead Game that W Edwards Deming used to explain why the arbitrary-target-driven-stick-and-carrot style of management creates more problems than it solves.

The illusion of short-term gain but the reality of long-term pain.

And if you would like to see and hear Deming talking about the science of improvement there is a video of him speaking in 1984. He is at the bottom of the page.  Click here.

[/reveal]

The F Word

There is an F-word that organisations do not like to use – except maybe in conspiratorial corridor conversations.

What word might that be? What are good candidates for it?

Finance perhaps?

Certainly a word that many people do not want to utter – especially when the financial picture is not looking very rosy. And when the word finance is mentioned in meetings there is usually a groan of anguish. So yes, finance is a good candidate – but it is not the F-word.

Failure maybe?

Yes – definitely a word that is rarely uttered openly. The concept of failure is just not acceptable. Organisations must succeed, sustain and grow. Talk of failure is for losers not for winners. To talk about failure is tempting fate. So yes, another excellent candidate – but it is not the F-word.

OK – what about Fear?

That is definitely something no one likes to admit to.  Especially leaders. They are expected to be fearless. Fear is a sign of weakness! Once you start letting the fear take over then panic starts to set in – then rash decisions follow then you are really on the slippery slope. Your organisation fragments into warring factions and your fate is sealed. That must be the F-word!

Nope.  It is another very worthy candidate but it is not the F-word.


[reveal heading=”Click here to reveal the F-word“]


The dreaded F-word is Feedback.

We do not like feedback.  We do not like asking for it. We do not like giving it. We do not like talking about it. Our systems seem to be specifically designed to exclude it. Potentially useful feedback information is kept secret, confidential, for-our-eyes only.  And if it is shared it is emasculated and anonymized.

And the brave souls who are prepared to grasp the nettle – the 360 Feedback Zealots – are forced to cloak feedback with secrecy and confidentiality. We are expected to ask  for feedback, to take it on the chin, but not to know who or where it came from. So to ease the pain of anonymous feedback we are allowed to choose our accusers. So we choose those who we think will not point out our blindspot. Which renders the whole exercise worthless.

And when we actually want feedback we extract it mercilessly – like extracting blood from a reluctant stone. And if you do not believe me then consider this question: Have you ever been to a training course where your ‘certificate of attendance’ was with-held until you had completed the feedback form? The trainers do this for good reason. We just hate giving feedback. Any feedback. Positive or negative. So if they do not extract it from us before we leave they do not get any.

Unfortunately by extracting feedback from us under coercion is like acquiring a confession under torture – it distorts the message and renders it worthless.

What is the problem here?  What are we scared of?


We all know the answer to the question.  We just do not want to point at the elephant in the room.

We are all terrified of discovering that we have the organisational equivalent of body-odour. Something deeply unpleasant about our behaviour that we are blissfully unaware of but that everyone else can see as plain as day. Our behaviour blindspot. The thing we would cringe with embarrassment about if we knew. We are social animals – not solitary ones. We need on feedback yet we fear it too.

We lack the courage and humility to face our fear so we resort to denial. We avoid feedback like the plague. Feedback becomes the F-word.

But where did we learn this feedback phobia?

Maybe we remember the playground taunts from the Bullies and their Sychophants? From the poisonous Queen-Bees and their Wannabees?  Maybe we tried to protect ourselves with incantations that our well-meaning parents taught us. Spells like “Sticks and stones may break my bones but names will never hurt me“.  But being called names does hurt. Deeply. And it hurts because we are terrified that there might be some truth in the taunt.

Maybe we learned to turn a blind-eye and a deaf-ear; to cross the street at the first sign of trouble; to turn the other cheek? Maybe we just learned to adopt the Victim role? Maybe we were taught to fight back? To win at any cost? Maybe we were not taught how to defuse the school yard psycho-games right at the start?  Maybe our parents and teachers did not know how to teach us? Maybe they did not know themselves?  Maybe the ‘innocent’ schoolyard games are actually much more sinister?  Maybe we carry them with us as habitual behaviours into adult life and into our organisations? And maybe the bullies and Queen-Bees learned something too? Maybe they learned that they could get away with it? Maybe they got to like the Persecutor role and its seductive musk of power? If so then then maybe the very last thing the Bullies and Queen-Bees will want to do is to encourage open, honest feedback – especially about their behaviour. Maybe that is the root cause of the conspiracy of silence? Maybe?

But what is the big deal here?

The ‘big deal’ is that this cultural conspiracy of silence is toxic.  It is toxic to trust. It is toxic to teams. It is toxic to morale.  It is toxic to motivation. It is toxic to innovation. It is toxic to improvement. It is so toxic that it kills organisations – from the inside. Slowly.

Ouch! That feels uncomfortably realistic. So what is the problem again – exactly?

The problem is a deliberate error of omission – the active avoidance of feedback.

So ….. if it were that – how would we prove that is the root cause? Eh?

By correcting the error of omission and then observing what happens.


And this is where it gets dangerous for leaders. They are skating on politically thin ice and they know it.

Subjective feedback is very emotive.  If we ask ten people for their feedback on us we will get ten different replies – because no two people perceive the world (and therefore us) the same way.  So which is ‘right’? Which opinions do we take heed of and which ones do we discount? It is a psycho-socio-political minefield. So no wonder we avoid stepping onto the cultural barbed-wire!

There is an alternative.  Stick to reality and avoid rhetoric. Stick to facts and avoid feelings. Feed back the facts of how the organisational system is behaving to everyone in the organisation.

And the easiest way to do that is with three time-series charts that are updated and shared at regular and frequent intervals.

First – the count of safety and quality failure near-misses for each interval – for at least 50 intervals.

Second – the delivery time of our product or service for each customer over the same time period.

Third – the revenue generated and the cost incurred for each interval for the same 50 intervals.

No ratios, no targets, no balanced scorecard.

Just the three charts that paint the big picture of reality. And it might not be a very pretty picture.

But why at least 50 intervals?

So we can see the long term and short term variation over time. We need both … because …

Our Safety Chart shows that near misses keep happening despite all the burden of inspection and correction.

Our Delivery Chart shows that our performance is distorted by targets and the Horned Gaussian stalks us.

Our Viability Chart shows that our costs are increasing as we pay dearly for past mistakes and our revenue is decreasing as our customers protect their purses and their persons by staying away.

That is the not-so-good news.

The good news is that as soon as we have a multi-dimensional-frequent-feedback loop installed we will start to see improvement. It happens like magic. And the feedback accelerates the improvement.

And the news gets better.

To make best use of this frequent feedback we just need to include in our Constant Purpose – to improve safety, delivery and viability. And then the final step is to link the role of every person in the organisation to that single win-win-win goal. So that everyone can see how they contribute and how their job is worthwhile.

Shared Goals, Clear Roles and Frequent Feedback.

And if you resonate with this message then you will resonate with “The Three Signs of  Miserable Job” by Patrick Lencioni.

And if you want to improve your feedback-ability then a really simple and effective feedback tool is The 4N Chart

And please share your feedback.

[/reveal]

Systems within Systems

Each of us is a small part of a big system.  Each of us is a big system made of smaller parts. The concept of a system is the same at all scales – it is called scale invariant

When we put a system under a microscope we see parts that are also systems. And when we zoom in on those we see their parts are also systems. And if we look outwards with a telescope we see that we are part of a bigger system which in turn is part of an even bigger system.

This concept of systems-within-systems has a down-side and an up-side.

The down-side is that it quickly becomes impossible to create a mental picture of the whole system-of-systems. Our caveman brains are just not up to the job. So we just focus our impressive-but-limited cognitive capacity on the bit that affects us most. The immediate day-to-day people-and-process here-and-now stuff. And we ignore the ‘rest’. We deliberately become ignorant – and for good reason. We do not ask about the ‘rest’ because we do not want to know because we cannot comprehend the complexity. We create cognitive comfort zones and personal silos.

And we stay inside our comfort zones and we hide inside our silos.


Unfortunately – ignoring the ‘rest’ does not make it go away.

We are part of a system – we are affected by it and it is affected by us. That is how systems work.


The up-side is that all systems behave in much the same way – irrespective of the level.  This is very handy because if we can master a method for understanding and improving a system at one level – then we can use the same method at any level.  The only change is the degree of detail. We can chunk up and down and still use the same method.  

The improvement scientist needs to be a master of one method and to be aware of three levels: the system level, the stream level and the step level.

The system provides the context for the streams. The steps provide the content of the streams.

  1. Direction operates at the system level.
  2. Delivery operates at the stream level.
  3. Doing operates at the step level.

So an effective and efficient improvement science method must work at all three levels – and one method that has been demonstrated to do that is called 6M Design®.


6M Design® is not the only improvement science method, and it is not intended to be the best. Being the best is not the purpose because it is not necessary. Having better than what we had before is the purpose because it is sufficient. That is improvement.


6M Design® works at all three levels.  It is sufficient for system-wide and system-deep improvement. So that is what I use.


The first M stands for Map.

Maps are designed to be visual and two-dimensional because that is how our Mark-I eyeballs abd visual sensory systems work. Our caveman brains are good at using pictures and in extraction meaning from the detail. It is a survival skill. 

All real systems have a lot more than two dimensions. Safety, Quality, Flow and Cost are four dimensions to start with, and there are many more. So we need lots of maps. Each one looking at just two of the dimensions.  It is our set of maps that provide us with a multi-dimensional picture of the system we want to improve.

One dimension features more often in the maps than any other – and that dimension is time.

The Western cultural convention is to put time on the horizonal axis with past in the left and future on the right. Left-to-right means looking forward in time.  Right-to-left means looking backwards in time. 


We have already seen one of the time-dependent maps – The 4N Chart®.

It is a Emotion-Time map. How do we feel now and why? What do we want to feel in the futrure and why? It is a status-at-a-glance map. A static map. A snapshot.

The emotional roller coaster of change – the Nerve Curve – is an Emotion-Time map too. It is a dynamic map – an expected trajectory map.  The emotional ups and downs that we expect to encounter when we engage in significant change.

Change usually involves several threads at the same time – each with its own Nerve Curve. 

The 4N Charts® are snapshots of all the parallel threads of change – they evolve over time – they are our day-to-day status-at-a-glance maps – and they guide us to which Nerve Curve to pay attention to next and what to do. 

The map that links the three – the purposes, the pathways and the parts – is the map that underpins 6M Design®. A map that most people are not familiar with because it represents a counter-intuitive way of thinking.

And it is that critical-to-success map which differentiates innovative design from incremental improvement.

And using that map can be learned quite quickly – if you have a guide – an Improvement Scientist.

The First Step Looks The Steepest

Getting started on improvement is not easy.

It feels like we have to push a lot to get anywhere and when we stop pushing everything just goes back to where it was before and all our effort was for nothing.

And it is easy to become despondent.  It is easy to start to believe that improvement is impossible. It is easy to give up. It is not easy to keep going.


One common reason for early failure is that we often start by  trying to improve something that we have little control over. Which is natural because many of the things that niggle us are not of our making.

But not all Niggles are like that; there are also many Niggles over which we have almost complete control.

It is these close-to-home Niggles that we need to start with – and that is surprisingly difficult too – because it requires a bit of time-investment.


The commonest reason for not investing time in improvement is: “I am too busy.”

Q: Too busy doing what – specifically?

This simple question is  a  good place to start because just setting aside a few minutes each day to reflect on where we have been spending our time is a worthwhile task.

And the output of our self-reflection is usually surprising.

We waste lifetime every day doing worthless work.

Then we complain that we are too busy to do the worthwhile stuff.

Q: So what are we scared of? Facing up to the uncomfortable reality of knowing how much lifetime we have wasted already?

We cannot change the past. We can only influence the future. So we need to learn from the past to make wiser choices.


Lifetime is odd stuff.  It both is and is not like money.

We can waste lifetime and we can waste money. In that  respect they are the same. Money we do not use today we can save for tomorrow, but lifetime not used today is gone forever.

We know this, so we have learned to use up every last drop of lifetime – we have learned to keep ourselves busy.

And if we are always busy then any improvement will involve a trade-off: dis-investing and re-investing our lifetime. This implies the return on our lifetime re-investment must come quickly and predictably – or we give up.


One tried-and-tested strategy is to start small and then to re-invest our time dividend in the next cycle of improvement.  An if we make wise re-investment choices, the benefit will grow exponentially.

Successful entrepreneurs do not make it big overnight.

If we examine their life stories we will find a repeating cycle of bigger and bigger business improvement cycles.

The first thing successful entrepreneurs learn is how to make any investment lead to a return – consistently. It is not luck.  They practice with small stuff until they can do it reliably.

Successful entrepreneurs are disciplined and they only take calculated risks.

Unsuccessful entrepreneurs are more numerous and they have a different approach.

They are the get-rich-quick brigade. The undisciplined gamblers. And the Laws of Probability ensure that they all will fail eventually.

Sustained success is not by chance, it is by design.

The same is true for improvement.  The skill to learn is how to spot an opportunity to release some valuable time resource by nailing a time-sapping-niggle; and then to reinvest that time in the next most promising cycle of improvement  – consistently and reliably.  It requires discipline and learning to use some novel tools and techniques.

This is where Improvement Science helps – because the tools and techniques apply to any improvement. Safety. Flow. Quality. Productivity. Stability. Reliability.

In a nutshell … trustworthy.


The first step looks the steepest because the effort required feels high and the benefit gained looks small.  But it is climbing the first step that separates the successful from the unsuccessful. And successful people are self-disciplined people.

After a few invest-release-reinvest cycles the amount of time released exceeds the amount needed to reinvest. It is then we have time to spare – and we can do what we choose with that.

Ask any successful athlete or entrepreneur – they keep doing it long after they need to – just for the “rush” it gives them.


The tool I use, because it is quick, easy and effective, is called The 4N Chart®.  And it has a helpful assistant called a Niggle-o-Gram®.   Together they work like a focusing lens – they show where the most fertile opportunity for improvement is – the best return on an investment of time and effort.

And when we have proved to yourself that the first step of improvement is not as steep as you believed – then we have released some time to re-invest in the next cycle of improvement – and in sharing what we have discovered.

That is where the big return comes from.

10/11/2012: Feedback from people who have used The 4N Chart and Niggle-o-Gram for personal development is overwhelmingly positive.

The Essential Role of the Credible Skeptic

All improvement implies change – some may be incremental elimination of current Niggles; other may be breakthrough achievement of future NiceIfs.

Change is an uphill struggle and the inevitable friction generates heat and sparks which dissipate some of the energy.

People throw spanners into the wheel which may eventually grind to a halt. Experts talk about “oiling the wheels of change” and generating momentum. The mechanical metaphors are numerous and have a common thread – that change requires pushing.

The unstated assumption is that resistance is “bad” and any means to overcome or bypass resistance is therefore justified – but this assumption is one-sided and discounts the possibility that there is a “good” side to resistance.

Suppose a design is proposed that would be effective (it would do the right thing) then resistance-to-change would be counter-improvement. Suppose the proposed design would be ineffective (it would not do the right thing and might even lead to the wrong thing) then resistance-to-change would be protective. The difference is the effectiveness of the design – not the presence of resistance-to-change.


Effectiveness has two components – effective in theory and effective in practice.  Demonstrating effectiveness in theory is the purpose of pure research; delivering effectiveness in practice is the purpose of applied research. Both are embraced in Improvement Science.

Who is best placed to decide what will work in theory? An academic.

Who is best placed to decide what can work in practice? A pragmatist.

So we need both doing the parts that they do best.  And we need them doing it at the same time … not in sequence … not theory and then practice.


It is a common assumption that novel designs are created sequentially – working from big conceptual chunks in stages of increasing detail to the final blueprints.

Reality is a bit messier than this!

An experienced design team will flip between broad-brush and fine-detail and they know the importance of including both theorists and pragmatists in the team. This is where the practical challenge comes because most people have a preference for one or the other modes of thinking.

Coordinating the effective-design-conversation requires awareness by everyone of the value of both.  This is not discussion, instruction, manipulation, or facilitation – it is education. The role of the design team leader is to create the context to allow the learning to flow and the synergy to emerge.


The symptoms and signs associated with inexperienced design teams are:

  • Design done behind closed doors by strategists with the assistance of theoretical advisors called management consultants.
  • Design decisions are delivered as a “fait accompli” to those expected to “operationalise” them.
  • Language such as “herding cats” is used to refer to the influential skeptics who represent the “front line barrier to change”.

These symptoms are harbingers of failure – poor designs that flounder on the Rocks of Don’t Do and good designs that get stuck on the Sands of Won’t Do.


The experienced design team knows these hidden dangers and has learned how to steer around them by demonstrating respect for the theory and for the practice and staying in the Channel to Success. There need to be respected Optics (visionary optimists) and credible Skeptics (respectful pessimists) at both the academic and the pragmatic poles to generate creative resonance. Synergy. An effective design team includes the role of Credible Skeptic.


And there are no chairs at the effective design table for the Politics (egocentric activists) and the Cynics (disrespectful pessimists). Their beliefs, attitudes and behaviours generate dissonance and turbulence which dissipates and wastes the effort, time and money of everyone else.


And we must always remember that effective design comes before efficient design.  Doing the wrong thing efficiently makes it wronger!  First do the right thing – then do it better. That is a design where everyone benefits.


Disappointers, Delighters and Satisfiers.

There are two broad approaches to improvement. One is to start with what we have got now and tinker with it in the hope it will get better.  When this is done well it is effective albeit slow. When it is done badly it amounts to dangerous meddling. The more interconnected the system we are trying to improve the more likely our well intentioned tinkering will create a bigger problem in the future than we have now.

Another approach is to start with what-we-want-to-have in the future and then design-to-deliver it. Our starting point is not an aspirational dream vision, also known as an hallucination, it is a clear performance specification with four dimensions: safety, delivery, quality and affordability. This is called a SFQP specification.

The first one to focus on is safety … and what we usually find is that risk of harm is usually a knock-on effect of delivery and quality design problems.

The easiest one is delivery – because it is the application of process physics. The next easiest one is affordability because that is the application of value system accounting.

The tricky one is quality because that implies subjectivity, people, psychology, behaviour and politics. When we add quality to our design challenge we rack up the wickedness score!

So, how do we create a clear and realistic output quality performance specification?

If we draw up a chart with Subjective Quality on the Y-axis and Objective Performance on the X-axis, we can plot all the characteristics of our current and future design on this chart.  And when we do that we discover some surprising things.

First – some factors go unnoticed until the performance drops. Said another way we do not notice when it is working – we only only notice when it is not.  These factors are called Disappointers.  We take for granted that things work 99% of the time – the sun comes up every morning; there is 21% of oxygen in the atmosphere; the air temperature is OK; the electricity is on; the milk, paper and post gets delivered; the car starts and so on. We take it all for granted and we complain when it unexpectedly does not.

So if we ask our customers what they want from an improved service they do not spontaneously volunteer what is currently working well and that they take for granted – because it is out of their awareness.  This is what Henry Ford implied when he said “If I asked the customer what they wanted I would have got a faster horse“. It is also the reason why a Three Wins design starts with The 4N Chart® – and specifically the Nuggets corner. We need to make conscious what works well because when we plan improvement we do not want to unintentionally discard the baby with the bath water!

Second – some factors go unnoticed until performance exceeds a minimum threshold. They are not expected so we do not mind if they are not provided – but if they are unexpectedly provided then we are surprised and Delighted.  The first time. Once we know what is possible we come to expect it again, and eventually every time.


A common design error is to try to use a Delighter to compensate for a Disappointer.

Suppose we walked into our hotel room and found a complimentary bottle of wine that we were not expecting and then we discovered that there was no toilet paper and the shower was cold. The bottle of wine would not compensate for our disappointment and it might even irritate us because we conclude that the management does not care about our basic needs. Our trust is eroded and our feedback reflects that.


Effective design for trusted quality starts by eliminating the possibility of disappointment. We design it so the expected essentials are “right first time and every time“.  Our measure of success is not praise – it is absence of complaints. A deafening silence. It is what does not happen that is important. Good expected essential design is invisible – because it never intrudes on our awareness.  And for this reason it is surprisingly difficult to do. It requires pro-action not re-action.


The third type of factor is the Satisfier – and these are the ones that our customers will volunteer because they are aware of them. Lower performance giving lower perceived quality scores and higher performance giving higher.  These are the “you get what you pay for” factors. A better designed car is expected to be more comfortable, quieter, easier to drive, safer, more reliable, more effort-saving gadgets and so on. Price is a satisfier. Cost is not. Cost is an output of the design process. So the better the design the greater the gap can be between cost and price.


This method is called Kano Analysis and an understanding of it is essential for effective quality improvement. And like so much of Improvement Science it appears counter-intuitive at first,  common-sense when explained, and blindingly obvious when experienced.


Are-Eee-Ess-Pee-Eee-See-Tee

The phrase that sums up the attitude and behaviour of an effective Improvement Scientist is respectful challenge. The challenge part is the easier to appreciate because to improve we have to change something which implies that we have to challenge the current reality in some way. The respect part is a bit tricker.

One dictionary definition is: Respect gives a positive feeling of esteem for a person or entity. The opposite of respect is contempt.

This definition gets us started because it points to what happens inside our heads – feeling respected is a good feeling; feeling disrespected is a bad one. Improvement only happens and is sustained when it is strongly associated with good feelings. That is how our the caveman wetware between our ears works. So respect is a fundamental component of improvement.

The animation illustrates several aspects of respect. One is the handshake. It is one of those rituals that on the surface seems illogical and superfluous but it has deep social and psychological importance. I once read that it comes from the time when men carried swords and the hand shake signifies “I am not holding my sword“. The handshake is an expression of extending mutual trust using a clear visual signal – it is a mark of mutual respect.  The other aspect is signified by the neckties. Again an illogical and superfluous garment except that it too broadcasts a signal – the message “I have prepared for this meeting by taking care to be clean and tidy because it is important“. This too has great social significance – in the past the biggest killer was not swords but something much smaller and more dangerous. Germs. People knew that disease and dirt were associated and that meant a dirty person was a dangerous one. Cleaning up was much more difficult in the days before piped water, baths, showers, washing machines and soap – so to put effort into getting clean and tidy was a mark of great respect. It still is.

So if we want to challenge and influence improvement then we must establish respect first. And that means we have to behave in a respectful manner. And that means we have to think in a respectful way. And that means we have to consciously not behave in an unintended disrespectful manner. Our learned rituals, such as a smile, a handshake and a hello, help us to do that automatically. Unfortunately it is more often what we do not do that is the most disrespectful behaviour.  And we all fall into these traps.

Unintended outcomes that result from what we do not do are called Errors of Omission (EOO) – and they are tricky to spot because there is no tangible evidence of them. The evidence of the error is intangible – a bad feeling.

For example, not acknowledging someone is an EOO. This is very obvious in social situations and it presses one of our Three Fears buttons – the Fear of Rejection.  It is very easy to broadcast to whole roomful of people that you do not respect someone just by obviously ignoring them.  And the higher up the social pecking order you are the greater the impact: for two reasons. First because followers unconsciously copy the behaviour of the leader; and second because it broadcasts the message that disrespectful behaviour is OK.

Contempt is toxic to a collaborative culture and blocks significant, sustained improvement.

In the modern world we have so many more ways that we can communicate and therefore many more opportunities for communication EOOs. The most fertile ground for EOOs is probably email.  It is so much easier to be disrespectful to a lot of people in a short period of time by email than just about any other medium. Just failing to acknowledge an email question or request is enough.  Failing to put in the email-equivalent of a handshake of Dear <yourname> …. message …. Regards <myname>  is similar.

Omitting to communicate last minute changes in a plan is an effective way to upset people too!

And perhaps the most effective is firing a grapeshot email in the hope that one will hit the intended target. These two examples highlight a different form of disrespect: discounting someone else’s time – or more specifically their lifetime.

When we waste our time we waste a bit of our life – and we deny ourselves the opportunity to invest that finite and precious lifetime doing something more enjoyable. Time is not money. Money can be saved for later – time cannot. When we waste an hour of our lives we waste it forever.  If we do that to ourselves we are showing lack of self-respect and that is our choice – when we do it to others we create a pervasive and toxic cultural swamp.

One of the first steps in the process of improvement is to engage and listen and one tool for this is The 4N Chart® – which is an emotional mapping technique. Niggles are the Negative Emotions in the Present together with their Be-Causes. The three commonest niggles that people consistently report are car parking, emails and meetings.  All three involve lifetime wasting activities. The cumulative effect is frustration and erosion of trust which drives further disrespectful behaviour. The end result is a viscous self-sustaining toxic cycle of habitual disrespect.

An effective tactic here is first to hold up the mirror and reflect back what is happening … that is respectful challenge.

The next step is to improving the processes that are linked to car parking, emails and meetings so that they are more effective and more efficient. And that means actively designing them to be more productive – by actively designing out the lifetime wasting parts.

Pruning the Niggle Tree

Sometimes our daily existence feels like a perpetual struggle between two opposing forces: the positive force of innovation, learning, progress and success; and the opposing force of cynicism, complacency, stagnation and failure.  Often the balance-of-opposing-forces is so close that even small differences of opinion can derail us – especially if they are persistent. And we want to stay on course to improvement.

Niggles are the irritating things that happen every day. Day after day. Niggles are persistent. So when we are in our “ying-yang” equilibrium and “balanced on the edge” then just one extra niggle can push us off our emotional tight-rope. And we know it. The final straw!

So to keep ourselves on track to success we need to “nail” niggles.  But which ones? There seem to be so many! Where do we start?

If we recorded just one day and from that we listed all the positive things that happened on green PostIt® notes and all the negatives things on red ones – then we would be left with a random-looking pile of red and green notes. Good days would have more green, and bad days would have more red – and all days would have both. And that is just the way it is. Yes? But are they actually random? Is there a deeper connection?

Experience teaches us that when we Investigate-a-Niggle we find it is connected to other niggles. The “cannot find a parking place” niggle is because of the “car park is full” niggle which also causes the “someone arrived late for my important meeting” niggle. The red leaf is attached to a red twig which in turn sprouts other red leaves. The red leaves connect to other red leaves; not to green ones.

If we tug on a green leaf – a Nugget – we find that it too is connected to other nuggets. The “congratulations on a job well done” nugget is connected to the the “feedback is important” nugget from which sprouts the “opportunities for learning” nugget. Our green leaf is attached, indirectly, to many other green leaves; not to red ones.

It seems that our red leaves (niggles) and our green leaves (nuggets) are connected – but not directly to each other. It is as if we have two separate but tightly intertwined plants competing with each other for space and light. So if we want a tree that is more green than red and if we want to progress steadily in the direction of sustained improvement – then we need to prune the niggle tree (red leaves) and leave the nugget tree (green leaves) unscathed.

The problem is that if we just cut off one or two red leaves new ones sprout quickly from the red twigs to replace them. We quickly learn that this apprach is futile. We suspect that if we were able to cut all the red leaves off at once then the niggle tree might shrivel and die – but that looks impossible. We need to be creative and we need to search deeper. With the  knowledge that the red-leaves are part of one tree and we can remove multiple red leaves in one snip by working our way back from the leaves, up the red twigs and to the red branches. If we prune far enough back then we can expect a large number of interconnected red leaves to wither and fall off – leaving the healthy green leaves more space and more light to grow on that part of the tree.

Improvement Science is about pruning the Niggle tree to make space for the Nugget tree to grow. It is about creating an environment for the Green shoots of innovation to sprout.  Most resistance comes from those who feed on the Red leaves – the Cynics – and if we remove enough red branches then they will go hungry. And now the Cynics have a choice: learn to taste and appreciate the Green leaves or “find another tree”.

We want a Greener tree- with fewer poisonous Red leaves on it.

Resistance to Change

Many people who are passionate about improvement become frustrated when they encounter resistance-to-change.

It does not matter what sort of improvement is desired – safety, delivery, quality, costs, revenue, productivity or all of them.

The natural and intuitive reaction to meeting resistance is to push harder – and our experience of the physical world has taught us that if we apply enough pressure at the right place then resistance will be overcome and we will move forward.

Unfortunately we sometimes discover that we are pushing against an immovable object and even our maximum effort is futile – so we give up and label it as “impossible”.

Much of Improvement Science appears counter-intuitive at first sight and the challenge of resistance is no different.  The counter-intuitive response to feeling resistance is to pull back, and that is exactly what works better. But why does it work better? Isn’t that just giving up and giving in? How can that be better?

To explain the rationale it is necessary to examine the nature of resistance more closely.

Resistance to change is an emotional reaction to an unconsciously perceived threat that is translated into a conscious decision, action and justification: the response. The range of verbal responses is large, as illustrated in the caption, and the range of non-verbal responses is just as large.  Attempting to deflect or defuse all of them is impractical, ineffective and leads to a feeling of frustration and futility.

This negative emotional reaction we call resistance is non-specific because that is how our emotions work – and it is triggered as much by the way the change is presented as by what the change is.

Many change “experts” recommend  the better method of “driving” change is selling-versus-telling and recommend learning psycho-manipulation techniques to achieve it – close-the-deal sales training for example. Unfortunately this strategy can create a psychological “arms race” which can escalate just as quickly and lead to the same outcome: an  emotional battle and psychological casualties. This outcome is often given the generic label of “stress”.

An alternative approach is to regard resistance behaviour as multi-factorial and one model separates the non-specific resistance response into separate categories: Why DoDon’t Do – Can’t Do – Won’t Do.

The Why Do response is valuable feedback because is says “we do not understand the purpose of the proposed change” and it is not unusual for proposals to be purposeless. This is sometimes called “meddling”.  This is fear of the unknown.

The Don’t Do  is valuable feedback that is saying “there is a risk with this proposed change – an unintended negative consequence that may be greater than the intended positive outcome“.  Often it is very hard to explain this NoNo reaction because it is the output of an unconscious thought process that operates out of awareness. It just doesn’t feel good. And some people are better at spotting the risks – they prefer to wear the Black Hat – they are called skeptics.  This is fear of failure.

The Can’t Do is also valuable feedback that is saying “we get the purpose and we can see the problem and the benefit of a change – we just cannot see the path that links the two because it is blocked by something.” This reaction is often triggered by an unconscious recognition that some form of collaborative working will be required but the cultural context is low on respect and trust. It can also just be a manifestation of a knowledge, skill or experience gap – the “I don’t know how to do” gap. Some people habitually adopt the Victim role – most are genuine and do not know how.

The Won’t Do response is also valuable feedback that is saying “we can see the purpose, the problem, the benefit, and the path but we won’t do it because we don’t trust you“. This reaction is common in a low-trust culture where manipulation, bullying and game playing is the observed and expected behaviour. The role being adopted here is the Persecutor role – and the psychological discount is caring for others. Persecutors lack empathy.

The common theme here is that all resistance-to-change responses represent valuable feedback and explains why the better reaction to resistance is to stop talking and start listening because to make progress will require using the feedback to diagnose what components or resistance are present. This is necessary because each category requires a different approach.

For example Why Do requires making the both problem and the purpose explicit; Don’t Do requires exploring the fear and bringing to awareness what is fuelling it; Can’t Do requires searching for the skill gaps and filling them; and Won’t Do requires identifying the trust-eroding beliefs, attitudes and behaviours and making it safe to talk about them.

Resistance-to-change is generalised as a threat when in reality it represents an opportunity to learn and to improve – which is what Improvement Science is all about.

The Power of the Positive Deviants

It is neither reasonable nor sensible to expect anyone to be a font of all knowledge.

And gurus with their group-think are useful but potentially dangerous when they suppress competitive paradigms.

So where does an Improvement Scientist seek reliable and trustworthy inspiration?

Guessing is a poor guide; gut-instinct can seriously mislead; and mind-altering substances are illegal, unreliable or both!

So who are the sources of tested ideas and where do we find them?

They are called Positive Deviants and they are everywhere.


But, the phrase positive deviant does not feel quite right does it? The word “deviant” has a strong negative emotional association. We are socially programmed from birth to treat deviations from the norm with distrust and for good reason. Social animals view conformity and similarity as security – it is our herd instinct. Anyone who looks or behaves too far from the norm is perceived as odd and therefore a potential threat and discounted or shunned.

So why consider deviants at all? Well, because anyone who behaves significantly differently from the majority is a potential source of new insight – so long as we know how to separate the positive deviants from the negative ones.

Negative deviants display behaviours that we could all benefit from by actively discouraging!  The NoNo or thou-shalt-not behaviours that are usually embodied in Law.  Killing, stealing, lying, speeding, dropping litter – that sort of thing. The anti-social trust-eroding conflict-generating behaviour that poisons the pond that we all swim in.

Positive deviants display behaviours that we could all benefit from actively encouraging! The NiceIf behaviours. But we are habitually focussed more on self-protection than self-development and we generalise from specifics. So we treat all deviants the same – we are wary of them. And by so doing we miss many valuable opportunities to learn and to improve.


How then do we identify the Positive Deviants?

The first step is to decide the dimension we want to improve and choose a suitable metric to measure it.

The second step is to measure the metric for everyone and do it over time – not just at a point in time. Single point-in-time measurements (snapshots) are almost useless – we can be tricked by the noise in the system into poor decisions.

The third step is to plot our measure-for-improvement as a time-series chart and look at it.  Are there points at the positive end of the scale that deviate significantly from the average? If so – where and who do they come from? Is there a pattern? Is there anything we might use as a predictor of positive deviance?

Now we separate the data into groups guided by our proposed predictors and compare the groups. Do the Positive Deviants now stick out like a sore thumb? Did our predictors separate the wheat from the chaff?

If so we next go and investigate.  We need to compare and contrast the Positive Deviants with the Norms. We need to compare and contrast both their context and their content. We need to know what is similar and what is different. There is something that is causing the sustained deviation and we need to search until we find it – and then we need know how and why it is happening.

We need to separate associations from causations … we need to understand the chains of events that lead to the better outcomes.

Only then will a new Door to Opportunity magically appear in our Black Wall of Ignorance – a door that leads to a proven path of improvement. A path that has been trodden before by a Positive Deviant – or by a whole tribe of them.

And only we ourselves can choose to open the door and explore the path – we cannot be pushed through by someone else.

When our system is designed to identify and celebrate the Positive Deviants then the negative deviants will be identified too! And that helps too because they will light the path to more NoNos that we can all learn to avoid.

For more about positive deviance from Wikipedia click here

For a case study on positive deviance click here

NB: The terms NiceIfs  and NoNos are two of the N’s on The 4N Chart® – the other two are Nuggets and Niggles.

Never Events and Nailing Niggles

Some events should NEVER happen – such as removing the wrong kidney; or injecting an anti-cancer drug designed for a vein into the spine; or sailing a cruise ship over a charted underwater reef; or driving a bus full of sleeping school children into a concrete wall.

But  these catastrophic irreversible and tragic Never Events do keep happening – rarely perhaps – but persistently. At the Never-Event investigation the Finger-of-Blame goes looking for the incompetent culprit while the innocent victims call for compensation.

And after the smoke has cleared and the pain of loss has dimmed another Never-Again-Event happens – and then another, and then another. Rarely perhaps – but not never.

Never Events are so awful and emotionally charged that we remember them and we come to believe that they are not rare and from that misperception we develop a constant nagging feeling of fear for the future. It is our fear that erodes our trust which leads to the paralysis that prevents us from acting.  In the globally tragic event of 9/11 several thousand innocents victims died while the world watched in horror.  More innocent victims than that die needlessly every day in high-tech hospitals from avoidable errors – but that statistic is never shared.

The metaphor that is often used is the Swiss Cheese – the sort on cartoons with lots of holes in it. The cheese represents a quality check – a barrier that catches and corrects mistakes before they cause irreversible damage. But the cheesy check-list is not perfect; it has holes in it.  Mistakes slip through.

So multiple layers of cheesy checks are added in the hope that the holes in the earlier slices will be covered by the cheese in the later ones – and our experience shows that this multi-check design does reduce the number of mistakes that get through. But not completely. And when, by rare chance, holes in each slice line up then the error penetrates all the way through and a Never Event becomes a Actual Catastrophe.  So, the typical recommendation from the after-the-never-event investigation is to add another layer of cheese to the stack – another check on the list on top of all the others.

But the cheese is not durable: it deteriorates over time with the incessant barrage of work and the pressure of increasing demand. The holes get bigger, the cheese gets thinner, and new holes appear. The inevitable outcome is the opening up of unpredictable, new paths through the cheese to a Never Event; more Never Events; more after-the-never-event investigation; and more slices of increasingly expensive and complex cheese added to the tottering, rotting heap.

A drawback of the Swiss Cheese metaphor is that it gives the impression that the slices are static and each cheesy check has a consistent position and persistent set of flaws in it. In reality this is not the case – the system behaves as if the slices and the holes are moving about: variation is jiggling , jostling and wobbling the whole cheesy edifice.

This wobble does not increase the risk of a Never Event  but it prevents the subsequent after-the-event investigation from discovering the specific conjunction of holes that caused it. The Finger of Blame cannot find a culprit and the cause is labelled a “system failure” or an unlucky individual is implicated and named-shamed-blamed and sacrificed to the Gods of Chance on the Alter of Hope! More often new slices of KneeJerk Cheese are added in the desperate hope of improvement – and creating an even greater burden of back-covering bureaucracy than before – and paradoxically increasing the number of holes!

Improvement Science offers a more rational, logical, effective and efficient approach to dissolving this messy, inefficient and ineffective safety design.

First it recognises that to prevent a Never Event then no errors should reach the last layer of cheese checking – the last opportunity to block the error trajectory. An error that penetrates that far is a Near Miss and these will happen more often than Never Events so they are the key to understanding and dissolving the problem.

Every Near Miss that is detected should be reported and investigated immediately – because that is the best time to identify the hole in the previous slice – before it wobbles out of sight. The goal of the investigation is understanding not accountability. Failure to report a near miss; failure to investigate it; failure to learn from it; failure to act on it; and failure to monitor the effect of the action are all errors of omission (EOOs) and they are the worst of management crimes.

The question to ask is “What error happened immediately before the Near Miss?”  This event is called a Not Again. Focussing attention on this Not Again and understanding what, where, when, who and how it happened is the path to preventing the Near Miss and the Never Event.  Why is not the question to ask – especially when trust is low and cynicism and fear are high – the question to ask is “how”.

The first action after Naming the Not Again is to design a counter-measure for it – to plug the hole – NOT to add another slice of Check-and Correct cheese! The second necessary action is to treat that Not Again as a Near-Miss and to monitor it so when it happens again the cause can be identified. These common, every day, repeating causes of Not Agains are called Niggles; the hundreds of minor irritations that we just accept as inevitable. This is where the real work happens – identifying the most common Niggle and focussing all attention on nailing it! Forever.  Niggle naming and nailing is everyone’s responsibility – it is part of business-as-usual – and if leaders do not demonstrate the behaviour and set the expectation then followers will not do it.

So what effect would we expect?

To answer that question we need a better metaphor than our static stack of Swiss cheese slices: we need something more dynamic – something like a motorway!

Suppose you were to set out walking across a busy motorway with your eyes shut and your fingers in your ears – hoping to get to the other side without being run over. What is the chance that you will make it across safely?  It depends on how busy the traffic is and how fast you walk – but say you have a 50:50 chance of getting across one lane safely (which is the same chance as tossing a fair coin and getting a head) – what is the chance that you will get across all six lanes safely? The answer is the same chance as tossing six heads in a row: a 1-in-2 chance of surviving the first lane (50%), a 1 in 4 chance of getting across two lanes (25%), a 1 in 8 chance of making it across three (12.5%) …. to a 1 in 64 chance of getting across all six (1.6%). Said another way that is a 63 out of 64 chance of being run over somewhere which is a 98.4% chance of failure – near certain death! Hardly a Never Event.

What happens to our risk of being run over if the traffic in just one lane is stopped and that lane is now 100% safe to cross? Well you might think that it depends on which lane it is but it doesn’t – the risk of failure is now 31/32 or 96.8% irrespective of which lane it is – so not much improvement apparently!  We have doubled the chance of success though!

Is there a better improvement strategy?

What if we work collectively to just reduce the flow of Niggles in all the lanes at the same time – and suppose we are all able to reduce the risk of a Niggle in our lane-of-influence from 1-in-2 to 1-in-6. How we do it is up to us. To illustrate the benefit we replace our coin with a six-sided die (no pun intended) and we only “die” if we throw a 1.  What happens to our pedestrian’s probability of survival? The chance of surviving the first lane is now 5/6 (83.3%), and both first and second 5/6 x 5/6 = 25/36 (69%.4) and so on to all six lanes which is 5/6 x 5/6 x 5/6 x 5/6 x 5/6 x 5/6 = 15625/46656 = 33.3% which is a lot better than our previous 1.6%!  And what if we keep plugging the holes in our bits of the cheese and we increase our individual lane success rate to 95% – our pedestrians probability of survival is now 73.5%. The chance of a catastrophic event becomes less and less.

The arithmetic may be a bit scary but the message is clear: to prevent the Never Events we must reduce the Near Misses and to to do that we investigate every Near Miss and expose the Not Agains and then use them to Name and Nail all the Niggles.  And we have complete control over the causes of our commonest Niggles because we create them.

This strategy will improve the safety of our system. It has another positive benefit – it will free up our Near Miss investigation team to do something else: it frees them to assist in the re-design the system so that Not Agains cannot happen at all – they become Never Events too – and the earlier in the path that safety-design happens the better – because it renders the other layers of check-and-correct cheesocracy irrelevant.

Just imagine what would happen in a real system if we did that …

And now try to justify not doing it …

And now consider what an individual, team and organisation would need to learn to do this …

It is called Improvement Science.

And learning the Foundations of Improvement Science in Healthcare (FISH) is one place to start.

fish

The Hierarchy of Constraints

Improvements need to be sustained – but not forever.

They should be worthwhile on their own and also provide a foundation for future improvement.

Improvement flows and it does so down the path of least resistance. Improvement will not flow up the path of most resistance. And resistance to flow is called a constraint.

 Many things flow: water, energy, money, data, ideas, knowledge, influence – the list is endless – so the list of possible constraints is also endless.  But not all constraints are the same: a constraint that limits the flow of water – a dam for instance – does not limit the flow of ideas.

The flows and their constraints can be arranged on a contiuum with one end labelled “Physics” and the other end labelled “Paradigms”.  Physical flows are constrained by the Laws of the Universe which are absolute and stable. Philosophical flows are constrained by beliefs which are arbitrary and mutable.

This spectrum is often viewed as a hierarchy – with Paradigms at the top and Physics at the bottom – and between these limits there is a contiuum of constraints.  The Paradigm is completely abstract and intangible and is made actual through Policy, guided by Politics, and enforced by Police.  The root of all these words is “poli” which means “many” and implies the collective of people. So, a Policy is an arbitrary constraint that limits what is and what is not allowed. It is the social white line that indicates what behaviours the collective expect from the individual.  A Policy is implemented as a Process.

What actually happens is constrained by the Physics. Irrespective of the Paradigm, Policy and Process – if the Laws of Physics say something is impossible then it does not happen. It is impossible to squeeze, store or reverse time. It is impossible to do something that requires 30 mins of time in 5 minutes; it is impossible to store time to use later; it is impossible to rewind time go back to a previous point in time.

From the perspective of reality our hierarchy of constraints is upside down – Physics dictates what is possible irrespective of what the Paradigm indicates is believable.  What is believable may not be possible; and what is possible may not be believed.

Improvement Science is the art of the possible – of what the Laws of Physics do not forbid – a wide vista of opportunity.  It is now that our Paradigm acts as the constraint – and Improvement Science is the ability to challenge our Paradigm.  Only then can we create the Policy and the Process that will deliver actual, valuable and sustainable improvement.

Some parts of our Paradigm are necessary to provide explanation and meaning. Other parts are not needed – they are our “belief baggage” – the assumptions that we have picked up along the way; the mumbo-jumbo that obscures the true message. When we focus on the mumbo-jumbo we miss the message and we open the door to cynicism and distrust.

Our challenge is to separate the two – the wheat from the chaff; the diamond from the dross and the pearl-of-wisdom hidden in the ocean-of-data.  What do we actively include? What do we actively exclude? What do we actively remove? What do we actively improve?  We need to monitor all four parts of our Paradigm and that task is what The 4N Chart® was designed to help us do.

Click here get The 4N Chart template and here to get The 4N Chart instructions.

NIGYYSOB

This is the image of an infamous headline printed on May 4th 1982 in a well known UK newspaper.  It refers to the sinking of the General Belgrano in the Falklands war.

It is the clarion call of revenge – the payback for past grievances.

The full title is NIGYYSOB which stands for Now I Gotcha You Son Ofa B**** and is the name of one of Eric Berne’s Games that People Play.  In this case it is a Level 4 Game – played out on the global stage by the armed forces of the protagonists and resulting in both destruction and death.


The NIGYYSOB game is played out much more frequently at Level 1 – in the everyday interactions between people – people who believe that revenge has a sweet taste.

The reason this is important to the world of Improvement Science is because sometimes a well-intentioned improvement can get unintentionally entangled in a game of NIGYYSOB.

Here is how the drama unfolds.

Someone complains frequently about something that is not working, a Niggle, that they believe that they are powerless to solve. Their complaints are either ignored, discounted or not acted upon because the person with the assumed authority to resolve it cannot do so because they do not know how and will not admit that.  This stalemate can fester for a long time and can build up a Reservoir of Resentment. The Niggle persists and keeps irritating the emotional wound which remains an open cultural sore.  It is not unusual for a well-intentioned third party to intervene to resolve the standoff but as they too are unable to resolve the underlying problem – and all that results is either meddling or diktat which can actually make the problem worse.

The outcome is a festering three-way stalemate with a history of failed expectations and a deepening Well of Cynicism.

Then someone with an understanding of Improvement Science appears on the scene – and the stage is set for a new chapter of the drama because they risk of being “hooked” into The Game.  The newcomer knows how to resolve the problem and, with the grudging consent of the three protagonists, as if by magic, the Niggle is dissolved.  Wow!   The walls of the Well of Cynicism are breached by the new reality and the three protagonists suddenly realise that they may need to radically re-evaluate their worldviews.  That was not expected!

What can happen next is an emotional backlash – rather like a tight elastic band being released at one end. Twang! Snap! Ouch!


We all have a the same psychological reaction to a sudden and surprising change in our reality – be it for the better or for the worse. It takes time to adjust to a new worldview and that transition phase is both fragile and unstable; so there is a risk of going off course.

Experience teaches us that it does not take much to knock the tentative improvement over.


The application of Improvement Science will generate transitions that need to be anticipated and proactively managed because if this is not done then there is a risk that the emotional backlash will upset the whole improvement apple-cart.

What appears to occur is: after reality shows that the improvement has worked then the realisation dawns that the festering problem was always solvable, and the chronic emotional pain was avoidable. This comes as a psychological shock that can trigger a reflex emotional response called anger: the emotion that signals the unconscious perception of sudden loss of the old, familiar, worldview. The anger is often directed externally and at the perceived obstruction that blocked the improvement; the person who “should” have known what to do; often the “boss”.  This backlash, the emotional payoff, carries the implied message of “You are not OK because you hold the power, and you could not solve this, and you were too arrogant to ask for help and now I have proved you wrong and that I was right all the time!”  Sweet-tasting revenge?

Unfortunately not. The problem is that this emotional backlash damages the fragile, emerging, respectful relationship and can effectively scupper any future tentative inclinations to improve. The chronic emotional pain returns even worse than before; the Well of Cynicism deepens; and the walls are strengthened and become less porous.

The improvement is not maintained and it dies of neglect.


The reality of the situation was that none of the three protagonists actually knew what to do – hence the stalemate – and the only way out of that situation is for them all to recognise and accept the reality of their collective ignorance – and then to learn together.

Managing the improvement transition is something that an experienced facilitator needs to understand. If there is a them-and-us cultural context; a frustrated standoff; a high pressure store of accumulated bad feeling; and a deep well of cynicism then that emotional abscess needs to diagnosed, incised and drained before any attempt at sustained improvement can be made.

If we apply direct pressure on an emotional abscess then it is likely to rupture and squirt you with cynicide; or worse still force the emotional toxin back into the organisation and poison the whole system. (Email is a common path-of-low-resistance for emotional toxic waste!).

One solution is to appreciate that the toxic emotional pressure needs to be released in a safe and controlled way before the healing process can start.  Most of the pain goes away as soon as the abscess is lanced – the rest dissipates as the healing process engages.

One model that is helpful in proactively managing this dynamic is the Elizabeth Kubler-Ross model of grief which describes the five stages: denial, anger, bargaining, depression, and acceptance.  Grief is the normal emotional reaction to a sudden change in reality – such as the loss of a loved one – and the same psychological process operates for all emotionally significant changes.  The facilitator just needs to provide a game-free and constructive way to manage the anger by reinvesting the passion into the next cycle of improvement.  A more recent framework for this is the Lewis-Parker model which has seven stages:

  1. Immobilisation – Shock. Overwhelmed mismatch: expectations vs reality.
  2. Denial of Change – Temporary retreat. False competence.
  3. Incompetence – Awareness and frustration.
  4. Acceptance of Reality – ‘Letting go’.
  5. Testing – New ways to deal with new reality.
  6. Search for Meaning – Internalisation and seeking to understand.
  7. Integration – Incorporation of meanings within behaviours.

An effective tool for getting the emotional rollercoaster moving is The 4N Chart® – it allows the emotional pressure and pain to be released in a safe way. The complementary tool for diagnosing and treating the cultural abscess is called AFPS (Argument Free Problem Solving) which is a version of Edward De Bono’s Six Thinking Hats®.

The two are part of the improvement-by-design framework called 6M Design® which in turn is a rational, learnable, applicable and teachable manifestation of Improvement Science.


Flap-Flop-Flip

The world seems to is getting itself into a real flap at the moment.

The global economy is showing signs of faltering – the perfect dream of eternal financial growth seems to be showing cracks and is increasingly looking tarnished.

The doom mongers are surprisingly quiet – perhaps because they do not have any new ideas either.


It feels like the system is heading for a big flop and that is not a great feeling.

Last week I posed the Argument-Free-Problem-Solving challenge – and some were curious enough to have a go. It seems that the challenge needs more explanation of how it works to create enough engagement to climb the skepticism barrier.

At the heart of the AFPS method is The 4N Chart® – a simple, effective and efficient way to get a balanced perspective of the emotional contours of the change terrain.  The improvement process boils down to recognising, celebrating, and maintaining the Nuggets, flipping the Niggles into NoNos and reinvesting the currencies that are released into converting NiceIfs into more Nuggets.

The trick is the flip.


To perform a flip we have to make our assumptions explicit – which means we have to use external reality to challenge our internal rhetoric.  We need real data – presented in an easily digestible format – as a picture – and in context which converts the data into information that we can then ingest and use to grow our knowledge and broaden our understanding.

To convert knowledge into understanding we must ask a question: “Is our assumption a generalisation from a specific experience?

For example – it is generally assumed that high utilisation is associated with high productivity – and we want high productivity so we push for high utilisation.  And if we look at reality we can easily find evidence to support our assumption.  If I have under-utilised fixed-cost resources and I push more work into the process, I see an increase the flow in the stream, and an increase in utilisation, and an increase in revenue, and no increase in cost – higher outcome: higher productivity.

But if we look more carefully we can also find examples that seem to disprove our assumption. I have under-utilised resources and I push more work into the process, and the flow increases initially then falls dramatically, the revenue falls, productivity falls and when I look at all my resources they are still fully utilised.  The system has become gridlocked – and when I investigate is discover that the resource I need to unlock the flow is tied up somewhere else in the process with more urgent work. My system does not have an anti-deadlock design.

Our rhetoric of generalisation has been challenged by the reality of specifics – and it only takes one example.  One black swan will disprove the generalisation that “all swans are white”.

We now know we need to flip the “general assumption” into “specific evidence” – changing the words “all”, “always”, “none” and “never” into “some” and “sometimes”.

In our example we flip our assumption into “sometimes utilisation and productivity go up together, and sometimes they do not”. This flip reveals a new hidden door in the invisible wall that limits the breadth of our understanding and that unconsciously hinders our progress.

To open that door we must learn how to tell one specific from another and opening that door will lead to a path of discovery, more knowledge, broader understanding, deeper wisdom, better decisions, more effective actions and sustained improvement.

Flap-Flop-Flip.


This week has seen the loss of one of the greatest Improvement Scientists – Steve Jobs – creator of Apple – who put the essence of Improvement Science into words more eloquently than anyone in his 2005 address at Stanford University.

“Your time is limited, so don’t waste it living someone else’s life. Don’t be trapped by dogma – which is living with the results of other people’s thinking. Don’t let the noise of other’s opinions drown out your own inner voice. And most important, have the courage to follow your heart and intuition. They somehow already know what you truly want to become. Everything else is secondary.” Steve Jobs (1955-2011).

And with a lifetime of experience of leading an organisation that epitomises quality by design Steve Jobs had the most credibility of any person on the planet when it comes to management of improvement.

Safety-By-Design

The picture is of Elisha Graves Otis demonstrating, in the mid 19th century, his safe elevator that automatically applies a brake if the lift cable breaks. It is a “simple” fail-safe mechanical design that effectively created the elevator industry and the opportunity of high-rise buildings.

“To err is human” and human factors research into how we err has revealed two parts – the Error of Intention (poor decision) and the Error of Execution (poor delivery) – often referred to as “mistakes” and “slips”.

Most of the time we act unconsciously using well practiced skills that work because most of our tasks are predictable; walking, driving a car etc.

The caveman wetware between our ears has evolved to delegate this uninteresting and predictable work to different parts of the sub-conscious brain and this design frees us to concentrate our conscious attention on other things.

So, if something happens that is unexpected we may not be aware of it and we may make a slip without noticing. This is one way that process variation can lead to low quality – and these are the often the most insidious slips because they go unnoticed.

It is these unintended errors that we need to eliminate using safe process design.

There are two ways – by designing processes to reduce the opportunity for mistakes (i.e. improve our decision making); and then to avoid slips by designing the subsequent process to be predictable and therefore suitable for delegation.

Finally, we need to add a mechanism to automatically alert us of any slips and to protect us from their consequences by failing-safe.  The sign of good process design is that it becomes invisible – we are not aware of it because it works at the sub-conscious level.

As soon as we become aware of the design we have either made a slip – or the design is poor.


Suppose we walk up to a door and we are faced with a flat metal plate – this “says” to us that we need to “push” the door to open it – it is unambiguous design and we do not need to invoke consciousness to make a push-or-pull decision.  The technical term for this is an “affordance”.

In contrast a door handle is an ambiguous design – it may require a push or a pull – and we either need to look for other clues or conduct a suck-it-and-see experiment. Either way we need to switch our conscious attention to the task – which means we have to switch it away from something else. It is those conscious interruptions that cause us irritation and can spawn other, possibly much bigger, slips and mistakes.

Safe systems require safe processes – and safe processes mean fewer mistakes and fewer slips. We can reduce slips through good design and relentless improvement.

A simple and effective tool for this is The 4N Chart® – specifically the “niggle” quadrant.

Whenever we are interrupted by a poorly designed process we experience a niggle – and by recording what, where and when those niggles occur we can quickly focus our consciousness on the opportunity for improvement. One requirement to do this is the expectation and the discipline to record niggles – not necessarily to fix them immediately – but just to record them and to review them later.

In his book “Chasing the Rabbit” Steven Spear describes two examples of world class safety: the US Nuclear Submarine Programme and Alcoa, an aluminium producer.  Both are potentially dangerous activities and, in both examples, their world class safety record came from setting the expectation that all niggles are recorded and acted upon – using a simple, effective and efficient niggle-busting process.

In stark and worrying contrast, high-volume high-risk activities such as health care remain unsafe not because there is no incident reporting process – but because the design of the report-and-review process is both ineffective and inefficient and so is not used.

The risk of avoidable death in a modern hospital is quoted at around 1:300 – if our risk of dying in an elevator were that high we would take the stairs!  This worrying statistic is to be expected though – because if we lack the organisational capability to design a safe health care delivery process then we will lack the organisational capability to design a safe improvement process too.

Our skill gap is clear – we need to learn how to improve process safety-by-design.


Download Design for Patient Safety report written by the Design Council.

Other good examples are the WHO Safer Surgery Checklist, and the story behind this is told in Dr Atul Gawande’s Checklist Manifesto.