
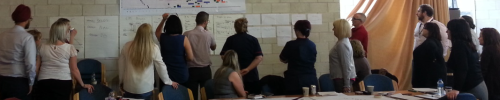
This week about thirty managers and clinicians in South Wales conducted two experiments to test the design of the Flow Design Practical Skills One Day Workshop.
Their collective challenge was to diagnose and treat a “chronically sick” clinic and the majority had no prior exposure to health care systems engineering (HCSE) theory, techniques, tools or training.
Two of the group, Chris and Jat, had been delegates at a previous ODWS, and had then completed their Level-1 HCSE training and real-world projects.
They had seen it and done it, so this experiment was to test if they could now teach it.
Could they replicate the “OMG effect” that they had experienced and that fired up their passion for learning and using the science of improvement?
The first phase is to replicate reality using a simulated one-stop clinic where the delegates play the role of the patients.
Their first-hand experience was of queues, chaos, confusion, fire-fighting, frustration, anxiety and disappointment – i.e. “situation normal”.
The first phase also generated a big set of raw event data, a meaningless table of numbers. This actually held the clues to the diagnosis, and therefore to possible paths to a no-queues-or-chaos design.
That was the goal: calm efficiency; a high quality experience for all; a safe, productive and resilient service that everyone could be proud of.
In medicine we start the diagnostic process by taking a history. We first need to build a mental picture of the context of the patient’s presenting complaint(s) – their symptoms and signs.
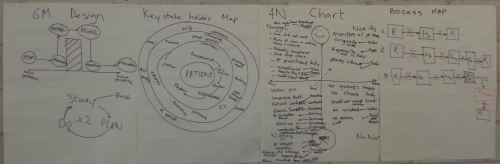
In HCSE, we call this the Map phase and the image above shows some of the maps that the facilitators-under-test drew from the delegates.
The “symptoms” of the “poorly process” are captured on the third map, the 4N Chart®, and specifically as the list of Niggles.
The next phase is called Measure and for this the delegates formed into teams and, assisted by the facilitators-in-training, worked together to bring the data to life. To make the data visible and informative. To help the system tell its own story.
This is the management equivalent to the examination and investigation phase of the medical model that all clinicians are taught.
The groups were now ready to start the critical phase – Diagnosis – and to facilitate that step, all the maps and measures were arranged on the wall in the form of a storyboard.
And using the storyboard and another HCSE technique called a DLCA analysis, the diagnosis of the root cause of the queues and chaos became apparent. And it was not what the delegates expected!
With that new insight the facilitators-in-progress introduced the delegates to a simple, practical, visual yet powerful HCSE design technique … and the delegates cooked up their new designs in a matter of minutes … on their own.
And using the same tool, they predicted the future performance of their new design.
So, all that was left was to test their new design … which they did … and … the queues and chaos had evaporated. Just as they had predicted.
OMG!
(NB. No computers were needed for any of this.)
Flow Design Practical Skills ODWS Validation Test: Passed.
For more information on the HCSE Programme and the Practical Skills One Day Workshops.