Our Irrational Inner Chimp

single_file_line_PA_150_wht_3113The modern era in science started about 500 years ago when an increasing number of people started to challenge the dogma that our future is decided by Fates and Gods. That we had no influence. And to appease the ‘Gods’ we had to do as we were told. That was our only hope of Salvation.

This paradigm came under increasing pressure as the evidence presented by Reality did not match the Rhetoric.  Many early innovators paid for their impertinence with their fortunes, their freedom and often their future. They were burned as heretics.

When the old paradigm finally gave way and the Age of Enlightenment dawned the pendulum swung the other way – and the new paradigm became the ‘mechanical universe’. Isaac Newton showed that it was possible to predict, with very high accuracy, the motion of the planets just by adopting some simple rules and a new form of mathematics called calculus. This opened a door into a more hopeful world – if Nature follows strict rules and we know what they are then we can learn to control Nature and get what we need without having to appease any Gods (or priests).

This was the door to the Industrial Revolutions – there have been more that one – each lasting about 100 years (18th C, 19th C and 20th C). Each was associated with massive population growth as we systematically eliminated the causes of early mortality – starvation and infectious disease.

But not everything behaved like the orderly clockwork of the planets and the pendulums. There was still the capricious and unpredictable behaviour that we call Lady Luck.  Had the Gods retreated but were still playing dice?

Progress was made here too – and the history of the ‘understanding of chance’ is peppered with precocious and prickly mathematical savants who discovered that chance follows rules too. Probability theory was born and that spawned a troublesome child called Statistics. This was a trickier one to understand. To most people statistics is just mathematical gobbledygook.

But from that emerged a concept called the Rational Man – which underpinned the whole of Economic Theory for 250 years. Until very recently.  The RM hypothesis stated that we make unconscious but rational judgements when presented with uncertain win/lose choices.  And from that seed sprouted concepts such as the Law of Supply and Demand – when the supply of things we  demand are limited then we (rationally) value them more and will choose to pay more so prices go up so fewer can afford them so demand drops. Foxes and Rabbits. A negative feedback loop. The economic system becomes self-adjusting and self-stabilising.  The outcome of this assumption is a belief that ‘because people are collectively rational the economic system will be self-stabilising and it will correct the adverse short term effects of any policy blunders we make‘.  The ‘let-the-market-decide’ belief that experimental economic meddling is harmless over the long term and what is learned from ‘laissez-faire’ may even be helpful. It is a no-lose long term improvement strategy. Losers are just unlucky, stupid or both.

In 2002 the Nobel Prize for Economics was not awarded to an economist. It was awarded to a psychologist – Daniel Kahneman – who showed that the model of the Rational Man did not stand up to rigorous psychological experiment.  Reality demonstrated we are Irrational Chimps. The economists had omitted to test their hypothesis. Oops!


This lesson has many implications for the Science of Improvement.  One of which is a deeper understanding of the nemesis of improvement – resistance to change.

One of the surprising findings is that our judgements are biased – and our bias operates at an unconscious level – what Kahneman describes as the System One level. Chimp level. We are not aware we are making biased decisions.

For example. Many assume that we prefer certainty to uncertainty. We fear the unpredictable. We avoid it. We seek the predictable and the stable. And we will put up with just about anything so long as it is predictable. We do not like surprises.  And when presented with that assertion most people nod and say ‘Yes’ – that feels right.

We also prefer gain to loss.  We love winning. We hate losing. This ‘competitive spirit’ is socially reinforced from day one by our ‘pushy parents’ – we all know the ones – but we all do it to some degree. Do better! Work harder! Be a success! Optimize! Be the best! Be perfect! Be Perfect! BE PERFECT.

So which is more important to us? Losing or uncertainty? This is one question that Kahneman asked. And the answer he discovered was surprising – because it effectively disproved the Rational Man hypothesis.  And this is how a psychologist earned a Nobel Prize for Economics.

Kahneman discovered that loss is more important to us than uncertainty.

To demonstrate this he presented subjects with a choice between two win/lose options; and he presented the choice in two ways. To a statistician and a Rational Man the outcomes were exactly the same in terms of gain or loss.  He designed the experiment to ensure that it was the unconscious judgement that was being measured – the intuitive gut reaction. So if our gut reactions are Rational then the choice and the way the choice was presented would have no significant effect.

There was an effect. The hypothesis was disproved.

The evidence showed that our gut reactions are biased … and in an interesting way.

If we are presented with the choice between a certain gain and an uncertain gain/loss (so the average gain is the same) then we choose the certain gain much more often.  We avoid uncertainty. Uncertainly =1 Loss=0.

BUT …

If we are presented with a choice between certain loss and an uncertain loss/gain (so the average outcome is again the same) then we choose the uncertain option much more often. This is exactly the opposite of what was expected.

And it did not make any difference if the subject knew the results of the experiment before doing it. The judgement is made out of awareness and communicated to our consciousness via an emotion – a feeling – that biases our slower, logical, conscious decision process.

This means that the sense of loss has more influence on our judgement than the sense of uncertainty.

This behaviour is hard-wired. It is part of our Chimp brain design. And once we know this we can see the effect of it everywhere.

1. We will avoid the pain of uncertainty and resist any change that might deliver a gain when we believe that future loss is uncertain. We are conservative and over-optimistic.

2. We will accept the pain of uncertainty and only try something new (and risky) when we believe that to do otherwise will result in certain loss. The Backs Against The Wall scenario.  The Cornered Rat is Unpredictable and Dangerous scenario.

This explains why we resist any change right up until the point when we see Reality clearly enough to believe that we are definitely going to lose something important if we do nothing. Lose our reputation, lose our job, lose our security, lose our freedom or lose our lives. That is a transformational event.  A Road to Damascus moment.

monkey_on_back_anim_150_wht_11200Understanding that we behave like curious, playful, social but irrational chimps is one key to unlocking significant and sustained improvement.

We need to celebrate our inner chimp – it is key to innovation.

And we need to learn how to team up with our inner chimp rather than be hijacked by it.

If we do not we will fail – the Laws of Physics, Probability and Psychology decree it.

Sticks or Carrots?

boss_dangling_carrot_for_employee_anim_150_wht_13061[Beep Beep] Bob’s laptop signaled the arrival of Leslie to their regular Webex mentoring session. Bob picked up the phone and connected to the conference call.

<Bob> Hi Leslie, how are you today?

<Leslie> Great thanks Bob. I am sorry but that I do not have a red-hot burning issue to talk about today.

<Bob> OK – so your world is completely calm and orderly now. Excellent.

<Leslie> I wish! The reason is that I have been busy preparing for the monthly 1-2-1 with my boss.

<Bob> OK. So do you have a few minutes to talk about that?

<Leslie> What can I tell you about it?

<Bob> Can you just describe the purpose and the process for me?

<Leslie> OK. The purpose is improvement – for both the department and the individual. The process is that all departmental managers have an annual appraisal based on their monthly 1-2-1 chats and the performance scores for their departments are used to reward the top 15% and to ‘performance manage’ the bottom 15%.

<Bob> H’mmm.  What is the commonest emotion that is associated with this process?

<Leslie> I would say somewhere between severe anxiety and abject terror. No one looks forward to it. The annual appraisal feels like a lottery where the odds are stacked against you.

<Bob> Can you explain that a bit more for me?

<Leslie> Well, the most fear comes from being in the bottom 15% – the fear of being ‘handed your hat’ so to speak. Fortunately that fear motivates us to try harder and that usually saves us from the chopper because our performance improves.  The cost is the extra stress, working late and taking ‘stuff’ home.

<Bob> OK. And the anxiety?

<Leslie> Paradoxically that mostly comes from the top 15%. They are anxious to sustain their performance. Most do not and the Boss’s Golden Manager can crash spectacularly! We have seen it so often. It is almost as if being the Best carries a curse! So most of us try to stay in the middle of the pack where we do not stick out – a sort of safety in the herd strategy.  It is illogical I know because there is always a ‘top’ 15% and a ‘bottom’ 15%.

<Bob> You mentioned before that it feels like a lottery. How come?

<Leslie> Yes – it feels like a lottery but I know it has a rational scientific basis. Someone once showed me the ‘statistically significant evidence’ that proves it works.

<Bob> That what works exactly?

<Leslie> That sticks are more effective than carrots!

<Bob> Really! And what does the performance run charts look like – over the long term – say monthly over 2-3 years?

<Leslie> That is a really good question. They are surprisingly stable – well completely stable in fact. The wobble up and down of course but there is no sign of improvement over the long term – no trend. If anything it is the other way.

<Bob> So what is the rationale for maintaining the stick-is-better-than-the-carrot policy?

<Leslie> Ah! The message we are getting  is ‘as performance is not improving and sticks have been scientifically proven to be more effective than carrots then we will be using a bigger stick in future‘.

<Bob> Hence the atmosphere of fear and anxiety?

<Leslie> Exactly. But that is the way it must be I suppose.

<Bob> Actually it is not. This is an invalid design based on rubbish intuitive assumptions and statistical smoke-and-mirrors that creates unmeasurable emotional pain and destroys both people and organisations!

<Leslie> Wow! Bob! I have never heard you use language like that. You are usually so calm and reasonable. This must be really important!

 <Bob> It is – and for that reason I need to shock you out of your apathy  – and I can do that best by you proving it to yourself – scientifically – with a simple experiment. Are you up for that?

<Leslie> You betcha! This sounds like it is going to be interesting. I had better fasten my safety belt! The Nerve Curve awaits.


 The Stick-or-Carrot Experiment

<Bob> Here we go. You will need five coins, some squared-paper and a pencil. Coloured ones are even better.

<Leslie> OK. Does it matter what sort of coins?

<Bob> No. Any will do. Imagine you have four managers called A,B,C and D respectively.  Each month the performance of their department is measured as the number of organisational targets that they are above average on. Above average is like throwing a ‘head’, below average is like throwing a ‘tail’. There are five targets – hence the coins

<Leslie>OK. That makes sense – and it feels better to use the measured average – we have demonstrated that arbitrary performance targets are dangers – especially when imposed blindly across all departments.

<Bob> Indeed. So can you design a score sheet to track the data for the experiment.

<Leslie>Give me a minute.  Will this suffice?

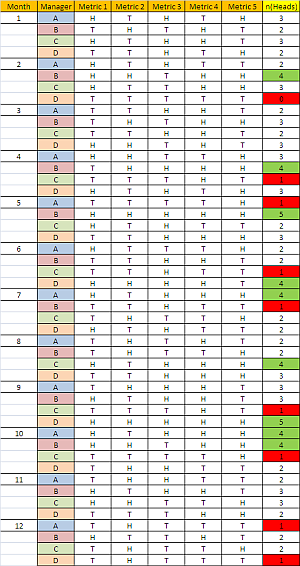
Stick_and_Carrot_Fig1<Bob> Perfect! Now simulate a month by tossing all five coins – once for each manager – and record the outcome of each as H to T , then tot up the number of heads for each manager.

<Leslie>  OK … here is what I got.

Stick_and_Carrot_Fig2<Bob>Good. Now repeat this 11 more times to give you the results for a whole year.  In the n(Heads) column colour the boxes that have scores of zero or one as red – these are the Losers. Then colour the boxes that have 4 or 5 as green – these are the Winners.

<Leslie>OK, that will take me a few minutes – do you want to get a coffee or something.

[Five minutes later]

Here you go. That gives 96 opportunities to win or lose and I counted 9 Losers and 9 Winners so just under 20% for each. The majority were in the unexceptional middle. The herd.

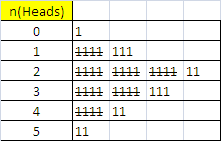
Stick_and_Carrot_Fig3<Bob> Excellent.  A useful way to visualise this is using a Tally chart. Just run down the column of n(Heads) and create the Tally chart as you go. This is one of the oldest forms of counting in existence. There are fossil records that show Tally charts being used thousands of years ago.

<Leslie> I think I understand what you mean. We do not wait until all the data is in then draw the chart, we update it as we go along – as the data comes in.

<Bob> Spot on!

<Leslie> Let me see. Wow! That is so cool!  I can see the pattern appearing almost magically – and the more data I have the clearer the pattern is.

 <Bob>Can you show me?

<Leslie> Here we go.

Stick_and_Carrot_Fig4<Bob> Good.  This is the expected picture. If you repeated this many times you would get the same general pattern with more 2 and 3 scores.

Now I want you to do an experiment.

Assume each manager that is classed as a Winner in one month is given a reward – a ‘pat on the back’ from their Boss. And each manager that is classed as a Loser is given a ‘written warning’. Now look for  the effect that this has.

<Leslie> But we are using coins – which means the outcome is just a matter of chance! It is a lottery.

<Bob> I know that and you know that but let us assume that the Boss believes that the monthly feedback has an effect. The experiment we are doing is to compare the effect of the carrot with the stick. The Boss wants to know which results in more improvement and to know that with scientific and statistical confidence!

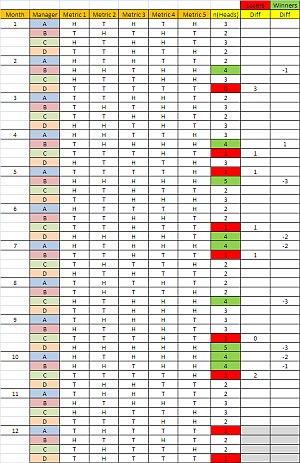
<Leslie> OK. So what I will do is look at the score the following month for each manager that was either a Winner or a  Loser; work out the difference, and then calculate the average of those differences and compare them with each other. That feels suitably scientific!

<Bob> OK. What do you get.

<Leslie> Just a minute, I need to do this carefully. OK – here it is.

<Bob>Stick_and_Carrot_Fig5 Excellent.  Just eye-balling the ‘Measured improvement after feedback’ columns I would say the Losers have improved and the Winners have deteriorated!

<Leslie> Yes! And the Losers have improved by 1.29 on average and the Winners have deteriorated by 1.78 – and that is a big difference for such small sample. I am sure that with enough data this would be a statistically significant difference! So it is true, sticks work better than carrots!

<Bob>Not so fast. What you are seeing is a completely expected behaviour called “Regression to the Mean“. Remember we know that the score for each manager each month is the result of a game of chance, a coin toss, a lottery. So no amount of stick or carrot feedback is going to influence that.

<Leslie>But the data is saying there is a difference! And that feels like the experience we have – and why fear stalks the management corridors. This is really confusing!

<Bob>Remember that confusion arises from invalid or conflicting unconscious assumptions. There is a flaw in the statistical design of this experiment. The ‘obvious’ conclusion is invalid because of this flaw. And do not be too hard on yourself. The flaw eluded mathematicians for centuries. But now you know there is one can you find it?

<Leslie>OMG!  The use of the average to classify the managers into Winners or Losers is the flaw!  That is just a lottery. Who the managers are is irrelevant. This is just a demonstration of how chance works.

But that means … OMG!  If the conclusion is invalid then sticks are not better than carrots and we have been brain-washed for decades into accepting a performance management system that is invalid – and worse still is used to ‘scientifically’ justify systematic persecution! I can see now why you get so angry!

<Bob>Bravo Leslie.  We  need to check your understanding. Does that mean carrots are better than sticks?

<Leslie>No!  The conclusion is invalid because the assumptions are invalid and the design is fatally flawed. It does not matter what the conclusion actually is.

<Bob>Excellent. So what conclusion can you draw?

<Leslie>That this short-term carrot-or-stick feedback design for achieving improvement in a stable system  is both ineffective and emotionally damaging. In fact it could well be achieving precisely the opposite effect that it is intended to. It may be preventing improvement! But the story feels so plausible and the data appears to back it up. What is happening here is we are using statistical smoke-and-mirrors to justify what we have already decided – and only an true expert would spot the flaw! Once again our intuition has tricked us!

<Bob>Well done! And with this new insight – how would you do it differently?  What would be a better design?

<Leslie>That is a very good question. I am going to have to think about that – before my 1-2-1 tomorrow. I wonder what might happen if I show this demonstration to my Boss? Thanks Bob, as always … lots of food for thought.


What is my P.A.R.T?

four_way_puzzle_people_200_wht_4883Improvement implies change, but change does not imply improvement.

Change follows action. Action follows planning. Effective planning follows from an understanding of the system because it is required to make the wise decisions needed to achieve the purpose.

The purpose is the intended outcome.

Learning follows from observing the effect of change – whatever it is. Understanding follows from learning to predict the effect of both actions and in-actions.

All these pieces of the change jigsaw are different and they are inter-dependent. They fit together. They are a system.

And we can pick out four pieces: the Plan piece, the Action piece, the Observation piece and the Learning piece – and they seem to follow that sequence – it looks like a learning cycle.

This is not a new idea.

It is the same sequence as the Scientific Method: hypothesis, experiment, analysis, conclusion. The preferred tool of  Academics – the Thinkers.

It is also the same sequence as the Shewhart Cycle: plan, do, check, act. The preferred tool of the Pragmatists – the Doers.

So where does all the change conflict come from? What is the reason for the perpetual debate between theorists and activists? The incessant game of “Yes … but!”

One possible cause was highlighted by David Kolb  in his work on ‘experiential learning’ which showed that individuals demonstrate a learning style preference.

We tend to be thinkers or doers and only a small proportion us say that we are equally comfortable with both.

The effect of this natural preference is that real problems bounce back-and-forth between the Tribe of Thinkers and the Tribe of Doers.  Together we are providing separate parts of the big picture – but as two tribes we appear to be unaware of the synergistic power of the two parts. We are blocked by a power struggle.

The Experiential Learning Model (ELM) was promoted and developed by Peter Honey and Alan Mumford (see learning styles) and their work forms the evidence behind the Learning Style Questionnaire that anyone can use to get their ‘score’ on the four dimensions:

  • Pragmatist – the designer and planner
  • Activist – the action person
  • Reflector – the observer and analyst
  • Theorist – the abstracter and hypothesis generator

The evidence from population studies showed that individuals have a preference for one of these styles, sometimes two, occasionally three and rarely all four.

That observation, together with the fact that learning from experience requires moving around the whole cycle, leads to an awareness that both individuals and groups can get ‘stuck’ in their learning preference comfort zone. If the learning wheel is unbalanced it will deliver a bumpy ride when it turns! So it may be more comfortable just to remain stationary and not to learn.

Which means not to change. Which means not to improve.


So if we are embarking on an improvement exercise – be it individual or collective – then we are committed to learning. So where do we start on the learning cycle?

The first step is action. To do something – and the easiest and safest thing to do is just look. Observe what is actually happening out there in the real world – outside the office – outside our comfort zone. We need to look outside our rhetorical inner world of assumptions, intuition and pre-judgements. The process starts with Study.

The next step is to reflect on what we see – we look in the mirror – and we compare what are actually seeing with what we expected to see. That is not as easy as it sounds – and a useful tool to help is to draw charts. To make it visual. All sorts of charts.

The result is often a shock. There is often a big gap between what we see and what we perceive; between what we expect and what we experience; between what we want and what we get; between our intent and our impact.

That emotional shock is actually what we need to power us through the next phase – the Realm of the Theorist – where we ask three simple questions:
Q1: What could be causing the reality that I am seeing?
Q2: How would I know which of the plausible causes is the actual cause?
Q3: What experiment can I do to answer my question and clarify my understanding of Reality?

This is the world of the Academic.

The third step is design an experiment to test our new hypothesis.  The real world is messy and complicated and we need to be comfortable with ‘good enough’ and ‘reasonable uncertainty’.  Design is about practicalities – making something that works well enough in practice – in the real world. Something that is fit-for-purpose. We are not expecting perfection; not looking for optimum; not striving for best – just significantly better than what we have now. And the more we can test our design before we implement it the better because we want to know what to expect before we make the change and we want to avoid unintended negative consequences – the NoNos. This is Plan.

twisting_arrow_200_wht_11738Then we act … and the cycle of learning has come one revolution … but we are not back at the start – we have moved forward. Our understanding is already different from when were were at this stage before: it is deeper and wider.  We are following the trajectory of a spiral – our capability for improvement is expanding over time.

So we need to balance our learning wheel before we start the journey or we will have a slow, bumpy and painful ride!

We need to study, then plan, then do, then study the impact.


One plausible approach is to stay inside our comfort zones, play to our strengths and to say “What we need is a team made of people with complementary strengths. We need a Department of Action for the Activists; a Department of Analysis for the Reflectors; a Department of Research for the Theorists and a Department of Planning for the Pragmatists.

But that is what we have now and what is the impact? The Four Departments have become super-specialised and more polarised.  There is little common ground or shared language.  There is no common direction, no co-ordination, no oil on the axle of the wheel of change. We have ground to a halt. We have chaos. Each part is working but independently of the others in an unsynchronised mess.

We have cultural fibrillation. Change output has dropped to zero.


A better design is for everyone to focus first on balancing their own learning wheel by actively redirecting emotional energy from their comfort zone, their strength,  into developing the next step in their learning cycle.

Pragmatists develop their capability for Action.
Activists develop their capability for Reflection.
Reflectors develop their capability for Hypothesis.
Theorists develop their capability for Design.

The first step in the improvement spiral is Action – so if you are committed to improvement then investing £10 and 20 minutes in the 80-question Learning Style Questionnaire will demonstrate your commitment to yourself.  And that is where change always starts.

The Shredder

figure_snowblowing_150_wht_13606It is the time of year when our minds turn to self-improvement.

New Year.

We re-affirm our Resolutions from last year and we vow to try harder this year. As we did last year. And the year before that. And we usually fail.

So why do we fail to keep our New Year Resolutions?

One reason is because we do not let go of the past. We get pulled back into old habits too easily. To get a new future we have to do some tidying up. We need to get The Shredder. We need to make the act of letting go irreversible.

Bzzzzzzz …. Aaaaah. That feels better.

Why does this work?

First, because it feels good to be taking definitive action.  We know that resolutions are just good intentions. It is not until we take action that change happens.  Many of us are weak on the Activist dimension. We talk a lot about what we should do but we do not walk as much as we could do.

Second, because  we can see the evidence of the improvement immediately. We get immediate, visual, positive feedback. That heap of old bills and emails and reports that we kept ‘just in case’ is no longer cluttering up our desks, our eyes, our minds and our lives.  And we have ‘recycled’ it which feels even better.

Third, because we have challenged our own Prevarication Policy. And if we can do that for ourselves we can, with some credibility, do the same for others. We feel more competent and more confident.

Fourth, because we have freed up valuable capacity to invest.  More space. More time (our prevarication before kept us busy but wasted our limited time). More motivation (trying to work around a pile of rubbish day-in and day-out is emotionally draining).

So all we need to do in the New Year is stay inside our circle of control and shred some years of accumulated rubbish.

figure_picking_up_trash_150_wht_11857And it is not just tangible rubbish we can dispose of.  We can shred some emotional garbage too. The list of “Yes … But” excuses that we cling on to.  The sack of guilt for past failures that weighs us down. The flag of fear that we wave when we surrender our independence and adopt the Victim role.  The righteous indignation that we use to hide our own self-betrayal.

And just by putting that lot through The Shredder we release the opportunity for improvement.

The rest just happens – as if by magic.