Step 6 – Maintain

Anyone with much experience of  change will testify that one of the hardest parts is sustaining the hard won improvement.

The typical story is all too familiar – a big push for improvement, a dramatic improvement, congratulations and presentations then six months later it is back where it was before but worse. The cynics are feeding on the corpse of the dead change effort.

The cause of this recurrent nightmare is a simple error of omission.

Failure to complete the change sequence. Missing out the last and most important step. Step 6 – Maintain.

Regular readers may remember the story of the pharmacy project – where a sceptical department were surprised and delighted to discover that zero-cost improvement was achievable and that a win-win-win outcome was not an impossible dream.

Enough time has now passed to ask the question: “Was the improvement sustained?”

TTO_Yield_Nov12_Jun13The BaseLine© chart above shows their daily performance data on their 2-hour turnaround target for to-take-out prescriptions (TTOs) . The weekends are excluded because the weekend system is different from the weekday system. The first split in the data in Jan 2013 is when the improvement-by-design change was made. Step 4 on the 6M Design® sequence – Modify.

There was an immediate and dramatic improvement in performance that was sustained for about six weeks – then it started to drift back. Bit by Bit.  The time-series chart flags it clearly.


So what happened next?

The 12-week review happened next – and it was done by the change leader – in this case the Inspector/Designer/Educator.  The review data plotted as a time-series chart revealed instability and that justified an investigation of the root cause – which was that the final and critical step had not been completed as recommended. The inner feedback loop was missing. Step 6 – Maintain was not in place.

The outer feedback loop had not been omitted. That was the responsibility of the experienced change leader.

And the effect of closing the outer-loop is clearly shown by the third segment – a restoration of stability and improved capability. The system is again delivering the improvement it was designed to deliver.


What does this lesson teach us?

The message here is that the sponsors of improvement have essential parts to play in the initiation and the maintenance of change and improvement. If they fail in their responsibility then the outcome is inevitable and predictable. Mediocrity and cynicism.

Part 1: Setting the clarity and constancy of common purpose.

Without a clear purpose then alignment, focus and effectiveness are thwarted.  Purpose that changes frequently is not a purpose – it is reactive knee-jerk politics.  Constancy of purpose is required because improvement takes time to achieve and to embed.  There is always a lag so moving the target while the arrow is in flight is both dangerous and leads to disengagement.  Establishing common ground is essential to avoiding the time-wasting discussion and negotiation that is inevitable when opinions differ – which they always do.

Part 2: Respectful challenge.

Effective change leadership requires an ability to challenge from a position of mutual respect.  Telling people what to do is not leadership – it is dictatorship.  Dodging the difficult conversations and passing the buck to others is not leadership – it is ineffective delegation. Asking people what they want to do is not leadership – it is abdication of responsibility.  People need their leaders to challenge them and to respect them at the same time.  It is not a contradiction.  It is possible to do both.

And one way that a leader of change can challenge with respect is to expose the need for change; to create the context for change; and then to commit to holding those charged with change to account – including themselves.  And to make it clear at the start what their expectation is as a leader – and what the consequences of disappointment are.

It is a delight to see individuals,  teams, departments and organisations blossom and grow when the context of change is conducive.  And it is disappointing to see them wither and shrink when the context of change is laced with cynicide – the toxic product of cynicism.


So what is the next step?

What could an aspirant change leader do to get this for themselves and their organisations?

One option is to become a Student of Improvementology® – and they can do that here.

Six Weeks

team_puzzle_123456There seems to be a natural cycle to change and improvement.

A pace that feels right and that works well. Try to push faster and resistance increases. Relax and pull slower and interest wanders.

The pace that feels about right is a six week cycle.

So why six weeks? Is it 42 days that is important or it there something about a seven-day week and the number six?

The daily and the weekly cycles are dictated by the Celestial Clockwork.  The day is the Earth’s rotation and the week is one quarter if the 28 day Lunar cycle. These are not arbitrary policies – they are celestial physics. Not negotiable.

So where does the Six come from? That does seem to be something to do with people and psychology.

team_puzzle_SDABDRRemember the Nerve Curve?

The predictable sequence of emotional states that accompanies significant change? The sequence of Shock-Denial-Anger-Bargaining-Depression-Resolution?  It has six stages.  Is that just a co-incidence?

team_puzzle_MMMMMMRemember 6M Design®?

The required sequence of steps that structure any improvement-by-design challenge? It has six stages.

Is that just a co-incidence too?

And is seven days a convenient size? It was originally six-days-of-work and one-day-of-rest. The modern 5-and-2 design is a recent invention.

And if each stage requires at least one week to complete and we require six stages then we get a Six Week cycle.

It sounds lie a plausible hypothesis but is that what happens in reality?

There is a lot of empirical evidence to suggest that it does. It seems we feel comfortable working with six-week chunks of time.  We plan about six weeks ahead.  School terms are divided into about six week chunks. A financial “quarter” is about two chunks. We can fit four of those into a Year with a bit left over.  Action learning seems to work well in six week cycles. Courses are very often carved up into six week modules. It feels OK.

So what does this mean for the Improvement Scientist?

First it suggests that doing something every week makes sense. Leaving it all to the last minute does not.
Second it suggests that each week the step required and the emotional reaction is predictable.
Third it suggests that five weeks of facilitative investment are required.
Fourth it suggests that if something throws a spanner into the sequence the we need to add extra weeks.

And it suggests that in the Seventh Week we can rest, reflect, share and prepare for the next Six Week change cycle.

So maybe Douglas Adams was correct – the Answer to Life the Universe and Everything is Forty Two.

Spreading the Word

clock_hands_spinning_import_150_wht_3149Patience is a virtue for an advocate of Improvementology®.

This week Mike Davidge (Head of Measurement for the former NHS Institute for Innovation and Improvement) posted some feedback on the Journal of Improvement Science site.

His feedback is reproduced here in full with Mike’s permission. The rationale for reproduction that the activity data shows that more people the Blog than the Journal.

Feedback posted on 15/06/2013 at 07:35:05 for paper entitled:

Dodds S. A Case Study of a Successful One-Stop Clinic Schedule Design using Formal Methods . Journal of Improvement Science 2012:6; 1-13.

“It’s only taken me a year to get round to reading this, an improvement on your 9 years to write it! It was well worth the read. You should make a serious attempt to publish this where it gets a wider audience. Rank = 5/5”

thank_you_boing_150_wht_5547Mike is a world expert in healthcare system measurement and improvement so this is a huge compliment. Thank you Mike. He is right too – 1 year is a big improvement on 9 years. So why did it take 9 years to write up?

One reason is that publication was not the purpose. Improvement was the purpose. Another reason was that this was a step in a bigger improvement project – one that is described in Three Wins.  There is a third reason: the design flaws of the traditional academic peer review process. This is radical stuff and upsets a lot of people so we need to be careful.

The two primary design flaws of conventional peer-reviewed academic journals are:

1) that it has a long lead time and
2) that it has a low yield.

So it is very expensive in author-lifetime.  Improvement is not the same as research.  Perfection is not the goal. Author lifetime is a very valuable resource. If it is wasted with an inefficient publication process design then the result is less output and less dissemination of valuable Improvement Science.

So if any visitors would like to benefit from Mike’s recommendation then you can download the full text of the essay here. It has not been peer-reviewed so you will have to make you own minds up about the value. And if you have any questions then you are free to ask the author.

PS. The visitor who points out the most spelling and grammar errors will earn themselves a copy of BaseLine© the time-series analysis software used to create the charts.

Resistance and Persistence

[Bing-Bong]

The email from Leslie was unexpected.

Hi Bob, can I change the planned topic of our session today to talk about resistance. We got off to a great start with our improvement project but now I am hitting brick walls and we are losing momentum. I am getting scared we will stall. Leslie”

Bob replied immediately – it was only a few minutes until their regular teleconference call.

Hi Leslie, no problem. Just firing up the Webex session now. Bob”

[Whoop-Whoop]

The sound bite announced Leslie joining in the teleconference.

<Leslie> Hi Bob. Sorry about the last minute change of plan. Can I describe the scenario?

<Bob> Hi Leslie. Please do.

<Leslie> Well we are at stage five of the 6M Design® sequence and we are monitoring the effect of the first set of design changes that we have made. We started by eliminating design flaws that were generating errors and impairing quality.   The information coming in confirms what we predicted at stage 3.  The problem is that a bunch of “fence-sitters” that said nothing at the start are now saying that the data is a load of rubbish and implying we are cooking the books to make it look better than it is! I am pulling my hair out trying to convince them that it is working.

<Bob> OK. What is your measure for improvement?

<Leslie> The percentage yield from the new quality-by-design process. It is improving. The BaseLine© chart says so.

<Bob> And how is that improvement being reported?

<Leslie> As the average yield per week.  I know we should not aggregate for a month because we need to see the impact of the change as it happens and I know there is a seven-day cycle in the system so we set the report interval at one week.

<Bob> Yes. Those are all valid reasons. What is the essence of the argument against your data?

<Leslie> There is no specific argument – it is just being discounted as “rubbish”.

<Bob> So you are feeling resistance?

<Leslie> You betcha!

<Bob> OK. Let us take a different tack on this. How often do you measure the yield?

<Leslie> Daily.

<Bob> And what is the reason you are using the percentage yield as your metric?

<Leslie> So we can compare one day with the next more easily and plot it on a time-series chart. The denominator is different every day so we cannot use just the count of errors.

<Bob> OK. And how do you calculate the weekly average?

<Leslie> From the daily percentage yields. It is not a difficult calculation!

There was a definite hint of irritation and sarcasm in Leslie’s voice.

<Bob> And how confident are you in your answer?

<Leslie> Completely confident. The team are fantastic. They see the value of this and are collecting the data assiduously. They can feel the improvement. They do not need the data to prove it. The feedback is to convince the fence-sitters and skeptics and they are discounting it.

<Bob> OK so you are confident in the quality of the data going in to your calculation – how confident are you in the data coming out?

<Leslie> What do you mean!  It is a simple calculation – a 12 year old could do.

<Bob> How are you feeling Leslie?

<Leslie>Irritated!

<Bob> Does it feel as if I am resisting too?

<Leslie>Yes!!

<Bob> Irritation is anger – the sense of loss in the present. What do you feel you are losing?

<Leslie> My patience and my self-confidence.

<Bob> So what might be my reasons for resisting?

<Leslie> You could be playing games or you could have a good reason.

<Bob> Do I play games?

<Leslie> Not so far! Sorry … no. You do not do that.

<Bob> So what could be my good reason?

<Leslie> Um. You can feel or see something that I cannot. An error?

<Bob> Yes. If I just feel something is not right I cannot do much else but say “That does not feel right”.  If I can see what I is not right I can explain my rationale for resisting.  Can I try to illuminate?

<Leslie> Yes please!

<Bob> OK – have you got a spreadsheet handy?

<Leslie> Yes.

<Bob> OK – create a column of twenty random numbers in the range 20-80 and label them “daily successes”. Next to them create a second column of random numbers in the range 20-100 and label then “daily activity”.

<Leslie> OK – done that.

<Bob> OK – calculate the % yield by day then the average of the column of daily % yield.

<Leslie> OK – that is exactly how I do it.

<Bob> OK – now sum the columns of successes and activities and calculate the average % yield from those two totals.

<Leslie> Yes – I could do that and it will give the same final answer but I do not do that because I cannot use that data on my run chart – for the reasons I said before.

<Bob> Does it give the same answer?

<Leslie> Um – no. Wait. I must have made an error. Let me check. No. I have done it correctly. They are not the same. Uh?

<Bob> What are you feeling?

<Leslie> Confused!  But the evidence is right there in front of me.

<Bob> An assumption you have been making has just been exposed to be invalid. Your rhetoric does not match reality.

<Leslie> But everyone does this … it is standard practice.

<Bob> And that makes it valid?

<Leslie> No .. of course not. That is one of the fundamental principles of Improvement Science. Just doing what everyone else does is not necessarily correct.

<Bob> So now we must understand what is happening. Can you now change the Daily Activity column so it is the same every day – say 60.

<Leslie> OK. Now my method works. The yield answers are the same.

<Bob> Yes.

<Leslie> Why is that?

<Bob> The story goes back to 1948 when Claude Shannon described “Information Theory”.  When you create a ratio you start with two numbers and end up with only one which implies that information is lost in the conversion.  Two numbers can only give one ratio, but that same ratio can be created by an infinite set of two numbers.  The relationship is asymmetric. It is not an equality. And it has nothing to do with the precision of the data. When we throw data away we create ambiguity.

<Leslie> And in my data the activity by day does vary. There is a regular weekly cycle and some random noise. So the way I am calculating the average yield is incorrect, and the message I am sharing is distorted, so others can quite reasonably challenge the data, and because I was 100% confident I was correct I have been assuming that their resistance was just due to cussedness!

<Bob> There may be some cussedness too. It is sometimes difficult to separate skepticism and cynicism.

<Leslie> So what is the lesson here? There must be more to your example than just exposing a basic arithmetic error.

<Bob> The message is that when you feel resistance you must accept the possibility that you are making an error that you cannot see.  The person demonstrating resistance can feel the emotional pain of a rhetoric-reality mismatch but can not explain the cause. You need to strive to see the problem through their eyes. It is OK to say “With respect I do not see it that way because …”.

<Leslie> So feeling “resistance” signals an opportunity for learning?

<Bob> Yes. Always.

<Leslie> So the better response is to pull back and to check assumptions and not to push forward and make the resistance greater or worse still break through the barrier of resistance, celebrate the victory, and then commit an inevitable and avoidable blunder – and then add insult to injury and blame someone else creating even more cynicism on the future.

<Bob> Yes. Well put.

<Leslie> Wow!  And that is why patience and persistence are necessary.  Not persistently pushing but persistently searching for the unconscious assumptions that underpin resistance; consistently using Reality as the arbiter;  and having enough patience to let Reality tell its own story.

<Bob> Yes. And having the patience and persistence to keep learning from our confusion and to keep learning how to explain what we have discovered better and better.

<Leslie> Thanks Bob. Once again you have  opened a new door for me.

<Bob> A door that was always there and yet hidden from view until it was illuminated with an example.

To begin have an end in mind – Steve Peak

My head is a buzzing this morning with poems by John Godfrey Saxe, Theory of Constraints, Six Thinking Hats®, managing transitions and discrete event simulations!

It is not because of the rather lovely bottle of red yesterday evening nor as a result of an episode of the hitchhikers guide to the galaxy but rather my start on the Foundations of Improvement Science in Healthcare course.

The Three Wins book that kicks off the course should be offered to all those folks who are trying to bring about improvements to patients but finding it frustrating and about to consider giving it up. You know who you are and I have been there on a few occasions myself. The book plots the journey of the vascular team at Good Hope Hospital who deliver some fantastic changes to improve the service to patients and in doing so achieve the Three Wins: quality, performance and motivation. John’s story fills your heart with joy!

So it is Saturday morning and sporting events are happening around me. I am delighted to have started my course and have an end in mind. My G-R-O-W outline is done and I have my Niggles that I will convert to NoNos and my NiceIfs that I want to end up as Nuggets. I have played the Post It® Note and Six Dice games and begun ‘learning’ the concepts behind improvement science that I know will complement any people skills I might possess. The human side of change, the key goals of quality and performance are all wrapped up together as we all know well and here it is becoming clearer how these things can and must be pulled off simultaneously.

I am excited about all this and having chatted to a cracking CEO leader yesterday I can see more and more clearly how his goals of deeper engagement and involvement with the hospitals teams, his desire to improvement the patient’s view of the services offered and also sorry to say this but how the money can be made to work harder can be delivered.

I have programmed some further time next week to hit the next stage of the course where the more technical bits get explained and illustrated using the exercises, examples and language that thus far are making this fun.

Next Friday sees the arrival of a friend from Australia who has not been seen in 10 years. The next blog might be interesting!

Steve Peak

Middle-Aware

line_figure_phone_400_wht_9858[Dring Dring]

<Bob> Hi Leslie, how are you today?

<Leslie> Really good thanks. We are making progress and it is really exciting to see tangible and measurable improvement in safety, delivery, quality and financial stability.

<Bob> That is good to hear. So what topic shall we explore today?

<Leslie> I would like to return to the topic of engagement.

<Bob> OK. I am sensing that you have a specific Niggle that you would like to share.

<Leslie> Yes.  Specifically it is engaging the Board.

<Bob> Ah ha. I wondered when we would get to that. Can you describe your Niggle?

<Leslie> Well, the feeling is fear and that follows from the risk of being identified as a trouble-maker which follows from exposing gaps in knowledge and understanding of seniors.

<Bob> Well put.  This is an expected hurdle that all Improvement Scientists have to learn to leap reliably. What is the barrier that you see?

<Leslie> That I do not know how to do it and I have seen a  lot of people try and commit career-suicide – like moths on a flame.

<Bob> OK – so it is a real fear based on real evidence. What methods did the “toasted moths” try?

<Leslie> Some got angry and blasted off angry send-to-all emails.  They just succeeded in identifying themselves as “terrorists” and were dismissed – politically and actually. Others channeled  their passion more effectively by heroic acts that held the system together for a while – and they succeeded in burning themselves out. The end result was the same: toasted!

<Bob> So with your understanding of design principles what does that say?

<Leslie> That the design of their engagement process is wrong.

<Bob> Wrong?

<Leslie> I mean “not fit for purpose”.

<Bob> And the difference is?

<Leslie> “Wrong” is a subjective judgement, “not fit for purpose” is an objective assessment.

<Bob> Yes. We need to be careful with words. So what is the “purpose”?

<Leslie> An organisation that is capable of consistently delivering improvement on all dimensions, safety, delivery, quality and affordability.

<Bob> Which requires?

<Leslie> All the parts working in synergy to a common purpose.

<Bob> So what are the parts?

<Leslie> The departments.

<Bob> They are the stages that the streams cross – they are parts of system structure. I am thinking more broadly.

<Leslie> The workers, the managers and the executives?

<Bob> Yes.  And how is that usually perceived?

<Leslie> As a power hierarchy.

<Bob> And do physical systems have power hierarchies?

<Leslie> No … they have components with different and complementary roles.

<Bob> So does that help?

<Leslie> Yes! To achieve synergy each component has to know its complementary role and be competent to do it.

<Bob> And each must understand the roles of the others,  respect the difference, and develop trust in their competence.

<Leslie> And the concepts of understanding, respect and trust appears again.

<Bob> Indeed.  They are always there in one form or another.

<Leslie> So as learning and improvement is a challenge then engagement is respectful challenge …

<Bob> … uh huh …

<Leslie> … and each part is different so requires a different form of respectful challenge?

<Bob> Yes. And with three parts there are six relationships between them – so six different ways of one part respectfully challenging another. Six different designs that have the same purpose but a different context.

<Leslie> Ah ha!  And if we do not use the context-dependent-fit-for-purpose-respectful-challenge-design we do not achieve our purpose?

<Bob> Correct. The principles of design are generic.

<Leslie> So what are the six designs?

<Bob> Let us explore three of them. First the context of a manager respectfully challenging a worker to improve.

<Leslie> That would require some form of training. Either the manager trains the worker or employs someone else to.

<Bob> Yes – and when might a manager delegate training?

<Leslie> When they do not have time to or do not know how to.

<Bob> Yes. So how would the flaw in that design be avoided?

<Leslie> By the manager maintaining their own know-how by doing enough training themselves and delegating the rest.

<Bob> Yup. Well done. OK let us consider a manager respectfully challenging other managers to improve.

<Leslie> I see what you mean. That is a completely different dynamic. The closest I can think of is a coaching arrangement.

<Bob> Yes. Coaching is quite different from training. It is more of a two-way relationship and I prefer to refer to it as “informal co-coaching” because both respectfully challenge each other in different ways; both share knowledge; and both learn and develop.

<Leslie> And that is what you are doing now?

<Bob> Yes. The only difference is that we have agreed a formal coaching contract. So what about a worker respectfully challenging a manager or a manager respectfully challenging an executive?

<Leslie>That is a very different dynamic. It is not training and it is not coaching.

<Bob> What other options are there?

<Leslie>Not formal coaching!  An executive is not going to ask a middle manager to coach them!

<Bob> You are right on both counts – so what is the essence of informal coaching?

<Leslie> An informal coach provides a different perspective and will say what they see if asked and will ask questions that help to illustrate alternative perspectives and offer evidence of alternative options. This is just well-structured, judgement-free feedback.

<Bob> Yes. We do it all the time. And we are often “coached” by those much younger than ourselves who have a more modern perspective. Our children for instance.

<Leslie> So the judgement free feedback metaphor is the one that a manager can use to engage an executive.

<Bob> Yes. And look at it from the perspective of the executive – they want feedback that can help them made wiser strategic decisions. That is their role. Boards are always asking for customer feedback, staff feedback and performance feedback.  They want to know the Nuggets, the Niggles, the Nice Ifs and the NoNos.  They just do not ask for it like that.

<Leslie> So they are no different from the rest of us?

<Bob> Not in respect of an insatiable appetite for unfiltered and undistorted feedback. What is different is their role. They are responsible for the strategic decisions – the ones that affect us all – so we can help ourselves by helping them make those decisions. A well-designed feedback model is fit-for-that-purpose.

<Leslie> And an Improvement Scientist needs to be able to do all three – training, coaching and communicating in a collaborative informal style. Is that leadership?

<Bob> I call it “middle-aware”.

<Leslie> It makes complete sense to me. There is a lot of new stuff here and I will need to reflect on it. Thank you once again for showing me a different perspective on the problem.

<Bob> I enjoyed it too – talking it through helps me to learn to explain it better – and I look forward to hearing the conclusions from your reflections because I know I will learn from that too.

Closing the Two Loops

Over the past few weeks I have been conducting an Improvement Science Experiment (ISE).  I do that a lot.  This one is a health improvement experiment. I do that a lot too.  Specifically – improving my own health. Ah! Not so diligent with that one.

The domain of health that I am focusing on is weight – for several reasons:
(1) because a stable weight that is within “healthy” limits is a good idea for many reasons and
(2) because weight is very easy to measure objectively and accurately.

But like most people I have constraints: motivation constraints, time constraints and money constraints.  What I need is a weight reduction design that requires no motivation, no time, and no money.  That sounds like a tough design challenge – so some consideration is needed.

Design starts with a specific purpose and a way of monitoring progress.  And I have a purpose – weight within acceptable limits; a method for monitoring progress – a dusty set of digital scales. What I need is a design for delivering the improvement and a method for maintaining it. That is the challenge.

So I need a tested design that will deliver the purpose.  I could invent something here but it is usually quicker to learn from others who have done it, or something very similar.  And there is lots of knowledge and experience out there.  And they fall into two broad schools – Eat Healthier or Exercise More and usually Both.

Eat Healthier is sold as  Eat Less of the Yummy Bad Stuff and more of the Yukky Good Stuff. It sounds like a Puritanical Policy and is not very motivating. So with zero motivation as  a constraint this is a problem.  And Yukky Good Stuff seems to come with a high price tag. So with zero budget as a constraint this is a problem too.

Exercise More is sold as Get off Your Bottom and Go for a Walk. It sounds like a Macho Man Mantra. Not very motivating either. It takes time to build up a “healthy” sweat and I have no desire to expose myself as a health-desperado by jogging around my locality in my moth-eaten track suit.  So with zero time as a constraint this is a problem. Gym subscriptions and the necessary hi-tech designer garb do not come cheap.  So with a zero budget constraint this is another problem.

So far all the conventional wisdom is failing to meet any of my design constraints. On all dimensions.

Oh dear!

The rhetoric is not working.  That packet of Chocolate Hob Nobs is calling to me from the cupboard. And I know I will feel better if I put them out of their misery. Just one will not do any harm. Yum Yum.  Arrrgh!!!  The Guilt. The Guilt.

OK – get a grip – time for Improvement Scientist to step in – we need some Science.

[Improvement Science hat on]

The physics and physiology are easy on this one:

(a) What we eat provides us with energy to do necessary stuff (keep warm, move about, think, etc). Food energy  is measured in “Cals”; work energy is measured in “Ergs”.
(b) If we eat more Cals than we burn as Ergs then the difference is stored for later – ultimately as blubber (=fat).
(c) There are four contributors to or weight: dry (bones and stuff), lean (muscles and glands of various sorts), fluid (blood, wee etc), and blubber (fat).
(d) The sum of the dry, lean, and fluids should be constant – we need them – we do not store energy there.
(e) The fat component varies. It is stored energy. Work-in-progress so to speak.
(f) One kilogram of blubber is equivalent to about 9000 Cals.
(g) An adult of average weight, composition, and activity uses between 2000 and 2500 Cals per day – just to stay at a stable weight.

These facts are all we need to build an energy flow model.

Food Cals = Energy In.
Work Ergs = Energy Out.
Difference between Energy In and Energy Out is converted to-and-from blubber at a rate of 1 gram per 9 Cal.
Some of our weight is the accumulated blubber – the accumulated difference between Cals-In and Ergs-Out

The Laws Of Physics are 100% Absolute and 0% Negotiable. The Behaviours of People are 100% Relative and 100% Negotiable.  Weight loss is more about behaviour. Habits. Lifestyle.

Bit more Science needed now:

Which foods have the Cals?

(1) Fat (9 Cal per gram)
(2) Carbs (4 Cal per gram)
(3) Protein (4 Cal per gram)
(4) Water, Vitamins, Minerals, Fibre, Air, Sunshine, Fags, Motivation (0 Cal per gram).

So how much of each do we get from the stuff we nosh?

It is easy enough to work out – but it is very tedious to do so.  This is how calorie counting weight loss diets work. You weigh everything that goes in, look up the Cal conversions per gram in a big book, do some maths and come up with a number.  That takes lots of time. Then you convert to points and engage in a pseudo-accounting game where you save points up and cash them in as an occasional cream cake.  Time is a constraint and Saving-the-Yummies-for-Later is not changing a habit – it is feeding it!

So it is just easier for me to know what a big bowel of tortilla chips translates to as Cals. Then I can make an informed choice. But I do not know that.

Why not?

Because I never invested time in learning.  Like everyone else I gossip, I guess, and I generalise.  I say “Yummy stuff is bad because it is Hi-Cal; Yukky stuff is good because it is Lo-Cal“.  And from this generalisation I conclude “Cutting Cals feels bad“. Which is a problem because my motivation is already rock bottom.  So I do nothing,  and my weight stays the same, and I still feel bad.

The Get-Thin-Quick industry knows this … so they use Shock Tactics to motivate us.  They scare us with stories of fat young people having heart attacks and dying wracked with regret. Those they leave behind are the real victims. The industry bludgeons us into fearful submission and into coughing up cash for their Get Thin Quick Panaceas.  Their real goal is the repeat work – the loyal customers. And using scare mongering and a few whale-to-waif conversions as rabble-rousing  zealots they cook up the ideal design to achieve that.  They know that, for most of us, as soon as the fear subsides, the will weakens, the chips are down (the neck), the blubber builds, and we are back with our heads hung low and our wallets open.

I have no motivation – that is a constraint.  So flogging an over-weight and under-motivated middle-aged curmudgeon will only get a more over-weight, ego-bruised-and-depressed, middle-aged cynic. I may even seek solace in the Chocolate Hob Nob jar.

Nah! I need a better design.

[Improvement Scientist hat back on]

First Rule of Improvement – Check the Assumptions.

Assumption 1:
Yummy => Hi-Cal => Bad for Health
Yukky => Lo-Cal => Good for Health

It turns out this is a gross over-simplification.  Lots of Yummy things are Lo-Cal; lots of Yukky things are Hi-Cal. Yummy and Yukky are subjective. Cals are not.

OK – that knowledge is really useful because if I know which-is-which then I can made wiser decisions. I can do swaps so that the Yummy Score goes higher and the Cals Score goes lower.  That sounds more like it! My Motiv-o-Meter twitches.

Assumption 2:
Hi-Cal => Cheap => Good for Wealth
Lo-Cal => Expensive => Bad for Wealth

This is a gross over-simplification too. Lots of Expensive things are Hi-Cal; lots of Cheap things are Lo-Cal.

OK so what about the combination?

Bingo!  There are lots of Yummy+Cheap+Lo-Cal things out there !  So my process is to swap the Lose-Lose-Lose for the Win-Win-Win. I feel a motivation surge. The needle on my Motiv-o-Meter definitely moved this time.

But how much? And for how long? And how will I know if it is working?

[Improvement Science hat back on]

Second Rule of Improvement Science – Work from the Purpose

We need an output  specification.  What weight reduction in what time-scale?

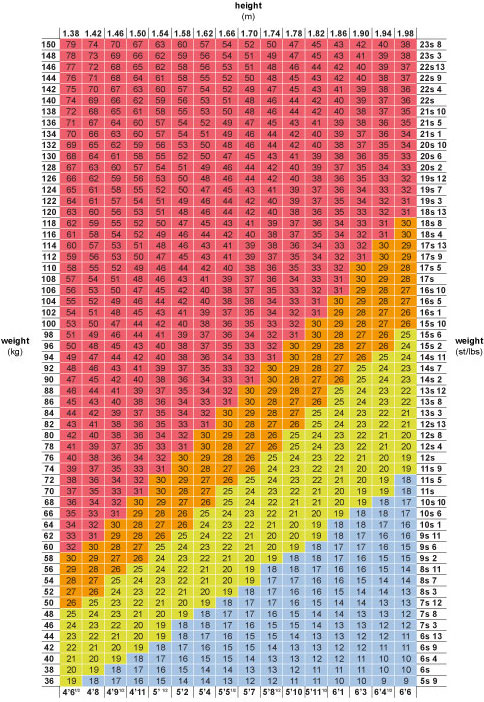
OK – I work out my target weight – using something called the BMI (body mass index) which uses my height and a recommended healthy BMI range to give a target weight range. I plumb for 75 kg – not just “10% reduction” – I need an absolute goal. (PS. The BMI chart I used is at the end of the blog).

OK – I now I need a time-scale – and I know that motivation theory shows that if significant improvement is not seen within 15 repetitions of a behaviour change then it does not stick. It will not become a new habit. I need immediate feedback. I need to see a significant weight reduction within two weeks. I need a quick win to avoid eroding my fragile motivation.  And so long as a get that I will keep going. And how long to get to target weight?  One or two lunar cycles feels about right. Let us compromise on six weeks.

And what is a “significant improvement”?

Ah ha! Now I am on familiar ground – I have a tool for answering that question – a system behaviour chart (SBC).  I need to measure my weight and plot it on a time-series chart using BaseLine.  And I know that I need 9 points to show a significant shift, and I know I must not introduce variation into my measurements. So I do four things – I ensure my scales have high enough precision (+/- 0.1 kg); I do the weighing under standard conditions (same time of day and same state of dress);  I weigh myself every day or every other day; and I plot-the-dots.

OK – how am I doing on my design checklist?
1. Purpose – check
2. Process – check
3. Progress – check

Anything missing?

Yes – I need to measure the energy input – the Cals per day going in – but I need a easy, quick and low-cost way of doing it.

Time for some brainstorming. What about an App? That fancy new smartphone can earn its living for a change. Yup – lots of free ones for tracking Cals.  Choose one. Works OK. Another flick on the Motiv-o-Meter needle.

OK – next bit of the jigsaw. What is my internal process metric (IPM)?  How many fewer Cals per day on average do I need to achieve … quick bit of beer-mat maths … that many kg reduction times Cal per kg of blubber divided by 6 weeks gives  … 1300 Cals per day less than now (on average).  So what is my daily Cals input now?  I dunno. I do not have a baseline.  And I do not fancy measuring it for a couple of weeks to get one. My feeble motivation will not last that long. I need action. I need a quick win.

OK – I need to approach this a different way.  What if I just change the input to more Yummy+Cheap+Lo-Cal stuff and less Yummy+Cheap+Hi-Cal stuff and just measure what happens.  What if I just do what I feel able to? I can measure the input Cals accurately enough and also the output weight. My curiosity is now pricked too and my Inner Nerd starts to take notice and chips in “You can work out the rest from that. It is a simple S&F model” . Thanks Inner Nerd – you do come in handy occasionally. My Motiv-o-Meter is now in the green – enough emotional fuel for a decision and some action.

I have all the bits of the design jigsaw – Purpose, Process, Progress and Pieces.  Studying, and Planning over – time for Doing.

So what happened?

It is an ongoing experiment – but so far it has gone exactly as the design dictated (and the nerdy S&F model predicted).

And the experience has helped me move some Get-Thin-Quick mantras to the rubbish bin.

I have counted nine so far:

Mantra 1. Do not weight yourself every day –  rubbish – weigh yourself every day using a consistent method and plot the dots.
Mantra 2. Focus on the fatrubbish – it is Cals that count whatever the source – fat, carbs, protein (and alcohol).
Mantra 3. Five fresh fruit and veg a dayrubbish – they are just Hi-Cost+Low-Cal stocking fillers.
Mantra 4. Only eat balanced mealsrubbish –  it is OK to increase protein and reduce both carbs and fat.
Mantra 5. It costs money to get healthyrubbish – it is possible to reduce cost by switching to Yummy+Cheap+Lo-Cal stuff.
Mantra 6. Cholesterol is badrubbish – we make more cholesterol than we eat – just stay inside a recommended range.
Mantra 7. Give up all alcohol – rubbish – just be sensible – just stay inside a recommended range.
Mantra 8. Burn the fat with exercise rubbish – this is scraping-the-burnt-toast thinking – less Cals in first.
Mantra 9. Eat less every dayrubbish – it is OK to have Lo-Cal days and OK-Cal days – it is the average Cals that count.

And the thing that has made the biggest difference is the App.  Just being able to quickly look up the Cals in a “Waitrose Potato Croquette” when-ever and where-ever I want to is what I really needed. I have quickly learned what-is-in-what and that helps me make “Do I need that Chocolate Hob-Nob or not?” decisions on the fly. One tiny, insignificant Chocolate Hob-Nob = 95 Cals. Ouch! Maybe not.

I have been surprised by what I have learned. I now know that before I was making lots of unwise decisions based on completely wrong assumptions. Doh!

The other thing that has helped me build motivation is seeing the effect of those wiser design decisions translated into a tangible improvement – and quickly!  With a low-variation and high-precision weight measurement protocol I can actually see the effect of the Cals ingested yesterday on the Weight recorded today.  Our bodies obey the Laws of Physics. We are what we eat.

So what is the lesson to take away?

That there are two feedback loops that need to be included in all Improvement Science challenges – and both loops need to be closed so information flows if the Improvement exercise is to succeed and to sustain.

First the Rhetoric Feedback loop – where new, specific, knowledge replaces old, generic gossip. We want to expose the myths and mantras and reveal novel options.  Challenge assumptions with scientifically valid evidence. If you do not know then look it up.

Second the Reality Feedback loop – where measured outcomes verifies the wisdom of the decision – the intended purpose was achieved.  Measure the input, internal and output metrics and plot all as time-series charts. Seeing is believing.

So the design challenge has been achieved and with no motivation, no time and no budget.

Now where is that packet of Chocolate Hob Nobs. I think I have earned one. Yum yum.

[PS. This is not a new idea – it is called “double loop learning“.  Do not know of it? Worth looking it up?]


bmi_chart