What Is The Cost Of Reality?

It is often assumed that “high quality costs more” and there is certainly ample evidence to support this assertion: dinner in a high quality restaurant commands a high price. The usual justifications for the assumption are (a) quality ingredients and quality skills cost more to provide; and (b) if people want a high quality product or service that is in relatively short supply then it commands a higher price – the Law of Supply and Demand.  Together this creates a self-regulating system – it costs more to produce and so long as enough customers are prepared to pay the higher price the system works.  So what is the problem? The problem is that the model is incorrect. The assumption is incorrect.  Higher quality does not always cost more – it usually costs less. Convinced?  No. Of course not. To be convinced we need hard, rational evidence that disproves our assumption. OK. Here is the evidence.

Suppose we have a simple process that has been designed to deliver the Perfect Service – 100% quality, on time, first time and every time – 100% dependable and 100% predictable. We choose a Service for our example because the product is intangible and we cannot store it in a warehouse – so it must be produced as it is consumed.

To measure the Cost of Quality we first need to work out the minimum price we would need to charge to stay in business – the sum of all our costs divided by the number we produce: our Minimum Viable Price. When we examine our Perfect Service we find that it has three parts – Part 1 is the administrative work: receiving customers; scheduling the work; arranging for the necessary resources to be available; collecting the payment; having meetings; writing reports and so on. The list of expenses seems endless. It is the necessary work of management – but it is not what adds value for the customer. Part 3 is the work that actually adds the value – it is the part the customer wants – the Service that they are prepared to pay for. So what is Part 2 work? This is where our customers wait for their value – the queue. Each of the three parts will consume resources either directly or indirectly – each has a cost – and we want Part 3 to represent most of the cost; Part 2 the least and Part 1 somewhere in between. That feels realistic and reasonable. And in our Perfect Service there is no delay between the arrival of a customer and starting the value work; so there is  no queue; so no work in progress waiting to start, so the cost of Part 2 is zero.  

The second step is to work out the cost of our Perfect Service – and we could use algebra and equations to do that but we won’t because the language of abstract mathematics excludes too many people from the conversation – let us just pick some realistic numbers to play with and see what we discover. Let us assume Part 1 requires a total of 30 mins of work that uses resources which cost £12 per hour; and let us assume Part 3 requires 30 mins of work that uses resources which cost £60 per hour; and let us assume Part 2 uses resources that cost £6 per hour (if we were to need them). We can now work out the Minimum Viable Price for our Perfect Service:

Part 1 work: 30 mins @ £12 per hour = £6
Part 2 work:  = £0
Part 3 work: 30 mins at £60 per hour = £30
Total: £36 per customer.

Our Perfect Service has been designed to deliver at the rate of demand which is one job every 30 mins and this means that the Part 1 and Part 3 resources are working continuously at 100% utilisation. There is no waste, no waiting, and no wobble. This is our Perfect Service and £36 per job is our Minimum Viable Price.         

The third step is to tarnish our Perfect Service to make it more realistic – and then to do whatever is necessary to counter the necessary imperfections so that we still produce 100% quality. To the outside world the quality of the service has not changed but it is no longer perfect – they need to wait a bit longer, and they may need to pay a bit more. Quality costs remember!  The question is – how much longer and how much more? If we can work that out and compare it with our Minimim Viable Price we will get a measure of the Cost of Reality.

We know that variation is always present in real systems – so let the first Dose of Reality be the variation in the time it takes to do the value work. What effect does this have?  This apparently simple question is surprisingly difficult to answer in our heads – and we have chosen not to use “scarymatics” so let us run an empirical experiment and see what happens. We could do that with the real system, or we could do it on a model of the system.  As our Perfect Service is so simple we can use a model. There are lots of ways to do this simulation and the technique used in this example is called discrete event simulation (DES)  and I used a process simulation tool called CPS (www.SAASoft.com).

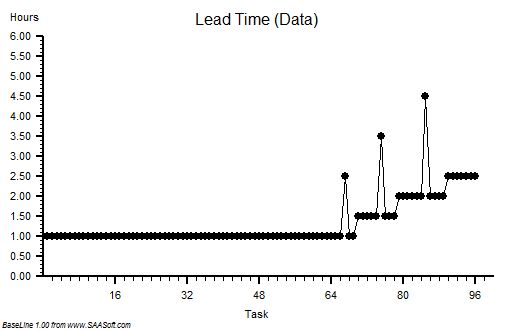
Let us see what happens when we add some random variation to the time it takes to do the Part 3 value work – the flow will not change, the average time will not change, we will just add some random noise – but not too much – something realistic like 10% say.

The chart shows the time from start to finish for each customer and to see the impact of adding the variation the first 48 customers are served by our Perfect Service and then we switch to the Realistic Service. See what happens – the time in the process increases then sort of stabilises. This means we must have created a queue (i.e. Part 2 work) and that will require space to store and capacity to clear. When we get the costs in we work out our new minimum viable price it comes out, in this case, to be £43.42 per task. That is an increase of over 20% and it gives us a measure of the Cost of the Variation. If we repeat the exercise many times we get a similar answer, not the same every time because the variation is random, but it is always an extra cost. It is never less that the perfect proce and it does not average out to zero. This may sound counter-intuitive until we understand the reason: when we add variation we need a bit of a queue to ensure there is always work for Part 3 to do; and that queue will form spontaneously when customers take longer than average. If there is no queue and a customer requires less than average time then the Part 3 resource will be idle for some of the time. That idle time cannot be stored and used later: time is not money.  So what happens is that a queue forms spontaneously, so long as there is space for it,  and it ensures there is always just enough work waiting to be done. It is a self-regulating system – the queue is called a buffer.

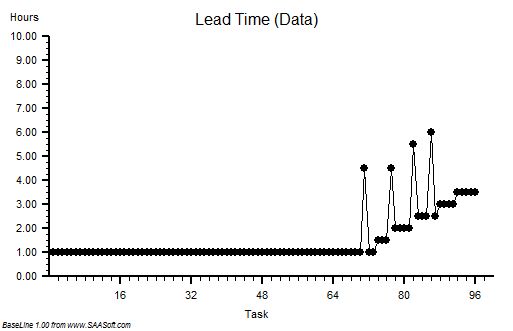
Let us see what happens when we take our Perfect Process and add a different form of variation – random errors. To prevent the error leaving the system and affecting our output quality we will repeat the work. If the errors are random and rare then the chance of getting it wrong twice for the same customer will be small so the rework will be a rough measure of the internal process quality. For a fair comparison let us use the same degree of variation as before – 10% of the Part 3 have an error and need to be reworked – which in our example means work going to the back of the queue.

Again, to see the effect of the change, the first 48 tasks are from the Perfect System and after that we introduce a 10% chance of a task failing the quality standard and needing to be reworked: in this example 5 tasks failed, which is the expected rate. The effect on the start to finish time is very different from before – the time for the reworked tasks are clearly longer as we would expect, but the time for the other tasks gets longer too. It implies that a Part 2 queue is building up and after each error we can see that the queue grows – and after a delay.  This is counter-intuitive. Why is this happening? It is because in our Perfect Service we had 100% utiliation – there was just enough capacity to do the work when it was done right-first-time, so if we make errors and we create extra demand and extra load, it will exceed our capacity; we have created a bottleneck and the queue will form and it will cointinue to grow as long as errors are made.  This queue needs space to store and capacity to clear. How much though? Well, in this example, when we add up all these extra costs we get a new minimum price of £62.81 – that is a massive 74% increase!  Wow! It looks like errors create much bigger problem for us than variation. There is another important learning point – random cycle-time variation is self-regulating and inherently stable; random errors are not self-regulating and they create inherently unstable processes.

Our empirical experiment has demonstrated three principles of process design for minimising the Cost of Reality:

1. Eliminate sources of errors by designing error-proofed right-first-time processes that prevent errors happening.
2. Ensure there is enough spare capacity at every stage to allow recovery from the inevitable random errors.
3. Ensure that all the steps can flow uninterrupted by allowing enough buffer space for the critical steps.

With these Three Principles of cost-effective design in mind we can now predict what will happen if we combine a not-for-profit process, with a rising demand, with a rising expectation, with a falling budget, and with an inspect-and-rework process design: we predict everyone will be unhappy. We will all be miserable because the only way to stay in budget is to cut the lower priority value work and reinvest the savings in the rising cost of checking and rework for the higher priority jobs. But we have a  problem – our activity will fall, so our revenue will fall, and despite the cost cutting the budget still doesn’t balance because of the increasing cost of inspection and rework – and we enter the death spiral of finanical decline.

The only way to avoid this fatal financial tailspin is to replace the inspection-and-rework habit with a right-first-time design; before it is too late. And to do that we need to learn how to design and deliver right-first-time processes.

Charts created using BaseLine

The Crime of Metric Abuse

We live in a world that is increasingly intolerant of errors – we want everything to be right all the time – and if it is not then someone must have erred with deliberate intent so they need to be named, blamed and shamed! We set safety standards and tough targets; we measure and check; and we expose and correct anyone who is non-conformant. We accept that is the price we must pay for a Perfect World … Yes? Unfortunately the answer is No. We are deluded. We are all habitual criminals. We are all guilty of committing a crime against humanity – the Crime of Metric Abuse. And we are blissfully ignorant of it so it comes as a big shock when we learn the reality of our unconscious complicity.

You might want to sit down for the next bit.

First we need to set the scene:
1. Sustained improvement requires actions that result in irreversible and beneficial changes to the structure and function of the system.
2. These actions require making wise decisions – effective decisions.
3. These actions require using resources well – efficient processes.
4. Making wise decisions requires that we use our system metrics correctly.
5. Understanding what correct use is means recognising incorrect use – abuse awareness.

When we commit the Crime of Metric Abuse, even unconsciously, we make poor decisions. If we act on those decisions we get an outcome that we do not intend and do not want – we make an error.  Unfortunately, more efficiency does not compensate for less effectiveness – if fact it makes it worse. Efficiency amplifies Effectiveness – “Doing the wrong thing right makes it wronger not righter” as Russell Ackoff succinctly puts it.  Paradoxically our inefficient and bureaucratic systems may be our only defence against our ineffective and potentially dangerous decision making – so before we strip out the bureaucracy and strive for efficiency we had better be sure we are making effective decisions and that means exposing and treating our nasty habit for Metric Abuse.

Metric Abuse manifests in many forms – and there are two that when combined create a particularly virulent addiction – Abuse of Ratios and Abuse of Targets. First let us talk about the Abuse of Ratios.

A ratio is one number divided by another – which sounds innocent enough – and ratios are very useful so what is the danger? The danger is that by combining two numbers to create one we throw away some information. This is not a good idea when making the best possible decision means squeezing every last drop of understanding our of our information. To unconsciously throw away useful information amounts to incompetence; to consciously throw away useful information is negligence because we could and should know better.

Here is a time-series chart of a process metric presented as a ratio. This is productivity – the ratio of an output to an input – and it shows that our productivity is stable over time.  We started OK and we finished OK and we congratulate ourselves for our good management – yes? Well, maybe and maybe not.  Suppose we are measuring the Quality of the output and the Cost of the input; then calculating our Value-For-Money productivity from the ratio; and then only share this derived metric. What if quality and cost are changing over time in the same direction and by the same rate? The productivity ratio will not change.


Suppose the raw data we used to calculate our ratio was as shown in the two charts of measured Ouput Quality and measured Input Cost  – we can see immediately that, although our ratio is telling us everything is stable, our system is actually changing over time – it is unstable and therefore it is unpredictable. Systems that are unstable have a nasty habit of finding barriers to further change and when they do they have a habit of crashing, suddenly, unpredictably and spectacularly. If you take your eyes of the white line when driving and drift off course you may suddenly discover a barrier – the crash barrier for example, or worse still an on-coming vehicle! The apparent stability indicated by a ratio is an illusion or rather a delusion. We delude ourselves that we are OK – in reality we may be on a collision course with catastrophe. 

But increasing quality is what we want surely? Yes – it is what we want – but at what cost? If we use the strategy of quality-by-inspection and add extra checking to detect errors and extra capacity to fix the errors we find then we will incur higher costs. This is the story that these Quality and Cost charts are showing.  To stay in business the extra cost must be passed on to our customers in the price we charge: and we have all been brainwashed from birth to expect to pay more for better quality. But what happens when the rising price hits our customers finanical constraint?  We are no longer able to afford the better quality so we settle for the lower quality but affordable alternative.  What happens then to the company that has invested in quality by inspection? It loses customers which means it loses revenue which is bad for its financial health – and to survive it starts cutting prices, cutting corners, cutting costs, cutting staff and eventually – cutting its own throat! The delusional productivity ratio has hidden the real problem until a sudden and unpredictable drop in revenue and profit provides a reality check – by which time it is too late. Of course if all our competitors are committing the same crime of metric abuse and suffering from the same delusion we may survive a bit longer in the toxic mediocrity swamp – but if a new competitor who is not deluded by ratios and who learns how to provide consistently higher quality at a consistently lower price – then we are in big trouble: our customers leave and our end is swift and without mercy. Competition cannot bring controlled improvement while the Abuse of Ratios remains rife and unchallenged.

Now let us talk about the second Metric Abuse, the Abuse of Targets.

The blue line on the Productivity chart is the Target Productivity. As leaders and managers we have bee brainwashed with the mantra that “you get what you measure” and with this belief we commit the crime of Target Abuse when we set an arbitrary target and use it to decide when to reward and when to punish. We compound our second crime when we connect our arbitrary target to our accounting clock and post periodic praise when we are above target and periodic pain when we are below. We magnify the crime if we have a quality-by-inspection strategy because we create an internal quality-cost tradeoff that generates conflict between our governance goal and our finance goal: the result is a festering and acrimonious stalemate. Our quality-by-inspection strategy paradoxically prevents improvement in productivity and we learn to accept the inevitable oscillation between good and bad and eventually may even convince ourselves that this is the best and the only way.  With this life-limiting-belief deeply embedded in our collective unconsciousness, the more enthusiastically this quality-by-inspection design is enforced the more fear, frustration and failures it generates – until trust is eroded to the point that when the system hits a problem – morale collapses, errors increase, checks are overwhelmed, rework capacity is swamped, quality slumps and costs escalate. Productivity nose-dives and both customers and staff jump into the lifeboats to avoid going down with the ship!  

The use of delusional ratios and arbitrary targets (DRATs) is a dangerous and addictive behaviour and should be made a criminal offense punishable by Law because it is both destructive and unnecessary.

With painful awareness of the problem a path to a solution starts to form:

1. Share the numerator, the denominator and the ratio data as time series charts.
2. Only put requirement specifications on the numerator and denominator charts.
3. Outlaw quality-by-inspection and replace with quality-by-design-and-improvement.  

Metric Abuse is a Crime. DRATs are a dangerous addiction. DRATs kill Motivation. DRATs Kill Organisations.

Charts created using BaseLine

The One-Eyed Man in the Land of the Blind.

“There are known knowns; there are things we know we know.
We also know there are known unknowns; that is to say we know there are some things we do not know.
But there are also unknown unknowns – the ones we don’t know we don’t know.” Donald Rumsfeld 2002

This infamous quotation is a humorously clumsy way of expressing a profound concept. This statement is about our collective ignorance – and it hides a beguiling assumption which is that we are all so similar that we just have to accept the things that we all do not know. It is OK to be collectively and blissfully ignorant. But is this OK? Is this not the self-justifying mantra of those who live in the Land of the Blind?

Our collective blissful ignorance holds the promise of great unknown gains; and harbours the potential of great untold pain.

Our collective knowledge is vast and is growing because we have dissolved many Unknowns.  For each there must have been a point in time when the first person become painfully aware of their ignorance and, by some means, discovered some new knowledge. When that happened they had a number of options – to keep it to themselves, to share it with those they knew, or to share it with strangers. The innovators dilemma is that when they share new knowledge they know they will cause emotional pain; because to share knowledge with the blissfully ignorant implies pushing them to the state of painful awareness.

We are social animals and we demonstrate empathy and respect for others, so we do not want to deliberately cause them emotional pain – even the short term pain of awareness that must preceed the long term gain of knowledge, understanding and wisdom. It is the constant challenge that every parent, every teacher, every coach, every mentor, every leader and every healer has to learn to master.

So, how do we deal with the situation when we are painfully aware that others are in the state of blissful ignorance – of not knowing what they do not know – and we know that making them aware will be emotionally painful for them – just as it was for us? We know from experience that that an insensitive, clumsy, blunt, brutal, just-tell-it-as-it is approach can cause pain-but-no-gain; we have all had experience of others who seem to gain a perverse pleasure from the emotional impact they generate by triggering painful awareness. The disrespectful “means-justifies-the-ends” and “cruel-to-be-kind” mindset is the mantra of those who do not walk their own talk – those who do not challenge their own blissful ignorance – those who do not seek to gain an understanding of how to foster effective learning without inflicting emotional pain.

The no-pain-no-gain life limiting belief is an excuse – not a barrier. It is possible to learn without pain – we have all been doing it for our whole lives; each of us can think of people who inspired us to learn and to have fun doing so – rare and memorable role models, bright stars in the darkness of disappointment. Our challenge is to learn how to inspire ourselves.

The first step is to create an emotionally Safe Environment for Learning and Fun (SELF). For the leader/teacher/healer this requires developing an ability to build a culture of trust by actively unlearning their own trust-corroding-behaviours.  

The second step is to know what we know – to be sure of our facts and confident that we can explain and support what we know with evidence and insight. To deliberately push someone into painful awareness with no means to guide them out of that dark place is disrespectful and untrustworthy behaviour. Learning how to teach what we know is the most effective means to discover our own depth of understanding and it is an energising exercise in humility development! 

The third step is for us to have the courage to raise awareness in a sensitive and respectful way – sometimes this is done by demonstrating the knowledge; sometimes this is done by asking carefully framed questions; and sometimes it is done as a respectful challenge.  The three approaches are not mutually exclusive: leading-by-example is effective but leaders need to be teachers and healers too.  

At all stages the challenge for the leader/teacher/healer is to to ensure they maintain an OK-OK mental model of those they influence. This is the most difficult skill to attain and is the most important. The “Leadership and Self-Deception” book that is in the Library of Improvement Science is a parable that decribes this challenge.

So, how do we dissolve the One-Eyed Man in the Land of the Blind problem? How do we raise awareness of a collective blissful ignorance? How do we share something that is going to cause untold pain and misery in the future – a storm that is building over the horizon of awareness.

Ignaz Semmelweis (1818-1865) was the young Hungarian doctor who in 1847 discovered the dramatic live-saving benefit of the doctors cleaning their hands before entering the obstetric ward of the Vienna Hospital. This was before “germs” had been discovered and Semmelweis could not explain how his discovery worked – all he could do was to exhort others to do as he did. He did not learn how the method worked, he did not publish his data, and he demonstrated trust-eroding behaviour when he accused others of “murder” when they did not do as he told them.  The fact the he was correct did not justify the means by which he challenged their collective blissful ignorance (see http://www.valuesystemdesign.com for a fuller account).  The book that he eventually published in 1861 includes the data that supports our modern understanding of the importance of hand hygiene – but it also includes a passionate diatribe of how he had been wronged by others – a dramatic example of the “I’m OK and The Rest of the World is Not OK” worldview. Semmelweis was committed to a lunatic asylum and died there in 1865.   

W Edwards Deming (1900-1993) was the American engineer, mathematician, mathematical physicist, statistician and student of Walter A. Shewhart who learned the importance of quality in design. After WWII he was part of the team who helped to rebuild the Japanese economy and he taught the Japanese what he had learned and practiced during WWII – which was how to create a high-quality, high-speed, high-efficiency process which, ironically, was building ships for the war effort. Later Deming attempted, and failed, to influence the post-war generation of managers that were being churned out by the new business schools to serve the growing global demand for American mass produced consumer goods. Deming returned to relative obscurity in the USA until 1980 when his teachings were rediscovered when Japan started to challenge the USA economically by producing higher-quality-and-lower-cost consumer products such as cars and electronics ( http://en.wikipedia.org/wiki/W._Edwards_Deming). Before he died in 1993 Deming wrote two books – Out of The Crisis and The New Economics in which he outlines his learning and his philosophy and in which he unreservedly and passionately blames the managers and the business schools that trained them for their arrogant attitude and disrespectful behaviour. Like Semmelweis, the fact that his books contain a deep well of wisdom does not justify the means by which he disseminated his criticism of poeple – in particular of senior management. By doing so he probably created resistance and delayed the spread of knowledge.  

History is repeating itself: the same story is being played out in the global healthcare system. Neither senior doctors nor senior managers are aware of the opportunity that the learning of Semmelweis and Deming represent – the opportunity of Improvement Science and of the theory, techniques and tools of Operations Management. The global healthcare system is in a state of collective blissful ignorance.  Our descendents be the recipients of of decisions and the judges of our behaviour – and time is running out – we do not have the luxury of learning by making the same mistake.

Fortunately, there is an growing group of people who are painfully aware of the problem and are voicing their concerns – such as the Institute of Healthcare Improvement  in America. There is a smaller and less well organised network of people who have acquired and applied some of the knowledge and are able to demonstrate how it works – the Know Hows. There appears to be an even smaller group who understand and use the principles but do it intuitively and unconsciously – they dem0nstrate what is possible but find it difficult to teach others how to do what they do. It is the Know How group that is the key to dissolving the problem.

The first collective challenge is to sign-post some safe paths from Collective Blissful Ignorance to Individual Know How. The second collective challenge is to learn an effective and respectful way to raise awareness of the problem – a way to outline the current reality and the future opportunity – and a way that illuminates the paths that link the two.

In the land of the blind the one-eyed man is the person who discovers that everyone is wearing a head-torch by accidentally finding his own and switching it on!


Where is the Rotten Egg?

Have you ever had the experience of arriving home from a holiday – opening the front door and being hit with the rancid smell of something that has gone rotten while you were away.

Phwooorrrarghhh!

When that happens we open the windows to let the fresh-air blow the smelly pong out and we go in search of the offending source of the horrible whiff. Somewhere we know we will find the “rotten egg” and we know we need to remove it because it is now beyond repair.

What happened here is that our usual, regular habit of keeping our house clean was interrupted and that allowed time for something to go rotten and to create a nasty stink. It may also have caused other things to go rotten too – decay  spreads. Usually we maintain an olfactory vigilance to pick up the first whiff of a problem and we act before the rot sets in – but this only works if we know what fresh air smells like, if we remove the peg from our nose, and if we have the courage to remove all of the rot. Permfuing the pig is not an effective long term strategy.

The rotten egg metaphor applies to organisations. The smell we are on the alert for is the rancid odour of a sour relationship, the signal we sense is the dissonance of misery, and the behaviours we look for are those that erode trust. These behaviours have a name – they are called discounts – and they come in two types.

Type 1 discounts are our deliberate actions that lead to erosion of trust – actions like interrupting, gossiping, blaming, manipulation, disrespect, intimidation, and bullying.

Type 2 discounts are the actions that we deliberately omit to do that also cause erosion of trust – like not asking for and not offering feedback, like not sharing data, information and knowledge, like not asking for help, like not saying thank you, like not challenging assumptions, like not speaking out when we feel things are not right, like not getting the elephant out in the room. These two types of discounts are endemic in all organisations and the Type 2 discounts are the more difficult to see because it was what we didn’t do that led to the rot. We must all maintain constant vigilance to sniff out the first whiff of misery and to act immediately and effectively to sustain a pong-free organisational atmosphere.