See-and-Share

stick_figure_liking_it_150_wht_9170Common-sense tells us that to achieve system-wide improvement we need to grasp the “culture nettle”.

Most of us believe that culture drives attitudes; and attitudes drive behaviour; and behaviour drives improvement.

Therefore to get improvement we must start with culture.

And that requires effective leadership.

So our unspoken assumptions about how leaders motivate our behaviour seem rather important to understand.

In 1960 a book was published with the  title “The Human Side of Enterprise” which went right to the heart of this issue.   The author was Doug McGregor who was a social scientist and his explanation of why improvement appears to be so difficult in large organisations was a paradigm shift in thinking.  His book inspired many leaders to try a different approach – and they discovered that it worked and that enterprise-wide transformation followed.  The organisations that these early-adopters led evolved into commercial successes and more enjoyable places to work.

The new leaders learned to create the context for change – not to dictate the content.

Since then social scientists have disproved many other ‘common sense’ beliefs by applying a rigorous scientific approach and using robust evidence.

They have busted the culture-drives-change myth …. the evidence shows that it is the other way around … change drives culture.

And what changes first is behaviour.

We are social  animals …. most of us are much more likely to change our behaviour if we see other people doing the same.  We do not like being too different.

As we speak there is a new behaviour spreading – having a bucket of cold water tipped over your head as part of a challenge to raise money for charity.

This craze has a positive purpose … feeling good about helping others through donating money to a worthwhile cause … but most of us need a nudge to get us to do it.

Seeing well-known public figures having iced-water dumped on them on a picture or video shared through multiple, parallel, social media channels is a powerful cultural signal that says “This new behaviour is OK”.

Exhortation and threats are largely ineffective – fear will move people – it will scatter them, not align them. Shaming-and-blaming into behaving differently is largely ineffective too – it generates short-term anger and long-term resentment.

This is what Doug McGregor highlighted over half a century ago … and his message is timeless.

“.. the research evidence indicates quite clearly that skillful and sensitive membership behaviour is the real clue to effective group operation“.

Appreciating this critical piece of evidence opens a new door to system-wide improvement … one that we can all walk through:  Sharing improvement stories.

Sharing stories of actions that others have done and the benefits they achieved as a result; and also sharing stories of things that we ourselves have done and achieved.

Stories of small changes that delivered big benefits for others and for ourselves.  Win-win-wins. Stories of things that took little time and little effort to do because they fell inside our circles of control.

See-and-Share is an example of skillful and sensitive membership behaviour.

Effective leaders are necessary … yes … they are needed to create the context for change. It is we members who create and share the content.

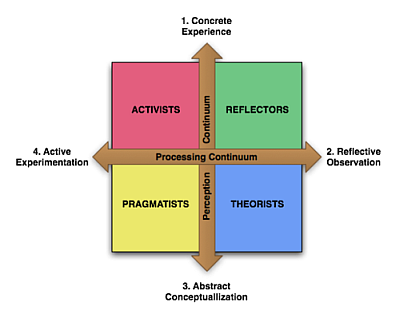
Learning in Style

PARTImprovement implies learning – new experiences, new insights, new models and new ways of doing things.

So understanding the process of learning is core to the science of improvement.

What many people do not fully appreciate is that we differ in the way we prefer to learn.  These are habitual behaviours that we have acquired.

The diagram shows one model – the Honey and Mumford model that evolved from an earlier model described by Kolb.

One interesting feature of this diagram is the two dimensions – Perception and Processing which are essentially the same as the two core dimensions in the Myers-Briggs Type Index.

What the diagram above does not show so well is that the process of learning is a cycle – the clockwise direction in this diagram – Pragmatist then Activist then Reflector then Theorist and back to Pragmatist.

This is the PART sequence.  And it can start at any point … ARTP, RTPA, TPAR.

We all use all of these learning styles – but we have a preference for some more than others – our preferred learning styles are our learning comfort zones.

The large observational studies conducted in the 1980’s using the PART model revealed that most people have moderate to strong preferences for only one or two of these styles. Less than 20% have a preference for three and very few feel equally comfortable with all four.

The commonest patterns are illustrated by the left and right sides of the diagram: the Pragmatist-Activist combination and the Reflector-Theorist combination.

It is not that one is better than the other … all four are synergistic and an effective and efficient learning process requires being comfortable with using all four in a continuous sequence.

Imagine this as a wheel – an imbalance between the four parts represents a distorted wheel. So when this learning wheel ‘turns’  it delivers an emotionally bumpy ‘ride’.  Past experience of being pushed through this pain-and-gain process will tend to inhibit or even block learning completely.

So to get a more comfortable learning journey we first need to balance our PART wheel – and that implies knowing what our preferred styles are and then developing the learning styles that we use least to build our competence and confidence with them.  And that is possible because these are learned habits. With guidance, focus and practice we can all strengthen our less favoured learning ‘muscles’.

Those with a preference for planning-and-doing would focus on developing their reflection and then their abstraction skills. For example by monitoring the effects of their actions in reality and using that evidence to challenge their underlying assumptions and to generate new ‘theories’ for pragmatic experimentation. Actively seeking balanced feedback and reflecting on it is one way to do that.

Those with a preference for studying-and-abstracting would focus on developing their design and then their delivery skills and become more comfortable with experimenting to test their rhetoric against reality. Actively seeking opportunities to learn-by-doing is one way.

And by creating the context for individuals to become more productive self-learners we can see how learning organisations will follow naturally. And that is what we need to deliver system-wide improvement at scale and pace.

The 85% Optimum Occupancy Myth

egg_face_spooked_400_wht_13421There seems to be a belief among some people that the “optimum” average bed occupancy for a hospital is around 85%.

More than that risks running out of beds and admissions being blocked, 4 hour breaches appearing and patients being put at risk. Less than that is inefficient use of expensive resources. They claim there is a ‘magic sweet spot’ that we should aim for.

Unfortunately, this 85% optimum occupancy belief is a myth.

So, first we need to dispel it, then we need to understand where it came from, and then we are ready to learn how to actually prevent queues, delays, disappointment, avoidable harm and financial non-viability.


Disproving this myth is surprisingly easy.   A simple thought experiment is enough.

Suppose we have a policy where  we keep patients in hospital until someone needs their bed, then we discharge the patient with the longest length of stay and admit the new one into the still warm bed – like a baton pass.  There would be no patients turned away – 0% breaches.  And all our the beds would always be full – 100% occupancy. Perfection!

And it does not matter if the number of admissions arriving per day is varying – as it will.

And it does not matter if the length of stay is varying from patient to patient – as it will.

We have disproved the hypothesis that a maximum 85% average occupancy is required to achieve 0% breaches.


The source of this specific myth appears to be a paper published in the British Medical Journal in 1999 called “Dynamics of bed use in accommodating emergency admissions: stochastic simulation model

So it appears that this myth was cooked up by academic health economists using a computer model.

And then amateur queue theory zealots jump on the band-wagon to defend this meaningless mantra and create a smoke-screen by bamboozling the mathematical muggles with tales of Poisson processes and Erlang equations.

And they are sort-of correct … the theoretical behaviour of the “ideal” stochastic demand process was described by Poisson and the equations that describe the theoretical behaviour were described by Agner Krarup Erlang.  Over 100 years ago before we had computers.

BUT …

The academics and amateurs conveniently omit one minor, but annoying,  fact … that real world systems have people in them … and people are irrational … and people cook up policies that ride roughshod over the mathematics, the statistics and the simplistic, stochastic mathematical and computer models.

And when creative people start meddling then just about anything can happen!


So what went wrong here?

One problem is that the academic hefalumps unwittingly stumbled into a whole minefield of pragmatic process design traps.

Here are just some of them …

1. Occupancy is a ratio – it is a meaningless number without its context – the flow parameters.

2. Using linear, stochastic models is dangerous – they ignore the non-linear complex system behaviours (chaos to you and me).

3. Occupancy relates to space-capacity and says nothing about the flow-capacity or the space-capacity and flow-capacity scheduling.

4. Space-capacity utilisation (i.e. occupancy) and systemic operational efficiency are not equivalent.

5. Queue theory is a simplification of reality that is needed to make the mathematics manageable.

6. Ignoring the fact that our real systems are both complex and adaptive implies that blind application of basic queue theory rhetoric is dangerous.

And if we recognise and avoid these traps and we re-examine the problem a little more pragmatically then we discover something very  useful:

That the maximum space capacity requirement (the number of beds needed to avoid breaches) is actually easily predictable.

It does not need a black-magic-box full of scary queue theory equations or rather complicated stochastic simulation models to do this … all we need is our tried-and-trusted tool … a spreadsheet.

And we need something else … some flow science training and some simulation model design discipline.

When we do that we discover something else …. that the expected average occupancy is not 85%  … or 65%, or 99%, or 95%.

There is no one-size-fits-all optimum occupancy number.

And as we explore further we discover that:

The expected average occupancy is context dependent.

And when we remember that our real system is adaptive, and it is staffed with well-intended, well-educated, creative people (who may have become rather addicted to reactive fire-fighting),  then we begin to see why the behaviour of real systems seems to defy the predictions of the 85% optimum occupancy myth:

Our hospitals seem to work better-than-predicted at much higher occupancy rates.

And then we realise that we might actually be able to design proactive policies that are better able to manage unpredictable variation; better than the simplistic maximum 85% average occupancy mantra.

And finally another penny drops … average occupancy is an output of the system …. not an input. It is an effect.

And so is average length of stay.

Which implies that setting these output effects as causal inputs to our bed model creates a meaningless, self-fulfilling, self-justifying delusion.

Ooops!


Now our challenge is clear … we need to learn proactive and adaptive flow policy design … and using that understanding we have the potential to deliver zero delays and high productivity at the same time.

And doing that requires a bit more than a spreadsheet … but it is possible.

Purpose-Process-Pilot-Policy-Police

inspector_searching_around_150_wht_14757When it comes to light that things are not going well a common reaction from the top is to send in more inspectors.

This may give the impression that something decisive is being done but it almost never works … for two reasons.

The first is because it is attempting to treat the symptom and not the cause.

The second is because the inspectors are created in the same paradigm that that created the problem.

That is not so say that inspectors are not required … they are … when the system is working … not when it is failing.

The inspection police actually come last – and just before them comes the Policy that the Police enforce.

Policy comes next to last. Not first.

A rational Policy can only be written once there is proof of  effectiveness … and that requires a Pilot study … in the real world.

A small scale reality check of the rhetoric.

Cooking up Policy and delivery plans based on untested rhetoric from the current paradigm is a recipe for disappointment.


Working backwards we can see that the Pilot needs something to pilot … and that is a new Process; to replace the old process that is failing to deliver.

And any Process needs to be designed to be fit-for-purpose.  Cutting-and-pasting someone else’s design usually does not work. The design process is more important than the design it creates.

So thus brings us to the first essential requirement … the Purpose.

And that is where we very often find a big gap … an error of omission … no clarity or constancy of common Purpose.

And that is where leaders must start. It is their job to clarify and communicate the common Purpose. And if the leaders are not cohesive and the board cannot agree the Purpose then the political cracks will spread through the whole organisation and destabilize it.

And with a Purpose the system and process designers can get to work.

But here we hit another gap. There is virtually no design capability in most organisations.

There is usually lots of delivery capability … but efficiently delivering an ineffective design will amplify the chaos not dissolve it.

So in parallel with clarifying the purpose, the leaders must  endorse the creation of a cohort of process designers.

And from the organisation a cohort of process inspectors … but of a different calibre … inspectors who are able to find the root causes and able to guide the improvement process because they have done this themselves many times before.

And perhaps to draw a line between the future and the past we could give them a different name – Mentors.

Big Data

database_transferring_data_150_wht_10400The Digital Age is changing the context of everything that we do – and that includes how we use information for improvement.

Historically we have used relatively small, but carefully collected, samples of data and we subjected these to rigorous statistical analysis. Or rather the statisticians did.  Statistics is a dark and mysterious art to most people.

As the digital age ramped up in the 1980’s the data storage, data transmission and data processing power became cheap and plentiful.  The World Wide Web appeared; desktop computers with graphical user interfaces appeared; data warehouses appeared, and very quickly we were all drowning in the data ocean.

Our natural reaction was to centralise but it became quickly obvious that even an army of analysts and statisticians could not keep up.

So our next step was to automate and Business Intelligence was born; along with its beguiling puppy-faced friend, the Performance Dashboard.

The ocean of data could now be boiled down into a dazzling collection of animated histograms, pie-charts, trend-lines, dials and winking indicators. We could slice-and-dice,  we could zoom in-and-out, and we could drill up-and-down until our brains ached.

And none of it has helped very much in making wiser decisions that lead to effective actions that lead to improved outcomes.

Why?

The reason is that the missing link was not a lack of data processing power … it was a lack of an effective data processing paradigm.

The BI systems are rooted in the closed, linear, static, descriptive statistics of the past … trend lines, associations, correlations, p-values and so on.

Real systems are open, non-linear and dynamic; they are eternally co-evolving. Nothing stays still.

And it is real systems that we live in … so we need a new data processing paradigm that suits our current reality.

Some are starting to call this the Big Data Era and it is very different.

  • Business Intelligence uses descriptive statistics and data with high information density to measure things, detect trends etc.;
  • Big Data uses inductive statistics and concepts from non-linear system identification to infer laws (regressions, non-linear relationships, and causal effects) from large data sets to reveal relationships, dependencies and perform predictions of outcomes and behaviours.

And each of us already has a powerful Big Data processor … the 1.3 kg of caveman wet-ware sitting between our ears.

Our brain processes billions of bits of data every second and looks for spatio-temporal relationships to identify patterns, to derive models, to create action options, to predict short-term outcomes and to make wise survival decisions.

The problem is that our Brainy Big Data Processor is easily tricked when we start looking at time-dependent systems … data from multiple simultaneous flows that are interacting dynamically with each other.

It did not evolve to do that … it evolved to help us to survive in the Wild – as individuals.

And it has been very successful … as the burgeoning human population illustrates.

But now we have a new collective survival challenge  and we need new tools … and the out-of-date Business Intelligence Performance Dashboard is just not going to cut the mustard!

Big Data on TED Talks