Building a Big Picture from the Small Bits

We are all a small piece of a complex system that extends well beyond the boundaries of our individual experience.

We all know this.

We also know that seeing the big picture is very helpful because it gives us context, meaning and leads to better decisions more effective actions.

We feel better when we know where we fit into the Big Picture – and we feel miserable when we do not.

And when our system is not working as well as we would like then we need to improve it; and to do that we need to understand how it works so that we only change what we need to.

To do that we need to see the Big Picture and to understand it.


So how do we build the Big Picture from the Small Bits?

Solving a jigsaw puzzle is a good metaphor for the collective challenge we face. Each of us holds a piece which we know very well because it is what we see, hear, touch, smell and taste every day. But how do we assemble the pieces so that we can all clearly see and appreciate the whole rather than dimly perceive a dysfunctional heap of bits?

One strategy is to look for tell-tale features that indicate where a piece might fit – irrespective of the unique picture on it. Such as the four corners.

We also use this method to group pieces that belong on the sides – but this is not enough  to tell us which side and where on which side each piece fits.

So far all we have are some groups of bits – rough parts of the whole – but no clear view of the picture. To see that we need to look at the detail – the uniqueness of each piece.


Our next strategy is to look at the shapes of the edges to find the pieces that are complementary – that leave no gaps when fitted together. These are our potential neighbours. Sometimes there is only one bit that fits, sometimes there are many that fit well enough.


Our third strategy is to look at the patterns on the potential neighbours and to check for continuity because the picture should flow across the boundary – and a mismatch means we have made an error.
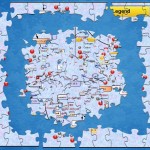
 What we have now is the edges of the picture and a heap of bits that go somewhere in the middle.

By connecting the edge-pieces we can see that there are gaps and this is an important insight.

It is not until we have a framework that spans the whole picture that the gaps become obvious.

But we do not know yet if our missing pieces are in the heap or not – we will not know that until we have solved the jigsaw puzzle.


Throughout the problem-dissolving process we are using three levels of content:
Data that we gain through our senses, in this case our visual system;
Information which is the result of using context to classify the data – shape and colour for example; and
Knowlege which we derive from past experience to help us make decisions – “That is a top-left corner so it goes there; that is an edge so it goes in that group; that edge matches that one so they might be neighbours and I will try fitting them together; the picture does not flow so they cannot be neighbours and I must separate them”.

The important point is that we do not need to Understand the picture to do this – we can just use “dumb” pattern-matching techniques, simple logic and brute force to decide which bits go together and which do not. A computer could do it – and we or the computer can solve the puzzle and still not recognise what we are looking at, understand what it means, or be able to make a wise decision.


To do that we need to search for meaning – and that usually means looking for and recognising symbols that are labels for concepts and using the picture to reveal how they relate to each other.

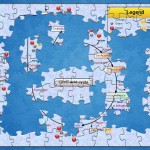
As we fit the neighbours together we see words and phrases that we may recognise – “Legend” and “cycle” for example (click the picture to enlarge)  – and we can use these labels to start to build a conceptual framework, and from that we create an expectation. Just as we did with the corners and edges.

The word “cycle” implies a circle, which is often drawn as a curved line, so we can use this expectation to look for pieces of a circle and lay them out – just as we did with the edges.

We may not recognise all the symbols – “citric acid” for example – and that finding means that there is new knowledge hidden in the picture. By the end we may understand what those new symbols mean from the context that the Big Picture creates.

By searching for meaning we are doing more than mechanically completing a task – we are learning, expanding our knowledge and deepening our understanding.

But to do this we need to separate the heap of bits so they do not obscure each other and so we can see each clearly. When it is a mess the new learning and deeper understanding will elude us.

We have now found some pieces with lines on that look like parts of a circle, so we can arrange them into an approximate sequence – and when we do that we are delighted to find that the pieces fit together, the pictures flow from one to the other, and there is a sense of order and structure starting to emerge from within the picture itself.

Until now the only structure we saw was the artificial and meaningless boundary.  We now see a new and unfamiliar phrase “citric acid cycle” – what is that? Our curiosity is building.
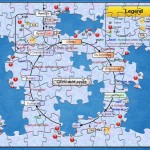
As we progress we find repeated symbols that we now recognise but do not understand – red and gray circles linked together. In the top right under the word “Legend” we see the same symbols together with some we do recognise – “hydrogen, carbon and oxygen”.

Ah ha! Now we can translate the unfamiliar symbols into familiar concepts, and now we suspect that this is something to do with chemistry. But what?
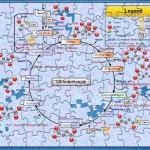
We are nearly there.  Almost all the pieces are in place and we have identified where the last few fit.

Now we can see that all the pieces are from the same jigsaw, there are none missing and there are no damaged, distorted, or duplicated pieces. The Big Picture looks complete.

We can see that the lines between the pieces are not part of the picture – they are artificial boundaries created when the picture was broken into parts – and useful only for helping us to re-assemble the big picture.

Now they are getting in the way – they are distracting us from seeing the picture as clearly as we could – so we can dispense with them – they have served their purpose.

We can also see that the pieces appear to be arranged in columns and rows – and we could view our picture as a set of interlocked vertical stripes or as a set of interlocked horizontal strips – but that this is an artificial structure created by our artificial boundaries. The picture we are seeing transcends our artificial linear decomposition.
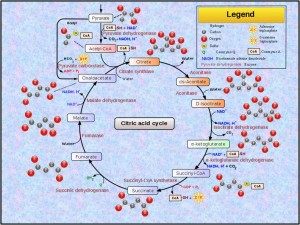
We erase all the artificial boundaries and the full picture emerges.

Now we can see that we have a chemical system where a series of reactions are linked in a cycle – and we can see something called pyruvate coming in top left and we recognise the symbols water and CO2 and we conclude that this might be part of the complex biochemical system that is called cellular respiration – the process by which the food that we eat and the oxygen we breathe is converted into energy and the CO2 that we breathe out.

Wow!

And we can see that this is just part of a bigger map – the edges were also artificial and arbitrary! But where does the oxygen fit? And which bit is the energy? And what is the link between the carbohydrate that we eat and this new thing called pyruvate?

Our bigger picture and deeper understanding has generated a lot of new questions, there is so much more to explore, to learn and to understand!!


Let us stop and reflect. What have we learned?

We have learned that our piece was not just one of a random heap of unconnected jigsaw bits; we have learned where our piece fits into a Bigger Picture; we have learned how our piece is an essential part of that picture; we have learned that there is a design in the picture and we have learned how we are part of that design.

And when we all know and we all understand the whole design and how it works then we all have a much better chance of being able to improve it in a rational, sensible, explainable and actionable way.

Building the System Picture from the disorganised heap of Step Parts is one of the key skills of an Improvement Science Practitioner.

And the more practice we get, the quicker we recognise what we are looking at – because there are a relatively few effective system designs.

This is insight is important because most of the unsolved problems are system problems – and the sooner we can diagnose the system design flaws that are the root causes of the system problems, then the sooner we can propose, test and implement solutions and experience the expected improvements.

That is a Win-Win-Win strategy.

That is systems engineering in a nutshell.

The Bucket Brigade Fire Fighting Service

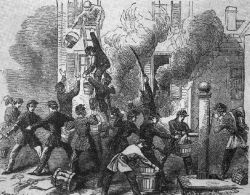
Fire-fighting is a behaviour that has a long history, and before Fireman Sam arrived on the scene we had the Bucket Brigade.  This was a people-intensive process designed to deliver water from the nearest pump, pond or river with as little risk, delay and effort as possible. The principle of a bucket-brigade is that a chain of people forms between the pump and the fire and they pass buckets in two directions – full ones from the pump to the fire and empty ones from the fire back to the pump.

A bucket brigade is useful metaphor for many processes and an Improvement Science Practitioner (ISP) can learn a lot from exploring its behaviour.

First of all the number of steps in the process or stream is fixed because it is determined by the distance between the pump and the fire. The time it takes for a Bucket Passer to pass a bucket to the next person is predictable  too and it is this cycle-time that determines the rate at which a bucket will move along the line. The fixed step-number and fixed cycle-time implies that the time it takes for a bucket to pass from one end of the line to the other is fixed too. It does not matter if the bucket is empty, half empty or full – the delivery time per bucket is consistent from bucket to bucket. The outflow however is not fixed – it is determined by how full each bucket is when it reaches the end of the line: empty buckets means zero flow, full buckets means maximum flow.

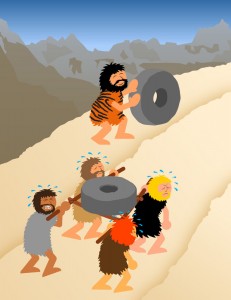
This implies that the process is behaving like a time-trap because the delivery time and the delivery volume (i.e. flow) are independent. Having bigger buckets or fuller buckets makes no difference to the time it takes to traverse the line but it does influence the outflow.

Most systems have many processes that are structured just like a bucket brigade: each step in the process contributes to completing the task before handing the part-completed task on to the next step.

The four dimensions of improvement are Safety, Flow, Quality and Productivity and we can see that, if we are not dropping buckets, then the safety, flow and quality are fixed by the design of the process. So what can we do to improve productivity?

Well, it is evident that the time it takes to do the hand-off adds to the cycle-time of each step. So along comes the Fire Service Finance Department who sees time-as-money and they work out that the unit cost of each step of the process could be reduced by accumulating the jobs at each stage and then handing them off as a batch – because the time-is-money and the cost of the hand-off can now be shared across several buckets. They conclude that the unit cost for the steps will come down and productivity will go up – simple maths and intuitively obvious in theory – but does it actually work in reality?

Q1: Does it reduce the number of Bucket Passers? No. We need just as many as we did before. What we are doing is replacing the smaller buckets with bigger ones – and that will require capital investment.  So when our Finance Department use the lower unit cost as justification then the bigger, more expensive buckets start to look like a good financial option – on paper. But looking at the wage bills we can see that they are the same as before so this raises a question: have the bigger buckets increased the flow or reduced the delivery time? We will need a tangible, positive and measurable  improvement in productivity to justify our capital investment.

To summarise: we have the same number of Bucket Passers working at the same cycle time so there is no improvement in how long it takes for the water to reach the fire from the pump! The delivery time is unchanged. And using bigger buckets implies that the pump needs to be able to work faster to fill them in one cycle of the process – but to minimise cost when we created the Fire Service we bought a pump with just enough average flow capacity and it cannot be made to increase its flow. So, equipped with a bigger bucket the first Bucket Passer has to wait longer for their bigger bucket to be filled before passing it on down the line.  This implies a longer cycle-time for the first step, and therefore also for every step in the chain. So the delivery-time will actually get longer and the flow will stay the same – on average. All we have appear to have achieved is a higher cost and longer delivery time – which is precisely the opposite of what we intended. Productivity has actually fallen!

In a state of  near-panic the Fire Service Finance Department decide to measure the utilisation of the Bucket Passers and discover that it has fallen which must mean that they have become lazy! So a Push Policy is imposed to make them work faster – the Service cannot afford financial inducements – and threats cost nothing. The result is that in their haste to avoid penalties the bigger, fuller, heavier buckets get fumbled and some of the precious water is lost – so less reaches the fire.  The yield of the process falls and now we have a more expensive, longer delivery time, lower flow process. Productivity has fallen even further and now the Bucket Passers and Accountants are at war. How much worse can it get?

Where did we go wrong?

We made an error of omission. We omitted to learn the basics of process design before attempting to improve the productivity of our time-trap dominated process!  Our error of omission led us to confuse the step, stage, stream and system and we incorrectly used stage metrics (unit cost and utilisation) in an attempt to improve system performance (productivity). The outcome was the exact opposite of what we intended; a line of unhappy Bucket Passers; a frustrated Finance Department and an angry Customer whose house burned down because our Fire Service did not deliver enough water on time. Lose-Lose-Lose.

Q1: Is it possible to improve the productivity of a time-trap design?

Q1: Yes, it is.

Q2: How do we avoid making the same error?

A2: Follow the FISH .

Targets, Tyrannies and Traps.

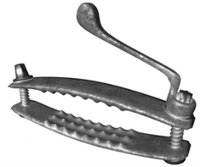
If we are required to place a sensitive part of our anatomy into a device that is designed to apply significant and sustained pressure, then the person controlling the handle would have our complete attention!

Our sole objective would be to avoid the crushing and relentless pain and this would most definitely bias our behaviour.

We might say or do things that ordinarily we would not – just to escape from the pain.

The requirement to meet well-intentioned but poorly-designed performance targets can create the organisational equivalent of a medieval thumbscrew; and the distorting effect on behaviour is the same.  Some people even seem to derive pleasure from turning the screw!

But what if we do not know how to achieve the performance target? We might then act to deflect the pain onto others – we might become tyrants too – and we might start to apply our own thumbscrews further along the chain of command.  Those unfortunate enough to be at the end of the pecking order have nowhere to hide – and that is a deeply distressing place to be – helpless and hopeless.

Fortunately there is a way out of the corporate torture chamber: It is to learn how to design systems to deliver the required performance specification – and learning how to do this is much easier than many believe.

For example, most assume without question that big queues and long waits are always caused by inefficient use of available capacity – because that is what their monitoring systems report. So out come thumbscrews heralded by the chanted mantra “increase utilisation, increase utilisation”.  Unfortunately, this belief is only partially correct: low utilisation of available capacity can and does lead to big queues and long waits but there is a much more prevalent and insidious cause of long waits that has nothing to do with capacity or utilisation. These little beasties are are called time-traps.

The essential feature of a time trap is that it is independent of both flow and time – it adds the same amount of delay irrespective of whether the flow is low or high and irrespective of when the work arrives. In contrast waits caused by insufficient capacity are flow and time dependent – the higher the flow the longer the wait – and the effect is cumulative over time.

Many confuse the time-trap with its close relative the batch – but they are not the same thing at all – and most confuse both of these with capacity-constraints which are a completely different delay generating beast altogether.

The distinction is critical because the treatments for time-traps, batches and capacity-constraints are different – and if we get the diagnosis wrong then we will make the wrong decision, choose the wrong action, and our system will get sicker, or at least no better. The corporate pain will continue and possibly get worse – leading to even more bad behaviour and more desperate a self-destructive strategies.

So when we want to reduce lead times by reducing waiting-in-queues then the first thing we need to do is to search for the time-traps, and to do that we need to be able to recognise their characteristic footprint on our time-series charts; the vital signs of our system.

We need to learn how to create and interpret the charts – and to do that quickly we need guidance from someone who can explain what to look for and how to interpret the picture.

If we lack insight and humility and choose not to learn then we are choosing to stay in the target-tyranny-trap and our pain will continue.

The Power of the Positive Deviants

It is neither reasonable nor sensible to expect anyone to be a font of all knowledge.

And gurus with their group-think are useful but potentially dangerous when they suppress competitive paradigms.

So where does an Improvement Scientist seek reliable and trustworthy inspiration?

Guessing is a poor guide; gut-instinct can seriously mislead; and mind-altering substances are illegal, unreliable or both!

So who are the sources of tested ideas and where do we find them?

They are called Positive Deviants and they are everywhere.


But, the phrase positive deviant does not feel quite right does it? The word “deviant” has a strong negative emotional association. We are socially programmed from birth to treat deviations from the norm with distrust and for good reason. Social animals view conformity and similarity as security – it is our herd instinct. Anyone who looks or behaves too far from the norm is perceived as odd and therefore a potential threat and discounted or shunned.

So why consider deviants at all? Well, because anyone who behaves significantly differently from the majority is a potential source of new insight – so long as we know how to separate the positive deviants from the negative ones.

Negative deviants display behaviours that we could all benefit from by actively discouraging!  The NoNo or thou-shalt-not behaviours that are usually embodied in Law.  Killing, stealing, lying, speeding, dropping litter – that sort of thing. The anti-social trust-eroding conflict-generating behaviour that poisons the pond that we all swim in.

Positive deviants display behaviours that we could all benefit from actively encouraging! The NiceIf behaviours. But we are habitually focussed more on self-protection than self-development and we generalise from specifics. So we treat all deviants the same – we are wary of them. And by so doing we miss many valuable opportunities to learn and to improve.


How then do we identify the Positive Deviants?

The first step is to decide the dimension we want to improve and choose a suitable metric to measure it.

The second step is to measure the metric for everyone and do it over time – not just at a point in time. Single point-in-time measurements (snapshots) are almost useless – we can be tricked by the noise in the system into poor decisions.

The third step is to plot our measure-for-improvement as a time-series chart and look at it.  Are there points at the positive end of the scale that deviate significantly from the average? If so – where and who do they come from? Is there a pattern? Is there anything we might use as a predictor of positive deviance?

Now we separate the data into groups guided by our proposed predictors and compare the groups. Do the Positive Deviants now stick out like a sore thumb? Did our predictors separate the wheat from the chaff?

If so we next go and investigate.  We need to compare and contrast the Positive Deviants with the Norms. We need to compare and contrast both their context and their content. We need to know what is similar and what is different. There is something that is causing the sustained deviation and we need to search until we find it – and then we need know how and why it is happening.

We need to separate associations from causations … we need to understand the chains of events that lead to the better outcomes.

Only then will a new Door to Opportunity magically appear in our Black Wall of Ignorance – a door that leads to a proven path of improvement. A path that has been trodden before by a Positive Deviant – or by a whole tribe of them.

And only we ourselves can choose to open the door and explore the path – we cannot be pushed through by someone else.

When our system is designed to identify and celebrate the Positive Deviants then the negative deviants will be identified too! And that helps too because they will light the path to more NoNos that we can all learn to avoid.

For more about positive deviance from Wikipedia click here

For a case study on positive deviance click here

NB: The terms NiceIfs  and NoNos are two of the N’s on The 4N Chart® – the other two are Nuggets and Niggles.