
Monday 19th July 2021 was the official end of COVID-19 restrictions in England – yet the number of positive tests, hospital admissions and deaths is rising. “How can that make any sense!” wail the doom mongers. Is it irresponsible? Are we destined for a deadly third wave? Is a nasty sting in the tail on the way?
To address these questions we need to step back and look at the bigger picture.
As we have seen, the evolution of the COVID-19 pandemic has been tricky to predict because the virus and the host have been co-evolving. The host has implemented social distancing and developed vaccines to attenuate the viral spread and illness severity. The virus has mutated and more contagious variants have emerged as the dominant players.
And trying to work out how all these factors combine together is beyond the computational ability of the 1.4 kg of chimpware between our ears. Our intuition is confounded by the counter-intuitive complexity. We need help.
Here is the published data … the orange line is the daily reported positive COVID tests and the red dotted line is the daily reported COVID deaths. There is a clear temporal association but the size of the peaks don’t seem to make sense – even when we note that the test and death lines are plotted on very different scales.
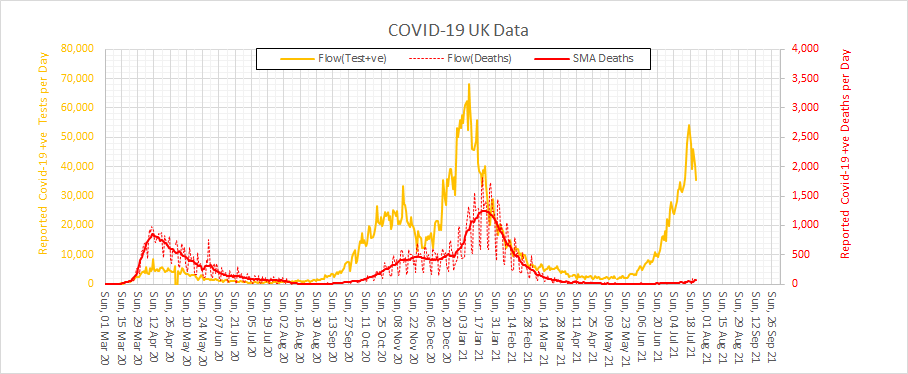
One problem here is that the number of positive tests reported is very dependent on the testing process. In the first wave only hospital admissions were tested; in the second wave there was much more community-based testing of symptomatic people; and now many people are self-testing regularly to provide evidence of wellness.
The only way to unravel this Gordian Knot of interacting influences is to use the data to build and calibrate a causal structure model (CSM). Conventional statistical analysis is not up to the job because it conflates association and causation. We need something which is able to provide a diagnosis and a prognosis. Something that can use the past to help predict the future.
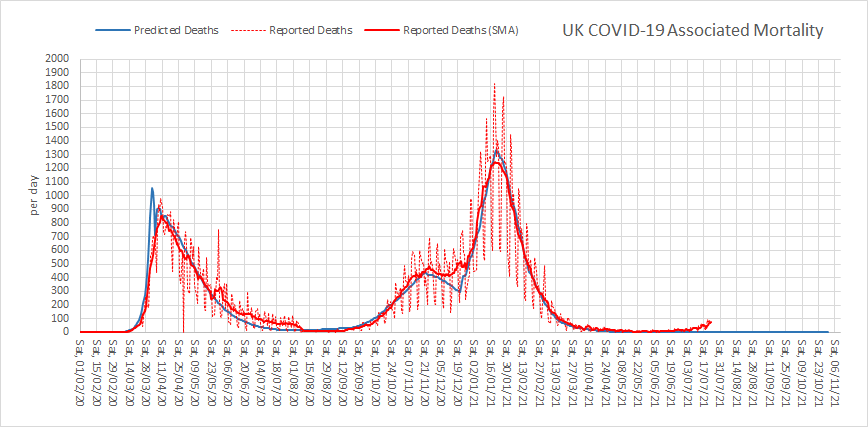
The blue line in the chart below is the output of a CSM that has been designed using proven principles of epidemic dynamics, and calibrated using historical data. And it predicts that there is indeed a third wave underway and that it is minor in comparison with the first two in terms of the predicted mortality.

The emergence of a third wave is the combined effect of three things:
a) The relaxing of social distancing rules.
b) The emergence and spread of more contagious variants of the virus.
c) The known fact that the vaccine is not 100% effective.
d) The known fact that immunity after illness or vaccination will wane with time.
One use of a CSM is to conduct counterfactual analysis which helps us to deepen our understanding of how complex systems behave. These are called “What would have happened if?” experiments.
One such experiment is “What would have happened if the vaccine was completely effective?“
Here is the CSM prediction for a 100% effective vaccine: The first and second waves were the same because the vaccination programme did not start until the peak of the second wave – and there is no third wave even with complete relaxation of social distancing.
But the actual data disproves this causal hypothesis because there is a third wave developing.
So, here is the CSM prediction for a 0% effective vaccine: The first and second waves are largely unchanged and now we have a third wave as bad as the second. A nasty sting in the tail.
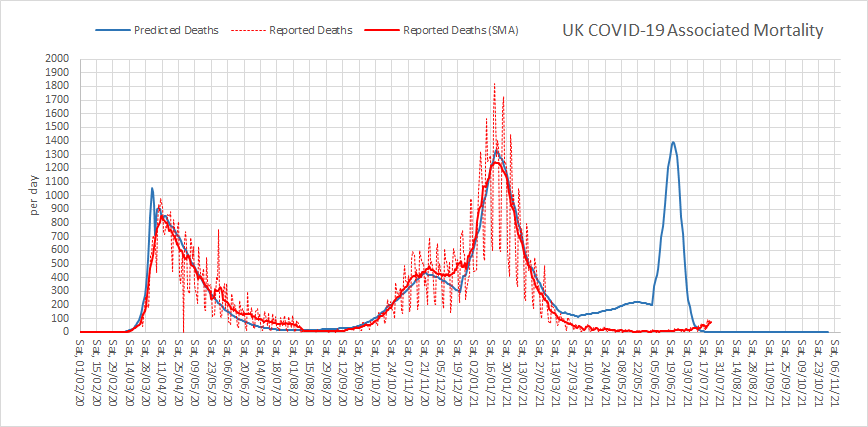
But then the epidemic fizzles out because all the host “fuel” of susceptible people has been used up.
Setting the aggregate effectiveness of the vaccine to 75% gives us the best fit to the historical data; and that value is consistent with the pilot studies of vaccine effectiveness.
And what is the most useful evidence that suggests this latest prediction is reliable? It is that the infection rate is predicted to be falling already, despite distancing rules being relaxed, and that is what the data is showing.
And with this re-calibrated CSM we can estimate the impact of the vaccination programme in terms of lives saved … at it comes out at about 40,000 people! That is a lot.
So what next?
Well, we know that immunity will wane with time, and we know that new viral variants will emerge, and we know that coronavirus will be with us for the foreseeable future at a background level.
And we have seen how this pandemic has exposed the vulnerabilities of our current socioeconomic systems – health and social care, education, transport, communication, commerce and so on. Every part of the system has been affected because everything is interconnected.
We cannot just go back to business as usual. The world has been changed. And our immediate challenge is to redesign and rebuild a health care system that is safer, more efficient and more agile and that will serve us better in the future.
Another lesson learned is just how useful systems engineering theory, tools and techniques has been – the CSM demonstrated above is a standard systems engineering technique.
So, we will need some more health care systems engineers. A lot more. And they will need to be embedded at all levels in the NHS as an integral part of the system.
A self-healing health care system.