Resilience

The rise in the use of the term “resilience” seems to mirror the sense of an accelerating pace of change. So, what does it mean? And is the meaning evolving over time?

One sense of the meaning implies a physical ability to handle stresses and shocks without breaking or failing. Flexible, robust and strong are synonyms; and opposites are rigid, fragile, and weak.

So, digging a bit deeper we know that strong implies an ability to withstand extreme stress while resilient implies the ability to withstanding variable stress. And the opposite of resilient is brittle because something can be both strong and brittle.

This is called passive resilience because it is an inherent property and cannot easily be changed. A ball is designed to be resilient – it will bounce back – and this inherent in the material and the structure. The implication of this is that to improve passive resilience we would need to remove and to replace with something better suited to the range of expected variation.

The concept of passive resilience applies to processes as well, and a common manifestation of a brittle process is one that has been designed using averages.

Processes imply flows. The flow into a process is called demand, while the flow out of the process is called activity. What goes in must come out, so if the demand exceeds the activity then a backlog will be growing inside the process. This growing queue creates a number of undesirable effects – first it takes up space, and second it increases the time for demand to be converted into activity. This conversion time is called the lead-time.

So, to avoid a growing queue and a growing wait, there must be sufficient flow-capacity at each and every step along the process. The obvious solution is to set the average flow-capacity equal to the average demand; and we do this because we know that more flow-capacity implies more cost – and to stay in business we must keep a lid on costs!

This sounds obvious and easy but does it actually work in practice?

The surprising answer is “No”. It doesn’t.

What happens in practice is that the measured average activity is always less than the funded flow-capacity, and so less than the demand. The backlogs will continue to grow; the lead-time will continue to grow; the waits will continue to grow; the internal congestion will continue to grow – until we run out of space. At that point everything can grind to a catastrophic halt. That is what we mean by a brittle process.

This fundamental and unexpected result can easily and quickly be demonstrated in a concrete way on a table top using ordinary dice and tokens. A credible game along these lines was described almost 40 years ago in The Goal by Eli Goldratt, originator of the school of improvement called Theory of Constraints. The emotional impact of gaining this insight can be profound and positive because it opens the door to a way forward which avoids the Flaw of Averages trap. There are countless success stories of using this understanding.


So, when we need to cope with variation and we choose a passive resilience approach then we have to plan to the extremes of the range of variation. Sometimes that is not possible and we are forced to accept the likelihood of failure. Or we can consider a different approach.

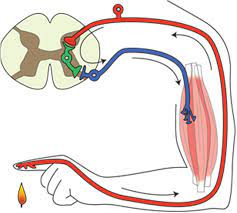
Reactive resilience is one that living systems have evolved to use extensively, and is illustrated by the simple reflex loop shown in the diagram.

A reactive system has three components linked together – a sensor (i.e. temperature sensitive nerves endings in the skin), a processor (i.e. the grey matter of the spinal chord) and an effector (i.e. the muscle, ligaments and bones). So, when a pre-defined limit of variation is reached (e.g. the flame) then the protective reaction withdraws the finger before it becomes damaged. The advantage this type of reactive resilience is that it is relatively simple and relatively fast. The disadvantage is that it is not addressing the cause of the problem.

This is called reactive, automatic and agnostic.

The automatic self-regulating systems that we see in biology, and that we have emulated in our machines, are evidence of the effectiveness of a combination of passive and reactive resilience. It is good enough for most scenarios – so long as the context remains stable. The problem comes when the context is evolving, and in that case the automatic/reflex/blind/agnostic approach will fail – at some point.


Survival in an evolving context requires more – it requires proactive resilience.

What that means is that the processor component of the feedback loop gains an extra feature – a memory. The advantage this brings is that past experience can be recalled, reflected upon and used to guide future expectation and future behaviour. We can listen and learn and become proactive. We can look ahead and we can keep up with our evolving context. One might call, this reactive adaptation or co-evolution and it is a widely observed phenomenon in nature.

The usual manifestation is this called competition.

Those who can reactively adapt faster and more effectively than others have a better chance of not failing – i.e. a better chance of survival. The traditional term for this is survival of the fittest but the trendier term for proactive resilience is agile.

And that is what successful organisations are learning to do. They are adding a layer of proactive resilience on top of their reactive resilience and their passive resilience.

All three layers of resilience are required to survive in an evolving context.

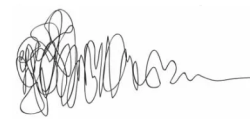
One manifestation of this is the concept of design which is where we create things with the required resilience before they are needed. This is illustrated by the design squiggle which has time running left to right and shows the design evolving adaptively until there is sufficient clarity to implement and possibly automate.

And one interesting thing about design is that it can be done without an understanding of how something works – just knowing what works is enough. The elegant and durable medieval cathedrals were designed and built by Master builders who had no formal education. They learned the heuristics as apprentices and through experience.


And if we project the word game forwards we might anticipate a form of resilience called proactive adaptation. However, we sense that is a novel thing because there is no proadaptive word in the dictionary.

PS. We might also use the term Anti-Fragile, which is the name of a thought-provoking book that explores this very topic.

From Push to Pull

One of the most frequent niggles that I hear from patients is the difficultly they have getting an appointment with their general practitioner.  I too have personal experience of the distress caused by the ubiquitous “Phone at 8AM for an Appointment” policy, so in June 2018 when I was approached to help a group of local practices redesign their appointment booking system I said “Yes, please!


What has emerged is a fascinating, enjoyable and rewarding journey of co-evolution of learning and co-production of an improved design.  The multi-skilled design team (MDT) we pulled together included general practitioners, receptionists and practice managers and my job was to show them how to use the health care systems engineering (HCSE) framework to diagnose, design, decide and deliver what they wanted: A safe, calm, efficient, high quality, value-4-money appointment booking service for their combined list of 50,000 patients.


This week they reached the start of the ‘decide and deliver‘ phase.  We have established the diagnosis of why the current booking system is not delivering what we all want (i.e. patients and practices), and we have assembled and verified the essential elements of an improved design.

And the most important outcome for me is that the Primary Care MDT now feel confident and capable to decide what and how to deliver it themselves.   That is what I call embedded capability and achieving it is always an emotional roller coaster ride that we call The Nerve Curve.

What we are dealing with here is called a complex adaptive system (CAS) which has two main components: Processes and People.  Both are complicated and behave in complex ways.  Both will adapt and co-evolve over time.  The processes are the result of the policies that the people produce.  The policies are the result of the experiences that the people have and the explanations that they create to make intuitive sense of them.

But, complex systems often behave in counter-intuitive ways, so our intuition can actually lead us to make unwise decisions that unintentionally perpetuate the problem we are trying to solve.  The name given to this is a wicked problem.

A health care systems engineer needs to be able to demonstrate where these hidden intuitive traps lurk, and to explain what causes them and how to avoid them.  That is the reason the diagnosis and design phase is always a bit of a bumpy ride – emotionally – our Inner Chimp does not like to be challenged!  We all resist change.  Fear of the unknown is hard-wired into us by millions of years of evolution.

But we know when we are making progress because the “ah ha” moments signal a slight shift of perception and a sudden new clarity of insight.  The cognitive fog clears a bit and a some more of the unfamiliar terrain ahead comes into view.  We are learning.

The Primary Care MDT have experienced many of these penny-drop moments over the last six months and unfortunately there is not space here to describe them all, but I can share one pivotal example.


A common symptom of a poorly designed process is a chronically chaotic queue.

[NB. In medicine the term chronic means “long standing”.  The opposite term is acute which means “recent onset”].

Many assume, intuitively, that the cause of a chronically chaotic queue is lack of capacity; hence the incessant calls for ‘more capacity’.  And it appears that we have learned this reflex response by observing the effect of adding capacity – which is that the queue and chaos abate (for a while).  So that proves that lack of capacity was the cause. Yes?

Well actually it doesn’t.  Proving causality requires a bit more work.  And to illustrate this “temporal association does not prove causality trap” I invite you to consider this scenario.

I have a headache => I take a paracetamol => my headache goes away => so the cause of my headache was lack of paracetamol. Yes?

Errr .. No!

There are many contributory causes of chronically chaotic queues and lack of capacity is not one of them because the queue is chronic.  What actually happens is that something else triggers the onset of chaos which then consumes the very resource we require to avoid the chaos.  And once we slip into this trap we cannot escape!  The chaos-perpretuating behaviour we observe is called fire-fighting and the necessary resource it consumes is called resilience.


Six months ago, the Primary Care MDT believed that the cause of their chronic appointment booking chaos was a mismatch between demand and capacity – i.e. too much patient demand for the appointment capacity available.  So, there was a very reasonable resistance to the idea of making the appointment booking process easier for patients – they justifiably feared being overwhelmed by a tsunami of unmet need!

Six months on, the Primary Care MDT understand what actually causes chronic queues and that awareness has been achieved by a step-by-step process of explanation and experimentation in the relative safety of the weekly design sessions.

We played simulation games – lots of them.

One particularly memorable “Ah Ha!” moment happened when we played the Carveout Game which is done using dice, tiddly-winks, paper and coloured-pens.  No computers.  No statistics.  No queue theory gobbledygook.  No smoke-and-mirrors.  No magic.

What the Carveout Game demonstrates, practically and visually, is that an easy way to trigger the transition from calm-efficiency to chaotic-ineffectiveness is … to impose a carveout policy on a system that has been designed to achieve optimum efficiency by using averages.  Boom!  We slip on the twin banana skins of the Flaw-of-Averages and Sub-Optimisation, slide off the performance cliff, and career down the rocky slope of Chronic Chaos into the Depths of Despair – from which we cannot then escape.

This visual demonstration was a cognitive turning point for the MDT.  They now believed that there is a rational science to improvement and from there we were on the step-by-step climb to building the necessary embedded capability.


It now felt like the team were pulling what they needed to know.  I was no longer pushing.  We had flipped from push-to-pull.  That is called the tipping point.

And that is how health care systems engineering (HCSE) works.


Health care is a complex adaptive system, and what a health care systems engineer actually “designs” is a context-sensitive  incubator that nurtures the seeds of innovation that already exist in the system and encourages them to germinate, grow and become strong enough to establish themselves.

That is called “embedded improvement-by-design capability“.

And each incubator need to be different – because each system is different.  One-solution-fits-all-problems does not work here just as it does not in medicine.  Each patient is both similar and unique.


Just as in medicine, first we need to diagnose the actual cause;  second we need to design some effective solutions; third we need to decide which design to implement and fourth we need to deliver it.

But the how-to-do-it feels a bit counter-intuitive, and if it were not we would already be doing it. But the good news is that anyone can learn how to do HCSE.

The 85% Optimum Bed Occupancy Myth

A few years ago I had a rant about the dangers of the widely promoted mantra that 85% is the optimum average measured bed-occupancy target to aim for.

But ranting is annoying, ineffective and often counter-productive.

So, let us revisit this with some calm objectivity and disprove this Myth a step at a time.

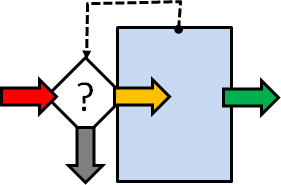
The diagram shows the system of interest (SoI) where the blue box represents the beds, the coloured arrows are the patient flows, the white diamond is a decision and the dotted arrow is information about how full the hospital is (i.e. full/not full).

A new emergency arrives (red arrow) and needs to be admitted. If the hospital is not full the patient is moved to an empty bed (orange arrow), the medical magic happens, and some time later the patient is discharged (green arrow).  If there is no bed for the emergency request then we get “spillover” which is the grey arrow, i.e. the patient is diverted elsewhere (n.b. these are critically ill patients …. they cannot sit and wait).


This same diagram could represent patients trying to phone their GP practice for an appointment.  The blue box is the telephone exchange and if all the lines are busy then the call is dropped (grey arrow).  If there is a line free then the call is connected (orange arrow) and joins a queue (blue box) to be answered some time later (green arrow).

In 1917, a Danish mathematician/engineer called Agner Krarup Erlang was working for the Copenhagen Telephone Company and was grappling with this very problem: “How many telephone lines do we need to ensure that dropped calls are infrequent AND the switchboard operators are well utilised?

This is the perennial quality-versus-cost conundrum. The Value-4-Money challenge. Too few lines and the quality of the service falls; too many lines and the cost of the service rises.

Q: Is there a V4M ‘sweet spot” and if so, how do we find it? Trial and error?

The good news is that Erlang solved the problem … mathematically … and the not-so good news is that his equations are very scary to a non mathematician/engineer!  So this solution is not much help to anyone else.


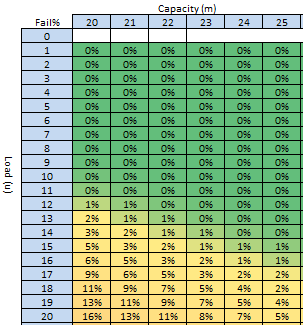
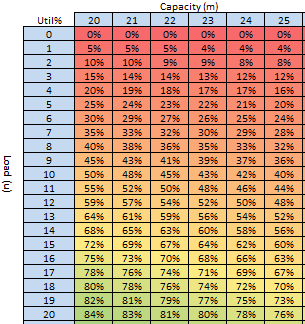
Fortunately, we have a tool for turning scary-equations into easy-2-see-pictures; our trusty Excel spreadsheet. So, here is a picture called a heat-map, and it was generated from one of Erlang’s equations using Excel.

The Erlang equation is lurking in the background, safely out of sight.  It takes two inputs and gives one output.

The first input is the Capacity, which is shown across the top, and it represents the number of beds available each day (known as the space-capacity).

The second input is the Load (or offered load to use the precise term) which is down the left side, and is the number of bed-days required per day (e.g. if we have an average of 10 referrals per day each of whom would require an average 2-day stay then we have an average of 10 x 2 = 20 bed-days of offered load per day).

The output of the Erlang model is the probability that a new arrival finds all the beds are full and the request for a bed fails (i.e. like a dropped telephone call).  This average probability is displayed in the cell.  The colour varies between red (100% failure) and green (0% failure), with an infinite number of shades of red-yellow-green in between.

We can now use our visual heat-map in a number of ways.

a) We can use it to predict the average likelihood of rejection given any combination of bed-capacity and average offered load.

Suppose the average offered load is 20 bed-days per day and we have 20 beds then the heat-map says that we will reject 16% of requests … on average (bottom left cell).  But how can that be? Why do we reject any? We have enough beds on average! It is because of variation. Requests do not arrive in a constant stream equal to the average; there is random variation around that average.  Critically ill patients do not arrive at hospital in a constant stream; so our system needs some resilience and if it does not have it then failures are inevitable and mathematically predictable.

b) We can use it to predict how many beds we need to keep the average rejection rate below an arbitrary but acceptable threshold (i.e. the quality specification).

Suppose the average offered load is 20 bed-days per day, and we want to have a bed available more than 95% of the time (less than 5% failures) then we will need at least 25 beds (bottom right cell).

c) We can use it to estimate the maximum average offered load for a given bed-capacity and required minimum service quality.

Suppose we have 22 beds and we want a quality of >=95% (failure <5%) then we would need to keep the average offered load below 17 bed-days per day (i.e. by modifying the demand and the length of stay because average load = average demand * average length of stay).


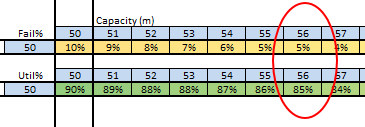
There is a further complication we need to be mindful of though … the measured utilisation of the beds is related to the successful admissions (orange arrow in the first diagram) not to the demand (red arrow).  We can illustrate this with a complementary heat map generated in Excel.

For scenario (a) above we have an offered load of 20 bed-days per day, and we have 20 beds but we will reject 16% of requests so the accepted bed load is only 16.8 bed days per day  (i.e. (100%-16%) * 20) which is the reason that the average  utilisation is only 16.8/20 = 84% (bottom left cell).

For scenario (b) we have an offered load of 20 bed-days per day, and 25 beds and will only reject 5% of requests but the average measured utilisation is not 95%, it is only 76% because we have more beds (the accepted bed load is 95% * 20 = 19 bed-days per day and 19/25 = 76%).

For scenario (c) the average measured utilisation would be about 74%.


So, now we see the problem more clearly … if we blindly aim for an average, measured, bed-utilisation of 85% with the untested belief that it is always the optimum … this heat-map says it is impossible to achieve and at the same time offer an acceptable quality (>95%).

We are trading safety for money and that is not an acceptable solution in a health care system.


So where did this “magic” value of 85% come from?

From the same heat-map perhaps?

If we search for the combination of >95% success (<5% fail) and 85% average bed-utilisation then we find it at the point where the offered load reaches 50 bed-days per day and we have a bed-capacity of 56 beds.

And if we search for the combination of >99% success (<1% fail) and 85% average utilisation then we find it with an average offered load of just over 100 bed-days per day and a bed-capacity around 130 beds.

H’mm.  “Houston, we have a problem“.


So, even in this simplified scenario the hypothesis that an 85% average bed-occupancy is a global optimum is disproved.

The reality is that the average bed-occupancy associated with delivering the required quality for a given offered load with a specific number of beds is almost never 85%.  It can range anywhere between 50% and 100%.  Erlang knew that in 1917.


So, if a one-size-fits-all optimum measured average bed-occupancy assumption is not valid then how might we work out how many beds we need and predict what the expected average occupancy will be?

We would design the fit-4-purpose solution for each specific context …
… and to do that we need to learn the skills of complex adaptive system design …
… and that is part of the health care systems engineering (HCSE) skill-set.


The Pathology of Variation II

It is that time of year – again.

Winter.

The NHS is struggling, front-line staff are having to use heroic measures just to keep the ship afloat, and less urgent work has been suspended to free up space and time to help man the emergency pumps.

And the finger-of-blame is being waggled by the army of armchair experts whose diagnosis is unanimous: “lack of cash caused by an austerity triggered budget constraint”.


And the evidence seems plausible.

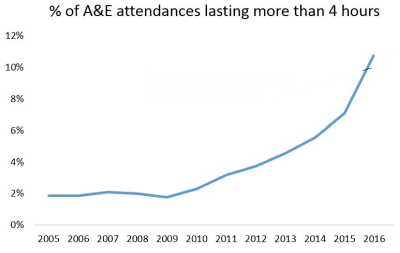
The A&E performance data says that each year since 2009, the proportion of patients waiting more than 4 hours in A&Es has been increasing.  And the increase is accelerating. This is a progressive quality failure.

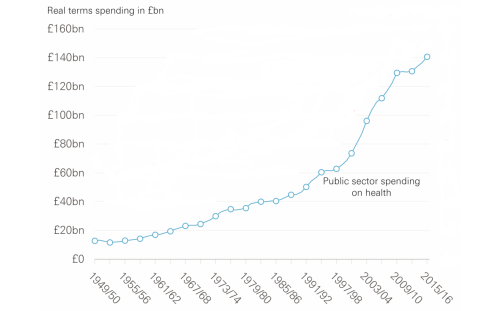
And health care spending since the NHS was born in 1948 shows a very similar accelerating pattern.    

So which is the chicken and which is the egg?  Or are they both symptoms of something else? Something deeper?


Both of these charts are characteristic of a particular type of system behaviour called a positive feedback loop.  And the cost chart shows what happens when someone attempts to control the cash by capping the budget:  It appears to work for a while … but the “pressure” is building up inside the system … and eventually the cash-limiter fails. Usually catastrophically. Bang!


The quality chart shows an associated effect of the “pressure” building inside the acute hospitals, and it is a very well understood phenomenon called an Erlang-Kingman queue.  It is caused by the inevitable natural variation in demand meeting a cash-constrained, high-resistance, high-pressure, service provider.  The effect is to amplify the natural variation and to create something much more dangerous and expensive: chaos.


The simple line-charts above show the long-term, aggregated  effects and they hide the extremely complicated internal structure and the highly complex internal behaviour of the actual system.

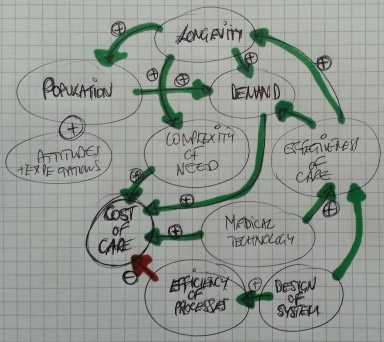
One technique that system engineers use to represent this complexity is a causal loop diagram or CLD.

The arrows are of two types; green indicates a positive effect, and red indicates a negative effect.

This simplified CLD is dominated by green arrows all converging on “Cost of Care”.  They are the positive drivers of the relentless upward cost pressure.

Health care is a victim of its own success.

So, if the cash is limited then the naturally varying demand will generate the queues, delays and chaos that have such a damaging effect on patients, providers and purses.

Safety and quality are adversely affected. Disappointment, frustration and anxiety are rife. Expectation is lowered.  Confidence and trust are eroded.  But costs continue to escalate because chaos is expensive to manage.

This system behaviour is what we are seeing in the press.

The cost-constraint has, paradoxically, had exactly the opposite effect, because it is treating the effect (the symptom) and ignoring the cause (the disease).


The CLD has one negative feedback loop that is linked to “Efficiency of Processes”.  It is the only one that counteracts all of the other positive drivers.  And it is the consequence of the “System Design”.

What this means is: To achieve all the other benefits without the pressures on people and purses, all the complicated interdependent processes required to deliver the evolving health care needs of the population must be proactively designed to be as efficient as technically possible.


And that is not easy or obvious.  Efficient design does not happen naturally.  It is hard work!  It requires knowledge of the Anatomy and Physiology of Systems and of the Pathology of Variation.  It requires understanding how to achieve effectiveness and efficiency at the same time as avoiding queues and chaos.  It requires that the whole system is continually and proactively re-designed to remain reliable and resilient.

And that implies it has to be done by the system itself; and that means the NHS needs embedded health care systems engineering know-how.

And when we go looking for that we discover sequence of gaps.

An Awareness gap, a Belief gap and a Capability gap. ABC.

So the first gap to fill is the Awareness gap.

H.R.O.

The New Year of 2018 has brought some unexpected challenges. Or were they?

We have belligerent bullies with their fingers on their nuclear buttons.

We have an NHS in crisis, with corridor-queues of urgent frail, elderly, unwell and a month of cancelled elective operations.

And we have winter storms, fallen trees, fractured power-lines, and threatened floods – all being handled rather well by people who are trained to manage the unexpected.

Which is the title of this rather interesting book that talks a lot about HROs.

So what are HROs?


“H” stands for High.  “O” stands for Organisation.

What does R stand for?  Rhetoric? Rigidity? Resistance?

Watching the news might lead one to suggest these words would fit … but they are not the answer.

“R” stands for Reliability and “R” stands for Resilience … and they are linked.


Think of a global system that is so reliable that we all depend on it, everyday.  The Global Positioning System or the Internet perhaps.  We rely on them because they serve a need and because they work. Reliably and resiliently.

And that was no accident.

Both the Internet and the GPS were designed and built to meet the needs of billions and to be reliable and resilient.  They were both created by an army of unsung heroes called systems engineers – who were just doing their job. The job they were trained to do.


The NHS serves a need – and often an urgent one, so it must also be reliable. But it is not.

The NHS needs to be resilient. It must cope with the ebb and flow of seasonal illness. But it does not.

And that is because the NHS has not been designed to be either reliable or resilient. And that is because the NHS has not been designed.  And that is because the NHS does not appear to have enough health care systems engineers trained to do that job.

But systems engineering is a mature discipline, and it works just as well inside health care as it does outside.


And to support that statement, here is evidence of what happened after a team of NHS clinicians and managers were trained in the basics of HCSE.

Monklands A&E Improvement

So the gap seems to be just an awareness/ability gap … which is a bridgeable one.


Who would like to train to be a Health Case Systems Engineer and to join the growing community of HCSE practitioners who have the potential to be the future unsung heroes of the NHS?

Click here if you are interested: http://www.ihcse.uk

PS. “Managing the Unexpected” is an excellent introduction to SE.

The Strangeness of LoS

It had been some time since Bob and Leslie had chatted so an email from the blue was a welcome distraction from a complex data analysis task.

<Bob> Hi Leslie, great to hear from you. I was beginning to think you had lost interest in health care improvement-by-design.

<Leslie> Hi Bob, not at all.  Rather the opposite.  I’ve been very busy using everything that I’ve learned so far.  It’s applications are endless, but I have hit a problem that I have been unable to solve, and it is driving me nuts!

<Bob> OK. That sounds encouraging and interesting.  Would you be able to outline this thorny problem and I will help if I can.

<Leslie> Thanks Bob.  It relates to a big issue that my organisation is stuck with – managing urgent admissions.  The problem is that very often there is no bed available, but there is no predictability to that.  It feels like a lottery; a quality and safety lottery.  The clinicians are clamoring for “more beds” but the commissioners are saying “there is no more money“.  So the focus has turned to reducing length of stay.

<Bob> OK.  A focus on length of stay sounds reasonable.  Reducing that can free up enough beds to provide the necessary space-capacity resilience to dramatically improve the service quality.  So long as you don’t then close all the “empty” beds to save money, or fall into the trap of believing that 85% average bed occupancy is the “optimum”.

<Leslie> Yes, I know.  We have explored all of these topics before.  That is not the problem.

<Bob> OK. What is the problem?

<Leslie> The problem is demonstrating objectively that the length-of-stay reduction experiments are having a beneficial impact.  The data seems to say they they are, and the senior managers are trumpeting the success, but the people on the ground say they are not. We have hit a stalemate.


<Bob> Ah ha!  That old chestnut.  So, can I first ask what happens to the patients who cannot get a bed urgently?

<Leslie> Good question.  We have mapped and measured that.  What happens is the most urgent admission failures spill over to commercial service providers, who charge a fee-per-case and we have no choice but to pay it.  The Director of Finance is going mental!  The less urgent admission failures just wait on queue-in-the-community until a bed becomes available.  They are the ones who are complaining the most, so the Director of Governance is also going mental.  The Director of Operations is caught in the cross-fire and the Chief Executive and Chair are doing their best to calm frayed tempers and to referee the increasingly toxic arguments.

<Bob> OK.  I can see why a “Reduce Length of Stay Initiative” would tick everyone’s Nice If box.  So, the data analysts are saying “the length of stay has come down since the Initiative was launched” but the teams on the ground are saying “it feels the same to us … the beds are still full and we still cannot admit patients“.

<Leslie> Yes, that is exactly it.  And everyone has come to the conclusion that demand must have increased so it is pointless to attempt to reduce length of stay because when we do that it just sucks in more work.  They are feeling increasingly helpless and hopeless.

<Bob> OK.  Well, the “chronic backlog of unmet need” issue is certainly possible, but your data will show if admissions have gone up.

<Leslie> I know, and as far as I can see they have not.

<Bob> OK.  So I’m guessing that the next explanation is that “the data is wonky“.

<Leslie> Yup.  Spot on.  So, to counter that the Information Department has embarked on a massive push on data collection and quality control and they are adamant that the data is complete and clean.

<Bob> OK.  So what is your diagnosis?

<Leslie> I don’t have one, that’s why I emailed you.  I’m stuck.


<Bob> OK.  We need a diagnosis, and that means we need to take a “history” and “examine” the process.  Can you tell me the outline of the RLoS Initiative.

<Leslie> We knew that we would need a baseline to measure from so we got the historical admission and discharge data and plotted a Diagnostic Vitals Chart®.  I have learned something from my HCSE training!  Then we planned the implementation of a visual feedback tool that would show ward staff which patients were delayed so that they could focus on “unblocking” the bottlenecks.  We then planned to measure the impact of the intervention for three months, and then we planned to compare the average length of stay before and after the RLoS Intervention with a big enough data set to give us an accurate estimate of the averages.  The data showed a very obvious improvement, a highly statistically significant one.

<Bob> OK.  It sounds like you have avoided the usual trap of just relying on subjective feedback, and now have a different problem because your objective and subjective feedback are in disagreement.

<Leslie> Yes.  And I have to say, getting stuck like this has rather dented my confidence.

<Bob> Fear not Leslie.  I said this is an “old chestnut” and I can say with 100% confidence that you already have what you need in your T4 kit bag?

<Leslie>Tee-Four?

<Bob> Sorry, a new abbreviation. It stands for “theory, techniques, tools and training“.

<Leslie> Phew!  That is very reassuring to hear, but it does not tell me what to do next.

<Bob> You are an engineer now Leslie, so you need to don the hard-hat of Improvement-by-Design.  Start with your Needs Analysis.


<Leslie> OK.  I need a trustworthy tool that will tell me if the planned intervention has has a significant impact on length of stay, for better or worse or not at all.  And I need it to tell me that quickly so I can decide what to do next.

<Bob> Good.  Now list all the things that you currently have that you feel you can trust.

<Leslie> I do actually trust that the Information team collect, store, verify and clean the raw data – they are really passionate about it.  And I do trust that the front line teams are giving accurate subjective feedback – I work with them and they are just as passionate.  And I do trust the systems engineering “T4” kit bag – it has proven itself again-and-again.

<Bob> Good, and I say that because you have everything you need to solve this, and it sounds like the data analysis part of the process is a good place to focus.

<Leslie> That was my conclusion too.  And I have looked at the process, and I can’t see a flaw. It is driving me nuts!

<Bob> OK.  Let us take a different tack.  Have you thought about designing the tool you need from scratch?

<Leslie> No. I’ve been using the ones I already have, and assume that I must be using them incorrectly, but I can’t see where I’m going wrong.

<Bob> Ah!  Then, I think it would be a good idea to run each of your tools through a verification test and check that they are fit-4-purpose in this specific context.

<Leslie> OK. That sounds like something I haven’t covered before.

<Bob> I know.  Designing verification test-rigs is part of the Level 2 training.  I think you have demonstrated that you are ready to take the next step up the HCSE learning curve.

<Leslie> Do you mean I can learn how to design and build my own tools?  Special tools for specific tasks?

<Bob> Yup.  All the techniques and tools that you are using now had to be specified, designed, built, verified, and validated. That is why you can trust them to be fit-4-purpose.

<Leslie> Wooohooo! I knew it was a good idea to give you a call.  Let’s get started.


[Postscript] And Leslie, together with the other stakeholders, went on to design the tool that they needed and to use the available data to dissolve the stalemate.  And once everyone was on the same page again they were able to work collaboratively to resolve the flow problems, and to improve the safety, flow, quality and affordability of their service.  Oh, and to know for sure that they had improved it.

O.O.D.A.

OODA is something we all do thousands of times a day without noticing.

Observe – Orient – Decide – Act.

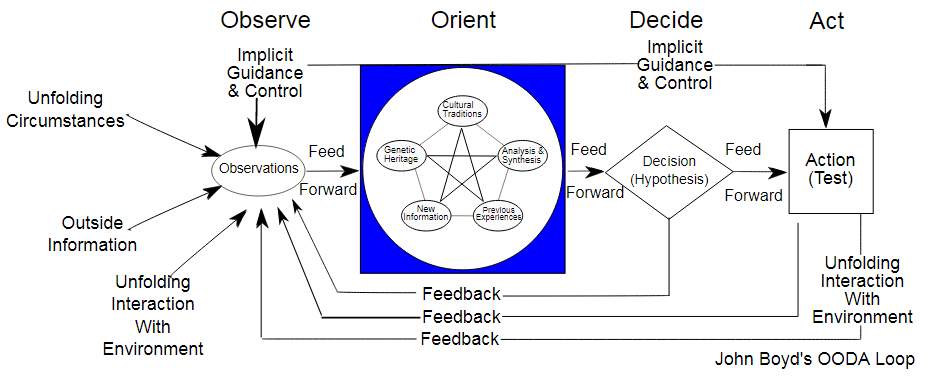
The term is attributed to Colonel John Boyd, a real world “Top Gun” who studied economics and engineering, then flew and designed fighter planes, then became a well-respected military strategist.

OODA is a continuous process of updating our mental model based on sensed evidence.

And it is a fast process because happens largely out of awareness.

This was Boyd’s point: In military terms, the protagonist that can make wiser and faster decisions are more likely to survive in combat.


And notice that it is not a simple linear sequence … it is a system … there are parallel paths and both feed-forward and feed-backward loops … there are multiple information flow paths.

And notice that the Implicit Guidance & Control links do not go through Decision – this means they operate out of awareness and are much faster.

And notice the Feed Forward links link the OODA steps – this is the conscious, sequential, future looking process that we know by another name:

Study-Adjust-Plan-Do.


We use the same process in medicine: first we study the patient and the problem they are presenting (history, examination, investigation), then we adjust our generic mental model of how the body works to the specific patient (diagnosis), then we plan and decide a course of action to achieve the intended outcome, and then we act, we do it (treatment).

But at any point we can jump back to an earlier step and we can jump forwards to a later one.  The observe, orient, decide, act modes are running in parallel.

And the more experience we have of similar problems the faster we can complete the OODA (or SAPD) work because we learn what is the most useful information to attend to, and we learn how to interpret it.

We learn the patterns and what to look for – and that speeds up the process – a lot!


This emergent learning is then re-inforced if the impact of our action matches our intent and prediction and our conscious learning is then internalised as unconscious “rules of thumb” called heuristics.


We start by thinking our way consciously and slowly … and … we finish by feeling our way unconsciously and quickly.


Until … we  encounter a novel problem that does not fit any of our learned pattern matching neural templates. When that happens, our unconscious, parallel processing, pattern-matching system alerts us with a feeling of confusion and bewilderment – and we freeze (often with fright!)

Now we have a choice: We can retreat to using familiar, learned, reactive, knee-jerk patterns of behaviour (presumably in the hope that they will work) or we can switch into a conscious learning loop and start experimenting with novel ideas.

If we start at Hypothesis then we have the Plan-Do-Study-Act cycle; where we generate novel hypotheses to explain the unexpected, and we then plan experiments to test our hypotheses; and we then study the outcome of the experiments and we then we act on our conclusions.

This mindful mode of thinking is well described in the book “Managing the Unexpected” by Weick and Sutcliffe and is the behaviour that underpins the success of HROs – High Reliability Organisations.

The image is of the latest (3rd edition) but the previous (2nd edition) is also worth reading.

So we have two interdependent problem solving modes – the parallel OODA system and the sequential SAPD process.

And we can switch between them depending on the context.


Which is an effective long-term survival strategy because the more we embrace the unexpected, the more opportunities we will have to switch into exploration mode and learn new patterns; and the more patterns we recognise the more efficient and effective our unconscious decision-making process will become.

This complex adaptive system behaviour has another name … Resilience.

The Storyboard

This week about thirty managers and clinicians in South Wales conducted two experiments to test the design of the Flow Design Practical Skills One Day Workshop.

Their collective challenge was to diagnose and treat a “chronically sick” clinic and the majority had no prior exposure to health care systems engineering (HCSE) theory, techniques, tools or training.

Two of the group, Chris and Jat, had been delegates at a previous ODWS, and had then completed their Level-1 HCSE training and real-world projects.

They had seen it and done it, so this experiment was to test if they could now teach it.

Could they replicate the “OMG effect” that they had experienced and that fired up their passion for learning and using the science of improvement?

Continue reading “The Storyboard”

The Pathology of Variation I

In medical training we have to learn about lots of things. That is one reason why it takes a long time to train a competent and confident clinician.

First, we learn the anatomy (structure) and the physiology (function) of the normal, healthy human.

Then we learn about how this amazingly complicated system can go wrong.  We learn about pathology.  And we do that so that we understand the relationship between the cause (disease) and the effect (symptoms and signs).

Then we learn about diagnostics – which is how to work backwards from the effects to the most likely cause(s).

And only then can we learn about therapeutics – the design and delivery of a treatment plan that we are confident will relieve the symptoms by curing the disease.

And we learn about prevention – how to avoid some illnesses (and delay others) by addressing the root causes earlier.  Much of the increase in life expectancy over the last 200 years has come from prevention, not from cure.


The NHS is an amazingly complicated system, and it too can go wrong.  It can exhibit a wide spectrum of symptoms and signs; medical errors, long delays, unhappy patients, burned-out staff, and overspent budgets.

But, there is no equivalent training in how to diagnose and treat a sick health care system.  And this is not acceptable, especially given that the knowledge of how to do this is already available.

It is called complex adaptive systems engineering (CASE).


Before the Renaissance, the understanding of how the body works was primitive and it was believed that illness was “God’s Will” so we had to just grin-and-bear (and pray).

The Scientific Revolution brought us new insights, profound theories, innovative techniques and capability-extending tools.  And the impact has been dramatic.  Those who do have access to this knowledge live better and longer than ever.  Those who do not … do not.

Our current understanding of how health care systems work is, to be blunt, medieval.  The current approaches amount to little more than rune reading, incantations and the prescription of purgatives and leeches.  And the impact is about as effective.

So we need to study the anatomy, physiology, pathology, diagnostics and therapeutics of complex adaptive systems like healthcare.  And most of all we need to understand how to prevent catastrophes happening in the first place.  We need the NHS to be immortal.


And this week a prototype complex adaptive pathology training system was tested … and it employed cutting-edge 21st Century technology: Pasta Twizzles.

The specific topic under scrutiny was variation.  A brain-bending concept that is usually relegated to the mystical smoke-and-mirrors world called “Sadistics”.

But no longer!

The Mists-of-Jargon and Fog-of-Formulae were blown away as we switched on the Fan-of-Facilitation and the Light-of-Simulation and went exploring.

Empirically. Pragmatically.


And what we discovered was jaw-dropping.

A disease called the “Flaw of Averages” and its malignant manifestation “Carveoutosis“.


And with our new knowledge we opened the door to a previously hidden world of opportunity and improvement.

Then we activated the Laser-of-Insight and evaporated the queues and chaos that, before our new understanding, we had accepted as inevitable and beyond our understanding or control.

They were neither. And never had been. We were deluding ourselves.

Welcome to the Resilient Design – Practical Skills – One Day Workshop.

Validation Test: Passed.

Dr Hyde and Mr Jekyll

Dr Bill Hyde was already at the bar when Bob Jekyll arrived.

Bill and  Bob had first met at university and had become firm friends, but their careers had diverged and it was only by pure chance that their paths had crossed again recently.

They had arranged to meet up for a beer and to catch up on what had happened in the 25 years since they had enjoyed the “good old times” in the university bar.

<Dr Bill> Hi Bob, what can I get you? If I remember correctly it was anything resembling real ale. Will this “Black Sheep” do?

<Bob> Hi Bill, Perfect! I’ll get the nibbles. Plain nuts OK for you?

<Dr Bill> My favourite! So what are you up to now? What doors did your engineering degree open?

<Bob> Lots!  I’ve done all sorts – mechanical, electrical, software, hardware, process, all except civil engineering. And I love it. What I do now is a sort of synthesis of all of them.  And you? Where did your medical degree lead?

<Dr Bill> To my hearts desire, the wonderful Mrs Hyde, and of course to primary care. I am a GP. I always wanted to be a GP since I was knee-high to a grasshopper.

<Bob> Yes, you always had that “I’m going to save the world one patient at a time!” passion. That must be so rewarding! Helping people who are scared witless by the health horror stories that the media pump out.  I had a fright last year when I found a lump.  My GP was great, she confidently diagnosed a “hernia” and I was all sorted in a matter of weeks with a bit of nifty day case surgery. I was convinced my time had come. It just shows how damaging the fear of the unknown can be!

<Dr Bill> Being a GP is amazingly rewarding. I love my job. But …

<Bob> But what? Are you alright Bill? You suddenly look really depressed.

<Dr Bill> Sorry Bob. I don’t want to be a damp squib. It is good to see you again, and chat about the old days when we were teased about our names.  And it is great to hear that you are enjoying your work so much. I admit I am feeling low, and frankly I welcome the opportunity to talk to someone I know and trust who is not part of the health care system. If you know what I mean?

<Bob> I know exactly what you mean.  Well, I can certainly offer an ear, “a problem shared is a problem halved” as they say. I can’t promise to do any more than that, but feel free to tell me the story, from the beginning. No blood-and-guts gory details though please!

<Dr Bill> Ha! “Tell me the story from the beginning” is what I say to my patients. OK, here goes. I feel increasingly overwhelmed and I feel like I am drowning under a deluge of patients who are banging on the practice door for appointments to see me. My intuition tells me that the problem is not the people, it is the process, but I can’t seem to see through the fog of frustration and chaos to a clear way forward.

<Bob> OK. I confess I know nothing about how your system works, so can you give me a bit more context.

<Dr Bill> Sorry. Yes, of course. I am what is called a single-handed GP and I have a list of about 1500 registered patients and I am contracted to provide primary care for them. I don’t have to do that 24 x 7, the urgent stuff that happens in the evenings and weekends is diverted to services that are designed for that. I work Monday to Friday from 9 AM to 5 PM, and I am contracted to provide what is needed for my patients, and that means face-to-face appointments.

<Bob> OK. When you say “contracted” what does that mean exactly?

<Dr Bill> Basically, the St. Elsewhere’s® Practice is like a small business. It’s annual income is a fixed amount per year for each patient on the registration list, and I have to provide the primary care service for them from that pot of cash. And that includes all the costs, including my income, our practice nurse, and the amazing Mrs H. She is the practice receptionist, manager, administrator and all-round fixer-of-anything.

<Bob> Wow! What a great design. No need to spend money on marketing, research, new product development, or advertising! Just 100% pure service delivery of tried-and-tested medical know-how to a captive audience for a guaranteed income. I have commercial customers who would cut off their right arms for an offer like that!

<Dr Bill> Really? It doesn’t feel like that to me. It feels like the more I offer, the more the patients expect. The demand is a bottomless well of wants, but the income is capped and my time is finite!

<Bob> H’mm. Tell me more about the details of how the process works.

<Dr Bill> Basically, I am a problem-solving engine. Patients phone for an appointment, Mrs H books one, the patient comes at the appointed time, I see them, and I diagnose and treat the problem, or I refer on to a specialist if it’s more complicated. That’s basically it.

<Bob> OK. Sounds a lot simpler than 99% of the processes that I’m usually involved with. So what’s the problem?

<Dr Bill> I don’t have enough capacity! After all the appointments for the day are booked Mrs H has to say “Sorry, please try again tomorrow” to every patient who phones in after that.  The patients who can’t get an appointment are not very happy and some can get quite angry. They are anxious and frustrated and I fully understand how they feel. I feel the same.

<Bob> We will come back to what you mean by “capacity”. Can you outline for me exactly how a patient is expected to get an appointment?

<Dr Bill> We tell them to phone at 8 AM for an appointment, there is a fixed number of bookable appointments, and it is first-come-first-served.  That is the only way I can protect myself from being swamped and is the fairest solution for patients.  It wasn’t my idea; it is called Advanced Access. Each morning at 8 AM we switch on the phones and brace ourselves for the daily deluge.

<Bob> You must be pulling my leg! This design is a batch-and-queue phone-in appointment booking lottery!  I guess that is one definition of “fair”.  How many patients get an appointment on the first attempt?

<Dr Bill> Not many.  The appointments are usually all gone by 9 AM and a lot are to people who have been trying to get one for several days. When they do eventually get to see me they are usually grumpy and then spring the trump card “And while I’m here doctor I have a few other things that I’ve been saving up to ask you about“. I help if I can but more often than not I have to say, “I’m sorry, you’ll have to book another appointment!“.

<Bob> I’m not surprised you patients are grumpy. I would be too. And my recollection of seeing my GP with my scary lump wasn’t like that at all. I phoned at lunch time and got an appointment the same day. Maybe I was just lucky, or maybe my GP was as worried as me. But it all felt very calm. When I arrived there was only one other patient waiting, and I was in and out in less than ten minutes – and mightily reassured I can tell you! It felt like a high quality service that I could trust if-and-when I needed it, which fortunately is very infrequently.

<Dr Bill> I dream of being able to offer a service like that! I am prepared to bet you are registered with a group practice and you see whoever is available rather than your own GP. Single-handed GPs like me who offer the old fashioned personal service are a rarity, and I can see why. We must be suckers!

<Bob> OK, so I’m starting to get a sense of this now. Has it been like this for a long time?

<Dr Bill> Yes, it has. When I was younger I was more resilient and I did not mind going the extra mile.  But the pressure is relentless and maybe I’m just getting older and grumpier.  My real fear is I end up sounding like the burned-out cynics that I’ve heard at the local GP meetings; the ones who crow about how they are counting down the days to when they can retire and gloat.

<Bob> You’re the same age as me Bill so I don’t think either of us can use retirement as an exit route, and anyway, that’s not your style. You were never a quitter at university. Your motto was always “when the going gets tough the tough get going“.

<Dr Bill> Yeah I know. That’s why it feels so frustrating. I think I lost my mojo a long time back. Maybe I should just cave in and join up with the big group practice down the road, and accept the inevitable loss of the personal service. They said they would welcome me, and my list of 1500 patients, with open arms.

<Bob> OK. That would appear to be an option, or maybe a compromise, but I’m not sure we’ve exhausted all the other options yet.  Tell me, how do you decide how long a patient needs for you to solve their problem?

<Dr Bill> That’s easy. It is ten minutes. That is the time recommended in the Royal College Guidelines.

<Bob> Eh? All patients require exactly ten minutes?

<Dr Bill> No, of course not!  That is the average time that patients need.  The Royal College did a big survey and that was what most GPs said they needed.

<Bob> Please tell me if I have got this right.  You work 9-to-5, and you carve up your day into 10-minute time-slots called “appointments” and, assuming you are allowed time to have lunch and a pee, that would be six per hour for seven hours which is 42 appointments per day that can be booked?

<Dr Bill> No. That wouldn’t work because I have other stuff to do as well as see patients. There are only 25 bookable 10-minute appointments per day.

<Bob> OK, that makes more sense. So where does 25 come from?

<Dr Bill> Ah! That comes from a big national audit. For an average GP with and average  list of 1,500 patients, the average number of patients seeking an appointment per day was found to be 25, and our practice population is typical of the national average in terms of age and deprivation.  So I set the upper limit at 25. The workload is manageable but it seems to generate a lot of unhappy patients and I dare not increase the slots because I’d be overwhelmed with the extra workload and I’m barely coping now.  I feel stuck between a rock and a hard place!

<Bob> So you have set the maximum slot-capacity to the average demand?

<Dr Bill> Yes. That’s OK isn’t it? It will average out over time. That is what average means! But it doesn’t feel like that. The chaos and pressure never seems to go away.


There was a long pause while Bob mulls over what he had heard, sips his pint of Black Sheep and nibbles on the dwindling bowl of peanuts.  Eventually he speaks.


<Bob> Bill, I have some good news and some not-so-good news and then some more good news.

<Dr Bill> Oh dear, you sound just like me when I have to share the results of tests with one of my patients at their follow up appointment. You had better give me the “bad news sandwich”!

<Bob> OK. The first bit of good news is that this is a very common, and easily treatable flow problem.  The not-so-good news is that you will need to change some things.  The second bit of good news is that the changes will not cost anything and will work very quickly.

<Dr Bill> What! You cannot be serious!! Until ten minutes ago you said that you knew nothing about how my practice works and now you are telling me that there is a quick, easy, zero cost solution.  Forgive me for doubting your engineering know-how but I’ll need a bit more convincing than that!

<Bob> And I would too if I were in your position.  The clues to the diagnosis are in the story. You said the process problem was long-standing; you said that you set the maximum slot-capacity to the average demand; and you said that you have a fixed appointment time that was decided by a subjective consensus.  From an engineering perspective, this is a perfect recipe for generating chronic chaos, which is exactly the symptoms you are describing.

<Dr Bill> Is it? OMG. You said this is well understood and resolvable? So what do I do?

<Bob> Give me a minute.  You said the average demand is 25 per day. What sort of service would you like your patients to experience? Would “90% can expect a same day appointment on the first call” be good enough as a starter?

<Dr Bill> That would be game changing!  Mrs H would be over the moon to be able to say “Yes” that often. I would feel much less anxious too, because I know the current system is a potentially dangerous lottery. And my patients would be delighted and relieved to be able to see me that easily and quickly.

<Bob> OK. Let me work this out. Based on what you’ve said, some assumptions, and a bit of flow engineering know-how; you would need to offer up to 31 appointments per day.

<Dr Bill> What! That’s impossible!!! I told you it would be impossible! That would be another hour a day of face-to-face appointments. When would I do the other stuff? And how did you work that out anyway?

<Bob> I did not say they would have to all be 10-minute appointments, and I did not say you would expect to fill them all every day. I did however say you would have to change some things.  And I did say this is a well understood flow engineering problem.  It is called “resilience design“. That’s how I was able to work it out on the back of this Black Sheep beer mat.

<Dr Bill> H’mm. That is starting to sound a bit more reasonable. What things would I have to change? Specifically?

<Bob> I’m not sure what specifically yet.  I think in your language we would say “I have taken a history, and I have a differential diagnosis, so next I’ll need to examine the patient, and then maybe do some tests to establish the actual diagnosis and to design and decide the treatment plan“.

<Dr Bill> You are learning the medical lingo fast! What do I need to do first? Brace myself for the forensic rubber-gloved digital examination?

<Bob> Alas, not yet and certainly not here. Shall we start with the vital signs? Height, weight, pulse, blood pressure, and temperature? That’s what my GP did when I went with my scary lump.  The patient here is not you, it is your St. Elsewhere’s® Practice, and we will need to translate the medical-speak into engineering-speak.  So one thing you’ll need to learn is a bit of the lingua-franca of systems engineering.  By the way, that’s what I do now. I am a systems engineer, or maybe now a health care systems engineer?

<Dr Bill> Point me in the direction of the HCSE dictionary! The next round is on me. And the nuts!

<Bob> Excellent. I’ll have another Black Sheep and some of those chilli-coated ones. We have work to do.  Let me start by explaining what “capacity” actually means to an engineer. Buckle up. This ride might get a bit bumpy.


This story is fictional, but the subject matter is factual.

Bob’s diagnosis and recommendations are realistic and reasonable.

Chapter 1 of the HCSE dictionary can be found here.

And if you are a GP who recognises these “symptoms” then this may be of interest.

“Houston, we have a problem!”

The immortal words from Apollo 13 that alerted us to an evolving catastrophe …

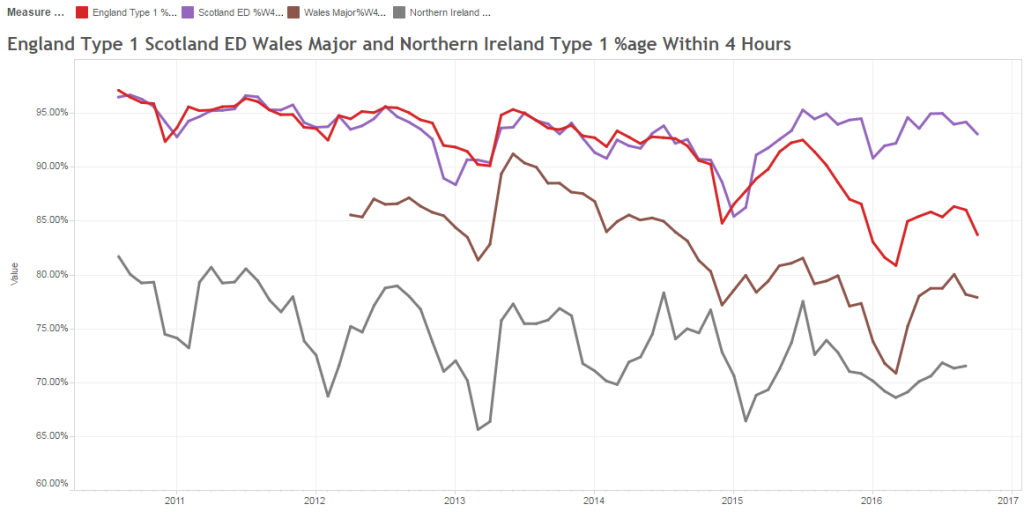
… and that is what we are seeing in the UK health and social care system … using the thermometer of A&E 4-hour performance. England is the red line.

uk_ae_runchart

The chart shows that this is not a sudden change, it has been developing over quite a long period of time … so why does it feel like an unpleasant surprise?


One reason may be that NHS England is using performance management techniques that were out of date in the 1980’s and are obsolete in the 2010’s!

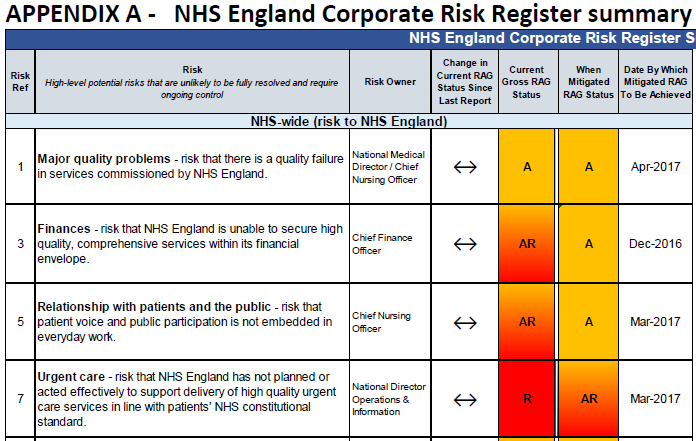
Let me show you what I mean. This is a snapshot from the NHS England Board Minutes for November 2016.

nhse_rag_nov_2016
RAG stands for Red-Amber-Green and what we want to see on a Risk Assessment is Green for the most important stuff like safety, flow, quality and affordability.

We are not seeing that.  We are seeing Red/Amber for all of them. It is an evolving catastrophe.

A risk RAG chart is an obsolete performance management tool.

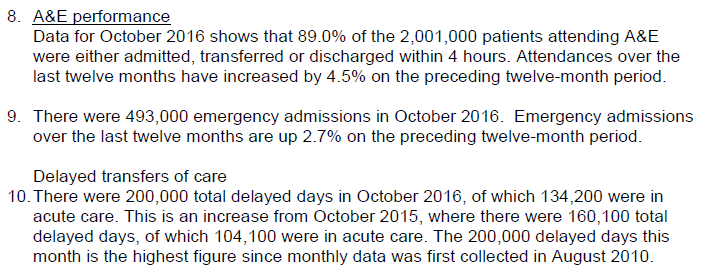
Here is another snippet …

nhse_ae_nov_2016

This demonstrates the usual mix of single point aggregates for the most recent month (October 2016); an arbitrary target (4 hours) used as a threshold to decide failure/not failure; two-point comparisons (October 2016 versus October 2015); and a sprinkling of ratios. Not a single time-series chart in sight. No pictures that tell a story.

Click here for the full document (which does also include some very sensible plans to maintain hospital flow through the bank holiday period).

The risk of this way of presenting system performance data is that it is a minefield of intuitive traps for the unwary.  Invisible pitfalls that can lead to invalid conclusions, unwise decisions, potentially ineffective and/or counter-productive actions, and failure to improve. These methods are risky and that is why they should be obsolete.

And if NHSE is using obsolete tools than what hope do CCGs and Trusts have?


Much better tools have been designed.  Tools that are used by organisations that are innovative, resilient, commercially successful and that deliver safety, on-time delivery, quality and value for money. At the same time.

And they are obsolete outside the NHS because in the competitive context of the dog-eat-dog real world, organisations do not survive if they do not innovate, improve and learn as fast as their competitors.  They do not have the luxury of being shielded from reality by having a central tax-funded monopoly!

And please do not misinterpret my message here; I am a 100% raving fan of the NHS ethos of “available to all and free at the point of delivery” and an NHS that is funded centrally and fairly. That is not my issue.

My issue is the continued use of obsolete performance management tools in the NHS.


Q: So what are the alternatives? What do the successful commercial organisations use instead?

A: System behaviour charts.

SBCs are pictures of how the system is behaving over time – pictures that tell a story – pictures that have meaning – pictures that we can use to diagnose, design and deliver a better outcome than the one we are heading towards.

Pictures like the A&E performance-over-time chart above.

Click here for more on how and why.


Therefore, if the DoH, NHSE, NHSI, STPs, CCGs and Trust Boards want to achieve their stated visions and missions then the writing-on-the-wall says that they will need to muster some humility and learn how successful organisations do this.

This is not a comfortable message to hear and it is easier to be defensive than receptive.

The NHS has to change if it wants to survive and continue serve the people who pay the salaries. And time is running out. Continuing as we are is not an option. Complaining and blaming are not options. Doing nothing is not an option.

Learning is the only option.

Anyone can learn to use system behaviour charts.  No one needs to rely on averages, two-point comparisons, ratios, targets, and the combination of failure-metrics and us-versus-them-benchmarking that leads to the chronic mediocrity trap.

And there is hope for those with enough hunger, humility and who are prepared to do the hard-work of developing their personal, team, department and organisational capability to use better management methods.


Apollo 13 is a true story.  The catastrophe was averted.  The astronauts were brought home safely.  The film retells the story of how that miracle was achieved. Perhaps watching the whole film would be somewhere to start, because it holds many valuable lessons for us all – lessons on how effective teams behave.

Outliers

reading_a_book_pa_150_wht_3136An effective way to improve is to learn from others who have demonstrated the capability to achieve what we seek.  To learn from success.

Another effective way to improve is to learn from those who are not succeeding … to learn from failures … and that means … to learn from our own failings.

But from an early age we are socially programmed with a fear of failure.

The training starts at school where failure is not tolerated, nor is challenging the given dogma.  Paradoxically, the effect of our fear of failure is that our ability to inquire, experiment, learn, adapt, and to be resilient to change is severely impaired!

So further failure in the future becomes more likely, not less likely. Oops!


Fortunately, we can develop a healthier attitude to failure and we can learn how to harness the gap between intent and impact as a source of energy, creativity, innovation, experimentation, learning, improvement and growing success.

And health care provides us with ample opportunities to explore this unfamiliar terrain. The creative domain of the designer and engineer.


The scatter plot below is a snapshot of the A&E 4 hr target yield for all NHS Trusts in England for the month of July 2016.  The required “constitutional” performance requirement is better than 95%.  The delivered whole system average is 85%.  The majority of Trusts are failing, and the Trust-to-Trust variation is rather wide. Oops!

This stark picture of the gap between intent (95%) and impact (85%) prompts some uncomfortable questions:

Q1: How can one Trust achieve 98% and yet another can do no better than 64%?

Q2: What can all Trusts learn from these high and low flying outliers?

[NB. I have not asked the question “Who should we blame for the failures?” because the name-shame-blame-game is also a predictable consequence of our fear-of-failure mindset.]


Let us dig a bit deeper into the information mine, and as we do that we need to be aware of a trap:

A snapshot-in-time tells us very little about how the system and the set of interconnected parts is behaving-over-time.

We need to examine the time-series charts of the outliers, just as we would ask for the temperature, blood pressure and heart rate charts of our patients.

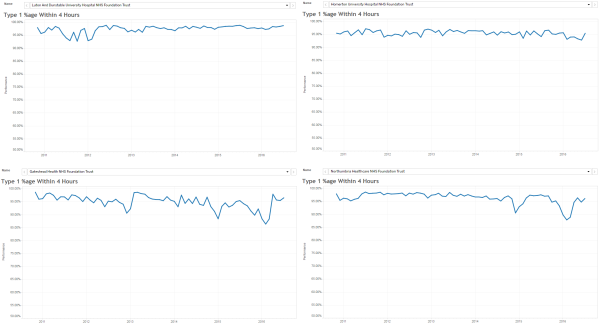
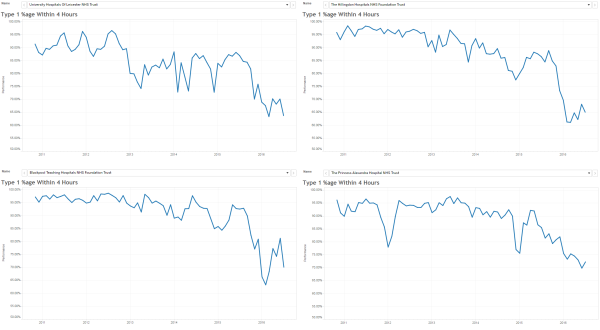
Here are the last six years by month A&E 4 hr charts for a sample of the high-fliers. They are all slightly different and we get the impression that the lower two are struggling more to stay aloft more than the upper two … especially in winter.


And here are the last six years by month A&E 4 hr charts for a sample of the low-fliers.  The Mark I Eyeball Test results are clear … these swans are falling out of the sky!


So we need to generate some testable hypotheses to explain these visible differences, and then we need to examine the available evidence to test them.

One hypothesis is “rising demand”.  It says that “the reason our A&E is failing is because demand on A&E is rising“.

Another hypothesis is “slow flow”.  It says that “the reason our A&E is failing is because of the slow flow through the hospital because of delayed transfers of care (DTOCs)“.

So, if these hypotheses account for the behaviour we are observing then we would predict that the “high fliers” are (a) diverting A&E arrivals elsewhere, and (b) reducing admissions to free up beds to hold the DTOCs.

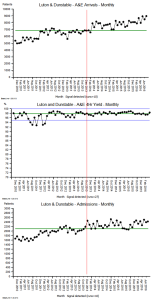
Let us look at the freely available data for the highest flyer … the green dot on the scatter gram … code-named “RC9”.

The top chart is the A&E arrivals per month.

The middle chart is the A&E 4 hr target yield per month.

The bottom chart is the emergency admissions per month.

Both arrivals and admissions are increasing, while the A&E 4 hr target yield is rock steady!

And arranging the charts this way allows us to see the temporal patterns more easily (and the images are deliberately arranged to show the overall pattern-over-time).

Patterns like the change-for-the-better that appears in the middle of the winter of 2013 (i.e. when many other trusts were complaining that their sagging A&E performance was caused by “winter pressures”).

The objective evidence seems to disprove the “rising demand”, “slow flow” and “winter pressure” hypotheses!

So what can we learn from our failure to adequately explain the reality we are seeing?


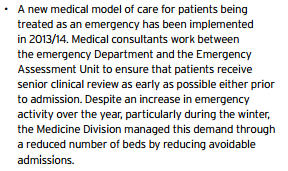
The trust code-named “RC9” is Luton and Dunstable, and it is an average district general hospital, on the surface.  So to reveal some clues about what actually happened there, we need to read their Annual Report for 2013-14.  It is a public document and it can be downloaded here.

This is just a snippet …

… and there are lots more knowledge nuggets like this in there …

… it is a treasure trove of well-known examples of good system flow design.

The results speak for themselves!


Q: How many black swans does it take to disprove the hypothesis that “all swans are white”.

A: Just one.

“RC9” is a black swan. An outlier. A positive deviant. “RC9” has disproved the “impossibility” hypothesis.

And there is another flock of black swans living in the North East … in the Newcastle area … so the “Big cities are different” hypothesis does not hold water either.


The challenge here is a human one.  A human factor.  Our learned fear of failure.

Learning-how-to-fail is the way to avoid failing-how-to-learn.

And to read more about that radical idea I strongly recommend reading the recently published book called Black Box Thinking by Matthew Syed.

It starts with a powerful story about the impact of human factors in health care … and here is a short video of Martin Bromiley describing what happened.

The “black box” that both Martin and Matthew refer to is the one that is used in air accident investigations to learn from what happened, and to use that learning to design safer aviation systems.

Martin Bromiley has founded a charity to support the promotion of human factors in clinical training, the Clinical Human Factors Group.

So if we can muster the courage and humility to learn how to do this in health care for patient safety, then we can also learn to how do it for flow, quality and productivity.

Our black swan called “RC9” has demonstrated that this goal is attainable.

And the body of knowledge needed to do this already exists … it is called Health and Social Care Systems Engineering (HSCSE).


For more posts like this please vote here.
For more information please subscribe here.
To email the author please click here.


Postscript: And I am pleased to share that Luton & Dunstable features in the House of Commons Health Committee report entitled Winter Pressures in A&E Departments that was published on 3rd Nov 2016.

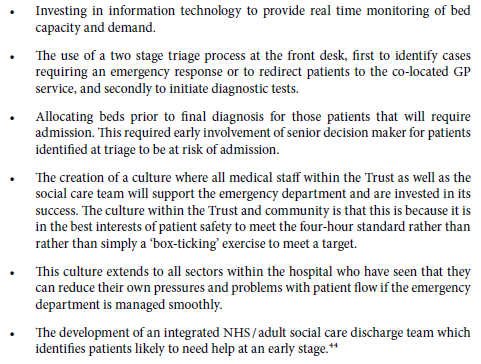
Here is part of what L&D shared to explain their deviant performance:

luton_nuggets

These points describe rather well the essential elements of a pull design, which is the antidote to the rather more prevalent pressure cooker design.

Crash Test Dummy

CrashTestDummyThere are two complementary approaches to safety and quality improvement: desire and design.

In the improvement-by-desire world we use a suck-it-and-see approach to fix a problem.  It is called PDSA.

Sometimes this works and we pat ourselves on the back, and remember the learning for future use.

Sometimes it works for us but has a side effect: it creates a problem for someone else.  And we may not be aware of the unintended consequence unless someone shouts “Oi!” It may be too late by then of course.


The more parts in a system, and the more interconnected they are, the more likely it is that a well-intended suck-it-and-see change will create an unintended negative impact.

And in that situation our temptation is to … do nothing … and put up with the problems. It seems the safest option.


In the improvement-by-design world we choose to study first, and to find the causal roots of the system behaviour we are seeing.  Our first objective is a diagnosis.

With that we can propose rational design changes that we anticipate will deliver the improvement we seek without creating adverse effects.

But we have learned the hard way that our intuition can trick us … so we need a way to test our designs … a safe and controlled way.  We need a crash test dummy!


What they do is to deliberately experience our design in a controlled experiment, and what they generate for us is constructive feedback. What did work, and what did not.

A crash test dummy is tough and sensitive at the same time.  They do not break easily and yet they feel the pain and gain too.  They are resilient.


And with their feedback we can re-visit our design and improve it further, or we can use it to offer evidence-based assurance that our design is fit-for-purpose.

Safety and Quality Assurance is improvement-by-design. Diagnosis-and-treatment.

Safety and Quality Control is improvement-by-desire. Suck-and-see.

If you were a passenger or a patient … which option would you prefer?

Type II Error

figure_pointing_out_chart_data_150_clr_8005It was the time for Bob and Leslie’s regular Improvement Science coaching session.

<Leslie> Hi Bob, how are you today?

<Bob> I am getting over a winter cold but otherwise I am good.  And you?

<Leslie> I am OK and I need to talk something through with you because I suspect you will be able to help.

<Bob> OK. What is the context?

<Leslie> Well, one of the projects that I am involved with is looking at the elderly unplanned admission stream which accounts for less than half of our unplanned admissions but more than half of our bed days.

<Bob> OK. So what were you looking to improve?

<Leslie> We want to reduce the average length of stay so that we free up beds to provide resilient space-capacity to ease the 4-hour A&E admission delay niggle.

<Bob> That sounds like a very reasonable strategy.  So have you made any changes and measured any improvements?

<Leslie> We worked through the 6M Design® sequence. We studied the current system, diagnosed some time traps and bottlenecks, redesigned the ones we could influence, modified the system, and continued to measure to monitor the effect.

<Bob> And?

<Leslie> It feels better but the system behaviour charts do not show an improvement.

<Bob> Which charts, specifically?

<Leslie> The BaseLine XmR charts of average length of stay for each week of activity.

<Bob> And you locked the limits when you made the changes?

<Leslie> Yes. And there still were no red flags. So that means our changes have not had a significant effect. But it definitely feels better. Am I deluding myself?

<Bob> I do not believe so. Your subjective assessment is very likely to be accurate. Our Chimp OS 1.0 is very good at some things! I think the issue is with the tool you are using to measure the change.

<Leslie> The XmR chart?  But I thought that was THE tool to use?

<Bob> Like all tools it is designed for a specific purpose.  Are you familiar with the term Type II Error.

<Leslie> Doesn’t that come from research? I seem to remember that is the error we make when we have an under-powered study.  When our sample size is too small to confidently detect the change in the mean that we are looking for.

<Bob> A perfect definition!  The same error can happen when we are doing before and after studies too.  And when it does, we see the pattern you have just described: the process feels better but we do not see any red flags on our BaseLine© chart.

<Leslie> But if our changes only have a small effect how can it feel better?

<Bob> Because some changes have cumulative effects and we omit to measure them.

<Leslie> OMG!  That makes complete sense!  For example, if my bank balance is stable my average income and average expenses are balanced over time. So if I make a small-but-sustained improvement to my expenses, like using lower cost generic label products, then I will see a cumulative benefit over time to the balance, but not the monthly expenses; because the noise swamps the signal on that chart!

<Bob> An excellent analogy!

<Leslie> So the XmR chart is not the tool for this job. And if this is the only tool we have then we risk making a Type II error. Is that correct?

<Bob> Yes. We do still use an XmR chart first though, because if there is a big enough and fast enough shift then the XmR chart will reveal it.  If there is not then we do not give up just yet; we reach for our more sensitive shift detector tool.

<Leslie> Which is?

<Bob> I will leave you to ponder on that question.  You are a trained designer now so it is time to put your designer hat on and first consider the purpose of this new tool, and then create the outline a fit-for-purpose design.

<Leslie> OK, I am on the case!

Melting the Queue

custom_meter_15256[Drrrrrrring]

<Leslie> Hi Bob, I hope I am not interrupting you.  Do you have five minutes?

<Bob> Hi Leslie. I have just finished what I was working on and a chat would be a very welcome break.  Fire away.

<Leslie> I really just wanted to say how much I enjoyed the workshop this week, and so did all the delegates.  They have been emailing me to say how much they learned and thanking me for organising it.

<Bob> Thank you Leslie. I really enjoyed it too … and I learned lots … I always do.

<Leslie> As you know I have been doing the ISP programme for some time, and I have come to believe that you could not surprise me any more … but you did!  I never thought that we could make such a dramatic improvement in waiting times.  The queue just melted away and I still cannot really believe it.  Was it a trick?

<Bob> Ahhhh, the siren-call of the battle-hardened sceptic! It was no trick. What you all saw was real enough. There were no computers, statistics or smoke-and-mirrors used … just squared paper and a few coloured pens. You saw it with your own eyes; you drew the charts; you made the diagnosis; and you re-designed the policy.  All I did was provide the context and a few nudges.

<Leslie> I know, and that is why I think seeing the before and after data would help me. The process felt so much better, but I know I will need to show the hard evidence to convince others, and to convince myself as well, to be brutally honest.  I have the before data … do you have the after data?

<Bob> I do. And I was just plotting it as BaseLine charts to send to you.  So you have pre-empted me.  Here you are.

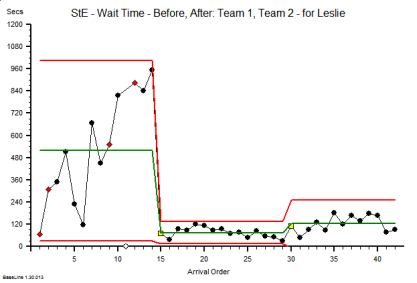
StE_OSC_Before_and_After
This is the waiting time run chart for the one stop clinic improvement exercise that you all did.  The leftmost segment is the before, and the rightmost are the after … your two ‘new’ designs.

As you say, the queue and the waiting has melted away despite doing exactly the same work with exactly the same resources.  Surprising and counter-intuitive but there is the evidence.

<Leslie> Wow! That fits exactly with how it felt.  Quick and calm! But I seem to remember that the waiting room was empty, particularly in the case of the design that Team 1 created. How come the waiting is not closer to zero on the chart?

<Bob> You are correct.  This is not just the time in the waiting room, it also includes the time needed to move between the rooms and the changeover time within the rooms.  It is what I call the ‘tween-time.

<Leslie> OK, that makes sense now.  And what also jumps out of the picture for me is the proof that we converted an unstable process into a stable one.  The chaos was calmed.  So what is the root cause of the difference between the two ‘after’ designs?

<Bob> The middle one, the slightly better of the two, is the one where all patients followed the newly designed process.  The rightmost one was where we deliberately threw a spanner in the works by assuming an unpredictable case mix.

<Leslie> Which made very little difference!  The new design was still much, much better than before.

<Bob> Yes. What you are seeing here is the footprint of resilient design. Do you believe it is possible now?

<Leslie> You bet I do!

The Slippery Slope From Calm To Chaos

figure_slipping_on_water_custom_sign_14210System behaviour is often rather variable over the short term.  We have ‘good’ days and ‘bad’ days and we weather the storm because we know the sun will shine again soon.

We are resilient and adaptable. And our memories are poor.

So when the short-term variation sits on top of a long-term trend then we do not feel the trend …

… because we are habituating. We do not notice that we are on a slippery slope.


And slippery slopes are more difficult to climb up than to slide down.


In organisational terms the slippery slope is from Calm to Chaos.  Success to Failure.  Competent to Incompetent. Complacent to  Contrite.  Top of the pops to top of the flops!

The primary reason for this is we are all part of a perpetual dynamic between context and content.  We are affected by the context we find ourselves in. We sense it and that influences our understanding, our decisions and our actions. These actions then change our context … nothing is ever the same.

So our hard-won success sows the seeds of its own failure … and unless we realise that then we are doomed to a boom-bust cycle.  To sustain success we must learn to constantly redefine our future and redesign our present.


If we do not then we are consigned to the Slippery Slope … and when we eventually accept that chaos has engulfed us then we may also discover that it may be late.  To leap from chaos to calm is VERY difficult without a deep understanding of how systems work … and if we had that wisdom then we would have avoided the slippery slope in the first place.


The good news is that there is hope … we can learn to climb out of the Swamp of Chaos … and we can develop our capability to scale the slippery slope from  Chaos through Complex, and then to Complicated, and finally back to Calm.  Organised complexity.

It requires effort and it takes time … but it is possible.

The “I am Great (and You are Not)” Trap

business_race__PA_150_wht_3222When we start the process of learning to apply the Science of Improvement in practice we need to start within our circle of influence.

It is just easier, quicker and safer to begin there – and to build our capability, experience and confidence in steps.

And when we get the inevitable ‘amazing’ result it is natural and reasonable for us to want to share the good news with others.  We crossed the finish line first and we want to celebrate.   And that is exactly what we need to do.


We just need to be careful how we do it.

We need to be careful not to unintentionally broadcast an “I am Great (and You are Not)” message – because if we do that we will make further change even more difficult.


Competition can be healthy or unhealthy  … just as scepticism can be.

We want to foster healthy competition … and to do that we have to do something that can feel counter-intuitive … we have to listen to our competitors; and we have to learn from them; and we have to share our discoveries with them.

Eh?


Just picture these two scenarios in your mind’s eye:

Scenario One: The competition is a war. There can only be one winner … the strongest, most daring, most cunning, most ruthless, most feared competitor. So secrecy and ingenuity are needed. Information must be hoarded. Untruths and confusion must be spread.

Scenario Two: The competition is a race. There can only be one winner … the strongest, most resilient, hardest working, fastest learning, most innovative, most admired competitor.  So openness and humility are needed. Information must be shared. Truths and clarity must be spread.

Compare the likely outcomes of the two scenarios.

Which one sounds the more productive, more rewarding and more enjoyable?


So the challenge for the champions of improvement is to appreciate and to practice a different version of the “I’m Great … ” mantra …

I’m Great (And So Are You).

V.U.T.

figure_pointing_out_chart_data_150_wht_8005It was the appointed time for the ISP coaching session and both Bob and Leslie were logged on and chatting about their Easter breaks.

<Bob> OK Leslie, I suppose we had better do some actual work, which seems a shame on such a wonderful spring day.

<Leslie> Yes, I suppose so. There is actually something I would like to ask you about because I came across it by accident and it looked very pertinent to flow design … but you have never mentioned it.

<Bob> That sounds interesting. What is it?

<Leslie> V.U.T.

<Bob> Ah ha!  You have stumbled across the Queue Theorists and the Factory Physicists.  So, what was your take on it?

<Leslie> Well it all sounded very impressive. The context is I was having a chat with a colleague who is also getting into the improvement stuff and who had been to a course called “Factory Physics for Managers” – and he came away buzzing about the VUT equation … and claimed that it explained everything!

<Bob> OK. So what did you do next?

<Leslie> I looked it up of course and I have to say the more I read the more confused I got. Maybe I am just a bid dim and not up to understanding this stuff.

<Bob> Well you are certainly not dim so your confusion must be caused by something else. Did your colleague describe how the VUT equation is applied in practice?

<Leslie> Um. No, I do not remember him describing an example – just that it explained why we cannot expect to run resources at 100% utilisation.

<Bob> Well he is correct on that point … though there is a bit more to it than that.  A more accurate statement is “We cannot expect our system to be stable if there is variation and we run flow-resources at 100% utilisation”.

<Leslie> Well that sounds just like the sort of thing we have been talking about, what you call “resilient design”, so what is the problem with the VUT equation?

<Bob> The problem is that it gives an estimate of the average waiting time in a very simple system called a G/G/1 system.

<Leslie> Eh? What is a G/G/1 system?

<Bob> Arrgh … this is the can of queue theory worms that I was hoping to avoid … but as you brought it up let us grasp the nettle.  This is called Kendall’s Notation and it is a short cut notation for describing the system design. The first letter refers to the arrivals or demand and G means a general distribution of arrival times; the second G refers to the size of the jobs or the cycle time and again the distribution is general; and the last number refers to the number of parallel resources pulling from the queue.

<Leslie> OK, so that is a single queue feeding into a single resource … the simplest possible flow system.

<Bob> Yes. But that isn’t the problem.  The problem is that the VUT equation gives an approximation to the average waiting time. It tells us nothing about the variation in the waiting time.

<Leslie> Ah I see. So it tells us nothing about the variation in the size of the queue either … so does not help us plan the required space-capacity to hold the varying queue.

<Bob> Precisely.  There is another problem too.  The ‘U’ term in the VUT equation refers to utilisation of the resource … denoted by the symbol ? or rho.  The actual term is ? / (1-?) … so what happens when rho approaches one … or in practical terms the average utilisation of the resource approaches 100%?

<Leslie> Um … 1 divided by (1-1) is 1 divided by zero which is … infinity!  The average waiting time becomes infinitely long!

<Bob> Yes, but only if we wait forever – in reality we cannot and anyway – reality is always changing … we live in a dynamic, ever-changing, unstable system called Reality. The VUT equation may be academically appealing but in practice it is almost useless.

<Leslie> Ah ha! Now I see why you never mentioned it. So how do we design for resilience in practice? How do we get a handle on the behaviour of even the G/G/1 system over time?

<Bob> We use an Excel spreadsheet to simulate our G/G/1 system and we find a fit-for-purpose design using an empirical, experimental approach. It is actually quite straightforward and does not require any Queue Theory or VUT equations … just a bit of basic Excel know-how.

<Leslie> Phew!  That sounds more up my street. I would like to see an example.

<Bob> Welcome to the first exercise in ISP-2 (Flow).

Strength and Resilience

figure_breaking_through_wall_anim_150_wht_15036The dictionary definition of resilience is “something that is capable of  returning to its original shape after being stretched, bent or otherwise deformed“.

The term is applied to inanimate objects, to people and to systems.

A rubber ball is resilient … it is that physical property that gives it bounce.

A person is described as resilient if they are able to cope with stress without being psychologically deformed in the process.  Emotional resilience is regarded as an asset.

Systems are described as resilient when they are able to cope with variation without failing. And this use of the term is associated with another concept: strength.

Strong things can withstand a lot of force before they break. Strength is not the same as resilience.

Engineers use another term – strain – which means the amount of deformation that happens when a force is applied.

Stress is the force applied, strain is the deformation that results.

So someone who is strong and resilient will not buckle under high pressure and will absorb variation – like the suspension of you car.

But is strength-and-resilience always an asset?


Suppose some strong and resilient people finds themselves in a relentlessly changing context … one in which they actually need to adapt and evolve to survive in the long term.

How well does their highly valued strength-and-resilience asset serve them?

Not very well.

They will resist the change – they are resilient – and they will resist it for a long time – they are strong.

But the change is relentless and eventually the limit of their strength will be reached … and they snap!

And when that happens all the stored energy is suddenly released. So they do not just snap – they explode!

Just like the wall in the animation above.

The final straw that triggers the sudden failure may appear insignificant … and at any other time  it would be.

But when the pressure is really on and the system is at the limit then it can be just enough to trigger the catastrophic failure from which there is no return.


Social systems behave in exactly the same way.

Those that have demonstrated durability are both strong and resilient – but in a relentlessly changing context even they will fail eventually, and when they do the collapse is sudden and catastrophic.

Structural engineers know that catastrophic failure usually starts as a localised failure and spreads rapidly through the hyper-stressed structure; each part failing in sequence as it becomes exposed and exceeds the limit of its strength.  That is how the strong and resilient Twin Towers failed and fell on Sept 11th 2001. They were not knocked over. They were weakened to the point of catastrophic failure.

When systems are exposed to varying strains then these localised micro-fractures only occur at the peaks of stress and may not have time to spread very far. The damage is done though. The system is a bit weaker than it was before. And catastrophic failure is more likely in the future.

That is what caused the sudden loss of some of the first jet airliners which inexplicably just fell out of the sky on otherwise uneventful flights.  It took a long time for the root cause to be uncovered … the square windows.

Jet airliners fly at high altitude because it allows higher speeds and requires less fuel and so allows long distance flight over wide oceans, steppes, deserts and icecaps. But the air pressure is low at high altitude and passengers could not tolerate that; so the air pressure inside an airliner at high altitude is much higher than outside. It is a huge pressurised metal flying cannister.  And as it goes up and down the thin metal skin is exposed to high variations in stress which a metal tube can actually handle rather well … until we punch holes in it to fit windows to allow our passengers a nice view of the clouds outside.  We are used to square windows in our houses (because they are easier to make) so the original aircraft engineers naturally put square windows in the early airliners.  And that is where the problem arose … the corners of the windows concentrate the stress and over time, with enough take-offs and landings,  the metal skin at the corners of the windows will accumulate invisible micro-fractures. The metal actually fatigues. Then one day – pop – a single rivet at the corner of a square window fails and triggers the catastrophic failure of the whole structure. But the aircraft designers did not understand that process and it took quite a long time to diagnose the root cause.

The solution?

A more resilient design – use round-cornered windows that dissipate the strain rather than concentrate it.  It was that simple!


So what is the equivalent resilient design for social system? Adaptability.

But how it is possible for a system to be strong, resilient and adaptable?

The design trick is to install “emotional strain gauges” that indicate when and where the internal cultural stress is being concentrated and where the emotional strain shows first.
These emotometers will alert us to where the stresses and strains are being felt strongest and most often – rather like pain detectors. We use the patterns of information from our network of emotometers to help us focus our re-design attention to continuously adapt parts of our system to relieve the strain and to reduce the system wide risk of catastrophic failure.

And by installing emotometers across our system we will move towards a design that is strong, resilient and that continuously adapts to a changing environment.

It really is that simple.

Welcome to complex adaptive systems engineering (CASE).

Perfect Storm

lightning_strike_150_wht_5809[Drrrrring Drrrrring]

<Bob> Hi Lesley! How are you today?

<Leslie> Hi Bob.  Really good.  I have just got back from a well earned holiday so I am feeling refreshed and re-energised.

<Bob> That is good to hear.  It has been a bit stormy here over the past few weeks.  Apparently lots of  hot air hitting cold reality and forming a fog of disillusionment and storms of protest.

<Leslie> Is that a metaphor?

<Bob> Yes!  A good one do you think? And it leads us into our topic for this week. Perfect storms.

<Leslie> I am looking forward to it.  Can you be a bit more specific?

<Bob> Sure.  Remember the ISP exercise where I asked you to build a ‘chaos generator’?

<Leslie> I sure do. That was an eye-opener!  I had no idea how easy it is to create chaotic performance in a system – just by making the Flaw of Averages error and adding a pinch of variation. Booom!

<Bob> Good. We are going to use that model to demonstrate another facet of system design.  How to steer out of chaos.

<Leslie> OK – what do I need to do.

<Bob> Start up that model and set the cycle time to 10 minutes with a sigma of 1.5 minutes.

<Leslie> OK.

<Bob> Now set the demand interval to 10 minutes and the sigma of that to 2.0 minutes.

<Leslie> OK. That is what I had before.

<Bob> Set the lead time upper specification limit to 30 minutes. Run that 12 times and record the failure rate.

<Leslie> OK.  That gives a chaotic picture!  All over the place.

<Bob> OK now change just the average of the demand interval.  Start with a value of 8 minutes, run 12 times, and then increase to 8.5 minutes and repeat that up to 12 minutes.

<Leslie> OK. That will repeat the run for 10 minutes. Is that OK.

<Bob> Yes.

<Leslie> OK … it will take me a few minutes to run all these.  Do you want to get a cup of tea while I do that?

<Bob> Good idea.

[5 minutes later]

<Leslie> OK I have done all that – 108 data points. Do I plot that as a run chart?

<Bob> You could.  I suggest plotting as a scattergram.

<Leslie> With the average demand interval on the X axis and the Failure % on the  Y axis?

<Bob> Yes. Exactly so. And just the dots, no lines.

<Leslie> OK. Wow! That is amazing!  Now I see why you get so worked up about the Flaw of Averages!

<Bob> What you are looking at is called a performance curve.  Notice how steep and fuzzy it is. That is called a chaotic transition. The perfect storm.  And when fall into the Flaw of Averages trap we design our systems to be smack in the middle of it.

<Leslie> Yes I see what you are getting at.  And that implies that to calm the chaos we do not need very much resilient flow capacity … and we could probably release that just from a few minor design tweaks.

<Bob> Yup.

<Leslie> That is so cool. I cannot wait to share this with the team. Thanks again Bob.

A Bit Of A Shock

egg_face_spooked_400_wht_13421It comes as a bit of a shock to learn that some of our habitual assumptions and actions are worthless.

Improvement implies change. Change requires doing things differently. That requires making different decisions. And that requires innovative thinking. And that requires new knowledge.

We are comfortable with the idea of adding  new knowledge to the vast store we have already accumulated.

We are less comfortable with the idea of removing old knowledge when it has grown out-of-date.

We are shocked when we discover that some of our knowledge is just wrong and it always has been. Since the start of time.

So we need to prepare ourselves for those sorts of shocks. We need to be resilient so that we are not knocked off our feet by them.  We need to practice a different emotional reaction to our habitual fright-flight-or-fight reaction.

We need to cultivate our curiosity.

For example:

It comes as a big shock to many when they learn that it is impossible to determine the cause from an analysis of the observed effect.  Not just difficult. Impossible.

“No Way!”  We shout angrily.  “We do that all the time!”

But do we?

What we do is we observe temporal associations.  We notice that Y happened after X and we conclude that X caused Y.

This is an incorrect conclusion.  We can only conclude from this observation that ‘X may have played a part in causing Y’ but we cannot prove it.

Not by observation alone.

What we can definitely say is that Y did not cause X – because time does not go backwards. At least it does not appear to.

Another thing that does not go backwards is information.

Q: What is 2 + 2?  Four. Easy. There is only one answer. Two numbers become one.

Let us try this in reverse …

Q: What two numbers when added together give 4? Tricky. There are countless answers.  One number cannot become two without adding uncertainty. Guessing.

So when we look at the information coming out of a system – the effects and we attempt to analyse it to reveal the causes we hit a problem. It is impossible.

And learning that is a big shock to people who describe themselves as ‘information analysts’ …. the whole foundation of what they do appears to evaporate.

So we need to outline what we can reasonably do with the retrospective analysis of effect data.

We can look for patterns.

Patterns that point to plausible causes.

Just like patterns of symptoms that point to possible diseases.

But how do we learn what patterns to look for?

Simple. We experiment. We do things and observe what happens immediately afterwards – the immediate effects. We conduct lots and lots of small experiments. And we learn the repeating patterns. “If the context is this and I do that then I always see this effect”.

If we observe a young child learning that is what we see … they are experimenting all the time.  They are curious. They delight in discovery. Novelty is fun. Learning to walk is a game.  Learning to talk is a game.  Learning to be a synergistic partner in a social group is a game.

And that same child-like curiosity is required for effective improvement.

And we know when we are doing improvement right: it feels good. It is fun. Learning is fun.

Economy-of-Scale vs Economy-of-Flow

We_Need_Small_HospitalsThis was an interesting headline to see on the front page of a newspaper yesterday!

The Top Man of the NHS is openly challenging the current Centralisation-is-The-Only-Way-Forward Mantra;  and for good reason.

Mass centralisation is poor system design – very poor.

Q: So what is driving the centralisation agenda?

A: Money.

Or to be more precise – rather simplistic thinking about money.

The misguided money logic goes like this:

1. Resources (such as highly trained doctors, nurses and AHPs) cost a lot of money to provide.
[Yes].

2. So we want all these resources to be fully-utilised to get value-for-money.
[No, not all – just the most expensive].

3. So we will gather all the most expensive resources into one place to get the Economy-of-Scale.
[No, not all the most expensive – just the most specialised]

4. And we will suck /push all the work through these super-hubs to keep our expensive specialist resources busy all the time.
[No, what about the growing population of older folks who just need a bit of expert healthcare support, quickly, and close to home?]

This flawed logic confuses two complementary ways to achieve higher system productivity/economy/value-for-money without  sacrificing safety:

Economies of Scale (EoS) and Economies of Flow (EoF).

Of the two the EoF is the more important because by using EoF principles we can increase productivity in huge leaps at almost no cost; and without causing harm and disappointment. EoS are always destructive.

But that is impossible. You are talking rubbish … because if it were possible we would be doing it!

It is not impossible and we are doing it … but not at scale and pace in healthcare … and the reason for that is we are not trained in Economy-of-Flow methods.

And those who are trained and who have have experienced the effects of EoF would not do it any other way.

Example:

In a recent EoF exercise an ISP (Improvement Science Practitioner) helped a surgical team to increase their operating theatre productivity by 30% overnight at no cost.  The productivity improvement was measured and sustained for most of the last year. [it did dip a bit when the waiting list evaporated because of the higher throughput, and again after some meddlesome middle management madness was triggered by end-of-financial-year target chasing].  The team achieved the improvement using Economy of Flow principles and by re-designing some historical scheduling policies. The new policies  were less antagonistic. They were designed to line the ducks up and as a result the flow improved.


So the specific issue of  Super Hospitals vs Small Hospitals is actually an Economy of Flow design challenge.

But there is another critical factor to take into account.

Specialisation.

Medicine has become super-specialised for a simple reason: it is believed that to get ‘good enough’ at something you have to have a lot of practice. And to get the practice you have to have high volumes of the same stuff – so you need to specialise and then to sort undifferentiated work into separate ‘speciologist’ streams or sequence the work through separate speciologist stages.

Generalists are relegated to second-class-citizen status; mere tripe-skimmers and sign-posters.

Specialisation is certainly one way to get ‘good enough’ at doing something … but it is not the only way.

Another way to learn the key-essentials from someone who already knows (and can teach) and then to continuously improve using feedback on what works and what does not – feedback from everywhere.

This second approach is actually a much more effective and efficient way to develop expertise – but we have not been taught this way.  We have only learned the scrape-the-burned-toast-by-suck-and-see method.

We need to experience another way.

We need to experience rapid acquisition of expertise!

And being able to gain expertise quickly means that we can become expert generalists.

There is good evidence that the broader our skill-set the more resilient we are to change, and the more innovative we are when faced with novel challenges.

In the Navy of the 1800’s sailors were “Jacks of All Trades and Master of One” because if only one person knew how to navigate and they got shot or died of scurvy the whole ship was doomed.  Survival required resilience and that meant multi-skilled teams who were good enough at everything to keep the ship afloat – literally.


Specialisation has another big drawback – it is very expensive and on many dimensions. Not just Finance.

Example:

Suppose we have six-step process and we have specialised to the point where an individual can only do one step to the required level of performance (safety/flow/quality/productivity).  The minimum number of people we need is six and the process only flows when we have all six people. Our minimum costs are high and they do not scale with flow.

If any one of the six are not there then the whole process stops. There is no flow.  So queues build up and smooth flow is sacrificed.

Out system behaves in an unstable and chaotic feast-or-famine manner and rapidly shifting priorities create what is technically called ‘thrashing’.

And the special-six do not like the constant battering.

And the special-six have the power to individually hold the whole system to ransom – they do not even need to agree.

And then we aggravate the problem by paying them the high salary that it is independent of how much they collectively achieve.

We now have the perfect recipe for a bigger problem!  A bunch of grumpy, highly-paid specialists who blame each other for the chaos and who incessantly clamour for ‘more resources’ at every step.

This is not financially viable and so creates the drive for economy-of-scale thinking in which to get us ‘flow resilience’ we need more than one specialist at each of the six steps so that if one is on holiday or off sick then the process can still flow.  Let us call these tribes of ‘speciologists’ there own names and budgets, and now we need to put all these departments somewhere – so we will need a big hospital to fit them in – along with the queues of waiting work that they need.

Now we make an even bigger design blunder.  We assume the ‘efficiency’ of our system is the same as the average utilisation of all the departments – so we trim budgets until everyone’s utilisation is high; and we suck any-old work in to ensure there is always something to do to keep everyone busy.

And in so doing we sacrifice all our Economy of Flow opportunities and we then scratch our heads and wonder why our total costs and queues are escalating,  safety and quality are falling, the chaos continues, and our tribes of highly-paid specialists are as grumpy as ever they were!   It must be an impossible-to-solve problem!


Now contrast that with having a pool of generalists – all of whom are multi-skilled and can do any of the six steps to the required level of expertise.  A pool of generalists is a much more resilient-flow design.

And the key phrase here is ‘to the required level of expertise‘.

That is how to achieve Economy-of-Flow on a small scale without compromising either safety or quality.

Yes, there is still a need for a super-level of expertise to tackle the small number of complex problems – but that expertise is better delivered as a collective-expertise to an individual problem-focused process.  That is a completely different design.

Designing and delivering a system that that can achieve the synergy of the pool-of-generalists and team-of-specialists model requires addressing a key error of omission first: we are not trained how to do this.

We are not trained in Complex-Adaptive-System Improvement-by-Design.

So that is where we must start.


The Improvement Pyramid

tornada_150_wht_10155The image of a tornado is what many associate with improvement.  An unpredictable, powerful, force that sweeps away the wood in its path. It certainly transforms – but it leaves a trail of destruction and disappointment in its wake. It does not discriminate  between the green wood and the dead wood.

A whirlwind is created by a combination of powerful forces – but the trigger that unleashes the beast is innocuous. The classic ‘butterfly wing effect’. A spark that creates an inferno.

This is not the safest way to achieve significant and sustained improvement. A transformation tornado is a blunt and destructive tool.  All it can hope to achieve is to clear the way for something more elegant. Improvement Science.

We need to build the capability for improvement progressively and to build it effective, efficient, strong, reliable, and resilient. In a word  – trustworthy. We need a durable structure.

But what sort of structure?  A tower from whose lofty penthouse we can peer far into the distance?  A bridge between the past and the future? A house with foundations, walls and a roof? Do these man-made edifices meet our criteria?  Well partly.

Let us see what nature suggests. What are the naturally durable designs?

Suppose we have a bag of dry sand – an unstructured mix of individual grains – and that each grain represents an improvement idea.

Suppose we have a specific issue that we would like to improve – a Niggle.

Let us try dropping the Improvement Sand on the Niggle – not in a great big reactive dollop – but in a proactive, exploratory bit-at-a-time way.  What shape emerges?

hourglass_150_wht_8762What we see is illustrated by the hourglass.  We get a pyramid.

The shape of the pyramid is determined by two factors: how sticky the sand is and how fast we pour it.

What we want is a tall pyramid – one whose sturdy pinnacle gives us the capability to see far and to do much.

The stickier the sand the steeper the sides of our pyramid.  The faster we pour the quicker we get the height we need. But there is a limit. If we pour too quickly we create instability – we create avalanches.

So we need to give the sand time to settle into its stable configuration; time for it to trickle to where it feels most comfortable.

And, in translating this metaphor to building improvement capability in system we could suggest that the ‘stickiness’ factor is how well ideas hang together and how well individuals get on with each other and how well they share ideas and learning. How cohesive our people are.  Distrust and conflict represent repulsive forces.  Repulsion creates a large, wide, flat structure  – stable maybe but incapable of vision and improvement. That is not what we need

So when developing a strategy for building improvement capability we build small pyramids where the niggles point to. Over time they will merge and bigger pyramids will appear and merge – until we achieve the height. Then was have a stable and capable improvement structure. One that we can use and we can trust.

Just from sprinkling Improvement Science Sand on our Niggles.

The Speed of Trust

London_UndergroundSystems are built from intersecting streams of work called processes.

This iconic image of the London Underground shows a system map – a set of intersecting transport streams.

Each stream links a sequence of independent steps – in this case the individual stations.  Each step is a system in itself – it has a set of inner streams.

For a system to exhibit stable and acceptable behaviour the steps must be in synergy – literally ‘together work’. The steps also need to be in synchrony – literally ‘same time’. And to do that they need to be aligned to a common purpose.  In the case of a transport system the design purpose is to get from A to B safety, quickly, in comfort and at an affordable cost.

In large socioeconomic systems called ‘organisations’ the steps represent groups of people with special knowledge and skills that collectively create the desired product or service.  This creates an inevitable need for ‘handoffs’ as partially completed work flows through the system along streams from one step to another. Each step contributes to the output. It is like a series of baton passes in a relay race.

This creates the requirement for a critical design ingredient: trust.

Each step needs to be able to trust the others to do their part:  right-first-time and on-time.  All the steps are directly or indirectly interdependent.  If any one of them is ‘untrustworthy’ then the whole system will suffer to some degree. If too many generate dis-trust then the system may fail and can literally fall apart. Trust is like social glue.

So a critical part of people-system design is the development and the maintenance of trust-bonds.

And it does not happen by accident. It takes active effort. It requires design.

We are social animals. Our default behaviour is to trust. We learn distrust by experiencing repeated disappointments. We are not born cynical – we learn that behaviour.

The default behaviour for inanimate systems is disorder – and it has a fancy name – it is called ‘entropy’. There is a Law of Physics that says that ‘the average entropy of a system will increase over time‘. The critical word is ‘average’.

So, if we are not aware of this and we omit to pay attention to the hand-offs between the steps we will observe increasing disorder which leads to repeated disappointments and erosion of trust. Our natural reaction then is ‘self-protect’ which implies ‘check-and-reject’ and ‘check and correct’. This adds complexity and bureaucracy and may prevent further decline – which is good – but it comes at a cost – quite literally.

Eventually an equilibrium will be achieved where our system performance is limited by the amount of check-and-correct bureaucracy we can afford.  This is called a ‘mediocrity trap’ and it is very resilient – which means resistant to change in any direction.


To escape from the mediocrity trap we need to break into the self-reinforcing check-and-reject loop and we do that by developing a design that challenges ‘trust eroding behaviour’.  The strategy is to develop a skill called  ‘smart trust’.

To appreciate what smart trust is we need to view trust as a spectrum: not as a yes/no option.

At one end is ‘nonspecific distrust’ – otherwise known as ‘cynical behaviour’. At the other end is ‘blind trust’ – otherwise  known and ‘gullible behaviour’.  Neither of these are what we need.

In the middle is the zone of smart trust that spans healthy scepticism  through to healthy optimism.  What we need is to maintain a balance between the two – not to eliminate them. This is because some people are ‘glass-half-empty’ types and some are ‘glass-half-full’. And both views have a value.

The action required to develop smart trust is to respectfully challenge every part of the organisation to demonstrate ‘trustworthiness’ using evidence.  Rhetoric is not enough. Politicians always score very low on ‘most trusted people’ surveys.

The first phase of this smart trust development is for steps to demonstrate trustworthiness to themselves using their own evidence, and then to share this with the steps immediately upstream and downstream of them.

So what evidence is needed?

SFQP1Safety comes first. If a step cannot be trusted to be safe then that is the first priority. Safe systems need to be designed to be safe.

Flow comes second. If the streams do not flow smoothly then we experience turbulence and chaos which increases stress,  the risk of harm and creates disappointment for everyone. Smooth flow is the result of careful  flow design.

Third is Quality which means ‘setting and meeting realistic expectations‘.  This cannot happen in an unsafe, chaotic system.  Quality builds on Flow which builds on Safety. Quality is a design goal – an output – a purpose.

Fourth is Productivity (or profitability) and that does not automatically follow from the other three as some QI Zealots might have us believe. It is possible to have a safe, smooth, high quality design that is unaffordable.  Productivity needs to be designed too.  An unsafe, chaotic, low quality design is always more expensive.  Always. Safe, smooth and reliable can be highly productive and profitable – if designed to be.

So whatever the driver for improvement the sequence of questions is the same for every step in the system: “How can I demonstrate evidence of trustworthiness for Safety, then Flow, then Quality and then Productivity?”

And when that happens improvement will take off like a rocket. That is the Speed of Trust.  That is Improvement Science in Action.

Life or Death Decisions

The Improvement Science blog this week is kindly provided by Julian Simcox and Terry Weight.

What can surgeons learn from other professions about making life or death decisions?

http://www.bbc.co.uk/news/health-21862527

Dr Kevin Fong is on a mission to find out what can be done to reduce the number of mistakes being made by surgeons in the operating theatre.

He starts out with an example of a mistake in an operation that involved a problematic tracheotomy and subsequently, despite there being plenty of extra expert advice on hand, sadly the patient died. Crucially, a nurse had been ignored who if listened to might have provided the solution that could have saved the patient’s life.

Whilst looking at other walks of life – this example is used to explore how under similar pressures such mistakes can be avoided. For example, in aviation and in fire-fighting more robust and resilient cultures and systems have evolved – but how?

The Horizon editors highlight the importance of six things and we make some comments:

1. The aviation industry continually designs out hazards and risk.

Aviation was once a very hazardous pursuit. Nowadays the trip to the airport is much riskier than the flight itself, because over the decades aviators have learned how to learn-from-mistakes and to reduce future incidents. They have learned that blaming individuals for systemic failure gets in the way of accumulating the system-wide knowledge that makes the most difference.

Peter Jordan reminds us that in the official report into the 1989 Kegworth air disaster: 31 recommendations for improved safety were made – mainly to do with patient safety during crashes – an even then the report could not resist pointing the finger at the two pilots who, when confronted with a blow-out in one of their two engines, had wrongly interpreted a variety of signals and talked themselves into switching off the wrong engine. On publication of the report they were summarily dismissed, but much later successfully claimed damages for unfair dismissal.

http://en.wikipedia.org/wiki/Kegworth_air_disaster

2. Checklists can make a difference if the Team is engaged

The programme then refers to recent research by the World Health Organisation on the use of checklists that when implemented showed a large (35%) reduction in surgical complications across a range of countries and hospitals.

In University College Hospital London we see checklists being used by the clinical team to powerful effect. The specific example given concerns the process of patient hand-over after an operation from the surgical team to the intensive care unit. Previously this process had been ill-defined and done differently by lots of people – and had not been properly overseen by anyone.

No reference is made however to the visual display of data that helps teams see the effect of their actions on their system over time, and there is no mention of whether the checklists have been designed by outsiders or by the team themselves.

In our experience these things make a critical difference to ongoing levels of engagement – and to outcomes – especially in the NHS where checklists have historically been used more as a way of ensuring compliance with standards and targets imposed from the top. Too often checklists are felt to be instruments of persecution and are therefore fiercely (and justifiably) resisted.

We see plenty of scope in the NHS for clarifying and tightening process definitions, but checklists are only one way of prompting this. Our concern is that checklists could easily become a flavour-of-the-month thing – seen as one more edict from above. And all-too-quickly becoming yet another layer of the tick-box bureaucracy, of the kind that most people say they want to get away from.

We also see many potentially powerful ideas flowing form the top of the NHS, raining down on a system that has become moribund – wearied by one disempowering change initiative after another.

3. Focussing on the team and the process – instead of the hierarchy – enhances cooperation and reduces deferential behaviour.

Learning from the Formula One Pit Stop Team processes, UCH we are told have flattened their hierarchy ensuring that at each stage of the process there is clear leadership, and well understood roles to perform. After studying their process they have realised that most of the focus had previously been on only the technically demanding work rather than on the sequence of steps and the need for ensuring clear communication between each one of those steps. We are told that flattening the hierarchy in order to prioritise team working has also helped – deference to seniority (e.g. nurses to doctors) is now seen as obstructing safer practice.

Achieving role clarity goes hand-in-hand with simplification of the system – which all starts with careful process definition undertaken collaboratively by the team as a whole. In the featured operation every individual appears to know their role and the importance of keeping things simple and consistent. In our experience this is all the more powerful when the team agree to standardise procedures as soon as any new way has been shown to be more effective.

4. Situational Awareness is an inherent human frailty.

We see how fire officers are specifically trained to deal with situations that require both a narrow focus and an ability to stand back and connect to the whole – a skill which for most people does not come naturally. Under pressure we each too often fail to appreciate either the context or the bigger picture, losing situational awareness and constraining our span of attention.

In the aviation industry we see how pilot training is nowadays considered critically important to outcomes and to the reductions of pilot error in emergencies. Flight simulators and scenario simulation now play a vital role, and this is becoming more commonplace in senior doctor training.

It seems common sense that people being trained should experience the real system whilst being able to making mistakes. Learning comes from experimentation (P-D-C-A). In potentially life-and-death situations simulation allows the learning and the building of needed experience to be done safely off-line. Nowadays, new systems containing multiple processes and lots of people can be designed using computer simulations, but these skills are as yet in short supply in the NHS.

http://www.saasoft.com/6Mdesign/index.php

5. Understand the psychology of how people respond to their mistakes.

Using some demonstrations using playing cards, we see how people who have a non-reactive attitude to mistakes respond better to making them and are then less likely to make the same mistake again. Conversely some individuals seem to be less resilient – we would say becoming unstable – taking longer to correct their mistakes and subsequently making more of them. Recruitment of doctors is now starting to include the use of simulators to test for this psychological ability.

6. Innovation more easily flows from systems that are stable.

Due to a bird strike a few minutes after take-off, stopping both engines, an aircraft in 2008 was forced to crash land. The landing – in to New York’s Hudson River – was an innovative novel manoeuvre, and incredibly led to the survival of all the passengers and crew. An innovation that was safely executed by the pilot who in the moment kept his cool by sticking to the procedures and checklists he had been trained in.

This capability we are told had been acquired over more than three decades by the pilot Captain “Sully” Sullenberger, who sees himself as part of an industry that over time institutionalises emerging knowledge. He tells us that he had faith in the robustness and resilience of this knowledge that had accumulated by using the lessons from the past to build a safer future. He suggests it would be immoral not to learn from historical experience. To him it was “this robustness that made it possible to innovate when the unknown occurred”.

Standardisation often spawns innovation – something which for many people remains a counter-intuitive notion.

Sullenberger was subsequently lauded as a hero, but he himself tells us that he merely stuck to the checklist procedures and that this helped him to keep his cool whilst realising he needed to think outside the box.

The programme signs off with the message that human error is always going to be with us, and that it is how we deal with human error that really matters. In aviation there is a continual search for progress, rather than someone to blame. By accepting our psychological fallibility we give ourselves – in the moment – the best possible chance.

The programme attempts to balance the actions of the individual with collective action over time to design and build a better system – one in which all individuals can play their part well. Some viewers may have ended up remembering most the importance of the “heroic” individual. In our view more emphasis could have placed on the design of the system as a whole – such that it more easily maintains its stability without needing to rely either on the heroic acts of any one individual or on finding the one scapegoat.

If heroes need to exist they are the individuals who understand their role and submit themselves to the needs of team and to achieving the outcomes that are needed by the wider system. We like that the programme ends with the following words:

Search for progress, not someone to blame!


The Seventh Flow

texting_a_friend_back_n_forth_150_wht_5352Bing Bong

Bob looked up from the report he was reading and saw the SMS was from Leslie, one of his Improvement Science Practitioners.

It said “Hi Bob, would you be able to offer me your perspective on another barrier to improvement that I have come up against.”

Bob thumbed a reply immediately “Hi Leslie. Happy to help. Free now if you would like to call. Bob

Ring Ring

<Bob> Hello, Bob here.

<Leslie> Hi Bob. Thank you for responding so quickly. Can I describe the problem?

<Bob> Hi Leslie – Yes, please do.

<Leslie> OK. The essence of it is that I have discovered that our current method of cash-flow control is preventing improvements in safety, quality, delivery and paradoxically in productivity too. I have tried to talk to the Finance department and all I get back is “We have always done it this way. That is what we are taught. It works. The rules are not negotiable and the problem is not Finance“. I am at a loss what to do.

<Bob> OK. Do not worry. This is a common issue that every ISP discovers at some point. What led you to your conclusion that the current methods are creating a barrier to change?

<Leslie> Well, the penny dropped when I started using the modelling tools you have shown me.  In particular when predicting the impact of process improvement-by-design changes on the financial performance of the system.

<Bob> OK. Can you be more specific?

<Leslie> Yes. The project was to design a new ambulatory diagnostic facility that will allow much more of the complex diagnostic work to be done on an outpatient basis.  I followed the 6M Design approach and looked first at the physical space design. We needed that to brief the architect.

<Bob> OK. What did that show?

<Leslie> It showed that the physical layout had a very significant impact on the flow in the process and that by getting all the pieces arranged in the right order we could create a physical design that felt spacious without actually requiring a lot of space. We called it the “Tardis Effect“. The most marked impact was on the size of the waiting areas – they were really small compared with what we have now which are much bigger and yet still feel cramped and chaotic.

<Bob> OK. So how does that physical space design link to the finance question?

<Leslie> Well, the obvious links were that the new design would have a smaller physical foot-print and at the same time give a higher throughput. It will cost less to build and will generate more activity than if we just copied the old design into a shiny new building.

<Bob> OK. I am sure that the Capital Allocation Committee and the Revenue Generation Committee will have been pleased with that outcome. What was the barrier?

<Leslie> Yes, you are correct. They were delighted because it left more in the Capital Pot for other equally worthy projects. The problem was not capital it was revenue.

<Bob> You said that activity was predicted to increase. What was the problem?

<Leslie>Yes – sorry, I was not clear – it was not the increased activity that was the problem – it was how to price the activity and  how to distribute the revenue generated. The Reference Cost Committee and Budget Allocation Committee were the problem.

<Bob> OK. What was the problem?

<Leslie> Well the estimates for the new operational budgets were basically the current budgets multiplied by the ratio of the future planned and historical actual activity. The rationale was that the major costs are people and consumables so the running costs should scale linearly with activity. They said the price should stay as it is now because the quality of the output is the same.

<Bob> OK. That does sound like a reasonable perspective. The variable costs will track with the activity if nothing else changes. Was it apportioning the overhead costs as part of the Reference Costing that was the problem?

<Leslie> No actually. We have not had that conversation yet. The problem was more fundamental. The problem is that the current budgets are wrong.

<Bob> Ah! That statement might come across as a bit of a challenge to the Finance Department. What was their reaction?

<Leslie> To para-phrase it was “We are just breaking even in the current financial year so the current budget must be correct. Please do not dabble in things that you clearly do not understand.”

<Bob> OK. You can see their point. How did you reply?

<Leslie> I tried to explain the concepts of the Cost-Of-The-Queue and how that cost was incurred by one part of the system with one budget but that the queue was created by a different part of the system with a different budget. I tried to explain that just because the budgets were 100% utilised does not mean that the budgets were optimal.

<Bob> How was that explanation received?

<Leslie> They did not seem to understand what I was getting at and kept saying “Inventory is an asset on the balance sheet. If profit is zero we must have planned our budgets perfectly. We cannot shift money between budgets within year if the budgets are already perfect. Any variation will average out. We have to stick to the financial plan and projections for the year. It works. The problem is not Finance – the problem is you.

<Bob> OK. Have you described the Seventh Flow and put it in context?

<Leslie> Arrrgh! No! Of course! That is how I should have approached it. Budgets are Cash-Inventories and what we need is Cash-Flow to where and when it is needed and in just the right amount according to the Principle of Parsimonious Pull. Thank you. I knew you would ask the crunch question. That has given me a fresh perspective on it. I will have another go.

<Bob> Let know how you get on. I am curious to hear the next instalment of the story.

<Leslie> Will do. Bye for now.

Drrrrrrrr

construction_blueprint_meeting_150_wht_10887Creating a productive and stable system design requires considering Seven Flows at the same time. The Seventh Flow is cash flow.

Cash is like energy – it is only doing useful work when it is flowing.

Energy is often described as two forms – potential energy and and kinetic energy.  The ‘doing’ happens when one form is being converted from potential to kinetic. Cash in the budget is like potential energy – sitting there ready to do some business.  Cash flow is like kinetic energy – it is the business.

The most versatile form of energy that we use is electrical energy. It is versatile because it can easily be converted into other forms – e.g. heat, light and movement. Since the late 1800’s our whole society has become highly dependent on electrical energy.  But electrical energy is tricky to store and even now our battery technology is pretty feeble. So, if we want to store energy we use a different form – chemical energy.  Gas, oil and coal – the fossil fuels – are all ancient stores of chemical energy that were originally derived from sunlight captured by vast carboniferous forests over millions of years. These carbon-rich fossil fuels are convenient to store near where they are needed, and when they are needed. But fossil fuels have a number of drawbacks: One is that they release their stored carbon when they are “burned”.  Another is that they are not renewable.  So, in the future we will need to develop better ways to capture, transport, use and store the energy from the Sun that will flow in glorious abundance for millions of years to come.

Plants discovered millions of years ago how to do this sunlight-to-chemical energy conversion and that biological legacy is built into every cell in every plant on the planet. Animals just do the reverse trick – they convert chemical-to-electrical. Every cell in every animal on the planet is a microscopic electrical generator that “burns” chemical fuel – carbohydrate. The other products are carbon dioxide and water. Plants use sunlight to recycle and store the carbon dioxide. It is a resilient and sustainable design.

plant_growing_anim_150_wht_9902Plants seemingly have it easy – the sunlight comes to them – they just sunbathe all day!  The animals have to work a bit harder – they have to move about gathering their chemical fuel. Some animals just feed on plants, others feed on other animals, and we do a bit of both. This food-gathering is a more complicated affair – and it creates a problem. Animals need a constant supply of energy – so they have to carry a store of chemical fuel around with them. That store is heavy so it needs energy to move it about.  Herbivors can be bigger and less intelligent because their food does not run away.  Carnivors need to be more agile; both physically and mentally. A balance is required. A big enough fuel store but not too big.  So, some animals have evolved additional strategies. Animals have become very good at not wasting energy – because the more that is wasted the more food that is needed and the greater the risk of getting eaten or getting too weak to catch the next meal.

To illustrate how amazing animals are at energy conservation we just need to look at an animal structure like the heart. The heart is there to pump blood around. Blood carries chemical nutrients and waste from one “department” of the body to another – just like ships, rail, roads and planes carry stuff around the world.

cardiogram_heart_working_150_wht_5747Blood is a sticky, viscous fluid that requires considerable energy to pump around the body and, because it is pumped continuously by the heart, even a small improvement in the energy efficiency of the circulation design has a big long-term cumulative effect. The flow of blood to any part of the body must match the requirements of that part.  If the blood flow to your brain slows down for even few seconds the brain cannot work properly and you lose consciousness – it is called “fainting”.

If the flow of blood to the brain is stopped for just a few minutes then the brain cells actually die. That is called a “stroke”. Our brains use a lot of electrical energy to do their job and our brain cells do not have big stores of fuel – so they need constant re-supply. And our brains are electrically active all the time – even when we are sleeping.

Other parts of the body are similar. Muscles for instance. The difference is that the supply of blood that muscles need is very variable – it is low when resting and goes up with exercise. It has been estimated that the change in blood flow for a muscle can be 30 fold!  That variation creates a design problem for the body because we need to maintain the blood flow to brain at all times but we only want blood to be flowing to the muscles in just the amount that they need, where they need it and when they need it. And we want to minimise the energy required to pump the blood at all times. How then is the total and differential allocation of blood flow decided and controlled?  It is certainly not a conscious process.

stick_figure_turning_valve_150_wht_8583The answer is that the brain and the muscles control their own flow. It is called autoregulation.  They open the tap when needed and just as importantly they close the tap when not needed. It is called the Principle of Parsimonious Pull. The brain directs which muscles are active but it does not direct the blood supply that they need. They are left to do that themselves.

So, if we equate blood-flow and energy-flow to cash-flow then we arrive at a surprising conclusion. The optimal design, the most energy and cash efficient, is where the separate parts of the system continuously determine the energy/cash flow required for them to operate effectively. They control the supply. They autoregulate their cash-flow. They pull only what they need when they need it.

BUT

For this to work then every part of the system needs to have a collaborative and parsimonious pull-design philosophy – one that wastes as little energy and cash as possible.  Minimum waste of energy requires careful design – it is called ergonomic design. Minimum waste of cash requires careful design – it is called economic design.

business_figures_accusing_anim_150_wht_9821Many socioeconomic systems are fragmented and have parts that behave in a “greedy” manner and that compete with each other for resources. It is a dog-eat-dog design. They would use whatever resources they can get for fear of being starved. Greed is Good. Collaboration is Weak.  In such a competitive situation a rigid-budget design is a requirement because it helps prevent one part selfishly and blindly destabilising the whole system for all. The problem is that this rigid financial design blocks change so it blocks improvement.

This means that greedy, competitive, selfish systems are unable to self-improve.

So, when the world changes too much and their survival depends on change then they risk becoming extinct just as the dinosaurs did.

red_arrow_down_crash_400_wht_2751Many will challenge this assertion by saying “But competition drives up performance“.  Actually, it is not as simple as that. Competition will weed out the weakest who “die” and remove themselves from the equation – apparently increasing the average. What actually drives improvement is customer choice. Organisations that are able to self-improve will create higher-quality and lower-cost products and in a globally-connected-economy the customers will vote with their wallets. The greedy and selfish competition lags behind.

So, to ensure survival in a global economy the Seventh Flow cannot be rigidly restricted by annually allocated departmental budgets. It is a dinosaur design.

And there is no difference between public and private organisations. The laws of cash-flow physics are universal.

How then is the cash flow controlled?

The “trick” is to design a monitoring and feedback component into the system design. This is called the Sixth Flow – and it must be designed so that just the right amount of cash is pulled to the just the right places and at just the right time and for just as long as needed to maximise the revenue.  The rest of the design – First Flow to Fifth Flow ensure the total amount of cash needed is a minimum.  All Seven Flows are needed.

So the essential ingredient for financial stability and survival is Sixth and Seventh Flow Design capability. That skill has another name – it is called Value Stream Accounting which is a component of complex adaptive systems engineering (CASE).

What? Never heard of Value Stream Accounting?

Maybe that is just another Error of Omission?

Shifting, Shaking and Shaping

Stop Press: For those who prefer cartoons to books please skip to the end to watch the Who Moved My Cheese video first.


ThomasKuhnIn 1962 – that is half a century ago – a controversial book was published. The title was “The Structure of Scientific Revolutions” and the author was Thomas S Kuhn (1922-1996) a physicist and historian at Harvard University.  The book ushered in the concept of a ‘paradigm shift’ and it upset a lot a people.

In particular it upset a lot of scientists because it suggested that the growth of knowledge and understanding is not smooth – it is jerky. And Kuhn showed that the scientists were causing the jerking.

Kuhn described the process of scientific progress as having three phases: pre-science, normal science and revolutionary science.  Most of the work scientists do is normal science which means exploring, consolidating, and applying the current paradigm. The current conceptual model of how things work.  Anyone who argues against the paradigm is regarded as ‘mistaken’ because the paradigm represents the ‘truth’.  Kuhn draws on the history of science for his evidence, quoting  examples of how innovators such as Galileo, Copernicus, Newton, Einstein and Hawking radically changed the way that we now view the Universe. But their different models were not accepted immediately and ethusiastically because they challenged the status quo. Galileo was under house arrest for much of his life because his ‘heretical’ writings challenged the Church.  

Each revolution in thinking was both disruptive and at the same time constructive because it opened a door to allow rapid expansion of knowledge and understanding. And that foundation of knowledge that has been built over the centuries is one that we all take for granted.  It is a fragile foundation though. It could be all lost and forgotten in one generation because none of us are born with this knowledge and understanding. It is not obvious. We all have to learn it.  Even scientists.

Kuhn’s book was controversial because it suggested that scientists spend most of their time blocking change. This is not necessarily a bad thing. Stability for a while is very useful and the output of normal science is mostly positive. For example the revolution in thinking introduced by Isaac Newton (1643-1727) led directly to the Industrial Revolution and to far-reaching advances in every sphere of human knowledge. Most of modern engineering is built on Newtonian mechanics and it is only at the scales of the very large, the very small and the very quick that it falls over. Relativistic and quantum physics are more recent and very profound shifts in thinking and they have given us the digital computer and the information revolution. This blog is a manifestation of the quantum paradigm.

Kuhn concluded that the progess of change is jerky because scientists create resistance to change to create stability while doing normal science experiments.  But these same experiments produce evidence that suggest that the current paradigm is flawed. Over time the pressure of conflicting evidence accumulates, disharmony builds, conflict is inevitable and intellectual battle lines are drawn.  The deeper and more fundamental the flaw the more bitter the battle.

In contrast, newcomers seek harmony in the cacophony and propose new theories that explain both the old and the new. New paradigms. The stage is now set for a drama and the public watch bemused as the academic heavyweights slug it out. Eventually a tipping point is reached and one of the new paradigms becomes dominant. Often the transition is triggered by one crucial experiment.

There is a sudden release of the tension and a painful and disruptive conceptual  lurch – a paradigm shift. Then the whole process starts over again. The creators of the new paradigm become the consolidators and in time the defenders and eventually the dogmatics!  And it can take decades and even generations for the transition to be completed.

It is said that Albert Einstein (1879-1955) never fully accepted quantum physics even though his work planted the seeds for it and experience showed that it explained the experimental observations better. [For more about Einstein click here].              

The message that some take from Kuhn’s book is that paradigm shifts are the only way that knowledge  can advance.  With this assumption getting change to happen requires creating a crisis – a burning platform. Unfortunatelty this is an error of logic – it is a unverified generalisation from an observed specific. The evidence is growing that this we-always-need-a-burning-platform assumption is incorrect.  It appears that the growth of  knowledge and understanding can be smoother, less damaging and more effective without creating a crisis.

So what is the evidence that this is possible?

Well, what pattern would you look for to illustrate that it is possible to improve smoothly and continually? A smooth growth curve of some sort? Yes – but it is more than that.  It is a smooth curve that is steeper than anyone else’s and one that is growing steeper over time.  Evidence that someone is learning to improve faster than their peers – and learning painlessly and continuously without crises; not painfully and intermittently using crises.

Two examples are Toyota and Apple.

ToyotaLogoToyota is a Japanese car manufacturer that has out-performed other car manufacturers consistently for 40 years – despite the global economic boom-bust cycles. What is their secret formula for their success?

WorldOilPriceChartWe need a bit of history. In the 1980’s a crisis-of-confidence hit the US economy. It was suddenly threatened by higher-quality and lower-cost imported Japanese products – for example cars.

The switch to buying Japanese cars had been triggered by the Oil Crisis of 1973 when the cost of crude oil quadrupled almost overnight – triggering a rush for smaller, less fuel hungry vehicles.  This is exactly what Toyota was offering.

This crisis was also a rude awakening for the US to the existence of a significant economic threat from their former adversary.  It was even more shocking to learn that W Edwards Deming, an American statistician, had sown the seed of Japan’s success thirty years earlier and that Toyota had taken much of its inspiration from Henry Ford.  The knee-jerk reaction of the automotive industry academics was to copy how Toyota was doing it, the Toyota Production System (TPS) and from that the school of Lean Tinkering was born.

This knowledge transplant has been both slow and painful and although learning to use the Lean Toolbox has improved Western manufacturing productivity and given us all more reliable, cheaper-to-run cars – no other company has been able to match the continued success of Japan.  And the reason is that the automotive industry academics did not copy the paradigm – the intangible, subjective, unspoken mental model that created the context for success.  They just copied the tangible manifestation of that paradigm.  The tools. That is just cynically copying information and knowledge to gain a competitive advantage – it is not respecfully growing understanding and wisdom to reach a collaborative vision.

AppleLogoApple is now one of the largest companies in the world and it has become so because Steve Jobs (1955-2011), its Californian, technophilic, Zen Bhuddist, entrepreneurial co-founder, had a very clear vision: To design products for people.  And to do that they continually challenged their own and their customers paradigms. Design is a logical-rational exercise. It is the deliberate use of explicit knowledge to create something that delivers what is needed but in a different way. Higher quality and lower cost. It is normal science.

Continually challenging our current paradigm is not normal science. It is revolutionary science. It is deliberately disruptive innovation. But continually challenging the current paradigm is uncomfortable for many and, by all accounts, Steve Jobs was not an easy person to work for because he was future-looking and demanded perfection in the present. But the success of this paradigm is a matter of fact: 

“In its fiscal year ending in September 2011, Apple Inc. hit new heights financially with $108 billion in revenues (increased significantly from $65 billion in 2010) and nearly $82 billion in cash reserves. Apple achieved these results while losing market share in certain product categories. On August 20, 2012 Apple closed at a record share price of $665.15 with 936,596,000 outstanding shares it had a market capitalization of $622.98 billion. This is the highest nominal market capitalization ever reached by a publicly traded company and surpasses a record set by Microsoft in 1999.”

And remember – Apple almost went bust. Steve Jobs had been ousted from the company he co-founded in a boardroom coup in 1985.  After he left Apple floundered and Steve Jobs proved it was his paradigm that was the essential ingredient by setting up NeXT computers and then Pixar. Apple’s fortunes only recovered after 1998 when Steve Jobs was invited back. The rest is history so click to see and hear Steve Jobs describing the Apple paradigm.

So the evidence states that Toyota and Apple are doing something very different from the rest of the pack and it is not just very good product design. They are continually updating their knowledge and understanding – and they are doing this using a very different paradigm.  They are continually challenging themselves to learn. To illustrate how they do it – here is a list of the five principles that underpin Toyota’s approach:

  • Challenge
  • Improvement
  • Go and see
  • Teamwork
  • Respect

This is Win-Win-Win thinking. This is the Science of Improvement. This is Improvementology®.


So what is the reason that this proven paradigm seems so difficult to replicate? It sounds easy enough in theory! Why is it not so simple to put into practice?

The requirements are clearly listed: Respect for people (challenge). Respect for learning (improvement). Respect for reality (go and see). Respect for systems (teamwork).

In a word – Respect.

Respect is a big challenge for the individualist mindset which is fundamentally disrespectful of others. The individualist mindset underpins the I-Win-You-Lose Paradigm; the Zero-Sum -Game Paradigm; the Either-Or Paradigm; the Linear-Thinking Paradigm; the Whole-Is-The-Sum-Of-The-Parts Paradigm; the Optimise-The-Parts-To-Optimise-The-Whole Paradigm.

Unfortunately these are the current management paradigms in much of the private and public worlds and the evidence is accumulating that this paradigm is failing. It may have been adequate when times were better, but it is inadequate for our current needs and inappropriate for our future needs. 


So how can we avoid having to set fire to the current failing management paradigm to force a leap into the cold and uninviting reality of impending global economic failure?  How can we harness our burning desire for survival, security and stability? How can we evolve our paradigm pro-actively and safely rather than re-actively and dangerously?

all_in_the_same_boat_150_wht_9404We need something tangible to hold on to that will keep us from drowning while the old I-am-OK-You-are-Not-OK Paradigm is dissolved and re-designed. Like the body of the caterpillar that is dissolved and re-assembled inside the pupa as the body of a completely different thing – a butterfly.

We need a robust  and resilient structure that will keep us safe in the transition from old to new and we also need something stable that we can steer to a secure haven on a distant shore.

We need a conceptual lifeboat. Not just some driftwood,  a bag of second-hand tools and no instructions! And we need that lifeboat now.

But why the urgency?

UK_PopulationThe answer is basic economics.

The UK population is growing and the proportion of people over 65 years old is growing faster.  Advances in healthcare means that more of us survive age-related illnesses such as cancer and heart disease. We live longer and with better quality of life – which is great.

But this silver-lining hides a darker cloud.

The proportion of elderly and very elderly will increase over the next 20 years as the post WWII baby-boom reaches retirement age. The number of people who are living on pensions is increasing and the demands on health and social services is increasing.  Pensions and public services are not paid out of past savings  they are paid out of current earnings.  So the country will need to earn more to pay the bills. The UK economy will need to grow.

UK_GDP_GrowthBut the UK economy is not growing.  Our Gross Domestic Product (GDP) is currently about £380 billion and flat as a pancake. This sounds like a lot of dosh – but when shared out across the population of 56 million it gives a more modest figure of just over £100 per person per week.  And the time-series chart for the last 20 years shows that the past growth of about 1% per quarter took a big dive in 2008 and went negative! That means serious recession. It recovered briefly but is now sagging towards zero.

So we are heading for a big economic crunch and hiding our heads in the sand and hoping for the best is not a rational strategy. The only way to survive is to cut public services or for tax-funded services to become more productive. And more productive means increasing the volume of goods and services for the same cost. These are the services that we will need to support the growing population of  dependents but without increasing the cost to the country – which means the taxpayer.

The success of Toyota and Apple stemmed from learning how to do just that: how to design and deliver what is needed; and how to eliminate what is not; and how to wisely re-invest the released cash. The difference can translate into higher profit, or into growth, or into more productivity. It just depends on the context.  Toyota and Apple went for profit and growth. Tax-funded public services will need to opt for productivity. 

And the learning-productivity-improvement-by-design paradigm will be a critical-to-survival factor in tax-payer funded public services such as the NHS and Social Care.  We do not have a choice if we want to maintain what we take for granted now.  We have to proactively evolve our out-of-date public sector management paradigm. We have to evolve it into one that can support dramatic growth in productivity without sacrificing quality and safety.

We cannot use the burning platform approach. And we have to act with urgency.

We need a lifeboat!

Our current public sector management paradigm is sinking fast and is being defended and propped up by the old school managers who were brought up in it.  Unfortunately the evidence of 500 years of change says that the old school cannot unlearn. Their mental models go too deep.  The captains and their crews will go down with their ships.  [Remember the Titanic the unsinkable ship that sank in 1912 on the maiden voyage. That was a victory of reality over rhetoric.]

Those of us who want to survive are the ‘rats’. We know when it is time to leave the sinking ship.  We know we need lifeboats because it could be a long swim! We do not want to freeze and drown during the transition to the new paradigm.

So where are the lifeboats?

One possibility is an unfamiliar looking boat called “6M Design”. This boat looks odd when viewed through the lens of the conventional management paradigm because it combines three apparently contradictiry things: the rational-logical elements of system design;  the respect-for-people and learning-through-challenge principles embodied by Toyota and Apple; and the counter-intuitive technique of systems thinking.

Another reason it feel odd is because “6M Design” is not a solution; it is a meta-solution. 6M Design is a way of creating a good-enough-for-now solution by changing the current paradigm a bit at a time. It is a-how-to-design framework; it is not the-what-to-do solution. 6M Design is a paradigm shaper – not a paradigm shaker or a paradigm shifter.

And there is yet another reason why 6M Design does not float the current management boat.  It does not need to be controlled by self-appointed experts.  Business schools and management consultants, who have a vested interest in defending the current management paradigm, cannot make a quick buck from it because they are irrelevant. 6M Design is intended to be used by anyone and everyone as a common language for collectively engaging in respectful challenge and lifelong learning. Anyone can learn to use it. Anyone.

We do not need a crisis to change. But without changing we will get the crisis we do not want. If we choose to change then we can choose a safer and smoother path of change.

The choice seems clear.  Do you want to go down with the ship or stay afloat aboard an innovation boat?

And we will need something to help us navigate our boat.

If you are a reflective, conceptual learner then you might ike to read a synopsis of Thomas Kuhn’s book.  You can download a copy here. [There is also a 50 year anniversary edition of the original that was published this year].

And if you prefer learning from stories then there is an excellent one called “Who Moved My Cheese” that describes the same challenge of change. And with the power of the digital paradigm you can watch the video here.


Predictable and Explainable – or Not

It is a common and intuitively reasonable assumption to believe that if something is explainable then it is predictable; and if it is not explainable then it is not predictable. Unfortunately this beguiling assumption is incorrect.  Some things are explainable but not predictable; and some others are predictable but not explainable.  Believe me? Of course not. We are all skeptics when our intuitively obvious assumptions and conclusions are challenged! We want real and rational evidence not rhetorical exhortation.

OK.  Explainable means that the principles that guide the process are conceptually simple. We can explain the parts in detail and we can explain how they are connected together in detail. Predictable implies that if we know the starting point in detail, and the intervention in detail, then we can predict what the outcome will be – in detail.


Let us consider an example. Say we know how much we have in our bank account, and we know how much we intend to spend on that new whizzo computer, then we can predict what will be left in out bank account when the payment has been processed. Yes. This is an explainable and predictable system. It is called a linear system.


Let us consider another example. Say we know we have six dice each with numbers 1 to 6 printed on them and we throw them at the same time. Can we predict where they will land and what the final sum will be? No. We can say that it will be between 6 and 36 but that is all. And after we have thrown the dice we will not be able to explain, in detail, how they came to rest exactly where they did.  This is an unpredictable and unexplainable system. It is called a random system.


This is a picture of a conceptually simple system. It is a novelty toy and it comprises two thin sheets of glass held a few millimetres apart by some curved plastic spacers. The narrow space is filled with green coloured oil, some coarse black volcanic sand, and some fine white coral sand. That is all. It is a conceptually simple toy. I have (by some magical means) layered the sand so that the coarse black sand is at the bottom and the fine white sand is on top. It is stable arrangement – and explainable. I then tipped the toy on its side – I rotated it through 90 degrees. It is a simple intervention – and explainable.

My intervention has converted a stable system to an unstable one and I confidently predict that the sand and oil will flow under the influence of gravity. There is no randomness here – I do not jiggle the toy – so the outcome should be predictable because I can explain all the parts in detail before we start;  and I can explain the process in detail; and I can explain precisely what my intervention will be. So I should be able to predict the final configuration of the sand when this simple and explainable system finally settles into a new stable state again. Yes?

Well, I cannot. I can make some educated guesses – some plausible projections. But the only way to find out precisely what will happen is by doing the experiment and observing what actually happens.

This is what happened.

The final, stable configuration of the coarse black and fine white sand has a strange beauty in the way the layers are re-arranged. The result is not random – it has structure. And with the benefit of hindsight I feel I can work backwards and understand how it might have come about. It is explainable in retrospect but I could not predict it in prospect – even with a detailed knowledge of the starting point and the process.

This is called a non-linear system. Explainable in concept but difficult to predict in practice. The weather is another example of a non-linear system – explainable in terms of the physics but not precisely predictable. How reliable are our long range weather forecasts – or the short range ones for that matter?

Non-linear systems exhibit complex and unpredictable  behaviour – even though they may be simple in concept and uncomplicated in construction.  Randomness is usually present in real systems but it is not the cause of the complex behaviour, and making our systems more complicated seems likely to result in more unpredictable behaviour – not less.

If we want the behaviour of our system to be predictable and our system has non-linear parts and relationships in it – then we are forced to accept two Universal Truths.

1. That our system behaviour will only be predictable within limits (even if there is little or no randomness in it).

2. That to keep the behaviour within acceptable limits then we need to be careful how we arrange the parts and how they relate to each other.

This challenge of creating a predictable-within-acceptable-limits system from non-linear parts is called resilient design.


We have a fourth option to consider: a system that has a predictable outcome but an unexplainable reason.

We make predictions two ways – by working out what will happen or by remembering what has happened before. The second method is much easier so it is the one we use most of the time: it is called re-cognition. We call it knowledge.

If we have a black box with inputs on one side and outputs on the other, and we observe that when we set the inputs to a specific configuration we always get the same output – then we have a predicable system. We cannot explain how the inputs result in the output because the inner workings are hidden. It could be very simple – or it could be fiendishly complicated – we do not know.

It this situation we have no choice but to accept the status quo – and we have to accept that to get a predictable outcome we have to follow the rules and just do what we have always done before. It is the creed of blind acceptance – the If you always do what you have always done you will always get what you always got. It is knowledge but it is not understanding.  New knowledge  can only be found by trial and error.  It is not wisdom, it is not design, it is not curiosity and it is not Improvement Science.


If our systems are non-linear (which they are) and we want predictable and acceptable performance (which we do) then we must strive to understand them and then to design them to be as simple as possible (which is difficult) so that we have the greatest opportunity to improve their performance by design (which is called Improvement Science).


This is a snapshot of the evolving oil-and-sand system. Look at that weird wine-glass shaped hole in the top section caused by the black sand being pulled down through the gap in the spacer then running down the slope of the middle section to fill a white sand funnel and then slip through the next hole onto the top of the white sand pyramid created by the white sand in the middle section that slipped through earlier onto the top of the sliding sand in the lowest section. Did you predict that? I suspect not. Me neither. But I can explain it – with the benefit of hindsight.

So what is it that is causing this complex behaviour? It is the spacers – the physical constraints to the flow of the sand and oil. And the same is true of systems – when the process hits a constraint then the behaviour suddenly changes and complex behaviour emerges.  And there is more to it than even this. It is the gaps between the spacers that is creating the complex behaviour. The flow from one compartment leaking into the next and influencing its behaviour, and then into the next.  This is what happens in all systems – the more constraints that are added to force the behaviour into predictable channels, and the more gaps that exist in the system of constraints then the more complex and unpredictable the system behaviour becomes. Which is exactly the opposite of the intended outcome.


The lesson that this simple toy can teach us is that if we want stable and predictable (i.e. non-complex) behaviour from our complicated systems then we must design them to operate inside the constraints so that they just never quite touch them. That requires data, information, knowledge, understanding and wise design. That is called Improvement Science.


But if, in an act of desperation, we force constraints onto the system we will make the system less stable, less predictable, less safe, less productive, less enjoyable and less affordable. That is called tampering.

The Pragmatist and the Three Fears

The term Pragmatist is a modern one – it was coined by Charles Sanders Pierce (1839-1914) – a 19th century American polymath and iconoclast. In plain speak he was a tree-shaker and a dogma-breaker; someone who regarded rules created by people as an opportunity for innovation rather than a source of frustration.

A tree-shaker reframes the Three Fears that block change and improvement; the Fear of Ambiguity; the Fear of Ridicule and the Fear of Failure. A tree-shaker re-channels their emotional energy from fear into innovation and exploration. They feel the fear but they do it anyway. But how do they do it?

To understand this we first need to explore how we learn to collectively suppress change by submitting to peer-fear.

In the 1960’s there was an experiment done with Rhesus monkeys that sheds light on a possible mechanism: the monkeys appeared to learn from each other by observing the emotional responses of other monkeys to threats. The story of the Five Monkeys and the Banana Experiment first appeared in a management textbook in 1996  but there is no evidence that this particular experiment was ever performed. With this in mind here is a version of the story:

Five naive monkeys were offered a banana but it required climbing a ladder to get it.  Monkeys like bananas and are good at climbing. The ladder was novel. And every time any of the monkeys started to climb the ladder all the monkeys were sprayed with cold water. Monkeys do not like cold water. It was a classic conditioning experiment and after just a few iterations the monkeys stopped trying to climb the ladder to get the banana. They had learned to fear the ladder and their natural desire for the banana was suppressed by their new fear: a learned association between climbing the ladder and the unpleasant icy shower. Next the psychologists replaced one of the monkeys with a new naive monkey – who immediately started to climb the ladder to get the banana. What happened next is interesting. The other four monkeys pulled the new monkey back. They did not want to get another cold shower. After a while the new monkey learned because his fear of social rejection was greater than his desire for the banana. He stopped trying to get the banana. This cycle was repeated four more times until all the original monkeys had been replaced. None of the five remaining monkeys had any personal experience of the cold shower – but the ladder-avoiding behaviour remained and was enforced by the group, even though the original reason for shunning the ladder was unknown.

Here is the quoted reference to the experiment on which the story is based.

Stephenson, G. R. (1967). Cultural acquisition of a specific learned response among rhesus monkeys. In: Starek, D., Schneider, R., and Kuhn, H. J. (eds.), Progress in Primatology, Stuttgart: Fischer, pp. 279-288.

So it would appear that a very special type of monkey would be needed to break a culturally enforced behavioural norm. One that is curious, creative and courageous, and one that does not fear ridicule or failure. One that is immune to peer-fear.

We could extrapolate from this story and reflect on how peer pressure might impede change and improvement in the workplace.  When well-intended, innocent, creativity and innovation are met with the emotional ice-bath of dire warnings, criticism, ridicule and cynicism then the unconfident innovator may eventually give up trying and start to believe that improvement is impossible.  The Hans Christian Anderson’s short tale of the Emporer’s New Clothes is a well known example – the one innocent child says what all the experienced adults have learned to deny. A culture of peer-fear can become self-sustaining and this change-avoiding-culture appears to be a common state of affairs in many organisations; in particular ones of an academic and bureaucratic leaning.

At the other end of the change spectrum from Bureaucracy sits Chaos. It is also resisted but the behaviour is fuelled by a different fear – the Fear of Ambiguity. We prefer the known and the predictable. We follow ingrained habits. We prevaricate even when our rationality says we should change.  We dislike the feeling of ambiguity and uncertainty because it leaves us with a sense of foreboding and dread. Change is strongly associated with confusion and we appear hard-wired to avoid it. Except that we are not. This is learned behaviour and we learned it when we were very young. As adults we reinforce it; as adults we replicate it; and as adults impose it on others – including our next generation. The generation that will inherit our world and who will look after us when we are old and frail. We will reap what we sow. But if we learned it and teach it then are we able to unlearn it and unteach it?

Enter the Pragmatists. They have learned to harness the Three Fears. Or rather they have unlearned their association of Fear with Change. Sometimes this unlearning came from a crisis – they were forced to change by external factors. Doing nothing was not an option. Sometimes their unlearning came from inspiration – they saw someone else demonstrate that other options were possible and beneficial. Sometimes their insight came by surprise – an unexpected change of perspective exposed the hidden opportunity. An eureka moment.

Whatever the route the Pragmatist discovers a new tool: a tool labelled “Heuristics”.  A heuristic is a “rule of thumb” – an empirically derived good-enough-for-now guideline. Heuristics include some uncertainty, some ambiguity and some risk. Just enough uncertainty and ambiguity to build a flexible conceptual framework that is strong enough, resilient enough and modifiable enough to facilitate learning and improvement. And with it a pinch of risk to spice the sauce – because we all like a bit of risk.

The Improvement Scientist is a Pragmatist and a Practitioner of Heuristics – both of which can be learned.

Homeostasis

Improvement Science is not just about removing the barriers that block improvement and building barriers to prevent deterioration – it is also about maintaining acceptable, stable and predictable performance.

In fact most of the time this is what we need our systems to do so that we can focus our attention on the areas for improvement rather than running around keeping all the plates spinning.  Improving the ability of a system to maintain itself is a worthwhile and necessary objective.

Long term stability cannot be achieved by assuming a stable context and creating a rigid solution because the World is always changing. Long term stability is achieved by creating resilient solutions that can adjust their behaviour, within limits, to their ever-changing context.

This self-adjusting behaviour of a system is called homeostasis.

The foundation for the concept of homeostasis was first proposed by Claude Bernard (1813-1878) who unlike most of his contemporaries, believed that all living creatures were bound by the same physical laws as inanimate matter.  In his words: “La fixité du milieu intérieur est la condition d’une vie libre et indépendante” (“The constancy of the internal environment is the condition for a free and independent life”).

The term homeostasis is attributed to Walter Bradford Cannon (1871 – 1945) who was a professor of physiology at Harvard medical school and who popularized his theories in a book called The Wisdom of the Body (1932). Cannon described four principles of homeostasis:

  1. Constancy in an open system requires mechanisms that act to maintain this constancy.
  2. Steady-state conditions require that any tendency toward change automatically meets with factors that resist change.
  3. The regulating system that determines the homeostatic state consists of a number of cooperating mechanisms acting simultaneously or successively.
  4. Homeostasis does not occur by chance, but is the result of organised self-government.

Homeostasis is therefore an emergent behaviour of a system and is the result of organised, cooperating, automatic mechanisms. We know this by another name – feedback control – which is passing data from one part of a system to guide the actions of another part. Any system that does not have homeostatic feedback loops as part of its design will be inherently unstable – especially in a changing environment.  And unstable means untrustworthy.

Take driving for example. Our vehicle and its trusting passengers want to get to their desired destination on time and in one piece. To achieve this we will need to keep our vehicle within the boundaries of the road – the white lines – in order to avoid “disappointment”.

As their trusted driver our feedback loop consists of a view of the road ahead via the front windscreen; our vision connected through a working nervous system to the muscles in ours arms and legs; to the steering wheel, accelerator and brakes; then to the engine, transmission, wheels and tyres and finally to the road underneath the wheels. It is quite a complicated multi-step feedback system – but an effective one. The road can change direction and unpredictable things can happen and we can adapt, adjust and remain in control.  An inferior feedback design would be to use only the rear-view mirror and to steer by looking at the whites lines emerging from behind us. This design is just as complicated but it is much less effective and much less safe because it is entirely reactive.  We get no early warning of what we are approaching.  So, any system that uses the output performance as the feedback loop to the input decision step is like driving with just a rear view mirror.  Complex, expensive, unstable, ineffective and unsafe.     

As the number of steps in a process increases the more important the design of  the feedback stabilisation becomes – as does the number of ways we can get it wrong:  Wrong feedback signal, or from the wrong place, or to the wrong place, or at the wrong time, or with the wrong interpretation – any of which result in the wrong decision, the wrong action and the wrong outcome. Getting it right means getting all of it right all of the time – not just some of it right some of the time. We can’t leave it to chance – we have to design it to work.

Let us consider a real example. The NHS 18-week performance requirement.

The stream map shows a simple system with two parallel streams: A and B that each has two steps 1 and 2. A typical example would be generic referral of patients for investigations and treatment to one of a number of consultants who offer that service. The two streams do the same thing so the first step of the system is to decide which way to direct new tasks – to Step A1 or to Step B1. The whole system is required to deliver completed tasks in less than 18 weeks (18/52) – irrespective of which stream we direct work into.   What feedback data do we use to decide where to direct the next referral?

The do nothing option is to just allocate work without using any feedback. We might do that randomly, alternately or by some other means that are independent of the system.  This is called a push design and is equivalent to driving with your eyes shut but relying on hope and luck for a favourable outcome. We will know when we have got it wrong – but it is too late then – we have crashed the system! 

A more plausible option is to use the waiting time for the first step as the feedback signal – streaming work to the first step with the shortest waiting time. This makes sense because the time waiting for the first step is part of the lead time for the whole stream so minimising this first wait feels reasonable – and it is – BUT only in one situation: when the first steps are the constraint steps in both streams [the constraint step is one one that defines the maximum stream flow].  If this condition is not met then we heading for trouble and the map above illustrates why. In this case Stream A is just failing the 18-week performance target but because the waiting time for Step A1 is the shorter we would continue to load more work onto the failing  stream – and literally push it over the edge. In contrast Stream B is not failing and because the waiting time for Step B1 is the longer it is not being overloaded – it may even be underloaded.  So this “plausible” feedback design can actually make the system less stable. Oops!

In our transport metaphor – this is like driving too fast at night or in fog – only being able to see what is immediately ahead – and then braking and swerving to get around corners when they “suddenly” appear and running off the road unintentionally! Dangerous and expensive.

With this new insight we might now reasonably suggest using the actual output performance to decide which way to direct new work – but this is back to driving by watching the rear-view mirror!  So what is the answer?

The solution is to design the system to use the most appropriate feedback signal to guide the streaming decision. That feedback signal needs to be forward looking, responsive and to lead to stable and equitable performance of the whole system – and it may orginate from inside the system. The diagram above holds the hint: the predicted waiting time for the second step would be a better choice.  Please note that I said the predicted waiting time – which is estimated when the task leaves Step 1 and joins the back of the queue between Step 1 and Step 2. It is not the actual time the most recent task came off the queue: that is rear-view mirror gazing again.

When driving we look as far ahead as we can, for what we are heading towards, and we combine that feedback with our present speed to predict how much time we have before we need to slow down, when to turn, in which direction, by how much, and for how long. With effective feedback we can behave proactively, avoid surprises, and eliminate sudden braking and swerving! Our passengers will have a more comfortable ride and are more likely to survive the journey! And the better we can do all that the faster we can travel in both comfort and safety – even on an unfamiliar road.  It may be less exciting but excitement is not our objective. On time delivery is our goal.

Excitement comes from anticipating improvement – maintaining what we have already improved is rewarding.  We need both to sustain us and to free us to focus on the improvement work! 


Systemory

How do we remember the vast amount of information that we seem to be capable of?

Our brains are comprised of billions of cells most of which are actually inactive and just there to support the active brain cells – the neurons.

Suppose that the active brain cell part is 50% and our brain has a volume of about 1.2 litres or 1,200 cu.cm or 1,200,000 cu.mm. We know from looking down a microscope that each neuron is about 20/1,000 mm x 20/1,000 mm  x 20/1,000 mm which gives a volume of 8/1,000,000 cu.mm or 125,000 neurons for every cu.mm. The population of a medium sized town in a grain of salt!  This is a concept we can just about grasp. And with these two facts we estimate that there are in the order of 140,000,000,000 neurons in a human brain – 140 billion – about 20 times the population of the whole World. Wow!

But even that huge number is less than the size of the memory on the hard disc of the computer I am writing this blog on – which has 200 gigabytes which is 1,600 gigabits which is 1,600 billion bits. Ten times as many memory cells as there are neurons in a human brain. 

But our brains are not just for storing data – they do all the data processing too – it is an integrated processor-and-memory design completely unlike the separate processor-or-memory design of a digital computer.  Each of our brains is remarkable in its capability, adaptability, and agility – its ability to cope with change – its ability to learn and to change its behaviour while still working.  So how does our biological memory work?

Well not like a digital computer where the zeros and ones, the binary digits (bits) are stored in regular structure of memory cells – a static structural memory – a data prison.  Our biological memory works in a completely different way – it is a temporal memory – it is time dependent. Our memories are not “recalled” like getting a book out of an indexed slot on a numbered in a massive library; are memories are replayed like a recording or rebuilt from a recipe. Time is the critical factor and this concept of temporal memory is a feature of all systems.

And that is not all – the temporal memory is not a library of video tapes – it is the simultaneous collective action of many parts of the system that create the illusion of the temporal memory – we have a parallel-distributed-temporal-memory. More like a video hologram. And it means we cannot point to the “memory” part of our brains – it is distributed throughout the system – and this means that the connections between the parts are as critical a part of the design and the parts themselves. It is a tricky concept to grasp and none of the billions of digital computers that co-inhabit this planet operate this way. They are feeble and fragile in comparison. An inferior design.

The terms distributed-temporal or systemic-memory are a bit cumbersome though so we need a new label – let us call it a systemory.  The properties of a systemory are remarkable – for example it still works when a bit of the systemory is removed.  When a bit of your brain is removed you don’t “forget” a bit of your name or lose the left ear on the mental picture of your friends face – as would happen with a computer.  A systemory is resilient to damage which is a necessary design-for-survival. It also implies that we can build our systemory with imperfect parts and incomplete connections. In a digital computer this would not work: the localised-static or silo-memory has to be perfect because if a single bit gets flipped or a single wire gets fractured it can render the whole computer inoperative useless junk.

Another design-for-survival property of a systemory is that it still works even when it is being changed – it is continuously adaptable and updateable.  Not so a computer – to change the operating system the computer has to be stopped, the old program overwritten by the new one, then the new one started. In fact computers are designed to prevent programs modifying themselves – because it a sure recipe for a critical system failure – the dreaded blue screen!

So if we map our systemory concept across from person to population and we replace neurons with people then we get an inkling of how a society can have a collective memory, a collective intelligence, a collective consciousness even – a social systemory. We might call that property the culture.  We can also see that the relationships that link the people are as critical as the people themselves and that both can be imperfect yet we get stable and reliable behaviour. We can also see that influencing the relationships between people has as much effect on the system behaviour as how the people themselves perform – because the properties of the systemory are emergent. Culture is an output not an input.

So in the World – the development of global communication systems means that all 7 billion people in the global social systemory can, in principle, connect to each other and can collectively learn and change faster and faster as the technology to connect more widely and more quickly develops. The rate of culture change is no longer governed by physical constraints such as geographic location, orand temporal constraints such as how long a letter takes to be delivered.

Perhaps the most challenging implication is that a systemory does not have a “point of control” – there is no librarian who acts as a gatekeeper to the data bank, no guard on the data prison.  The concept of “control” in a systemory is different – it is global not local – and it is influence not control.  The rapid development of mobile communication technology and social networking gives ample evidence – we would now rather communicate with a familar on the other side of the world than with a stranger standing next to us in the lunch queue. We have become tweeting and texting daemons.  Our emotional relationships are more important than our geographical ones. And if enough people can connect to each other they can act in a collective, coordinated, adaptive and agile way that no command-and-control system can either command or control. The recent events in the Middle East are ample evidence of the emergent effectiveness of a social systemory.

Our insight exposes a weakness of a social systemory – it is possible to adversely affect the whole by introducing a behavioural toxin that acts at the social connection level – on the relationships between people. The behavioural toxin needs only to have a weak and apparently harmless effect but when disseminated globally the cumulative effect creates cultural dysfunction.  It is rather like the effect of alcohol and other recreational chemical substances on the brain – it cause a temporary systemory dysfunction – but one that in an over-stressed psychological system paradoxically results in pleasure; or rather stress release. Hence the self-reinforcing nature of the addiction.  

Effective leaders are intuitively aware that just their behaviour can be a tonic or a toxin for the whole system: organisations are the the same emotional boat as their leader.

Effective leaders use their behaviour to steer the systemory of the organisation along a path of improvement and their behaviour is the output of their personal systemory.

Leaders have to be the change that they want their organisations to achieve.