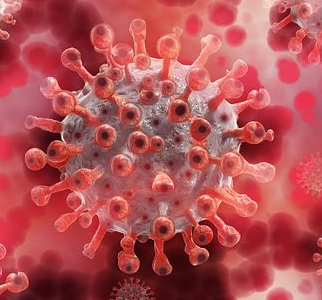
 The start of a new year, decade, century or millennium is always associated with a sense of renewal and hope. Little did we know that in January 2020 a global threat had hatched and was growing in the city of Wuhan, Hubei Province, China. A virus of the family coronaviridae had mutated and jumped from animal to man where it found a new host and a vehicle to spread itself. Several weeks later the World became aware of the new threat and in the West … we ignored it. Maybe we still remember the SARS epidemic which was heralded as a potential global catastrophe but was contained in the Far East and fizzled out. So, maybe we assumed this SARS-like virus would do the same.
It didn’t. This mutant was different. It caused a milder illness and unwitting victims were infectious before they were symptomatic. And most got better on their own, so they spread the mutant to many other people. Combine that mutant behaviour with the winter (when infectious diseases spread more easily because we spend more time together indoors), Chinese New Year and global air travel … and we have the perfect recipe for cooking up a global pandemic of a new infectious disease. But we didn’t know that at the time and we carried on as normal, blissfully unaware of the catastrophe that was unfolding.
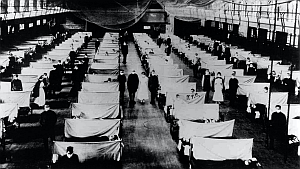
By February 2020 it became apparent that the mutant had escaped containment in China and was wreaking havoc in other countries – with Italy high on the casualty list. We watched in horror at the scenes on television of Italian hospitals overwhelmed with severely ill people fighting for breath as the virus attacked their lungs. The death toll rose sharply but we still went on our ski holidays and assumed that the English Channel and our Quarantine Policy would protect us.
They didn’t. This mutant was different. We now know that it had already silently gained access into the UK and was growing and spreading. The first COVID-19 death reported in the UK was in early March 2020 and only then did we sit up and start to take notice. This was getting too close to home.
But it was too late. The mathematics of how epidemics spread was worked out 100 years ago, not long after the 1918 pandemic of Spanish Flu that killed tens of millions of people before it burned itself out. An epidemic is like cancer. By the time it is obvious it is already far advanced because the growth is not linear – it is exponential.
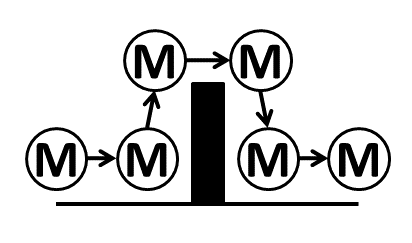
As a systems engineer I am used to building simulation models to reveal the complex and counter-intuitive behaviour of nonlinear systems using the methods first developed by Jay W. Forrester in the 1950’s. And when I looked up the equations that describe epidemics (on Wikipedia) I saw that I could build a system dynamics model of a COVID-19 epidemic using no more than an Excel spreadsheet.
So I did. And I got a nasty surprise. Using the data emerging from China on the nature of the spread of the mutant virus, the incidence of severe illness and the mortality rate … my simple Excel model predicted that, if COVID-19 was left to run its natural course in the UK, then it would burn itself out over several months but the human cost would be 500,000 deaths and the NHS would be completely overwhelmed with a “tsunami of sick”. And I could be one of them! The fact that there is no treatment and no vaccine for this novel threat excluded those options. My basic Excel model confirmed that the only effective option to mitigate this imminent catastrophe was to limit the spread of the virus through social engineering i.e. an immediate and drastic lock-down. Everyone who was not essential to maintaining core services should “Stay at home, Protect the NHS and Save lives“. That would become the mantra. And others were already saying this – epidemiologists whose careers are spent planning for this sort of eventuality. But despite all this there still seemed to be little sense of urgency, perhaps because their super-sophisticated models predicted that the peak of the UK epidemic would be in mid-June so there was time to prepare. My basic model predicted that the peak would be in mid-April, in about 4 weeks, and that it was already too late to prevent about 50,000 deaths.
It turns out I was right. That is exactly what happened. By mid-March 2020 London was already seeing an exponential rise in hospital admissions, intensive care admissions and deaths and suddenly the UK woke up and panicked. By that time I had enlisted the help of a trusted colleague who is a public health doctor and who had studied epidemiology, and together we wrote up and published the emerging story as we saw it:
An Acute Hospital Demand Surge Planning Model for the COVID-19 Epidemic using Stock-and-Flow Simulation in Excel: Part 1. Journal of Improvement Science 2020: 68; 1-20. The link to download the full paper is here.
I also shared the draft paper with another trusted friend and colleague who works for my local clinical commissioning group (CCG) and I asked “Has the CCG a sense of the speed and magnitude of what is about to happen and has it prepared for the tsunami of sick that primary care will need to see?“
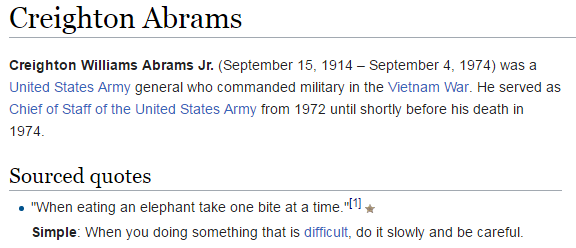
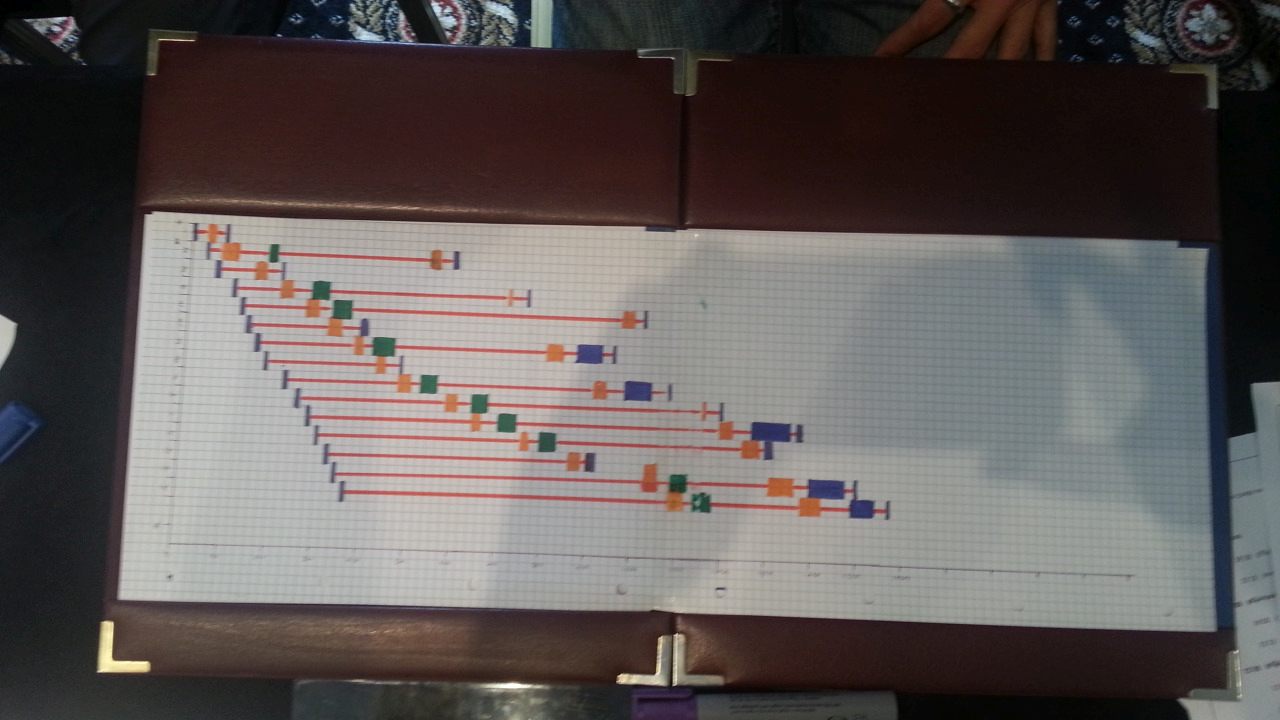
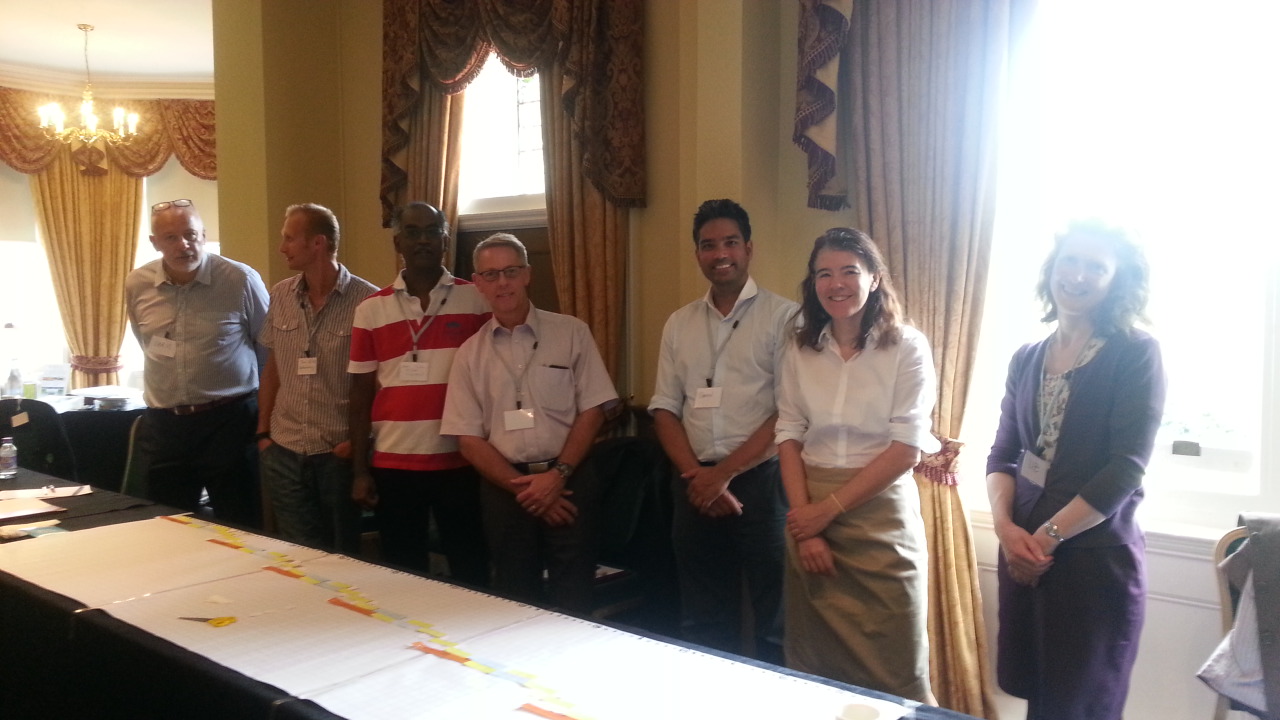
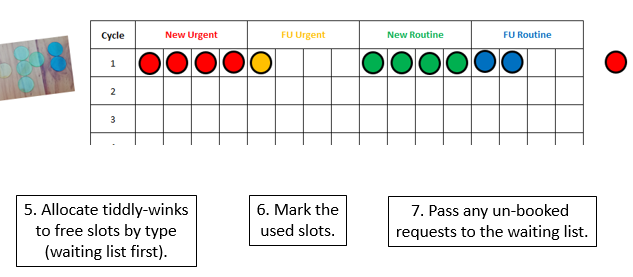
What then ensued was an almost miraculous emergence of a coordinated and committed team of health care professionals and NHS managers with a single, crystal clear goal: To design, build and deliver a high-flow, drive-through community-based facility to safely see-and-assess hundreds of patients per day with suspected COVID-19 who were too sick/worried to be managed on the phone, but not sick enough to go to A&E. This was not a Nightingale Ward – that was a parallel, more public and much more expensive endeavour designed as a spillover for overwhelmed acute hospitals. Our purpose was to help to prevent that and the time scale was short. We had three weeks to do it because Easter weekend was the predicted peak of the COVID-19 surge if the national lock-down policy worked as hoped. No one really had an accurate estimate how effective the lock-down would be and how big the peak of the tsunami of sick would rise as it crashed into the NHS. So, we planned for the worst and hoped for the best. The Covid Referral Centre (CRC) was an insurance policy and we deliberately over-engineered it use to every scrap of space we had been offered in a small car park on the south side of the NEC site.
The CRC needed to open by Sunday 12th April 2020 and we were ready, but the actual opening was delayed by NHS bureaucracy and politics. It did eventually open on 22nd April 2020, just four weeks after we started, and it worked exactly as designed. The demand was, fortunately, less than our worst case scenario; partly because we had missed the peak by 10 days and we opened the gates to a falling tide; and partly because the social distancing policy had been more effective than hoped; and partly because it takes time for risk-averse doctors to develop trust and to change their ingrained patterns of working. A drive-thru COVID-19 see-and-treat facility? That was innovative and untested!!
The CRC expected to see a falling demand as the first wave of COVID-19 washed over, and that exactly is what happened. So, as soon as that prediction was confirmed, the CRC was progressively repurposed to provide other much needed services such as drive-thru blood tests, drive-thru urgent care, and even outpatient clinics in the indoor part of the facility.
The CRC closed its gates to suspected COVID-19 patients on 31st July 2020, as planned and as guided by the simple Excel computer model.
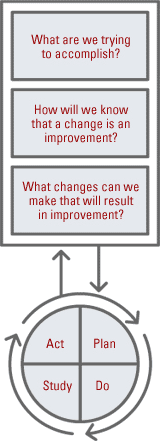
This is health care systems engineering in action.
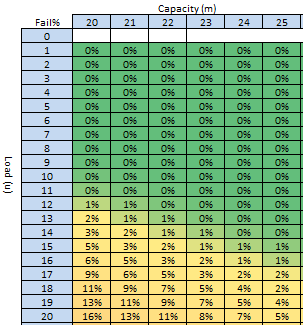
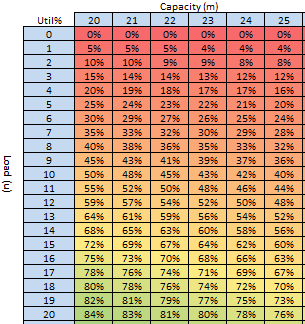
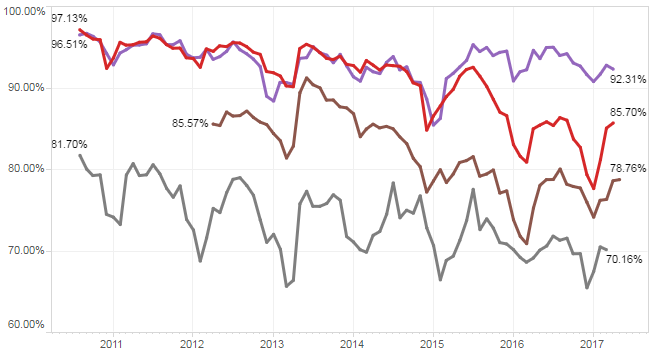
And the simple Excel model has been continuously re-calibrated as fresh evidence has emerged. The latest version predicts that a second peak of COVID-19 (that is potentially worse than the first) will happen in late summer or autumn if social distancing is relaxed too far (see below).
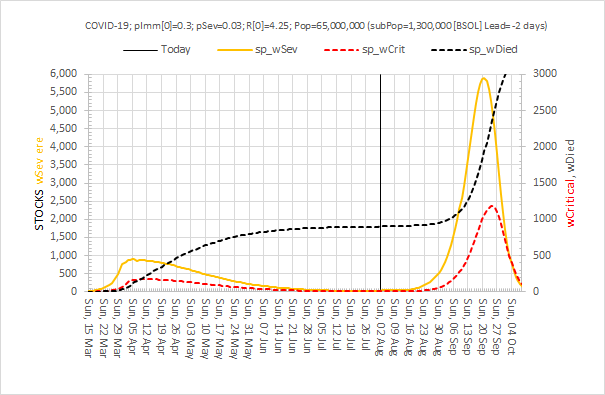
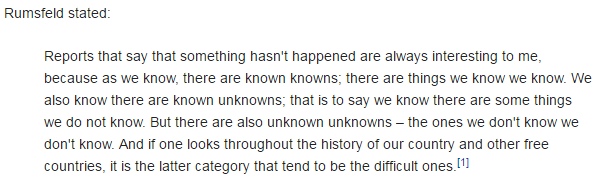
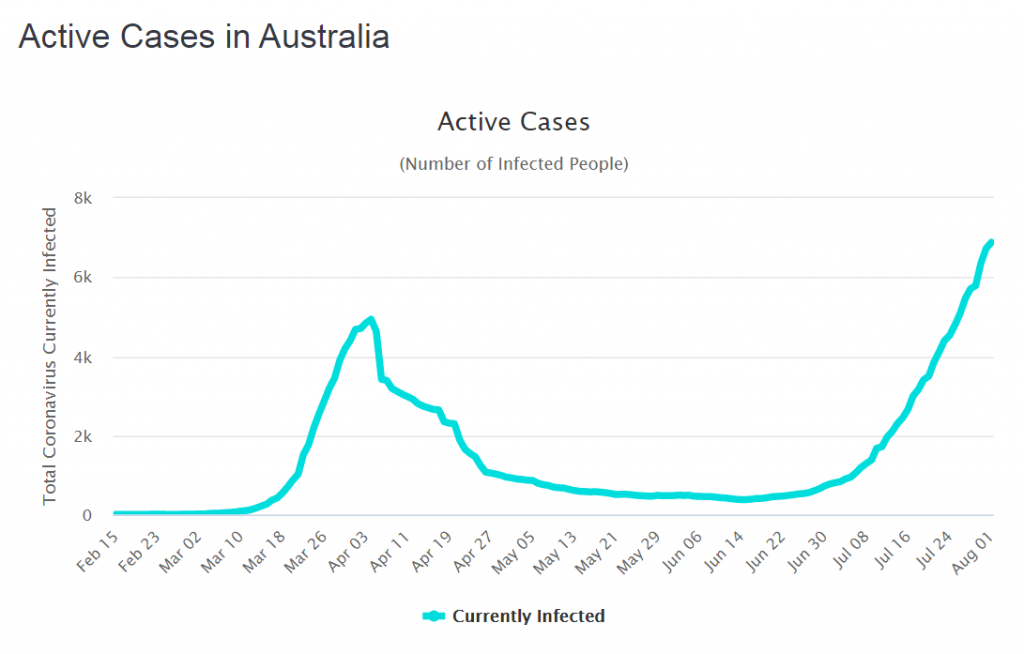
But we don’t know what “too far” looks like in practical terms. Oh, and a second wave could kick off just just when we expect the annual wave of seasonal influenza to arrive. Or will it? Maybe the effect of social distancing for COVID-19 in other countries will suppress the spread of seasonal flu as well? We don’t know that either but the data of the incidence of flu from Australia certainly supports that hypothesis.
We may need a bit more health care systems engineering in the coming months. We shall see.
Oh, and if we are complacent enough to think a second wave could never happen in the UK … here is what is happening in Australia.


 Abstract