Managing Complex Change

There is no doubt about it: Change is Difficult. None of us like it. We all prefer the comfort and security of sameness. We are wired that way. Yet, change is inevitable. So, what can we do?

One option is to ignore it. Another is to resist it. And another is to make the best of it. It is even possible to embrace and celebrate it!

And what if we are responsible for managing change that will have an effect on others? That is a whole order of magnitude more difficult. There is an oft quoted statistic that 70% of change initiatives fail – which proves that it must be more difficult than the originators anticipated. Yet, if we look around we can examples of successful change everywhere – so it must be possible to manage it. How is it done? What are the traps to avoid? What do we need? What don’t we need? Where do we start? Who can we ask for guidance?

If we search the Web or use an AI assistant like ChatGPT, we will discover a multitude of change models such as Kurt Lewin’s Unfreeze-Change-Refreeze model or John Kotter’s Eight Steps. And if we compare and contrast these recipes we will find common themes such as the importance of leadership, and vision and a clear plan. That all makes sense.

What is more difficult to find are root cause analyses of failed changes that we can learn from. No one likes to talk about their failures but we need to compare the successes and failures to find the nuggets of wisdom that we can learn from and use to reduce the risk of failure for our own change initiatives. Learn to fail or fail to learn.

And how do we know if we are on track? What are the early warning signs of an impending failure that we could use to get us back on track or give us the confidence to abandon the attempt before too much time, money, blood, sweat and tears are wasted?


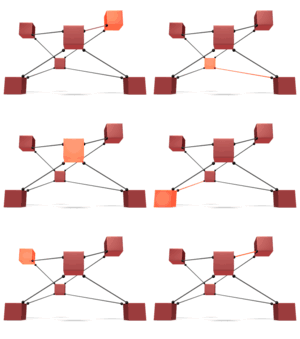
These are questions that have been buzzing around for years and recently I chanced across something that caught my eye. It was diagram that I had not come across before.

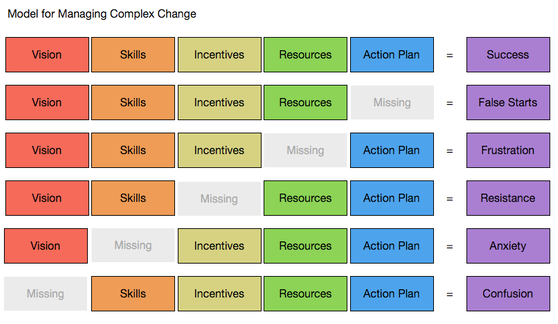
Two things immediately struck me. The first was the explicit inclusion of “Skills’ in the recipe for success. That made sense to me. The second was the symptoms of what happens if an ingredient of the complex change recipe is missing. Those made sense to me too because I have experienced them all.

The diagram I found was not attributed so I did a bit of searching – using the five ingredients as a starter. What I discovered was fascinating – a sort of Chinese Whispers story with different names attached to emergent variants of the diagram. I persevered and eventually found the original source – Dr Mary Lippitt who created and copyrighted the diagram in 1987.


The next thing I did was float the Lippitt diagram with other people who are actively working in applying the science of improvement in the health care sector – and who are faced with the challenge of having to manage complex change. The Lippitt diagram resonated strongly with them too – which I saw as a good sign.

I then found Dr Mary Lippitt’s email address and emailed her, out of the blue. And she replied almost immediately, thanked me, and we arranged to have a Zoom chat. It was fascinating. What I learned was that her passion for complex change blossomed when she inherited her father Gordon’s consulting business. He, like his older brother Ronald, worked in the organisational change domain and he wrote a book entitled “Organization Renewal” whose second edition was published in 1982. And I discovered that Ronald Lippitt was a colleague of Kurt Lewin – the Father of Social Psychology. So, the pedigree of the diagram I came across by chance is impeccable!


Changing even a small part of a health care system is a tough sociotechnical challenge and I have learned the hard way that a combination of social and technical skills are required. Many of these skills appear to be missing in health care organisations and that skills gap leads to the commonest source of resistance to change that I see: Anxiety.

It also goes some way to explain why we made significant progress in delivering health care service improvements when we focussed on giving the front line staff

a) the necessary technical skills to diagnose the causes of their service issues, and

b) the skills to redesign their processes to release the improvements they wanted to see.

We now have good evidence that we also, unwittingly, developed the complementary social skills to help spread the word of what is possible and how to achieve it organically across teams, departments and organisations.

So, with her generous permission, we will be using Dr Mary Lippitt’s diagram to tell the story of how to manage complex change, and we will share what we learn as we go.

Restoring Pride-in-Work

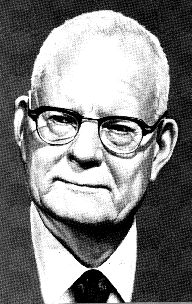
In 1986, Dr Don Berwick from Boston attended a 4-day seminar run by Dr W. Edwards Deming in Washington.  Dr Berwick was a 40 year old paediatrician who was also interested in health care management and improving quality and productivity.  Dr Deming was an 86 year old engineer and statistician who, when he was in his 40’s, helped the US to improve the quality and productivity of the industrial processes supporting the US and Allies in WWII.

Don Berwick describes attending the seminar as an emotionally challenging life-changing experience when he realised that his well-intended attempts to improve quality by inspection-and-correction was a counterproductive, abusive approach that led to fear, demotivation and erosion of pride-in-work.  His blinding new clarity of insight led directly to the Institute of Healthcare Improvement in the USA in the early 1990’s.

One of the tenets of Dr Deming’s theories is that the ingrained beliefs and behaviours that erode pride-in-work also lead to the very outcomes that management do not want – namely conflict between managers and workers and economic failure.

So, an explicit focus on improving pride-in-work as an early objective in any improvement exercise makes very good economic sense, and is a sign of wise leadership and competent management.


Last week a case study was published that illustrates exactly that principle in action.  The important message in the title is “restore the calm”.

One of the most demotivating aspects of health care that many complain about is the stress caused a chaotic environment, chronic crisis and perpetual firefighting.  So, anything that can restore calm will, in principle, improve motivation – and that is good for staff, patients and organisations.

The case study describes, in detail, how calm was restored in a chronically chaotic chemotherapy day unit … on Weds, June 19th 2019 … in one day and at no cost!

To say that the chemotherapy nurses were surprised and delighted is an understatement.  They were amazed to see that they could treat the same number of patients, with the same number of staff, in the same space and without the stress and chaos.  And they had time to keep up with the paperwork; and they had time for lunch; and they finished work 2 hours earlier than previously!

Such a thing was not possible surely? But here they were experiencing it.  And their patients noticed the flip from chaos-to-strangely-calm too.

The impact of the one-day-test was so profound that the nurses voted to adopt the design change the following week.  And they did.  And the restored calm has been sustained.


What happened next?

The chemotherapy nurses were able to catch up with their time-owing that had accumulated from the historical late finishes.  And the problem of high staff turnover and difficultly in recruitment evaporated.  Highly-trained chemotherapy nurses who had left because of the stressful chaos now want to come back.  Pride-in-work has been re-established.  There are no losers.  It is a win-win-win result for staff, patients and organisations.


So, how was this “miracle” achieved?

Well, first of all it was not a miracle.  The flip from chaos-to-calm was predicted to happen.  In fact, that was the primary objective of the design change.

So, how what this design change achieved?

By establishing the diagnosis first – the primary cause of the chaos – and it was not what the team believed it was.  And that is the reason they did not believe the design change would work; and that is the reason they were so surprised when it did.

So, how was the diagnosis achieved?

By using an advanced systems engineering technique called Complex Physical System (CPS) modelling.  That was the game changer!  All the basic quality improvement techniques had been tried and had not worked – process mapping, direct observation, control charts, respectful conversations, brainstorming, and so on.  The system structure was too complicated. The system behaviour was too complex (i.e. chaotic).

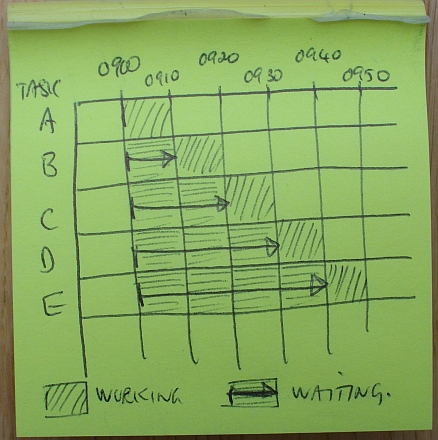
What CPS revealed was that the primary cause of the chaotic behaviour was the work scheduling policy.  And with that clarity of focus, the team were able to re-design the policy themselves using a simple paper-and-pen technique.  That is why it cost nothing to change.

So, why hadn’t they been able to do this before?

Because systems engineering is not a taught component of the traditional quality improvement offerings.  Healthcare is rather different to manufacturing! As the complexity of the health care system increases we need to learn the more advanced tools that are designed for this purpose.

What is the same is the principle of restoring pride-in-work and that is what Dr Berwick learned from Dr Deming in 1986, and what we saw happen on June 19th, 2019.

To read the story of how it was done click here.

Crossing the Chasm

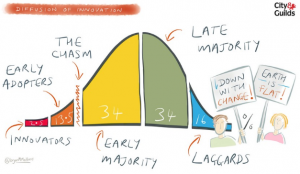
Innovation means anything new and new ideas spread through groups of people in a characteristic way that was described by Everett Rogers in the 1970’s.

The evidence showed that innovation started with the small minority of innovators (about 2%)  and  diffuses through the population – first to the bigger minority called early adopters.

Later, it became apparent that the diffusion path was not smooth and that there was a chasm into which many promising innovations fell and from which they did not emerge.

If this change chasm can be bridged then a tipping point is achieved when wider adoption by the majority becomes much more likely.

And for innovations that fundamentally change the way we live and work, this whole process can take decades! Generations even.

Take mobile phones and the Internet as good examples. How many can remember life before those innovations?  And we are living the transition to renewable energy, artificial intelligence and electric cars.


So, it is very rewarding to see growing evidence that the innovators who started the health care improvement movement back in the 1990’s, such as Dr Don Berwick in the USA and Dr Kate Silvester in the UK, have grown a generation of early adopters who now appear to have crossed the chasm.

The evidence for that can be found on the NHS Improvement website – for example the QSIR site (Quality, Service Improvement and Redesign).

Browsing through the QSIR catalogue of improvement tools I recognised them all from previous incarnations developed and tested by the NHS Modernisation Agency and NHS Institute for Innovation and Improvement.  And although those organisations no longer exist, they served as incubators for the growing community of healthcare improvement practitioners (CHIPs) and their legacy lives on.

This is all good news because we now also have a new NHS Long Term Plan which sets out an ambitious vision for the next 10 years and it is going to need a lot of work from the majority of people who work in the NHS to deliver. That will need capability-at-pace-and-scale.

And this raises some questions:

Q1: Will the legacy of the MA and NHSi scale to meet the more challenging task of designing and delivering the vision of a system of Integrated Care Systems (ICS) that include primary care, secondary care, community care, mental health and social care?

Q2: Will some more innovation be required?

If history is anything to go by, then I suspect the the answers will be “Q1: No” and “Q2: Yes”.

Bring it on!

One Small Step … One Giant Leap

It is 50 years today that Apollo 11 landed men on the moon – and the final small step for one man, astronaut Neil Armstrong, was indeed a giant leap for mankind.

Achieving that goal was the result of a massive programme of inspiration, innovation, investment, exploration and emergent learning that has led directly to many of the everyday things that we take for granted.  Portable computers and the Internet are just two spin-offs that our 21st Century society could not function without.


I have also just finished reading “Into the Black” which is the gripping story of the first flight of the Space Shuttle in April 1981.

This was another giant technical and cultural leap that paved the way for the International Space Station.


And it has not been plain sailing.  There have been very visible disasters that have shocked the world and challenged our complacency.

This is how complex system design is – few notice when it works – and everyone notices when it fails.

The emerging body of knowledge that NASA used is called systems engineering and it can be applied to any system, of any size and any complexity.

And that includes health care.

So, today is a time to pause, reflect and celebrate these awe inspiring achievements.  And to draw hope from them because the challenges that health care faces today require no less a commitment to investment in learning how to improve-by-design.

That is health care systems engineering.

System Dynamics

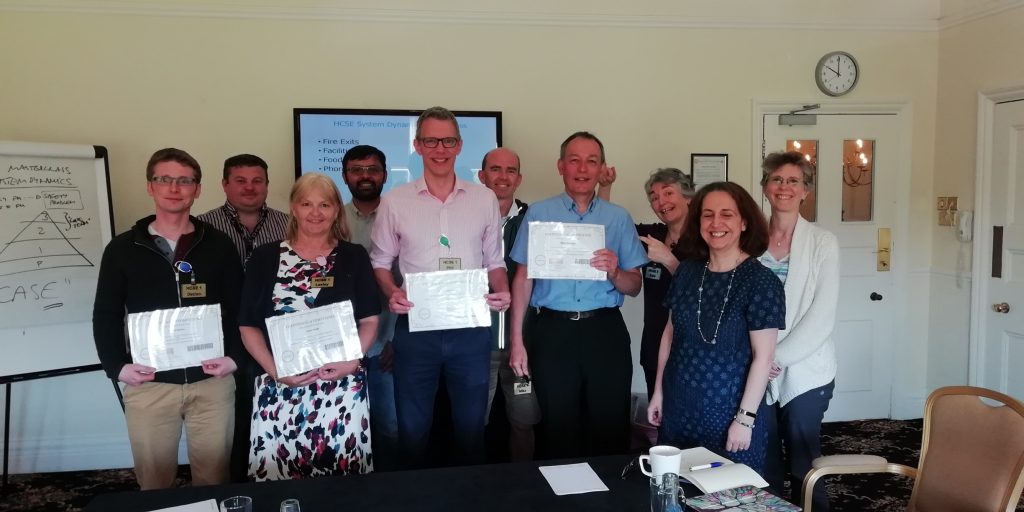
On Thursday we had a very enjoyable and educational day.  I say “we” because there were eleven of us learning together.

There was Declan, Chris, Lesley, Imran, Phil, Pete, Mike, Kate, Samar and Ellen and me (behind the camera).  Some are holding their long-overdue HCSE Level-1 Certificates and Badges that were awarded just before the photo was taken.

The theme for the day was System Dynamics which is a tried-and-tested approach for developing a deep understanding of how a complex adaptive system (CAS) actually works.  A health care system is a complex adaptive system.

The originator of system dynamics is Jay Wright Forrester who developed it around the end of WW2 (i.e. about 80 years ago) and who later moved to MIT.  Peter Senge, author of The Fifth Discipline was part of the same group as was Donella Meadows who wrote Limits to Growth.  Their dream was much bigger – global health – i.e. the whole planet not just the human passengers!  It is still a hot topic [pun intended].


The purpose of the day was to introduce the team of apprentice health care system engineers (HCSEs) to the principles of system dynamics and to some of its amazing visualisation and prediction techniques and tools.

The tangible output we wanted was an Excel-based simulation model that we could use to solve a notoriously persistent health care service management problem …

How to plan the number of new and review appointment slots needed to deliver a safe, efficient, effective and affordable chronic disease service?

So, with our purpose in mind, the problem clearly stated, and a blank design canvas we got stuck in; and we used the HCSE improvement-by-design framework that everyone was already familiar with.

We made lots of progress, learned lots of cool stuff, and had lots of fun.

We didn’t quite get to the final product but that was OK because it was a very tough design assignment.  We got 80% of the way there though which is pretty good in one day from a standing start.  The last 20% can now be done by the HCSEs themselves.

We were all exhausted at the end.  We had worked hard.  It was a good day.


And I am already looking forward to the next HCSE Masterclass that will be in about six weeks time.  This one will address another chronic, endemic, systemic health care system “disease” called carveoutosis multiforme fulminans.

The 85% Optimum Bed Occupancy Myth

A few years ago I had a rant about the dangers of the widely promoted mantra that 85% is the optimum average measured bed-occupancy target to aim for.

But ranting is annoying, ineffective and often counter-productive.

So, let us revisit this with some calm objectivity and disprove this Myth a step at a time.

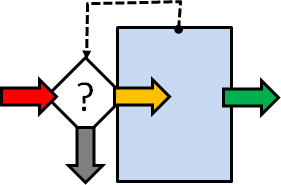
The diagram shows the system of interest (SoI) where the blue box represents the beds, the coloured arrows are the patient flows, the white diamond is a decision and the dotted arrow is information about how full the hospital is (i.e. full/not full).

A new emergency arrives (red arrow) and needs to be admitted. If the hospital is not full the patient is moved to an empty bed (orange arrow), the medical magic happens, and some time later the patient is discharged (green arrow).  If there is no bed for the emergency request then we get “spillover” which is the grey arrow, i.e. the patient is diverted elsewhere (n.b. these are critically ill patients …. they cannot sit and wait).


This same diagram could represent patients trying to phone their GP practice for an appointment.  The blue box is the telephone exchange and if all the lines are busy then the call is dropped (grey arrow).  If there is a line free then the call is connected (orange arrow) and joins a queue (blue box) to be answered some time later (green arrow).

In 1917, a Danish mathematician/engineer called Agner Krarup Erlang was working for the Copenhagen Telephone Company and was grappling with this very problem: “How many telephone lines do we need to ensure that dropped calls are infrequent AND the switchboard operators are well utilised?

This is the perennial quality-versus-cost conundrum. The Value-4-Money challenge. Too few lines and the quality of the service falls; too many lines and the cost of the service rises.

Q: Is there a V4M ‘sweet spot” and if so, how do we find it? Trial and error?

The good news is that Erlang solved the problem … mathematically … and the not-so good news is that his equations are very scary to a non mathematician/engineer!  So this solution is not much help to anyone else.


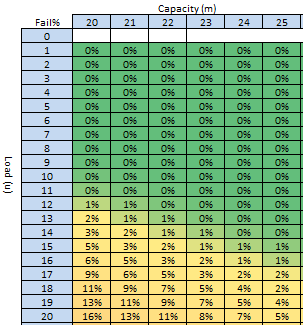
Fortunately, we have a tool for turning scary-equations into easy-2-see-pictures; our trusty Excel spreadsheet. So, here is a picture called a heat-map, and it was generated from one of Erlang’s equations using Excel.

The Erlang equation is lurking in the background, safely out of sight.  It takes two inputs and gives one output.

The first input is the Capacity, which is shown across the top, and it represents the number of beds available each day (known as the space-capacity).

The second input is the Load (or offered load to use the precise term) which is down the left side, and is the number of bed-days required per day (e.g. if we have an average of 10 referrals per day each of whom would require an average 2-day stay then we have an average of 10 x 2 = 20 bed-days of offered load per day).

The output of the Erlang model is the probability that a new arrival finds all the beds are full and the request for a bed fails (i.e. like a dropped telephone call).  This average probability is displayed in the cell.  The colour varies between red (100% failure) and green (0% failure), with an infinite number of shades of red-yellow-green in between.

We can now use our visual heat-map in a number of ways.

a) We can use it to predict the average likelihood of rejection given any combination of bed-capacity and average offered load.

Suppose the average offered load is 20 bed-days per day and we have 20 beds then the heat-map says that we will reject 16% of requests … on average (bottom left cell).  But how can that be? Why do we reject any? We have enough beds on average! It is because of variation. Requests do not arrive in a constant stream equal to the average; there is random variation around that average.  Critically ill patients do not arrive at hospital in a constant stream; so our system needs some resilience and if it does not have it then failures are inevitable and mathematically predictable.

b) We can use it to predict how many beds we need to keep the average rejection rate below an arbitrary but acceptable threshold (i.e. the quality specification).

Suppose the average offered load is 20 bed-days per day, and we want to have a bed available more than 95% of the time (less than 5% failures) then we will need at least 25 beds (bottom right cell).

c) We can use it to estimate the maximum average offered load for a given bed-capacity and required minimum service quality.

Suppose we have 22 beds and we want a quality of >=95% (failure <5%) then we would need to keep the average offered load below 17 bed-days per day (i.e. by modifying the demand and the length of stay because average load = average demand * average length of stay).


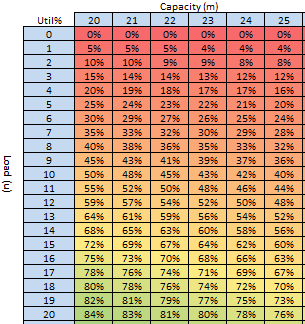
There is a further complication we need to be mindful of though … the measured utilisation of the beds is related to the successful admissions (orange arrow in the first diagram) not to the demand (red arrow).  We can illustrate this with a complementary heat map generated in Excel.

For scenario (a) above we have an offered load of 20 bed-days per day, and we have 20 beds but we will reject 16% of requests so the accepted bed load is only 16.8 bed days per day  (i.e. (100%-16%) * 20) which is the reason that the average  utilisation is only 16.8/20 = 84% (bottom left cell).

For scenario (b) we have an offered load of 20 bed-days per day, and 25 beds and will only reject 5% of requests but the average measured utilisation is not 95%, it is only 76% because we have more beds (the accepted bed load is 95% * 20 = 19 bed-days per day and 19/25 = 76%).

For scenario (c) the average measured utilisation would be about 74%.


So, now we see the problem more clearly … if we blindly aim for an average, measured, bed-utilisation of 85% with the untested belief that it is always the optimum … this heat-map says it is impossible to achieve and at the same time offer an acceptable quality (>95%).

We are trading safety for money and that is not an acceptable solution in a health care system.


So where did this “magic” value of 85% come from?

From the same heat-map perhaps?

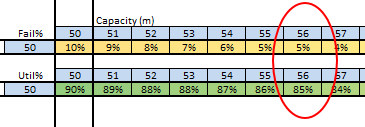
If we search for the combination of >95% success (<5% fail) and 85% average bed-utilisation then we find it at the point where the offered load reaches 50 bed-days per day and we have a bed-capacity of 56 beds.

And if we search for the combination of >99% success (<1% fail) and 85% average utilisation then we find it with an average offered load of just over 100 bed-days per day and a bed-capacity around 130 beds.

H’mm.  “Houston, we have a problem“.


So, even in this simplified scenario the hypothesis that an 85% average bed-occupancy is a global optimum is disproved.

The reality is that the average bed-occupancy associated with delivering the required quality for a given offered load with a specific number of beds is almost never 85%.  It can range anywhere between 50% and 100%.  Erlang knew that in 1917.


So, if a one-size-fits-all optimum measured average bed-occupancy assumption is not valid then how might we work out how many beds we need and predict what the expected average occupancy will be?

We would design the fit-4-purpose solution for each specific context …
… and to do that we need to learn the skills of complex adaptive system design …
… and that is part of the health care systems engineering (HCSE) skill-set.


The Rise And Fall of Quality Improvement

“Those who cannot remember the past are condemned to repeat it”.

Aphorism by George Santayana, philosopher (1863-1952).

And the history of quality improvement (QI) is worth reflecting on, because there is massive pressure to grow QI capability in health care as a way of solving some chronic problems.

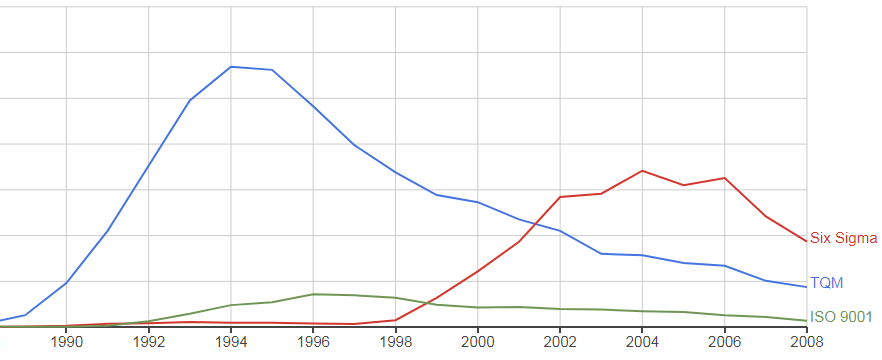
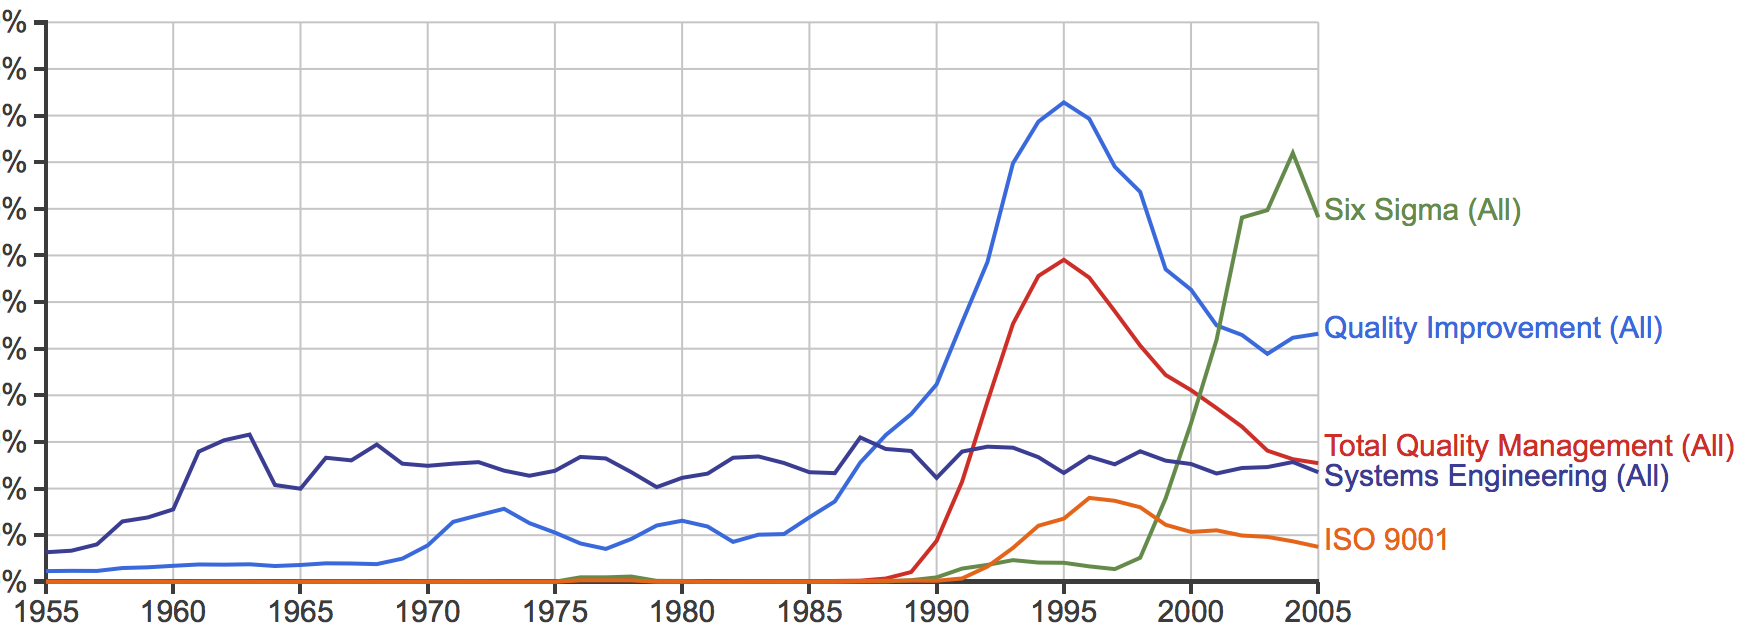
The chart below is a Google Ngram, it was generated using some phrases from the history of Quality Improvement:

TQM = the total quality management movement that grew from the work of Walter Shewhart in the 1920’s and 30’s and was “incubated” in Japan after being transplanted there by Shewhart’s student W. Edwards Deming in the 1950’s.
ISO 9001 = an international quality standard first published in 2000 that developed from the British Standards Institute (BSI) in the 1970’s via ISO 9000 that was first published in 1987.
Six Sigma = a highly statistical quality improvement / variation reduction methodology that originated in the rapidly expanding semiconductor industry in the 1980’s.

The rise-and-fall pattern is characteristic of how innovations spread; there is a long lag phase, then a short accelerating growth phase, then a variable plateau phase and then a long, decelerating decline phase.

It is called a life-cycle. It is how complex adaptive systems behave. It is how innovations spread. It is expected.

So what happened?

Did the rise of TQM lead to the rise of ISO 9000 which triggered the development of the Six Sigma methodology?

It certainly looks that way.

So why is Six Sigma “dying”?  Or is it just being replaced by something else?


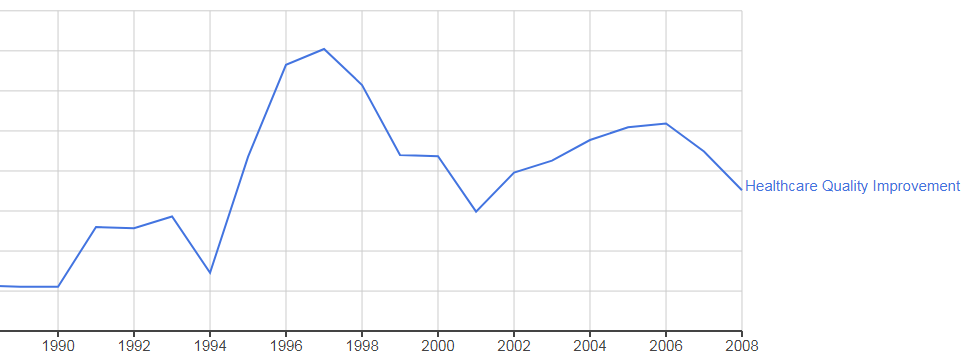
This is the corresponding Ngram for “Healthcare Quality Improvement” which seems to sit on the timeline in about the same place as ISO 9001 and that suggests that it was triggered by the TQM movement. 

The Institute of Healthcare Improvement (IHI) was officially founded in 1991 by Dr Don Berwick, some years after he attended one of the Deming 4-day workshops and had an “epiphany”.

Don describes his personal experience in a recent plenary lecture (from time 01:07).  The whole lecture is worth watching because it describes the core concepts and principles that underpin QI.


So given the fact that safety and quality are still very big issues in health care – why does the Ngram above suggest that the use of the term Quality Improvement does not sustain?

Will that happen in healthcare too?

Could it be that there is more to improvement than just a focus on safety (reducing avoidable harm) and quality (improving patient experience)?

Could it be that flow and productivity are also important?

The growing angst that permeates the NHS appears to be more focused on budgets and waiting-time targets (4 hrs in A&E, 63 days for cancer, 18 weeks for scheduled care, etc.).

Mortality and Quality hardly get a mention any more, and the nationally failed waiting time targets are being quietly dropped.

Is it too politically embarrassing?

Has the NHS given up because it firmly believes that pumping in even more money is the only solution, and there isn’t any more in the tax pot?


This week another small band of brave innovators experienced, first-hand, the application of health care systems engineering (HCSE) to a very common safety, flow, quality and productivity problem …

… a chronically chaotic clinic characterized by queues and constant calls for more capacity and cash.

They discovered that the queues, delays and chaos (i.e. a low quality experience) were not caused by lack of resources; they were caused by flow design.  They were iatrogenic.  And when they applied the well-known concepts and principles of scheduling design, they saw the queues and chaos evaporate, and they measured a productivity increase of over 60%.

OMG!

Improvement science is more than just about safety and quality, it is about flow and productivity as well; because we all need all four to improve at the same time.

And yes we need all the elements of Deming’s System of Profound Knowledge (SoPK), but need more than that.  We need to harness the knowledge of the engineers who for centuries have designed and built buildings, bridges, canals, steam engines, factories, generators, telephones, automobiles, aeroplanes, computers, rockets, satellites, space-ships and so on.

We need to revisit the legacy of the engineers like Watt, Brunel, Taylor, Gantt, Erlang, Ford, Forrester and many, many others.

Because it does appear to be possible to improve-by-design as well as to improve-by-desire.

Here is the Ngram with “Systems Engineering” (SE) added and the time line extended back to 1955.  Note the rise of SE in the 1950’s and 1960’s and note that it has sustained.

That pattern of adoption only happens when something is proven to be fit-4-purpose, and is valued and is respected and is promoted and is taught.

What opportunity does systems engineering offer health care?

That question is being actively explored … here.

Catch-22

There is a Catch-22 in health care improvement and it goes a bit like this:

Most people are too busy fire-fighting the chronic chaos to have time to learn how to prevent the chaos, so they are stuck.

There is a deeper Catch-22 as well though:

The first step in preventing chaos is to diagnose the root cause and doing that requires experience, and we don’t have that experience available, and we are too busy fire-fighting to develop it.


Health care is improvement science in action – improving the physical and psychological health of those who seek our help. Patients.

And we have a tried-and-tested process for doing it.

First we study the problem to arrive at a diagnosis; then we design alternative plans to achieve our intended outcome and we decide which plan to go with; and then we deliver the plan.

Study ==> Plan ==> Do.

Diagnose  ==> Design & Decide ==> Deliver.

But here is the catch. The most difficult step is the first one, diagnosis, because there are many different illnesses and they often present with very similar patterns of symptoms and signs. It is not easy.

And if we make a poor diagnosis then all the action plans that follow will be flawed and may lead to disappointment and even harm.

Complaints and litigation follow in the wake of poor diagnostic ability.

So what do we do?

We defer reassuring our patients, we play safe, we request more tests and we refer for second opinions from specialists. Just to be on the safe side.

These understandable tactics take time, cost money and are not 100% reliable.  Diagnostic tests are usually precisely focused to answer specific questions but can have false positive and false negative results.

To request a broad batch of tests in the hope that the answer will appear like a rabbit out of a magician’s hat is … mediocre medicine.


This diagnostic dilemma arises everywhere: in primary care and in secondary care, and in non-urgent and urgent pathways.

And it generates extra demand, more work, bigger queues, longer delays, growing chaos, and mounting frustration, disappointment, anxiety and cost.

The solution is obvious but seemingly impossible: to ensure the most experienced diagnostician is available to be consulted at the start of the process.

But that must be impossible because if the consultants were seeing the patients first, what would everyone else do?  How would they learn to become more expert diagnosticians? And would we have enough consultants?


When I was a junior surgeon I had the great privilege to have the opportunity to learn from wise and experienced senior surgeons, who had seen it, and done it and could teach it.

Mike Thompson is one of these.  He is a general surgeon with a special interest in the diagnosis and treatment of bowel cancer.  And he has a particular passion for improving the speed and accuracy of the diagnosis step; because it can be a life-saver.

Mike is also a disruptive innovator and an early pioneer of the use of endoscopy in the outpatient clinic.  It is called point-of-care testing nowadays, but in the 1980’s it was a radically innovative thing to do.

He also pioneered collecting the symptoms and signs from every patient he saw, in a standard way using a multi-part printed proforma. And he invested many hours entering the raw data into a computer database.

He also did something that even now most clinicians do not do; when he knew the outcome for each patient he entered that into his database too – so that he could link first presentation with final diagnosis.


Mike knew that I had an interest in computer-aided diagnosis, which was a hot topic in the early 1980’s, and also that I did not warm to the Bayesian statistical models that underpinned it.  To me they made too many simplifying assumptions.

The human body is a complex adaptive system. It defies simplification.

Mike and I took a different approach.  We  just counted how many of each diagnostic group were associated with each pattern of presenting symptoms and signs.

The problem was that even his database of 8000+ patients was not big enough! This is why others had resorted to using statistical simplifications.

So we used the approach that an experienced diagnostician uses.  We used the information we had already gleaned from a patient to decide which question to ask next, and then the next one and so on.


And we always have three pieces of information at the start – the patient’s age, gender and presenting symptom.

What surprised and delighted us was how easy it was to use the database to help us do this for the new patients presenting to his clinic; the ones who were worried that they might have bowel cancer.

And what surprised us even more was how few questions we needed to ask arrive at a statistically robust decision to reassure-or-refer for further tests.

So one weekend, I wrote a little computer program that used the data from Mike’s database and our simple bean-counting algorithm to automate this process.  And the results were amazing.  Suddenly we had a simple and reliable way of using past experience to support our present decisions – without any statistical smoke-and-mirror simplifications getting in the way.

The computer program did not make the diagnosis, we were still responsible for that; all it did was provide us with reliable access to a clear and comprehensive digital memory of past experience.


What it then enabled us to do was to learn more quickly by exploring the complex patterns of symptoms, signs and outcomes and to develop our own diagnostic “rules of thumb”.

We learned in hours what it would take decades of experience to uncover. This was hot stuff, and when I presented our findings at the Royal Society of Medicine the audience was also surprised and delighted (and it was awarded the John of Arderne Medal).

So, we called it the Hot Learning System, and years later I updated it with Mike’s much bigger database (29,000+ records) and created a basic web-based version of the first step – age, gender and presenting symptom.  You can have a play if you like … just click HERE.


So what are the lessons here?

  1. We need to have the most experienced diagnosticians at the start of the improvement process.
  2. The first diagnostic assessment can be very quick so long as we have developed evidence-based heuristics.
  3. We can accelerate the training in diagnostic skills using simple information technology and basic analysis techniques.

And exactly the same is true in the health care system improvement.

We need to have an experienced health care improvement practitioner involved at the start, because if we skip this critical study step and move to plan without a correct diagnosis, then we will make errors, poor decisions, and counter-productive actions.  And then generate more work, more queues, more delays, more chaos, more distress and increased costs.

Exactly the opposite of what we want.

Q1: So, how do we develop experienced improvement practitioners more quickly?

Q2: Is there a hot learning system for improvement science?

A: Yes, there is. It can be found here.

Miracle on Tavanagh Avenue

Sometimes change is dramatic. A big improvement appears very quickly. And when that happens we are caught by surprise (and delight).

Our emotional reaction is much faster than our logical response. “Wow! That’s a miracle!


Our logical Tortoise eventually catches up with our emotional Hare and says “Hare, we both know that there is no such thing as miracles and magic. There must be a rational explanation. What is it?

And Hare replies “I have no idea, Tortoise.  If I did then it would not have been such a delightful surprise. You are such a kill-joy! Can’t you just relish the relief without analyzing the life out of it?

Tortoise feels hurt. “But I just want to understand so that I can explain to others. So that they can do it and get the same improvement.  Not everyone has a ‘nothing-ventured-nothing-gained’ attitude like you! Most of us are too fearful of failing to risk trusting the wild claims of improvement evangelists. We have had our fingers burned too often.


The apparent miracle is real and recent … here is a snippet of the feedback:

Notice carefully the last sentence. It took a year of discussion to get an “OK” and a month of planning to prepare the “GO”.

That is not a miracle and some magic … that took a lot of hard work!

The evangelist is the customer. The supplier is an engineer.


The context is the chronic niggle of patients trying to get an appointment with their GP, and the chronic niggle of GPs feeling overwhelmed with work.

Here is the back story …

In the opening weeks of the 21st Century, the National Primary Care Development Team (NPDT) was formed.  Primary care was a high priority and the government had allocated £168m of investment in the NHS Plan, £48m of which was earmarked to improve GP access.

The approach the NPDT chose was:

harvest best practice +
use a panel of experts +
disseminate best practice.

Dr (later Sir) John Oldham was the innovator and figure-head.  The best practice was copied from Dr Mark Murray from Kaiser Permanente in the USA – the Advanced Access model.  The dissemination method was copied from from Dr Don Berwick’s Institute of Healthcare Improvement (IHI) in Boston – the Collaborative Model.

The principle of Advanced Access is “today’s-work-today” which means that all the requests for a GP appointment are handled the same day.  And the proponents of the model outlined the key elements to achieving this:

1. Measure daily demand.
2. Set capacity so that is sufficient to meet the daily demand.
3. Simple booking rule: “phone today for a decision today”.

But that is not what was rolled out. The design was modified somewhere between aspiration and implementation and in two important ways.

First, by adding a policy of “Phone at 08:00 for an appointment”, and second by adding a policy of “carving out” appointment slots into labelled pots such as ‘Dr X’ or ‘see in 2 weeks’ or ‘annual reviews’.

Subsequent studies suggest that the tweaking happened at the GP practice level and was driven by the fear that, by reducing the waiting time, they would attract more work.

In other words: an assumption that demand for health care is supply-led, and without some form of access barrier, the system would be overwhelmed and never be able to cope.


The result of this well-intended tampering with the Advanced Access design was to invalidate it. Oops!

To a systems engineer this is meddling was counter-productive.

The “today’s work today” specification is called a demand-led design and, if implemented competently, will lead to shorter waits for everyone, no need for urgent/routine prioritization and slot carve-out, and a simpler, safer, calmer, more efficient, higher quality, more productive system.

In this context it does not mean “see every patient today” it means “assess and decide a plan for every patient today”.

In reality, the actual demand for GP appointments is not known at the start; which is why the first step is to implement continuous measurement of the daily number and category of requests for appointments.

The second step is to feed back this daily demand information in a visual format called a time-series chart.

The third step is to use this visual tool for planning future flow-capacity, and for monitoring for ‘signals’, such as spikes, shifts, cycles and slopes.

That was not part of the modified design, so the reasonable fear expressed by GPs was (and still is) that by attempting to do today’s-work-today they would unleash a deluge of unmet need … and be swamped/drowned.

So a flood defense barrier was bolted on; the policy of “phone at 08:00 for an appointment today“, and then the policy of  channeling the over spill into pots of “embargoed slots“.

The combined effect of this error of omission (omitting the measured demand visual feedback loop) and these errors of commission (the 08:00 policy and appointment slot carve-out policy) effectively prevented the benefits of the Advanced Access design being achieved.  It was a predictable failure.

But no one seemed to realize that at the time.  Perhaps because of the political haste that was driving the process, and perhaps because there were no systems engineers on the panel-of-experts to point out the risks of diluting the design.

It is also interesting to note that the strategic aim of the NPCT was to develop a self-sustaining culture of quality improvement (QI) in primary care. That didn’t seem to have happened either.


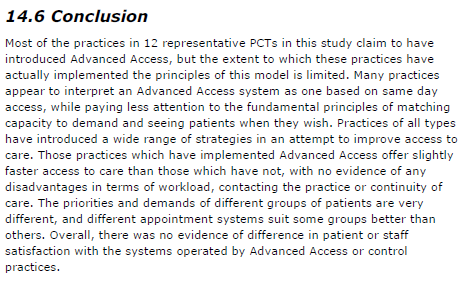
The roll out of Advanced Access was not the success it was hoped. This is the conclusion from the 300+ page research report published in 2007.


The “Miracle on Tavanagh Avenue” that was experienced this week by both patients and staff was the expected effect of this tampering finally being corrected; and the true potential of the original demand-led design being released – for all to experience.

Remember the essential ingredients?

1. Measure daily demand and feed it back as a visual time-series chart.
2. Set capacity so that is sufficient to meet the daily demand.
3. Use a simple booking rule: “phone anytime for a decision today”.

But there is also an extra design ingredient that has been added in this case, one that was not part of the original Advanced Access specification, one that frees up GP time to provide the required “resilience” to sustain a same-day service.

And that “secret” ingredient is how the new design worked so quickly and feels like a miracle – safe, calm, enjoyable and productive.

This is health care systems engineering (HCSE) in action.


So congratulations to Harry Longman, the whole team at GP Access, and to Dr Philip Lusty and the team at Riverside Practice, Tavangh Avenue, Portadown, NI.

You have demonstrated what was always possible.

The fear of failure prevented it before, just as it prevented you doing this until you were so desperate you had no other choices.

To read the fuller story click here.

PS. Keep a close eye on the demand time-series chart and if it starts to rise then investigate the root cause … immediately.


Value, Verify and Validate

thinker_figure_unsolve_puzzle_150_wht_18309Many of the challenges that we face in delivering effective and affordable health care do not have well understood and generally accepted solutions.

If they did there would be no discussion or debate about what to do and the results would speak for themselves.

This lack of understanding is leading us to try to solve a complicated system design challenge in our heads.  Intuitively.

And trying to do it this way is fraught with frustration and risk because our intuition tricks us. It was this sort of challenge that led Professor Rubik to invent his famous 3D Magic Cube puzzle.

It is difficult enough to learn how to solve the Magic Cube puzzle by trial and error; it is even more difficult to attempt to do it inside our heads! Intuitively.


And we know the Rubik Cube puzzle is solvable, so all we need are some techniques, tools and training to improve our Rubik Cube solving capability.  We can all learn how to do it.


Returning to the challenge of safe and affordable health care, and to the specific problem of unscheduled care, A&E targets, delayed transfers of care (DTOC), finance, fragmentation and chronic frustration.

This is a systems engineering challenge so we need some systems engineering techniques, tools and training before attempting it.  Not after failing repeatedly.

se_vee_diagram

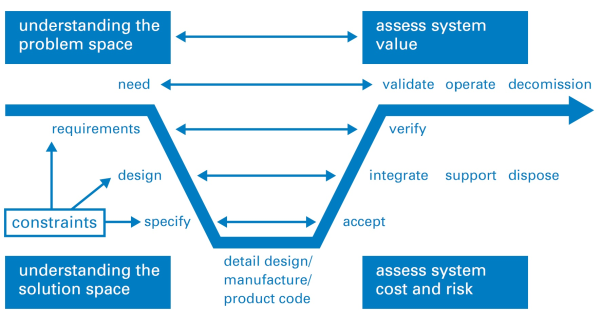
One technique that a systems engineer will use is called a Vee Diagram such as the one shown above.  It shows the sequence of steps in the generic problem solving process and it has the same sequence that we use in medicine for solving problems that patients present to us …

Diagnose, Design and Deliver

which is also known as …

Study, Plan, Do.


Notice that there are three words in the diagram that start with the letter V … value, verify and validate.  These are probably the three most important words in the vocabulary of a systems engineer.


One tool that a systems engineer always uses is a model of the system under consideration.

Models come in many forms from conceptual to physical and are used in two main ways:

  1. To assist the understanding of the past (diagnosis)
  2. To predict the behaviour in the future (prognosis)

And the process of creating a system model, the sequence of steps, is shown in the Vee Diagram.  The systems engineer’s objective is a validated model that can be trusted to make good-enough predictions; ones that support making wiser decisions of which design options to implement, and which not to.


So if a systems engineer presented us with a conceptual model that is intended to assist our understanding, then we will require some evidence that all stages of the Vee Diagram process have been completed.  Evidence that provides assurance that the model predictions can be trusted.  And the scope over which they can be trusted.


Last month a report was published by the Nuffield Trust that is entitled “Understanding patient flow in hospitals”  and it asserts that traffic flow on a motorway is a valid conceptual model of patient flow through a hospital.  Here is a direct quote from the second paragraph in the Executive Summary:

nuffield_report_01
Unfortunately, no evidence is provided in the report to support the validity of the statement and that omission should ring an alarm bell.

The observation that “the hospitals with the least free space struggle the most” is not a validation of the conceptual model.  Validation requires a concrete experiment.


To illustrate why observation is not validation let us consider a scenario where I have a headache and I take a paracetamol and my headache goes away.  I now have some evidence that shows a temporal association between what I did (take paracetamol) and what I got (a reduction in head pain).

But this is not a valid experiment because I have not considered the other seven possible combinations of headache before (Y/N), paracetamol (Y/N) and headache after (Y/N).

An association cannot be used to prove causation; not even a temporal association.

When I do not understand the cause, and I am without evidence from a well-designed experiment, then I might be tempted to intuitively jump to the (invalid) conclusion that “headaches are caused by lack of paracetamol!” and if untested this invalid judgement may persist and even become a belief.


Understanding causality requires an approach called counterfactual analysis; otherwise known as “What if?” And we can start that process with a thought experiment using our rhetorical model.  But we must remember that we must always validate the outcome with a real experiment. That is how good science works.

A famous thought experiment was conducted by Albert Einstein when he asked the question “If I were sitting on a light beam and moving at the speed of light what would I see?” This question led him to the Theory of Relativity which completely changed the way we now think about space and time.  Einstein’s model has been repeatedly validated by careful experiment, and has allowed engineers to design and deliver valuable tools such as the Global Positioning System which uses relativity theory to achieve high positional precision and accuracy.


So let us conduct a thought experiment to explore the ‘faster movement requires more space‘ statement in the case of patient flow in a hospital.

First, we need to define what we mean by the words we are using.

The phrase ‘faster movement’ is ambiguous.  Does it mean higher flow (more patients per day being admitted and discharged) or does it mean shorter length of stage (the interval between the admission and discharge events for individual patients)?

The phrase ‘more space’ is also ambiguous. In a hospital that implies physical space i.e. floor-space that may be occupied by corridors, chairs, cubicles, trolleys, and beds.  So are we actually referring to flow-space or storage-space?

What we have in this over-simplified statement is the conflation of two concepts: flow-capacity and space-capacity. They are different things. They have different units. And the result of conflating them is meaningless and confusing.


However, our stated goal is to improve understanding so let us consider one combination, and let us be careful to be more precise with our terminology, “higher flow always requires more beds“. Does it? Can we disprove this assertion with an example where higher flow required less beds (i.e. space-capacity)?

The relationship between flow and space-capacity is well understood.

The starting point is Little’s Law which was proven mathematically in 1961 by J.D.C. Little and it states:

Average work in progress = Average lead time  X  Average flow.

In the hospital context, work in progress is the number of occupied beds, lead time is the length of stay and flow is admissions or discharges per time interval (which must be the same on average over a long period of time).

(NB. Engineers are rather pedantic about units so let us check that this makes sense: the unit of WIP is ‘patients’, the unit of lead time is ‘days’, and the unit of flow is ‘patients per day’ so ‘patients’ = ‘days’ * ‘patients / day’. Correct. Verified. Tick.)

So, is there a situation where flow can increase and WIP can decrease? Yes. When lead time decreases. Little’s Law says that is possible. We have disproved the assertion.


Let us take the other interpretation of higher flow as shorter length of stay: i.e. shorter length of stay always requires more beds.  Is this correct? No. If flow remains the same then Little’s Law states that we will require fewer beds. This assertion is disproved as well.

And we need to remember that Little’s Law is proven to be valid for averages, does that shed any light on the source of our confusion? Could the assertion about flow and beds actually be about the variation in flow over time and not about the average flow?


And this is also well understood. The original work on it was done almost exactly 100 years ago by Agner Krarup Erlang and the problem he looked at was the quality of customer service of the early telephone exchanges. Specifically, how likely was the caller to get the “all lines are busy, please try later” response.

What Erlang showed was there there is a mathematical relationship between the number of calls being made (the demand), the probability of a call being connected first time (the service quality) and the number of telephone circuits and switchboard operators available (the service cost).


So it appears that we already have a validated mathematical model that links flow, quality and cost that we might use if we substitute ‘patients’ for ‘calls’, ‘beds’ for ‘telephone circuits’, and ‘being connected’ for ‘being admitted’.

And this topic of patient flow, A&E performance and Erlang queues has been explored already … here.

So a telephone exchange is a more valid model of a hospital than a motorway.

We are now making progress in deepening our understanding.


The use of an invalid, untested, conceptual model is sloppy systems engineering.

So if the engineering is sloppy we would be unwise to fully trust the conclusions.

And I share this feedback in the spirit of black box thinking because I believe that there are some valuable lessons to be learned here – by us all.


To vote for this topic please click here.
To subscribe to the blog newsletter please click here.
To email the author please click here.

Socrates the Improvement Coach

One of the challenges involved in learning the science of improvement, is to be able to examine our own beliefs.

We need to do that to identify the invalid assumptions that lead us to make poor decisions, and to act in ways that push us off the path to our intended outcome.

Over two thousand years ago, a Greek philosopher developed a way of exposing invalid assumptions.  He was called Socrates.

The Socratic method involves a series of questions that are posed to help a person or group to determine their underlying beliefs and the extent of their knowledge.  It is a way to develop better hypotheses by steadily identifying and eliminating those that lead to contradictions.

Socrates designed his method to force one to examine one’s own beliefs and the validity of such beliefs.


That skill is as valuable today as it was then, and is especially valuable when we explore complex subjects,  such as improving the performance of our health and social care system.

Our current approach is called reactive improvement – and we are reacting to failure.

Reactive improvement zealots seem obsessed with getting away from failure, disappointment, frustration, fear, waste, variation, errors, cost etc. in the belief that what remains after the dross has been removed is the good stuff. The golden nuggets.

And there is nothing wrong with that.

It has a couple of downsides though:

  1. Removing dross leaves holes, that all too easily fill up with different dross!
  2. Reactive improvement needs a big enough problem to drive it.  A crisis!

The implication is that reactive improvement grinds to a halt as the pressure is relieved and as it becomes mired in a different form of bureaucratic dross … the Quality Control Inspectorate!

No wonder we feel as if we are trapped in a perpetual state of chronic and chaotic mediocrity.


Creative improvement is, as the name suggests, focused on creating something that we want in the future.  Something like a health and social care system that is safe, calm, fit-4-purpose, and affordable.

Creative improvement does not need a problem to get started. A compelling vision and a choice to make-it-so is enough.

Creative improvement does not fizzle out as soon as we improve… because our future vision is always there to pull us forward.  And the more we practice creative improvement, the better we get, the more progress we make, and the stronger the pull becomes.


The main thing that blocks us from using creative improvement are our invalid, unconscious beliefs and assumptions about what is preventing us achieving our vision now.

So we need a way to examine our beliefs and assumptions in a disciplined and robust way, and that is the legacy that Socrates left us.


For more posts like this please vote here.
For more information please subscribe here.

Fragmentation Cost

figure_falling_with_arrow_17621The late Russell Ackoff used to tell a great story. It goes like this:

“A team set themselves the stretch goal of building the World’s Best Car.  So the put their heads together and came up with a plan.

First they talked to drivers and drew up a list of all the things that the World’s Best Car would need to have. Safety, speed, low fuel consumption, comfort, good looks, low emissions and so on.

Then they drew up a list of all the components that go into building a car. The engine, the wheels, the bodywork, the seats, and so on.

Then they set out on a quest … to search the world for the best components … and to bring the best one of each back.

Then they could build the World’s Best Car.

Or could they?

No.  All they built was a pile of incompatible parts. The WBC did not work. It was a futile exercise.


Then the penny dropped. The features in their wish-list were not associated with any of the separate parts. Their desired performance emerged from the way the parts worked together. The working relationships between the parts were as necessary as the parts themselves.

And a pile of average parts that work together will deliver a better performance than a pile of best parts that do not.

So the relationships were more important than the parts!


From this they learned that the quickest, easiest and cheapest way to degrade performance is to make working-well-together a bit more difficult.  Irrespective of the quality of the parts.


Q: So how do we reverse this degradation of performance?

A: Add more failure-avoidance targets of course!

But we just discovered that the performance is the effect of how the parts work well together?  Will another failure-metric-fueled performance target help? How will each part know what it needs to do differently – if anything?  How will each part know if the changes they have made are having the intended impact?

Fragmentation has a cost.  Fear, frustration, futility and ultimately financial failure.

So if performance is fading … the quality of the working relationships is a good place to look for opportunities for improvement.

System of Profound Knowledge


Don_Berwick_2016

This week I had the great pleasure of watching Dr Don Berwick sharing the story of his own ‘near religious experience‘ and his conversion to a belief that a Science of Improvement exists.  In 1986, Don attended one of W.Edwards Deming’s famous 4-day workshops.  It was an emotional roller coaster ride for Don! See here for a link to the whole video … it is worth watching all of it … the best bit is at the end.


Don outlines Deming’s System of Profound Knowledge (SoPK) and explores each part in turn. Here is a summary of SoPK from the Deming website.

Deming_SOPK

W.Edwards Deming was a physicist and statistician by training and his deep understanding of variation and appreciation for a system flows from that.  He was not trained as a biologist, psychologist or educationalist and those parts of the SoPK appear to have emerged later.

Here are the summaries of these parts – psychology first …

Deming_SOPK_Psychology

Neurobiologists and psychologists now know that we are the product of our experiences and our learning. What we think consciously is just the emergent tip of a much bigger cognitive iceberg. Most of what is happening is operating out of awareness. It is unconscious.  Our outward behaviour is just a visible manifestation of deeply ingrained values and beliefs that we have learned – and reinforced over and over again.  Our conscious thoughts are emergent effects.


So how do we learn?  How do we accumulate these values and beliefs?

This is the summary of Deming’s Theory of Knowledge …

Deming_SOPK_PDSA

But to a biologist, neuroanatomist, neurophysiologist, doctor, system designer and improvement coach … this does not feel correct.

At the most fundamental biological level we do not learn by starting with a theory; we start with a sensory.  The simplest element of the animal learning system – the nervous system – is called a reflex arc.

Sensor_Processor_EffectorFirst, we have some form of sensor to gather data from the outside world. Eyes, ears, smell, taste, touch, temperature, pain and so on.  Let us consider pain.

That signal is transmitted via a sensory nerve to the processor, the grey matter in this diagram, where it is filtered, modified, combined with other data, filtered again and a binary output generated. Act or Not.

If the decision is ‘Act’ then this signal is transmitted by a motor nerve to an effector, in this case a muscle, which results in an action.  The muscle twitches or contracts and that modifies the outside world – we pull away from the source of pain.  It is a harm avoidance design. Damage-limitation. Self-preservation.

Another example of this sensor-processor-effector design template is a knee-jerk reflex, so-named because if we tap the tendon just below the knee we can elicit a reflex contraction of the thigh muscle.  It is actually part of a very complicated, dynamic, musculoskeletal stability cybernetic control system that allows us to stand, walk and run … with almost no conscious effort … and no conscious awareness of how we are doing it.

But we are not born able to walk. As youngsters we do not start with a theory of how to walk from which we formulate a plan. We see others do it and we attempt to emulate them. And we fail repeatedly. Waaaaaaah! But we learn.


Human learning starts with study. We then process the sensory data using our internal mental model – our rhetoric; we then decide on an action based on our ‘current theory’; and then we act – on the external world; and then we observe the effect.  And if we sense a difference between our expectation and our experience then that triggers an ‘adjustment’ of our internal model – so next time we may do better because our rhetoric and the reality are more in sync.

The biological sequence is Study-Adjust-Plan-Do-Study-Adjust-Plan-Do and so on, until we have achieved our goal; or until we give up trying to learn.


So where does psychology come in?

Well, sometimes there is a bigger mismatch between our rhetoric and our reality. The world does not behave as we expect and predict. And if the mismatch is too great then we are left with feelings of confusion, disappointment, frustration and fear.  (PS. That is our unconscious mind telling us that there is a big rhetoric-reality mismatch).

We can see the projection of this inner conflict on the face of a child trying to learn to walk.  They screw up their faces in conscious effort, and they fall over, and they hurt themselves and they cry.  But they do not want us to do it for them … they want to learn to do it for themselves. Clumsily at first but better with practice. They get up and try again … and again … learning on each iteration.

Study-Adjust-Plan-Do over and over again.


There is another way to avoid the continual disappointment, frustration and anxiety of learning.  We can distort our sensation of external reality to better fit with our internal rhetoric.  When we do that the inner conflict goes away.

We learn how to tamper with our sensory filters until what we perceive is what we believe. Inner calm is restored (while outer chaos remains or increases). We learn the psychological defense tactics of denial and blame.  And we practice them until they are second-nature. Unconscious habitual reflexes. We build a reality-distortion-system (RDS) and it has a name – the Ladder of Inference.


And then one day, just by chance, somebody or something bypasses our RDS … and that is the experience that Don Berwick describes.

Don went to a 4-day workshop to hear the wisdom of W.Edwards Deming first hand … and he was forced by the reality he saw to adjust his inner model of the how the world works. His rhetoric.  It was a stormy transition!

The last part of his story is the most revealing.  It exposes that his unconscious mind got there first … and it was his conscious mind that needed to catch up.

Study-(Adjust)-Plan-Do … over-and-over again.


In Don’s presentation he suggests that Frederick W. Taylor is the architect of the failure of modern management. This is a commonly held belief, and everyone is equally entitled to an opinion, that is a definition of mutual respect.

But before forming an individual opinion on such a fundamental belief we should study the raw evidence. The words written by the person who wrote them not just the words written by those who filtered the reality through their own perceptual lenses.  Which we all do.

The 85% Optimum Occupancy Myth

egg_face_spooked_400_wht_13421There seems to be a belief among some people that the “optimum” average bed occupancy for a hospital is around 85%.

More than that risks running out of beds and admissions being blocked, 4 hour breaches appearing and patients being put at risk. Less than that is inefficient use of expensive resources. They claim there is a ‘magic sweet spot’ that we should aim for.

Unfortunately, this 85% optimum occupancy belief is a myth.

So, first we need to dispel it, then we need to understand where it came from, and then we are ready to learn how to actually prevent queues, delays, disappointment, avoidable harm and financial non-viability.


Disproving this myth is surprisingly easy.   A simple thought experiment is enough.

Suppose we have a policy where  we keep patients in hospital until someone needs their bed, then we discharge the patient with the longest length of stay and admit the new one into the still warm bed – like a baton pass.  There would be no patients turned away – 0% breaches.  And all our the beds would always be full – 100% occupancy. Perfection!

And it does not matter if the number of admissions arriving per day is varying – as it will.

And it does not matter if the length of stay is varying from patient to patient – as it will.

We have disproved the hypothesis that a maximum 85% average occupancy is required to achieve 0% breaches.


The source of this specific myth appears to be a paper published in the British Medical Journal in 1999 called “Dynamics of bed use in accommodating emergency admissions: stochastic simulation model

So it appears that this myth was cooked up by academic health economists using a computer model.

And then amateur queue theory zealots jump on the band-wagon to defend this meaningless mantra and create a smoke-screen by bamboozling the mathematical muggles with tales of Poisson processes and Erlang equations.

And they are sort-of correct … the theoretical behaviour of the “ideal” stochastic demand process was described by Poisson and the equations that describe the theoretical behaviour were described by Agner Krarup Erlang.  Over 100 years ago before we had computers.

BUT …

The academics and amateurs conveniently omit one minor, but annoying,  fact … that real world systems have people in them … and people are irrational … and people cook up policies that ride roughshod over the mathematics, the statistics and the simplistic, stochastic mathematical and computer models.

And when creative people start meddling then just about anything can happen!


So what went wrong here?

One problem is that the academic hefalumps unwittingly stumbled into a whole minefield of pragmatic process design traps.

Here are just some of them …

1. Occupancy is a ratio – it is a meaningless number without its context – the flow parameters.

2. Using linear, stochastic models is dangerous – they ignore the non-linear complex system behaviours (chaos to you and me).

3. Occupancy relates to space-capacity and says nothing about the flow-capacity or the space-capacity and flow-capacity scheduling.

4. Space-capacity utilisation (i.e. occupancy) and systemic operational efficiency are not equivalent.

5. Queue theory is a simplification of reality that is needed to make the mathematics manageable.

6. Ignoring the fact that our real systems are both complex and adaptive implies that blind application of basic queue theory rhetoric is dangerous.

And if we recognise and avoid these traps and we re-examine the problem a little more pragmatically then we discover something very  useful:

That the maximum space capacity requirement (the number of beds needed to avoid breaches) is actually easily predictable.

It does not need a black-magic-box full of scary queue theory equations or rather complicated stochastic simulation models to do this … all we need is our tried-and-trusted tool … a spreadsheet.

And we need something else … some flow science training and some simulation model design discipline.

When we do that we discover something else …. that the expected average occupancy is not 85%  … or 65%, or 99%, or 95%.

There is no one-size-fits-all optimum occupancy number.

And as we explore further we discover that:

The expected average occupancy is context dependent.

And when we remember that our real system is adaptive, and it is staffed with well-intended, well-educated, creative people (who may have become rather addicted to reactive fire-fighting),  then we begin to see why the behaviour of real systems seems to defy the predictions of the 85% optimum occupancy myth:

Our hospitals seem to work better-than-predicted at much higher occupancy rates.

And then we realise that we might actually be able to design proactive policies that are better able to manage unpredictable variation; better than the simplistic maximum 85% average occupancy mantra.

And finally another penny drops … average occupancy is an output of the system …. not an input. It is an effect.

And so is average length of stay.

Which implies that setting these output effects as causal inputs to our bed model creates a meaningless, self-fulfilling, self-justifying delusion.

Ooops!


Now our challenge is clear … we need to learn proactive and adaptive flow policy design … and using that understanding we have the potential to deliver zero delays and high productivity at the same time.

And doing that requires a bit more than a spreadsheet … but it is possible.

Unknown-Knowns

Locked_DoorIf we were exploring the corridors in an unfamiliar building and our way forward was blocked by a door that looked like this … we would suspect that something of value lay beyond.

We know there is an unknown.

The puzzle we have to solve to release the chain tells us this. This is called an “affordance” – the design of the lock tells us what we need to do.

More often what we need to know to move forward is unknown to us, and the problems we face afford us no clues as to how to solve them.  Worse than that – the clues they do offer are misleading.  Our intuition is tricked.  We do the ‘intuitively obvious’ thing and the problem gets worse.

It is easy to lose confidence, become despondent, and even to start to believe there is no solution. We begin to believe that the problem is impossible for us to solve.

Then one day someone shows us how to solve an “impossible” problem.  And with the benefit of our new perspective the solution looks simple, and how it works is now obvious. But only in retrospect.

Our unknown was known all along.  But not by us. We were ignorant.  We were agnostic.

And our intuitions are sometimes flaky, forgetful and fickle. They are not to be blindly trusted. And our egos are fragile too – we do not like to feel flaky, forgetful and fickle.  So, we lie to ourselves and we confuse obvious-in-hindsight with obvious-in-foresight.

They are not the same.

Suppose we now want to demonstrate our new understanding to someone else – to help them solve their “impossible” problem.  How do we do that?

Do we say “But it is obvious – if you cannot see it you must be blind or stupid!”

How can we say that when it was not obvious to us only a short time ago? Is our ego getting the in way again? Can our intuition or ego be trusted at all?

To help others gain insight and to help them deepen their understanding we must put ourselves back into the shoes we used to be in:  and we need to look at the problem again from their perspective.  With the benefit of the three views of the problem: our old one, their current one and our new one we may be able to then see where the Unknown-Known is for them – because it might be different.

Only then can we help them discover it for themselves; and then they can help others discover their Unknown-Knowns.  That is know knowledge and understanding spreads.

Understanding is the bridge between Knowledge and Wisdom.

And it is a wonderful thing to see someone move from conflict, through confusion to clarity by asking them just the right question, at just the right time, in just the right way.  For them.

Socrates, the Greek philosopher and teacher, knew how to do this a long time ago – which is why it is called the Socratic Method.

Software First

computer_power_display_glowing_150_wht_9646A healthcare system has two inter-dependent parts. Let us call them the ‘hardware’ and the ‘software’ – terms we are more familiar with when referring to computer systems.

In a computer the critical-to-success software is called the ‘operating system’ – and we know that by the brand labels such as Windows, Linux, MacOS, or Android. There are many.

It is the O/S that makes the hardware fit-for-purpose. Without the O/S the computer is just a box of hot chips. A rather expensive room heater.

All the programs and apps that we use to to deliver our particular information service require the O/S to manage the actual hardware. Without a coordinator there would be chaos.

In a healthcare system the ‘hardware’ is the buildings, the equipment, and the people.  They are all necessary – but they are not sufficient on their own.

The ‘operating system’ in a healthcare system are the management policies: the ‘instructions’ that guide the ‘hardware’ to do what is required, when it is required and sometimes how it is required.  These policies are created by managers – they are the healthcare operating system design engineers so-to-speak.

Change the O/S and you change the behaviour of the whole system – it may look exactly the same – but it will deliver a different performance. For better or for worse.


In 1953 the invention of the transistor led to the first commercially viable computers. They were faster, smaller, more reliable, cheaper to buy and cheaper to maintain than their predecessors. They were also programmable.  And with many separate customer programs demanding hardware resources – an effective and efficient operating system was needed. So the understanding of “good” O/S design developed quickly.

In the 1960’s the first integrated circuits appeared and the computer world became dominated by mainframe computers. They filled air-conditioned rooms with gleaming cabinets tended lovingly by white-coated technicians carrying clipboards. Mainframes were, and still are, very expensive to build and to run! The valuable resource that was purchased by the customers was ‘CPU time’.  So the operating systems of these machines were designed to squeeze every microsecond of value out of the expensive-to-maintain CPU: for very good commercial reasons. Delivering the “data processing jobs” right, on-time and every-time was paramount.

The design of the operating system software was critical to the performance and to the profit.  So a lot of brain power was invested in learning how to schedule jobs; how to orchestrate the parts of the hardware system so that they worked in harmony; how to manage data buffers to smooth out flow and priority variation; how to design efficient algorithms for number crunching, sorting and searching; and how to switch from one task to the next quickly and without wasting time or making errors.

Every modern digital computer has inherited this legacy of learning.

In the 1970’s the first commercial microprocessors appeared – which reduced the size and cost of computers by orders of magnitude again – and increased their speed and reliability even further. Silicon Valley blossomed and although the first micro-chips were rather feeble in comparison with their mainframe equivalents they ushered in the modern era of the desktop-sized personal computer.

In the 1980’s players such as Microsoft and Apple appeared to exploit this vast new market. The only difference was that Microsoft only offered just the operating system for the new IBM-PC hardware (called MS-DOS); while Apple created both the hardware and software as a tightly integrated system – the Apple I.

The ergonomic-seamless-design philosophy at Apple led to the Apple Mac which revolutionised personal computing. It made them usable by people who had no interest in the innards or in programming. The Apple Macs were the “designer”computers and were reassuringly more expensive. The innovations that Apple designed into the Mac are now expected in all personal computers as well as the latest generations of smartphones and tablets.

Today we carry more computing power in our top pocket than a mainframe of the 1970’s could deliver! The design of the operating system has hardly changed though.

It was the O/S  design that leveraged the maximum potential of the very expensive hardware.  And that is still the case – but we take it for completely for granted.


Exactly the same principle applies to our healthcare systems.

The only difference is that the flow is not 1’s and 0’s – it is patients and all the things needed to deliver patient care. The ‘hardware’ is the expensive part to assemble and run – and the largest cost is the people.  Healthcare is a service delivered by people to people. Highly-trained nurses, doctors and allied healthcare professionals are expensive.

So the key to healthcare system performance is high quality management policy design – the healthcare operating system (HOS).

And here we hit a snag.

Our healthcare management policies have not been designed using the same rigor as the operating systems for our computers. They have not been designed using the well-understood principles of flow physics. The various parts of our healthcare system do not work well together. The flows are fractured. The silos work independently. And the ubiquitous symptom of this dysfunction is confusion, chaos and conflict.  The managers and the doctors are at each others throats. And this is because the management policies have evolved through a largely ineffective and very inefficient strategy called “burn-and-scrape”. Firefighting.

The root cause of the poor design is that neither healthcare managers nor the healthcare workers are trained in operational policy design. Design for Safety. Design for Quality. Design for Delivery. Design for Productivity.

And we are all left with a lose-lose-lose legacy: a system that is no longer fit-for-purpose and a generation of managers and clinicians who have never learned how to design the operational and clinical policies that ensure the system actually delivers what the ‘hardware’ is capable of delivering.


For example:

Suppose we have a simple healthcare system with three stages called A, B and C.  All the patients flow through A, then to B and then to C.  Let us assume these three parts are managed separately as departments with separate budgets and that they are free to use whatever policies they choose so long as they achieve their performance targets -which are (a) to do all the work and (b) to stay in budget and (c) to deliver on time.  So far so good.

Now suppose that the work that arrives at Department B from Department  A is not all the same and different tasks require different pathways and different resources. A Radiology, Pathology or Pharmacy Department for example.

Sorting the work into separate streams and having expensive special-purpose resources sitting idle waiting for work to arrive is inefficient and expensive. It will push up the unit cost – the total cost divided by the total activity. This is called ‘carve-out’.

Switching resources from one pathway to another takes time and that change-over time implies some resources are not able to do the work for a while.  These inefficiencies will contribute to the total cost and therefore push up the “unit-cost”. The total cost for the department divided by the total activity for the department.

So Department B decides to improve its “unit cost” by deploying a policy called ‘batching’.  It starts to sort the incoming work into different types of task and when a big enough batch has accumulated it then initiates the change-over. The cost of the change-over is shared by the whole batch. The “unit cost” falls because Department B is now able to deliver the same activity with fewer resources because they spend less time doing the change-overs. That is good. Isn’t it?

But what is the impact on Departments A and C and what effect does it have on delivery times and work in progress and the cost of storing the queues?

Department A notices that it can no longer pass work to B when it wants because B will only start the work when it has a full batch of requests. The queue of waiting work sits inside Department A.  That queue takes up space and that space costs money but the queue cost is incurred by Department A – not Department B.

What Department C sees is the order of the work changed by Department B to create a bigger variation in lead times for consecutive tasks. So if the whole system is required to achieve a delivery time specification – then Department C has to expedite the longest waiters and delay the shortest waiters – and that takes work,  time, space and money. That cost is incurred by Department C not by Department B.

The unit costs for Department B go down – and those for A and C both go up. The system is less productive as a whole.  The queues and delays caused by the policy change means that work can not be completed reliably on time. The blame for the failure falls on Department C.  Conflict between the parts of the system is inevitable. Lose-Lose-Lose.

And conflict is always expensive – on all dimensions – emotional, temporal and financial.


The policy design flaw here looks like it is ‘batching’ – but that policy is just a reaction to a deeper design flaw. It is a symptom.  The deeper flaw is not even the use of ‘unit costing’. That is a useful enough tool. The deeper flaw is the incorrect assumption that by improving the unit costs of the stages independently will always get an improvement in whole system productivity.

This is incorrect. This error is the result of ‘linear thinking’.

The Laws of Flow Physics do not work like this. Real systems are non-linear.

To design the management policies for a non-linear system using linear-thinking is guaranteed to fail. Disappointment and conflict is inevitable. And that is what we have. As system designers we need to use ‘systems-thinking’.

This discovery comes as a bit of a shock to management accountants. They feel rather challenged by the assertion that some of their cherished “cost improvement policies” are actually making the system less productive. Precisely the opposite of what they are trying to achieve.

And it is the senior management that decide the system-wide financial policies so that is where the linear-thinking needs to be challenged and the ‘software patch’ applied first.

It is not a major management software re-write. Just a minor tweak is all that is required.

And the numbers speak for themselves. It is not a difficult experiment to do.


So that is where we need to start.

We need to learn Healthcare Operating System design and we need to learn it at all levels in healthcare organisations.

And that system-thinking skill has another name – it is called Improvement Science.

The good news is that it is a lot easier to learn than most people believe.

And that is a big shock too – because how to do this has been known for 50 years.

So if you would like to see a real and current example of how poor policy design leads to falling productivity and then how to re-design the policies to reverse this effect have a look at Journal Of Improvement Science 2013:8;1-20.

And if you would like to learn how to design healthcare operating policies that deliver higher productivity with the same resources then the first step is FISH.

Temperament Treacle

stick_figure_help_button_150_wht_9911If the headlines in the newspapers are a measure of social anxiety then healthcare in the UK is in a state of panic: “Hospitals Fear The Winter Crisis Is Here Early“.

The Panic Button is being pressed and the Patient Safety Alarms are sounding.

Closer examination of the statement suggests that the winter crisis is not unexpected – it is just here early.  So we are assuming it will be worse than last year – which was bad enough.

The evidence shows this fear is well founded.  Last year was the worst on the last 5 years and this year is shaping up to be worse still.

So if it is a predictable annual crisis and we have a lot of very intelligent, very committed, very passionate people working on the problem – then why is it getting worse rather than better?

One possible factor is Temperament Treacle.

This is the glacially slow pace of effective change in healthcare – often labelled as “resistance to change” and implying deliberate scuppering of the change boat by powerful forces within the healthcare system.

Resistance to the flow of change is probably a better term. We could call that cultural viscosity.  Treacle has a very high viscosity – it resists flow.  Wading through treacle is very hard work. So pushing change though cultural treacle is hard work. Many give up in exhaustion after a while.

So why the term “Temperament Treacle“?

Improvement Science has three parts – Processes, Politics and Systems.

Process Science is applied physics. It is an objective, logical, rational science. The Laws of Physics are not negotiable. They are absolute.

Political Science is applied psychology. It is a subjective, illogical, irrational science. The Laws of People are totally negotiable.  They are arbitrary.

Systems Science is a combination of Physics and Psychology. A synthesis. A synergy. A greater-than-the-sum-of-the-parts combination.

The Swiss physician Carl Gustav Jung studied psychology – and in 1920 published “Psychological Types“.  When this ground-breaking work was translated into English in 1923 it was picked up by Katherine Cook Briggs and made popular by her daughter Isabel.  Isabel Briggs married Clarence Myers and in 1942 Isabel Myers learned about the Humm-Wadsworth Scale,  a tool for matching people with jobs. So using her knowledge of psychological type differences she set out to develop her own “personality sorting tool”. The first prototype appeared in 1943; in the 1950’s she tested the third iteration and measured the personality types of 5,355 medical students and over 10,000 nurses.   The Myers-Briggs Type Indicator was published 1962 and since then the MBTI® has been widely tested and validated and is the most extensively used personality type instrument. In 1980 Isabel Myers finished writing Gifts Differing just before she died at the age of 82 after a twenty year long battle with cancer.

The essence of Jung’s model is that an individual’s temperament is largely innate and the result of a combination of three dimensions:

1. The input or perceiving  process (P). The poles are Intuitor (N) or Sensor (S).
2. The decision or judging process (J). The poles are Thinker (T) or Feeler (F).
3. The output or doing process. The poles are Extraversion (E) or Intraversion (I).

Each of Jung’s dimensions had two “opposite” poles so when combined they gave eight types.  Isabel Myers, as a result of her extensive empirical testing, added a fourth dimension – which gives the four we see in the modern MBTI®.  The fourth dimension linked the other three together – it describes if the J or the P process is the one shown to the outside world. So the MBTI® has sixteen broad personality types.  In 1998 a book called “Please Understand Me II” written by David Keirsey, the MBTI® is put into an historical context and Keirsey concluded that there are four broad Temperaments – and these have been described since Ancient times.

When Isabel Myers measured different populations using her new tool she discovered a consistent pattern: that the proportions of the sixteen MBTI® types were consistent across a wide range of societies. Personality type is, as Jung had suggested, an innate part of the “human condition”. She also saw that different types clustered in different occupations. Finding the “right job” appeared to be a process of natural selection: certain types fitted certain roles better than others and people self-selected at an early age.  If their choice was poor then the person would be unhappy and would not achieve their potential.

Isabel’s work also showed that each type had both strengths and weaknesses – and that people performed better and felt happier when their role played to their temperament strengths.  It also revealed that considerable conflict could be attributed to type-mismatch.  Polar opposite types have the least psychological “common ground” – so when they attempt to solve a common problem they do so by different routes and using different methods and language. This generates confusion and conflict.  This is why Isabel Myers gave her book the title of “Gifts Differing” and her message was that just having awareness of and respect for the innate type differences was a big step towards reducing the confusion and conflict.

So what relevance does this have to change and improvement?

Well it turns out that certain types are much more open to change than others and certain types are much more resistant.  If an organisation, by the very nature of its work, attracts the more change resistant types then that organisation will be culturally more viscous to the flow of change. It will exhibit the cultural characteristics of temperament treacle.

The key to understanding Temperament and the MBTI® is to ask a series of questions:

Q1. Does the person have the N or S preference on their perceiving function?

A1=N then Q2: Does the person have a T or F preference on their judging function?
A2=T gives the xNTx combination which is called the Rational or phlegmatic temperament.
A2=F gives the xNFx combination which is called the Idealist or choleric temperament.

A1=S then Q3: Does the person show a J or P preference to the outside world?
A3=J gives the xSxJ combination which is called the Guardian or melancholic temperament.
A3=P gives the xSxP combination which is called the Artisan or sanguine temperament.

So which is the most change resistant temperament?  The answer may not be a big surprise. It is the Guardians. The melancholics. The SJ’s.

Bureaucracies characteristically attract SJ types. The upside is that they ensure stability – the downside is that they prevent agility.  Bureaucracies block change.

The NF Idealists are the advocates and the mentors: they love initiating and facilitating transformations with the dream of making the world a better place for everyone. They light the emotional bonfire and upset the apple cart. The NT Rationals are the engineers and the architects. They love designing and building new concepts and things – so once the Idealists have cracked the bureaucratic carapace they can swing into action. The SP Sanguines are the improvisors and expeditors – they love getting the new “concept” designs to actually work in the messy real world.

Unfortunately the grand designs dreamed up by the ‘N’s often do not work in practice – and the scene is set for the we-told-you-so game, and the name-shame-blame game.

So if initiating and facilitating change is the Achilles Heel of the SJ’s then what is their strength?

Let us approach this from a different perspective:

Let us put ourselves in the shoes of patients and ask ourselves: “What do we want from a System of Healthcare and from those who deliver that care – the doctors?”

1. Safe?
2. Reliable?
3. Predictable?
4. Decisive?
5. Dependable?
6. All the above?

These are the strengths of the SJ temperament. So how do doctors measure up?

In a recent observational study, 168 doctors who attended a leadership training course completed their MBTI® self-assessments as part of developing insight into temperament from the perspective of a clinical leader.  From the collective data we can answer our question: “Are there more SJ types in the medical profession than we would expect from the general population?”

Doctor_Temperament The table shows the results – 60% of doctors were SJ compared with 35% expected for the general population.

Statistically this is highly significant difference (p<0.0001). Doctors are different.

It is of enormous practical importance well.

We are reassured that the majority of doctors have a preference for the very traits that patients want from them. That may explain why the Medical Profession always ranks highest in the league table of “trusted professionals”. We need to be able to trust them – it could literally be a matter of life or death.

The table also shows where the doctors were thin on the ground: in the mediating, improvising, developing, constructing temperaments. The very set of skills needed to initiate and facilitate effective and sustained change.
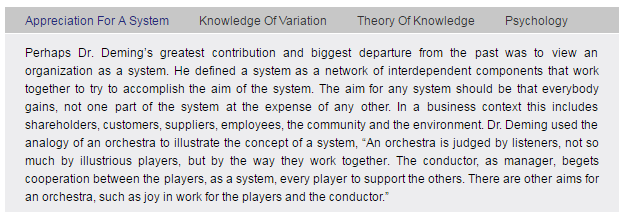
So when the healthcare system is lurching from one predictable crisis to another – the innate temperament of the very people we trust to deliver our health care are the least comfortable with changing the system of care itself.

That is a problem. A big problem.

Studies have show that when we get over-stressed, fearful and start to panic then in a desperate act of survival we tend to resort to the aspects of our temperament that are least well developed.  An SJ who is in panic-mode may resort to NP tactics: opinion-led purposeless conceptual discussion and collective decision paralysis. This is called the “headless chicken and rabbit in the headlights” mode. We have all experienced it.

A system that is no longer delivering fit-for-purpose performance because its purpose has shifted requires redesign.  The temperament treacle inhibits the flow of change so the crisis is not averted. The crisis happens, invokes panic and triggers ineffective and counter-productive behaviour. The crisis deepens and performance can drop catastrophically when the red tape is cut. It was the only thing holding the system together!

But while the bureaucracy is in disarray then innovation can start to flourish. And the next cycle starts.

It is a painful, slow, wasteful process called “reactionary evolution by natural selection“.

Improvement Science is different. It operates from a “proactive revolution through collective design” that is enjoyable, quick and efficient but it requires mastery of synergistic political science and process science. We do not have that capability – yet.

The table offers some hope.  It shows the majority of doctors are xSTJ.  They are Logical Guardians. That means that they solve problems using tried-tested-and-trustworthy logic. So they have no problem with the physics. Show them how to diagnose and design processes and they are inside their comfort zone.

Their collective weak spot is managing the politics – the critical cultural dimension of change. Often the result is manipulation rather than motivation. It does not work. The improvement stalls. Cynicism increases. The treacle gets thicker.

System-redesign requires synergistic support, development, improvisation and mediation. These strengths do exist in the medical profession – but they appear to be in short supply – so they need to be identified, and nurtured.  And change teams need to assemble and respect the different gifts.

One further point about temperament.  It is not immutable. We can all develop a broader set of MBTI® capabilities with guidance and practice – especially the ones that fill the gaps between xSTJ and xNFP.  Those whose comfort zone naturally falls nearer the middle of the four dimensions find this easier. And that is one of the goals of Improvement Science training.

Sorting_HatAnd if you are in a hurry then you might start today by identifying the xSFJ “supporters” and the xNFJ “mentors” in your organisation and linking them together to build a temporary bridge over the change culture chasm.

So to find your Temperament just click here to download the Temperament Sorter.

Creep-Crack-Crunch

The current crisis of confidence in the NHS has all the hallmarks of a classic system behaviour called creep-crack-crunch.

The first obvious crunch may feel like a sudden shock but it is usually not a complete surprise and it is actually one of a series of cracks that are leading up to a BIG CRUNCH. These cracks are an early warning sign of pressure building up in parts of the system and causing localised failures. These cracks weaken the whole system. The underlying cause is called creep.

SanFrancisco_PostEarthquake

Earthquakes are a perfect example of this phenomemon. Geological time scales are measured in thousands of years and we now know that the surface of the earth is a dynamic structure with vast contient-sized plates of solid rock floating on a liquid core of molten magma. Over millions of years the continents have moved huge distances and the world we see today on our satellite images is just a single frame in a multi-billion year geological video.  That is the geological creep bit. The cracks first appear at the edges of these tectonic plates where they smash into each other, grind past each other or are pulled apart from each other.  The geological hot-spots are marked out on our global map by lofty mountain ranges, fissured earthquake zones, and deep mid-ocean trenches. And we know that when a geological crunch arrives it happens in a blink of the geological eye.

The panorama above shows the devastation of San Francisco caused by the 1906 earthquake. San Francisco is built on the San Andreas Fault – the junction between the Pacific plate and the North American plate. The dramatic volcanic eruption in Iceland in 2010 came and went in a matter of weeks but the irreversible disruption it caused for global air traffic will be felt for years. The undersea earthquakes that caused the devastating tsunamis in 2006 and 2011 lasted only a few minutes; the deadly shock waves crossed an ocean in a matter of hours; and when they arrived the silent killer wiped out whole shoreside communities in seconds. Tens of thousands of lives were lost and the social after-shocks of that geological-crunch will be felt for decades.

These are natural disasters. We have little or no influence over them. Human-engineered disasters are a different matter – and they are just as deadly.

The NHS is an example. We are all painfully aware of the recent crisis of confidence triggered by the Francis Report. Many could see the cracks appearing and tried to blow their warning whistles but with little effect – they were silenced with legal gagging clauses and the opening cracks were papered over. It was only after the crunch that we finally acknowledged what we already knew and we started to search for the creep. Remorse and revenge does not bring back those who have been lost.  We need to focus on the future and not just point at the past.

UK_PopulationPyramid_2013Socio-economic systems evolve at a pace that is measured in years. So when a social crunch happens it is necessary to look back several decades for the tell-tale symptoms of creep and the early signs of cracks appearing.

Two objective measures of a socio-economic system are population and expenditure.

Population is people-in-progress; and national expenditure is the flow of the cash required to keep the people-in-progress watered, fed, clothed, housed, healthy and occupied.

The diagram above is called a population pyramid and it shows the distribution by gender and age of the UK population in 2013. The wobbles tell a story. It does rather look like the profile of a bushy-eyebrowed, big-nosed, pointy-chinned old couple standing back-to-back and maybe there is a hidden message for us there?

The “eyebrow” between ages 67 and 62 is the increase in births that happened 62 to 67 years ago: betwee 1946 and 1951. The post WWII baby boom.  The “nose” of 42-52 year olds are the “children of the 60’s” which was a period of rapid economic growth and new optimism. The “upper lip” at 32-42 correlates with the 1970’s that was a period of stagnant growth,  high inflation, strikes, civil unrest and the dark threat of global thermonuclear war. This “stagflation” is now believed to have been triggered by political meddling in the Middle-East that led to the 1974 OPEC oil crisis and culminated in the “winter of discontent” in 1979.  The “chin” signals there was another population expansion in the 1980s when optimism returned (SALT-II was signed in 1979) and the economy was growing again. Then the “neck” contraction in the 1990’s after the 1987 Black Monday global stock market crash.  Perhaps the new optimism of the Third Millenium led to the “chest” expansion but the financial crisis that followed the sub-prime bubble to burst in 2008 has yet to show its impact on the population chart. This static chart only tells part of the story – the animated chart reveals a significant secondary expansion of the 20-30 year old age group over the last decade. This cannot have been caused by births and is evidence of immigration of a large number of young couples – probably from the expanding Europe Union.

If this “yo-yo” population pattern is repeated then the current economic downturn will be followed by a contraction at the birth end of the spectrum and possibly also net emigration. And that is a big worry because each population wave takes a 100 years to propagate through the system. The most economically productive population – the  20-60 year olds  – are the ones who pay the care bills for the rest. So having a population curve with lots of wobbles in it causes long term socio-economic instability.

Using this big-picture long-timescale perspective; evidence of an NHS safety and quality crunch; silenced voices of cracks being papered-over; let us look for the historical evidence of the creep.

Nowadays the data we need is literally at our fingertips – and there is a vast ocean of it to swim around in – and to drown in if we are not careful.  The Office of National Statistics (ONS) is a rich mine of UK socioeconomic data – it is the source of the histogram above.  The trick is to find the nuggets of knowledge in the haystack of facts and then to convert the tables of numbers into something that is a bit more digestible and meaningful. This is what Russ Ackoff descibes as the difference between Data and Information. The data-to-information conversion needs context.

Rule #1: Data without context is meaningless – and is at best worthless and at worse is dangerous.

boxes_connected_PA_150_wht_2762With respect to the NHS there is a Minotaur’s Labyrinth of data warehouses – it is fragmented but it is out there – in cyberspace. The Department of Health publishes some on public sites but it is a bit thin on context so it can be difficult to extract the meaning.

Relying on our memories to provide the necessary context is fraught with problems. Memories are subject to a whole range of distortions, deletions, denials and delusions.  The NHS has been in existence since 1948 and there are not many people who can personally remember the whole story with objective clarity.  Fortunately cyberspace again provides some of what we need and with a few minutes of surfing we can discover something like a website that chronicles the history of the NHS in decades from its creation in 1948 – http://www.nhshistory.net/ – created and maintained by one person and a goldmine of valuable context. The decade that is of particular interest is 1998-2007 – Chapter 6

With just some data and some context it is possible to pull together the outline of the bigger picture of the decade that led up to the Mid Staffordshire healthcare quality crunch.

We will look at this as a NHS system evolving over time within its broader UK context. Here is the time-series chart of the population of England – the source of the demand on the NHS.

Population_of_England_1984-2010This shows a significant and steady increase in population – 12% overall between 1984 an 2012.

This aggregate hides a 9% increase in the under 65 population and 29% growth in the over 65 age group.

This is hard evidence of demographic creep – a ticking health and social care time bomb. And the curve is getting steeper. The pressure is building.

The next bit of the map we need is a measure of the flow through hospitals – the activity – and this data is available as the annual HES (Hospital Episodes Statistics) reports.  The full reports are hundreds of pages of fine detail but the headline summaries contain enough for our present purpose.

NHS_HES_Admissions_1997-2011

The time- series chart shows a steady increase in hospital admissions. Drilling into the summaries revealed that just over a third are emergency admissions and the rest are planned or maternity.

In the decade from 1998 to 2008 there was a 25% increase in hospital activity. This means more work for someone – but how much more and who for?

But does it imply more NHS beds?

Beds require wards, buildings and infrastructure – but it is the staff that deliver the health care. The bed is just a means of storage.  One measure of capacity and cost is the number of staffed beds available to be filled.  But this like measuring the number of spaces in a car park – it does not say much about flow – it is a just measure of maximum possible work in progress – the available space to hold the queue of patients who are somewhere between admission and discharge.

Here is the time series chart of the number of NHS beds from 1984 to 2006. The was a big fall in the number of beds in the decade after 1984 [Why was that?]

NHS_Beds_1984-2006

Between 1997 and 2007 there was about a 10% fall in the number of beds. The NHS patient warehouse was getting smaller.

But the activity – the flow – grew by 25% over the same time period: so the Laws Of Physics say that the flow must have been faster.

The average length of stay must have been falling.

This insight has another implication – fewer beds must mean smaller hospitals and lower costs – yes?  After all everyone seems to equate beds-to-cost; more-beds-cost-more less-beds-cost-less. It sounds reasonable. But higher flow means more demand and more workload so that would require more staff – and that means higher costs. So which is it? Less, the same or more cost?

NHS_Employees_1996_2007The published data says that staff headcount  went up by 25% – which correlates with the increase in activity. That makes sense.

And it looks like it “jumped” up in 2003 so something must have triggered that. More cash pumped into the system perhaps? Was that the effect of the Wanless Report?

But what type of staff? Doctors? Nurses? Admin and Clerical? Managers?  The European Working Time Directive (EWTD) forced junior doctors hours down and prompted an expansion of consultants to take on the displaced service work. There was also a gradual move towards specialisation and multi-disciplinary teams. What impact would that have on cost? Higher most likely. The system is getting more complex.

Of course not all costs have the same impact on the system. About 4% of staff are classified as “management” and it is this group that are responsible for strategic and tactical planning. Managers plan the work – workers work the plan.  The cost and efficiency of the management component of the system is not as useful a metric as the effectiveness of its collective decision making. Unfortuately there does not appear to be any published data on management decision making qualty and effectiveness. So we cannot estimate cost-effectiveness. Perhaps that is because it is not as easy to measure effectiveness as it is to count admissions, discharges, head counts, costs and deaths. Some things that count cannot easily be counted. The 4% number is also meaningless. The human head represents about 4% of the bodyweight of an adult person – and we all know that it is not the size of our heads that is important it is the effectiveness of the decisions that it makes which really counts!  Effectiveness, efficiency and costs are not the same thing.

Back to the story. The number of beds went down by 10% and number of staff went up by 25% which means that the staff-per-bed ratio went up by nearly 40%.  Does this mean that each bed has become 25% more productive or 40% more productive or less productive? [What exactly do we mean by “productivity”?]

To answer that we need to know what the beds produced – the discharges from hospital and not just the total number, we need the “last discharges” that signal the end of an episode of hospital care.

NHS_LastDischarges_1998-2011The time-series chart of last-discharges shows the same pattern as the admissions: as we would expect.

This output has two components – patients who leave alive and those who do not.

So what happened to the number of deaths per year over this period of time?

That data is also published annually in the Hospital Episode Statistics (HES) summaries.

This is what it shows ….

NHS_Absolute_Deaths_1998-2011The absolute hospital mortality is reducing over time – but not steadily. It went up and down between 2000 and 2005 – and has continued on a downward trend since then.

And to put this into context – the UK annual mortality is about 600,000 per year. That means that only about 40% of deaths happen in hospitals. UK annual mortality is falling and births are rising so the population is growing bigger and older.  [My head is now starting to ache trying to juggle all these numbers and pictures in it].

This is not the whole story though – if the absolute hospital activity is going up and the absolute hospital mortality is going down then this raw mortality number may not be telling the whole picture. To correct for those effects we need the ratio – the Hospital Mortality Ratio (HMR).

NHS_HospitalMortalityRatio_1998-2011This is the result of combining these two metrics – a 40% reduction in the hospital mortality ratio.

Does this mean that NHS hospitals are getting safer over time?

This observed behaviour can be caused by hospitals getting safer – it can also be caused by hospitals doing more low-risk work that creates a dilution effect. We would need to dig deeper to find out which. But that will distract us from telling the story.

Back to productivity.

The other part of the productivity equation is cost.

So what about NHS costs?  A bigger, older population, more activity, more staff, and better outcomes will all cost more taxpayer cash, surely! But how much more?  The activity and head count has gone up by 25% so has cost gone up by the same amount?

NHS_Annual_SpendThis is the time-series chart of the cost per year of the NHS and because buying power changes over time it has been adjusted using the Consumer Price Index using 2009 as the reference year – so the historical cost is roughly comparable with current prices.

The cost has gone up by 100% in one decade!  That is a lot more than 25%.

The published financial data for 2006-2010 shows that the proportion of NHS spending that goes to hospitals is about 50% and this has been relatively stable over that period – so it is reasonable to say that the increase in cash flowing to hospitals has been about 100% too.

So if the cost of hospitals is going up faster than the output then productivity is falling – and in this case it works out as a 37% drop in productivity (25% increase in activity for 100% increase in cost = 37% fall in productivity).

So the available data which anyone with a computer, an internet connection, and some curiosity can get; and with bit of spreadsheet noggin can turn into pictures shows that over the decade of growth that led up to the the Mid Staffs crunch we had:

1. A slightly bigger population; and a
2. significantly older population; and a
3. 25% increase in NHS hospital activity; and a
4. 10% fall in NHS beds; and a
5. 25% increase in NHS staff; which gives a
6. 40% increase in staff-per-bed ratio; an an
7. 8% reduction in absolute hospital mortality; which gives a
8. 40% reduction in relative hospital mortality; and a
9. 100% increase in NHS  hospital cost; which gives a
10. 37% fall drop in “hospital productivity”.

An experienced Improvement Scientist knows that a system that has been left to evolve by creep-crack-and-crunch can be re-designed to deliver higher quality and higher flow at lower total cost.

The safety creep at Mid-Staffs is now there for all to see. A crack has appeared in our confidence in the NHS – and raises a couple of crunch questions:

Where Has All The Extra Money Gone?

 How Will We Avoid The BIG CRUNCH?

The huge increase in NHS funding over the last decade was the recommendation of the Wanless Report but the impact of implementing the recommendations has never been fully explored. Healthcare is a service system that is designed to deliver two intangible products – health and care. So the major cost is staff-time – particularly the clinical staff.  A 25% increase in head count and a 100% increase in cost implies that the heads are getting more expensive.  Either a higher proportion of more expensive clinically trained and registered staff, or more pay for the existing staff or both.  The evidence shows that about 50% of NHS Staff are doctors and nurses and over the last decade there has been a bigger increase in the number of doctors than nurses. Added to that the Agenda for Change programme effectively increased the total wage bill and the new contracts for GPs and Consultants added more upward wage pressure.  This is cost creep and it adds up over time. The Kings Fund looked at the impact in 2006 and suggested that, in that year alone, 72% of the additional money was sucked up by bigger wage bills and other cost-pressures! The previous year they estimated 87% of the “new money” had disappeared hte same way. The extra cash is gushing though the cracks in the bottom of the fiscal bucket that had been clumsily papered-over. And these are recurring revenue costs so they add up over time into a future financial crunch.  The biggest one may be yet to come – the generous final-salary pensions that public-sector employees enjoy!

So it is even more important that the increasingly expensive clinical staff are not being forced to spend their time doing work that has no direct or indirect benefit to patients.

Trying to do a good job in a poorly designed system is both frustrating and demotivating – and the outcome can be a cynical attitude of “I only work here to pay the bills“. But as public sector wages go up and private sector pensions evaporate the cynics are stuck in a miserable job that they cannot afford to give up. And their negative behaviour poisons the whole pool. That is the long term cumulative cultural and financial cost of poor NHS process design. That is the outcome of not investing earlier in developing an Improvement Science capability.

The good news is that the time-series charts illustrate that the NHS is behaving like any other complex, adaptive, human-engineered value system. This means that the theory, techniques and tools of Improvement Science and value system design can be applied to answer these questions. It means that the root causes of the excessive costs can be diagnosed and selectively removed without compromising safety and quality. It means that the savings can be wisely re-invested to improve the resilience of some parts and to provide capacity in other parts to absorb the expected increases in demand that are coming down the population pipe.

This is Improvement Science. It is a learnable skill.

18/03/2013: Update

The question “Where Has The Money Gone?” has now been asked at the Public Accounts Committee


The Heart of Change

In 1628 a courageous and paradigm shifting act happened. A small 72-page book was published in Frankfurt that openly challenged 1500 years of medical dogma. The book challenged the authority of Galen (129-200) the most revered medical researcher of antiquity and Hippocrates (460 BC – 370 BC) the Father of Medicine.

The writer of the book was a respected and influential English doctor called William Harvey (1578-1657) who was physician to King James I and who became personal physician to King Charles I.

William_HarveyWilliam Harvey was from yeoman stock. The salt-of-the-earth. Loyal, honest and hard-working free men often owned their land – but who were way down the social pecking order. They were the servant class.

William was the eldest son of Thomas Harvey from Folkstone who had a burning ambition to raise the station of his family from yeoman to gentry. This implied that the family was allowed to have their own coat of arms. To the modern mind this is almost meaningless – in the 17th Century it was not!

And Thomas was wealthy enough to have William formally educated and the dutiful William worked hard at his studies and was rewarded by gaining a place at Caius College in Cambridge University.  John Caius (1510-1573) was a physician who had studied in Padua, Italy – the birthplace of modern medicine. William did well and after graduating from Cambridge in 1597 he too travelled through Europe to study in Padua. There he saw Galenic dogma challenged and defused using empirical evidence. This was at the same time that Galileo Galilei (1564-1642) was challenging the geocentric dogma of the Catholic Church using empirical evidence gained by simple celestial observation with his new telescope. This was the Renaissance. The Rebirth of Learning. This was the end of the Dark Ages of Dogma.

Harvey brought this “new thinking” back to Elizabethan England and decided to focus his attention on the heart. And what Harvey discovered was that the accepted truth from the ancients about how the heart worked was wrong. Galen was wrong. Hippocrates was wrong.

But this was not the most interesting part of the story.  It was the how he proved it that was radically different. He used evidence from reality to disprove the rhetoric. He used the empirical method espoused by Francis Bacon (1561-1626): what we now call the Scientific Method. In effect what Harvey said was “If you do not believe or agree with me then all you need to do is repeat the observation yourself.  Do an autopsy“.  [aut=self and opsy=see]. William Harvey saw and conducted human dissection in Padua, and practiced both it and animal vivisection back in England – and by that means he discovered how the heart actually worked.

Harvey opened a crack in the cultural ice that had frozen medical innovation for 1500 years. The crack in the paradigm was a seed of doubt planted by a combination of curiosity and empirical experimentation:

Q1: If Galen was wrong about the heart then what else was he wrong about? The Four Humours too?
Q2: If the heart is just a simple pump then where does the Spirit reside?

Looking back with our 21st century perspective these are meaningless questions.  To a person in the 17th Century these were fundamental paradigm-challenging questions.  They rocked the whole foundation of their belief system.  The believed that illness was a natural phenomenon and was not caused by magic, curses and evil spirits; but they believed that celestial objects, the stars and planets, were influential. In 1628 astronomy and astrology were the same thing.   

And Harvey was savvy. He was both religious and a devout Royalist and he knew that he would need the support of the most powerful person in England – the monarch. And he knew that he needed to be a respectable member of a powerful institution – the Royal College of Physicians (RCP) which he gained in 1604. A remarkable achievement in itself for someone of yeoman stock. With this ticket he was able to secure a position at St Bartholomew’s Hospital in Smithfield, London and in 1615 he became the RCP Lumleian Lecturer which involved lecturing on anatomy – which he did from 1616.  By virtue of his position Harvey was able to develop a lucrative private practice in London and by that route was introduced to the Court. In 1618 he was appointed as Physician Extraordinary to King James I. [The Physician Ordinary was the top job].

And even with this level of influence, credibility and royal support his paradigm-challenging message met massive cultural and political resistance because he was challenging a 1500 year old belief.

Over the 12 years between 1616 and 1628 Harvey invested a lot of time sharing his ideas and the evidence with influential friends and he used their feedback to deepen his understanding, to guide his experiments, and to sharpen his arguments. He had learned how to debate at school and had developed his skill at Cambridge so he know how to turn argments-against into arguments-for.

Harvey was intensely curious, he knew how to challenge himself, to learn, to influence others, and to change their worldview.  He knew that easily observable phenomemon could help spread the message – such as the demonstration of venous valves in the arm illustrated in his book.  

DeMotuCordisAfter the publication of De Motu Cordis in 1628 his personal credibility and private practice suffered massively because as a self-declared challenger of the current paradigm he was treated with skepticism and distrust by his peers. Gossip is effective.

And even with all his passion, education, evidence, influence and effort it still took 20 years for his message to become widely enough accepted to survive him.  And it did so because others resonated with the message; others like a Rene Descartes (1596-1650). 

William Harvey is now remembered as one of the founders of modern medical science.  When he published De Motu Cordis he triggered a paradim shift – one that we take for granted today.  Harvey showed that the path to improvement is through respectfully challenging accepted dogma with a combination of curiosity, humility, hard-work, and empirical evidence. Reality reinforced rhetoric.

Today we are used to having the freedom of speech and we are familiar with using experimental data to test our hypotheses.  In 1628 this was new thinking and was very risky. People were burned at the stake for challenging the authority of the Catholic Church and the Holy Roman Inquisition was still active well into the 18th Century!

Harvey was also innovative in the use of arithmetic. He showed that the volume of blood pumped by the heart in a day was far more than the liver could reasonably generate.  But at that time arithmetic was the domain of merchants, accountants and money-lenders and was not seen as a tool that a self-respecting natural philosopher would use!  The use of mathematics as a scientific tool did not really take off until after Sir Isaac Newton (1642-1727) published the Principia in 1687 – 30 years after Harvey’s death. [To read more about William Harvey click here].

William Harvey was an Improvementologist.

 So what lessons can modern Improvement Scientists draw from his story?

  • The first is that all significant challanges to current thinking will meet emotional and political resistance. They will be discounted and ridiculed because they challenge the authority of experts.
  • The second is that challenges must be made respectfully. The current thinking has both purpose and value. Improvements build on the foundation of knowledge and only challenge what is not fit for purpose.
  • The third is that the challenge must be more than rhetorical – it must be backed with replicatable evidence. A difference of opinion is just that. Reality is the ultimate arbiter.
  • The fourth is that having an idea is not enough – testig, proving, explaining and demonstrating are needed too. It is hard work to change a mental paradigm and it requires an emotionally secure context to do it. People who are under pressure will find it more difficult and more traumatic. 
  • The fifth is that patience and persistence are needed. Worldview change takes time and happen in small steps. The new paradigm needs to find its place.

And Harvey did not say that Galen and Hippocrates were completely wrong – just partly wrong. And he explained that the reason that Hippocrates and Galen could not test their ideas about human anatomy was because dissection of human bodies was illegal in Greek and Roman societies. Padua in Renaissance Italy was one of the first places where dissection was permitted by Law.   

So which part of the Galenic dogma did Harvey challenge?

He challenged the dogma that blood was created continuously by the liver. He challenged the dogma that there were invisible pores between the right and left sides of the heart. He challenged the dogma that the arteries ‘sucked’ the blood from the heart. He challenged the dogma that the ‘vitalised’ arterial blood was absorbed by the tissues. And he challenged these beliefs with empirical evidence. He showed evidence that the blood circulated fom the right heart to the lungs to the left heart to the body and back to the right heart. He showed evidence that the heart was a muscular pump. And he showed evidence that it worked the same way in man and in animals.  

FourHumoursIn so doing he undermined the foundation of the whole paradigm of ancient belief that illness was the result of an imbalance between the Four Humours. Yellow Bile (associated with the liver), Black Bile (associated with the Spleen), Blood (as ociated with the heart) and Phlegm (associated with the lungs).   

We still have the remnants of this ancient belief in our language.  The Four Humours were also associated with Four Temperaments – four observable personality types. The phlegmatic type (excess phlegm), the sanguine type (excess blood), the choleric type (excess yellow bile), and the melancholic type (excess black bile).

We still talk about “the heart of the matter” and being “heartless”, “heartfelt”  and “change of heart” because the heart was believed to be where emotion and passion resided. Sanguine is the term given to people who show warmth, passion, a live-now-pay-later, optimistic and energetic disposition. And this is not an unreasonable hypothesis given that we are all very aware of changes in how our heart beats when we are emotionally aroused; and how the color of our skin changes.

So when Harvey suggested that blood flowed in a circle from the heart to the arteries and back to the heart via the veins; and that the heart was just a pump then this idea shook the current paradigm on many levels – right down to its roots.

And the ancient justification for a whole raft of medical diagnoses, prognoses and treatments was challenged. The House of Cards was challenged. And many people owed their livelihoods to these ancient beliefs – so it is no surprise that his peers were not jumping  for joy to hear what Harvey said.

But Harvey had reality on his side – and reality trumps rhetoric.

And the same is true today, 500 years later.

The current paradigm is being shaken. The belief that we can all live today and pay tomorrow. The belief that our individual actions have no global impact and no long lasting consequences. The belief that competition is the best route to contentment.

The evidence is accumulating that these beliefs are wrong.

The difference is that today the paradigm is being challenged by a collective voice – not by a lone voice.

Subscribe: [smlsubform]

The Pragmatist and the Three Fears

The term Pragmatist is a modern one – it was coined by Charles Sanders Pierce (1839-1914) – a 19th century American polymath and iconoclast. In plain speak he was a tree-shaker and a dogma-breaker; someone who regarded rules created by people as an opportunity for innovation rather than a source of frustration.

A tree-shaker reframes the Three Fears that block change and improvement; the Fear of Ambiguity; the Fear of Ridicule and the Fear of Failure. A tree-shaker re-channels their emotional energy from fear into innovation and exploration. They feel the fear but they do it anyway. But how do they do it?

To understand this we first need to explore how we learn to collectively suppress change by submitting to peer-fear.

In the 1960’s there was an experiment done with Rhesus monkeys that sheds light on a possible mechanism: the monkeys appeared to learn from each other by observing the emotional responses of other monkeys to threats. The story of the Five Monkeys and the Banana Experiment first appeared in a management textbook in 1996  but there is no evidence that this particular experiment was ever performed. With this in mind here is a version of the story:

Five naive monkeys were offered a banana but it required climbing a ladder to get it.  Monkeys like bananas and are good at climbing. The ladder was novel. And every time any of the monkeys started to climb the ladder all the monkeys were sprayed with cold water. Monkeys do not like cold water. It was a classic conditioning experiment and after just a few iterations the monkeys stopped trying to climb the ladder to get the banana. They had learned to fear the ladder and their natural desire for the banana was suppressed by their new fear: a learned association between climbing the ladder and the unpleasant icy shower. Next the psychologists replaced one of the monkeys with a new naive monkey – who immediately started to climb the ladder to get the banana. What happened next is interesting. The other four monkeys pulled the new monkey back. They did not want to get another cold shower. After a while the new monkey learned because his fear of social rejection was greater than his desire for the banana. He stopped trying to get the banana. This cycle was repeated four more times until all the original monkeys had been replaced. None of the five remaining monkeys had any personal experience of the cold shower – but the ladder-avoiding behaviour remained and was enforced by the group, even though the original reason for shunning the ladder was unknown.

Here is the quoted reference to the experiment on which the story is based.

Stephenson, G. R. (1967). Cultural acquisition of a specific learned response among rhesus monkeys. In: Starek, D., Schneider, R., and Kuhn, H. J. (eds.), Progress in Primatology, Stuttgart: Fischer, pp. 279-288.

So it would appear that a very special type of monkey would be needed to break a culturally enforced behavioural norm. One that is curious, creative and courageous, and one that does not fear ridicule or failure. One that is immune to peer-fear.

We could extrapolate from this story and reflect on how peer pressure might impede change and improvement in the workplace.  When well-intended, innocent, creativity and innovation are met with the emotional ice-bath of dire warnings, criticism, ridicule and cynicism then the unconfident innovator may eventually give up trying and start to believe that improvement is impossible.  The Hans Christian Anderson’s short tale of the Emporer’s New Clothes is a well known example – the one innocent child says what all the experienced adults have learned to deny. A culture of peer-fear can become self-sustaining and this change-avoiding-culture appears to be a common state of affairs in many organisations; in particular ones of an academic and bureaucratic leaning.

At the other end of the change spectrum from Bureaucracy sits Chaos. It is also resisted but the behaviour is fuelled by a different fear – the Fear of Ambiguity. We prefer the known and the predictable. We follow ingrained habits. We prevaricate even when our rationality says we should change.  We dislike the feeling of ambiguity and uncertainty because it leaves us with a sense of foreboding and dread. Change is strongly associated with confusion and we appear hard-wired to avoid it. Except that we are not. This is learned behaviour and we learned it when we were very young. As adults we reinforce it; as adults we replicate it; and as adults impose it on others – including our next generation. The generation that will inherit our world and who will look after us when we are old and frail. We will reap what we sow. But if we learned it and teach it then are we able to unlearn it and unteach it?

Enter the Pragmatists. They have learned to harness the Three Fears. Or rather they have unlearned their association of Fear with Change. Sometimes this unlearning came from a crisis – they were forced to change by external factors. Doing nothing was not an option. Sometimes their unlearning came from inspiration – they saw someone else demonstrate that other options were possible and beneficial. Sometimes their insight came by surprise – an unexpected change of perspective exposed the hidden opportunity. An eureka moment.
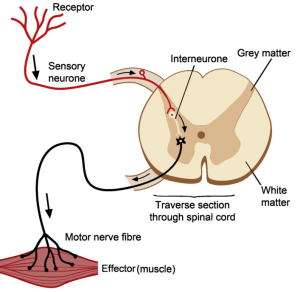
Whatever the route the Pragmatist discovers a new tool: a tool labelled “Heuristics”.  A heuristic is a “rule of thumb” – an empirically derived good-enough-for-now guideline. Heuristics include some uncertainty, some ambiguity and some risk. Just enough uncertainty and ambiguity to build a flexible conceptual framework that is strong enough, resilient enough and modifiable enough to facilitate learning and improvement. And with it a pinch of risk to spice the sauce – because we all like a bit of risk.

The Improvement Scientist is a Pragmatist and a Practitioner of Heuristics – both of which can be learned.

All Aboard for the Ride of Our Lives!

In 1825 the world changed when the Age of Rail was born with the opening of the Darlington-to-Stockton line and the demonstration that a self-powered mobile steam engine could pull more trucks of coal than a team of horses.

This launched the industrial revolution into a new phase by improving the capability to transport heavy loads over long distances more conveniently, reliably, quickly, and cheaply than could canals or roads.

Within 25 years the country was criss-crossed by thousands of miles of railway track and thousands more miles were rapidly spreading across the world. We take it for granted now but this almost overnight success was the result of over 100 years of painful innovation and improvement. Iron rail tracks had been in use for a long time – particularly in quarries and ports. Newcomen’s atmospheric steam engine had been pumping water out of mines since 1712; James Watt and Matthew Boulton had patented their improved separate condenser static steam engine in 1775; and Richard Trevethick had built a self-propelled high pressure steam engine called “Puffing Devil” in 1801. So why did it take so long for the idea to take off? The answer was quite simple – it needed the lure of big profits to attract the entrepreneurs who had the necessary influence and cash to make it happen at scale and pace.  The replacement of windmills and watermills by static steam engines had already allowed factories to be built anywhere – rather than limiting them to the tops of windy hills and the sides of fast flowing rivers. But it was not until the industrial revolution had achieved sufficient momentum that road and canal transport became a serious constraint to further growth of industry, wealth and the British Empire.

But not everyone was happy with the impact that mechanisation brought – the Luddites were the skilled craftsmen who opposed the use of mechanised looms that could be operated by lower-skilled and therefore cheaper labour.  They were crushed in 1812 by political forces more powerful than they were – and the term “luddite” is now used for anyone who blindly opposes change from a position self-protection.

Only 140 years later it was all over for the birthplace of the Rail Age – the steam locomotive was relegated to the museums when Dr Richard Beeching , the efficiency-focussed Technical Director of ICI, published his reports that led to the cost-improvement-programme (CIP) that reorganised the railways and led to the loss of 70,000 jobs, hundreds of small “unprofitable” stations and 1000’s of miles of track.  And the reason for the collapse of the railways was that roads had leap-frogged both canals and railways because the “internal combustion engine” proved a smaller, lighter, more powerful, cheaper and more flexible alternative to steam or horses.

It is of historical interest that Henry Ford developed the production line to mass produce automobiles at a price that a factory worker could afford – and Toyoda invented a self-stopping mechanised loom that improved productivity dramatically by preventing damaged cloth being produced if a thread broke by accident. The historical links come together because Toyoda sold the patents to his self-stopping loom to fund the creation of the Toyota Motor Company which used Henry Ford’s production-line design and integrated the Toyoda self-monitoring, stopping and continuous improvement philosophy.

It was not until twenty years after British Rail was created that Japan emerged as an industrial superpower by demonstrating that it had learned how to improve both quality and reduce cost much more effectively than the “complacent” Europe and America. The tables were turned and this time it was the West that had to learn – and quickly.  Unfortunately not quickly enough. Other developing countries seized the opportunity that mass mechanisation, customisation and a large, low-expectation, low-cost workforce offered. They now produce manufactured goods at prices that European and American companies cannot compete with. Made in Britain has become Made in China.

The lesson of history has been repeated many times – innovations are like seeds that germinate but do not disseminate until the context is just right – then they grow, flower, seed and spread – and are themselves eventually relegated to museums by the innovations that they spawned.

Improvement Science has been in existence for a long time in various forms, and it is now finding more favourable soil to grow as traditional reactive and incremental improvement methods run out of steam when confronted with complex system problems. Wicked problems such as a world population that is growing larger and older at the same time as our reserves of non-renewable natural resources are dwindling.

The promise that Improvement Science offers is the ability to avoid the boom-to-bust economic roller-coaster that devastates communities twice – on the rise and again on the fall. Improvement Science offers an approach that allows sensible and sustainable changes to be planned, implemented and then progressively improved.

So what do we want to do? Watch from the sidelines and hope, or leap aboard and help?

And remember what happened to the Luddites!

Steps, Streams, Silos and Swamps.

The late Steve Jobs created a world class company called Apple – which is now the largest and most successful technology company – eclipsing Microsoft.  The secret of the success of Apple is laid out in Steve Jobs biography – and can be stated in one word. Design.

Apple designs, develops and delivers great products and services  – ones that people want to own and to use.  That makes them cool. What is even more impressive is that Steve Jobs has done this in more than once and has reinvented more than one market: Apple Computers and the graphical personal computer;  Pixar and animated films; and Apple again with digital music, electronic publishing; and mobile phones.

The common themes are digital technology and end-to-end seamless integrated design of chips, devices, software, services and shops. Full vertical integration rather like Henry Ford’s verically integrated iron-ore to finished cars production line.  The Steve Jobs design paradigm is simplicity. It is much more difficult to design simplicity than to evolve complexity and his reputation was formidable. He was a uncompromising perfectionist who sacrificed feelings on the alter of design perfection. His view of the world was binary – it was either great or crap – meaning it was either moving towards perfection or away from it.

What Steve Jobs created was a design stream out of which must-have products and services flowed – and he did it by seeing all the steps as part of one system and aligned with one purpose.  He did not allow physical or psychological silos to form and he did this by challenging anything and everything.  Many could not work in this environment and left, many others thrived and delivered far beyond what they believed they could do.

Other companies were swamps. Toxic emotional waste swamps of silos, politics and turf wars.  Apple computers itself when through a phase when Steve Jobs was “ejected” and without its spiritual leader the company slipped downhill. He was enticed back and Apple was reborn and went on to create the iMac, iPod, iTunes, iPhone, iPad and now iCloud. Revolutioning the world of digital commnication.

The image above is a satellite view of a delta – a complex network of interconnected streams created by a river making its way to the sea through a swamp.  The structure of the delta is constantly changing and evolving so it is easy to get lost it in, to get caught in a dead-end, or stuck in the mud. Only travel by small boat is possible and that is often both ineffective and inefficient.

Many organistions are improvement science swamps. The stream of innovative ideas gets fragmented by the myriad of everchanging channels; caught in political dead-ends; and stuck in the mud of bureaucracy.  Only small, skillfully steered ideas will trickle  through – but this trickle is not enough to keep the swamp from silting up. Eventually the resistance to change reaches a critical level and the improvement stream is forced to change course – diverting the flow of change away from the swamp – and marooning the stick-in-the-muds to slowly sink and expire in the bureaucratic gloop that they spawned.

Steve Jobs’ legacy to us is a lesson. To create a system that continues to deliver and delight we need to start by learning how to design the steps, then to design the streams of steps to link seamlessly, and finally to design the system of streams to synergise as sophisticated simplicity.

Improvement cannot be left to chance in the blind hope that excellence will evolve spontaneously. Evolution is both ineffective and inefficient and is more likely to lead to dissipated and extravagant complexity than aligned and elegant simplicity.

Improvement is a science that sits at the cross-roads of humanity and technology.

NIGYYSOB

This is the image of an infamous headline printed on May 4th 1982 in a well known UK newspaper.  It refers to the sinking of the General Belgrano in the Falklands war.

It is the clarion call of revenge – the payback for past grievances.

The full title is NIGYYSOB which stands for Now I Gotcha You Son Ofa B**** and is the name of one of Eric Berne’s Games that People Play.  In this case it is a Level 4 Game – played out on the global stage by the armed forces of the protagonists and resulting in both destruction and death.


The NIGYYSOB game is played out much more frequently at Level 1 – in the everyday interactions between people – people who believe that revenge has a sweet taste.

The reason this is important to the world of Improvement Science is because sometimes a well-intentioned improvement can get unintentionally entangled in a game of NIGYYSOB.

Here is how the drama unfolds.

Someone complains frequently about something that is not working, a Niggle, that they believe that they are powerless to solve. Their complaints are either ignored, discounted or not acted upon because the person with the assumed authority to resolve it cannot do so because they do not know how and will not admit that.  This stalemate can fester for a long time and can build up a Reservoir of Resentment. The Niggle persists and keeps irritating the emotional wound which remains an open cultural sore.  It is not unusual for a well-intentioned third party to intervene to resolve the standoff but as they too are unable to resolve the underlying problem – and all that results is either meddling or diktat which can actually make the problem worse.

The outcome is a festering three-way stalemate with a history of failed expectations and a deepening Well of Cynicism.

Then someone with an understanding of Improvement Science appears on the scene – and the stage is set for a new chapter of the drama because they risk of being “hooked” into The Game.  The newcomer knows how to resolve the problem and, with the grudging consent of the three protagonists, as if by magic, the Niggle is dissolved.  Wow!   The walls of the Well of Cynicism are breached by the new reality and the three protagonists suddenly realise that they may need to radically re-evaluate their worldviews.  That was not expected!

What can happen next is an emotional backlash – rather like a tight elastic band being released at one end. Twang! Snap! Ouch!


We all have a the same psychological reaction to a sudden and surprising change in our reality – be it for the better or for the worse. It takes time to adjust to a new worldview and that transition phase is both fragile and unstable; so there is a risk of going off course.

Experience teaches us that it does not take much to knock the tentative improvement over.


The application of Improvement Science will generate transitions that need to be anticipated and proactively managed because if this is not done then there is a risk that the emotional backlash will upset the whole improvement apple-cart.

What appears to occur is: after reality shows that the improvement has worked then the realisation dawns that the festering problem was always solvable, and the chronic emotional pain was avoidable. This comes as a psychological shock that can trigger a reflex emotional response called anger: the emotion that signals the unconscious perception of sudden loss of the old, familiar, worldview. The anger is often directed externally and at the perceived obstruction that blocked the improvement; the person who “should” have known what to do; often the “boss”.  This backlash, the emotional payoff, carries the implied message of “You are not OK because you hold the power, and you could not solve this, and you were too arrogant to ask for help and now I have proved you wrong and that I was right all the time!”  Sweet-tasting revenge?

Unfortunately not. The problem is that this emotional backlash damages the fragile, emerging, respectful relationship and can effectively scupper any future tentative inclinations to improve. The chronic emotional pain returns even worse than before; the Well of Cynicism deepens; and the walls are strengthened and become less porous.

The improvement is not maintained and it dies of neglect.


The reality of the situation was that none of the three protagonists actually knew what to do – hence the stalemate – and the only way out of that situation is for them all to recognise and accept the reality of their collective ignorance – and then to learn together.

Managing the improvement transition is something that an experienced facilitator needs to understand. If there is a them-and-us cultural context; a frustrated standoff; a high pressure store of accumulated bad feeling; and a deep well of cynicism then that emotional abscess needs to diagnosed, incised and drained before any attempt at sustained improvement can be made.

If we apply direct pressure on an emotional abscess then it is likely to rupture and squirt you with cynicide; or worse still force the emotional toxin back into the organisation and poison the whole system. (Email is a common path-of-low-resistance for emotional toxic waste!).

One solution is to appreciate that the toxic emotional pressure needs to be released in a safe and controlled way before the healing process can start.  Most of the pain goes away as soon as the abscess is lanced – the rest dissipates as the healing process engages.

One model that is helpful in proactively managing this dynamic is the Elizabeth Kubler-Ross model of grief which describes the five stages: denial, anger, bargaining, depression, and acceptance.  Grief is the normal emotional reaction to a sudden change in reality – such as the loss of a loved one – and the same psychological process operates for all emotionally significant changes.  The facilitator just needs to provide a game-free and constructive way to manage the anger by reinvesting the passion into the next cycle of improvement.  A more recent framework for this is the Lewis-Parker model which has seven stages:

  1. Immobilisation – Shock. Overwhelmed mismatch: expectations vs reality.
  2. Denial of Change – Temporary retreat. False competence.
  3. Incompetence – Awareness and frustration.
  4. Acceptance of Reality – ‘Letting go’.
  5. Testing – New ways to deal with new reality.
  6. Search for Meaning – Internalisation and seeking to understand.
  7. Integration – Incorporation of meanings within behaviours.

An effective tool for getting the emotional rollercoaster moving is The 4N Chart® – it allows the emotional pressure and pain to be released in a safe way. The complementary tool for diagnosing and treating the cultural abscess is called AFPS (Argument Free Problem Solving) which is a version of Edward De Bono’s Six Thinking Hats®.

The two are part of the improvement-by-design framework called 6M Design® which in turn is a rational, learnable, applicable and teachable manifestation of Improvement Science.


Safety-By-Design

The picture is of Elisha Graves Otis demonstrating, in the mid 19th century, his safe elevator that automatically applies a brake if the lift cable breaks. It is a “simple” fail-safe mechanical design that effectively created the elevator industry and the opportunity of high-rise buildings.

“To err is human” and human factors research into how we err has revealed two parts – the Error of Intention (poor decision) and the Error of Execution (poor delivery) – often referred to as “mistakes” and “slips”.

Most of the time we act unconsciously using well practiced skills that work because most of our tasks are predictable; walking, driving a car etc.

The caveman wetware between our ears has evolved to delegate this uninteresting and predictable work to different parts of the sub-conscious brain and this design frees us to concentrate our conscious attention on other things.

So, if something happens that is unexpected we may not be aware of it and we may make a slip without noticing. This is one way that process variation can lead to low quality – and these are the often the most insidious slips because they go unnoticed.

It is these unintended errors that we need to eliminate using safe process design.

There are two ways – by designing processes to reduce the opportunity for mistakes (i.e. improve our decision making); and then to avoid slips by designing the subsequent process to be predictable and therefore suitable for delegation.

Finally, we need to add a mechanism to automatically alert us of any slips and to protect us from their consequences by failing-safe.  The sign of good process design is that it becomes invisible – we are not aware of it because it works at the sub-conscious level.

As soon as we become aware of the design we have either made a slip – or the design is poor.


Suppose we walk up to a door and we are faced with a flat metal plate – this “says” to us that we need to “push” the door to open it – it is unambiguous design and we do not need to invoke consciousness to make a push-or-pull decision.  The technical term for this is an “affordance”.

In contrast a door handle is an ambiguous design – it may require a push or a pull – and we either need to look for other clues or conduct a suck-it-and-see experiment. Either way we need to switch our conscious attention to the task – which means we have to switch it away from something else. It is those conscious interruptions that cause us irritation and can spawn other, possibly much bigger, slips and mistakes.

Safe systems require safe processes – and safe processes mean fewer mistakes and fewer slips. We can reduce slips through good design and relentless improvement.

A simple and effective tool for this is The 4N Chart® – specifically the “niggle” quadrant.

Whenever we are interrupted by a poorly designed process we experience a niggle – and by recording what, where and when those niggles occur we can quickly focus our consciousness on the opportunity for improvement. One requirement to do this is the expectation and the discipline to record niggles – not necessarily to fix them immediately – but just to record them and to review them later.

In his book “Chasing the Rabbit” Steven Spear describes two examples of world class safety: the US Nuclear Submarine Programme and Alcoa, an aluminium producer.  Both are potentially dangerous activities and, in both examples, their world class safety record came from setting the expectation that all niggles are recorded and acted upon – using a simple, effective and efficient niggle-busting process.

In stark and worrying contrast, high-volume high-risk activities such as health care remain unsafe not because there is no incident reporting process – but because the design of the report-and-review process is both ineffective and inefficient and so is not used.

The risk of avoidable death in a modern hospital is quoted at around 1:300 – if our risk of dying in an elevator were that high we would take the stairs!  This worrying statistic is to be expected though – because if we lack the organisational capability to design a safe health care delivery process then we will lack the organisational capability to design a safe improvement process too.

Our skill gap is clear – we need to learn how to improve process safety-by-design.


Download Design for Patient Safety report written by the Design Council.

Other good examples are the WHO Safer Surgery Checklist, and the story behind this is told in Dr Atul Gawande’s Checklist Manifesto.

Low-Tech-Toc

Beware the Magicians who wave High Technology Wands and promise Miraculous Improvements if you buy their Black Magic Boxes!

If a Magician is not willing to open the box and show you the inner workings then run away – quickly.  Their story may be true, the Miracle may indeed be possible, but if they cannot or will not explain HOW the magic trick is done then you will be caught in their spell and will become their slave forever.

Not all Magicians have honourable intentions – those who have been seduced by the Dark Side will ensnare you and will bleed you dry like greedy leeches!

In the early 1980’s a brilliant innovator called Eli Goldratt created a Black Box called OPT that was the tangible manifestation of his intellectual brainchild called ToC – Theory of Constraints. OPT was a piece of complex computer software that was intended to rescue manufacturing from their ignorance and to miraculously deliver dramatic increases in profit. It didn’t.

Eli Goldratt was a physicist and his Black Box was built on strong foundations of Process Physics – it was not Snake Oil – it did work.  The problem was that it did not sell: Not enough people believed his claims and those who did discovered that the Black Box was not as easy to use as the Magician suggested.  So Eli Goldratt wrote a book called The Goal in which he explained, in parable form, the Principles of ToC and the theoretical foundations on which his Black Box was built.  The book was a big success but his Black Box still did not sell; just an explanation of how his Black Box worked was enough for people to apply the Principles of ToC and to get dramatic results. So, Eli abandoned his plan of making a fortune selling Black Boxes and set up the Goldratt Institute to disseminate the Principles of ToC – which he did with considerably more success. Eli Goldratt died in June 2011 after a short battle with cancer and the World has lost a great innovator and a founding father of Improvement Science. His legacy lives on in the books he wrote that chart his personal journey of discovery.

The Principles of ToC are central both to process improvement and to process design.  As Eli unintentionally demonstrated, it is more effective and much quicker to learn the Principles of ToC pragmatically and with low technology – such as a book – than with a complex, expensive, high technology Black Box.  As many people have discovered – adding complex technology to a complex problem does not create a simple solution! Many processes are relatively uncomplicated and do not require high technology solutions. An example is the challenge of designing a high productivity schedule when there is variation in both the content and the volume of the work.

If our required goal is to improve productivity (or profit) then we want to improve the throughput and/or to reduce the resources required. That is relatively easy when there is no variation in content and no variation in volume – such as when we are making just one product at a constant rate – like a Model-T Ford in Black! Add some content and volume variation and the challenge becomes a lot trickier! From the 1950’s the move from mass production to mass customisation in the automobile industry created this new challenge and spawned a series of  innovative approaches such as the Toyota Production System (Lean), Six Sigma and Theory of Constraints.  TPS focussed on small batches, fast changeovers and low technology (kanbans or cards) to keep inventory low and flow high; Six Sigma focussed on scientifically identifying and eliminating all sources of variation so that work flows smoothly and in “statistical control”; ToC focussed on identifying the “constraint steps” in the system and then on scheduling tasks so that the constraints never run out of work.

When applied to a complex system of interlinked and interdependent processes the ToC method requires a complicated Black Box to do the scheduling because we cannot do it in our heads. However, when applied to a simpler system or to a part of a complex system it can be done using a low technology method called “paper and pen”. The technique is called Template Scheduling and there is a real example in the “Three Wins” book where the template schedule design was tested using a computer simulation to measure the resilience of the design to natural variation – and the computer was not used to do the actual scheduling. There was no Black Box doiung the scheduling. The outcome of the design was a piece of paper that defined the designed-and-tested template schedule: and the design testing predicted a 40% increase in throughput using the same resources. This dramatic jump in productivity might be regarded as  “miraculous” or even “impossible” but only to someone who was not aware of the template scheduling method. The reality is that that the designed schedule worked just as predicted – there was no miracle, no magic, no Magician and no Black Box.

The One-Eyed Man in the Land of the Blind.

“There are known knowns; there are things we know we know.
We also know there are known unknowns; that is to say we know there are some things we do not know.
But there are also unknown unknowns – the ones we don’t know we don’t know.” Donald Rumsfeld 2002

This infamous quotation is a humorously clumsy way of expressing a profound concept. This statement is about our collective ignorance – and it hides a beguiling assumption which is that we are all so similar that we just have to accept the things that we all do not know. It is OK to be collectively and blissfully ignorant. But is this OK? Is this not the self-justifying mantra of those who live in the Land of the Blind?

Our collective blissful ignorance holds the promise of great unknown gains; and harbours the potential of great untold pain.

Our collective knowledge is vast and is growing because we have dissolved many Unknowns.  For each there must have been a point in time when the first person become painfully aware of their ignorance and, by some means, discovered some new knowledge. When that happened they had a number of options – to keep it to themselves, to share it with those they knew, or to share it with strangers. The innovators dilemma is that when they share new knowledge they know they will cause emotional pain; because to share knowledge with the blissfully ignorant implies pushing them to the state of painful awareness.

We are social animals and we demonstrate empathy and respect for others, so we do not want to deliberately cause them emotional pain – even the short term pain of awareness that must preceed the long term gain of knowledge, understanding and wisdom. It is the constant challenge that every parent, every teacher, every coach, every mentor, every leader and every healer has to learn to master.

So, how do we deal with the situation when we are painfully aware that others are in the state of blissful ignorance – of not knowing what they do not know – and we know that making them aware will be emotionally painful for them – just as it was for us? We know from experience that that an insensitive, clumsy, blunt, brutal, just-tell-it-as-it is approach can cause pain-but-no-gain; we have all had experience of others who seem to gain a perverse pleasure from the emotional impact they generate by triggering painful awareness. The disrespectful “means-justifies-the-ends” and “cruel-to-be-kind” mindset is the mantra of those who do not walk their own talk – those who do not challenge their own blissful ignorance – those who do not seek to gain an understanding of how to foster effective learning without inflicting emotional pain.

The no-pain-no-gain life limiting belief is an excuse – not a barrier. It is possible to learn without pain – we have all been doing it for our whole lives; each of us can think of people who inspired us to learn and to have fun doing so – rare and memorable role models, bright stars in the darkness of disappointment. Our challenge is to learn how to inspire ourselves.

The first step is to create an emotionally Safe Environment for Learning and Fun (SELF). For the leader/teacher/healer this requires developing an ability to build a culture of trust by actively unlearning their own trust-corroding-behaviours.  

The second step is to know what we know – to be sure of our facts and confident that we can explain and support what we know with evidence and insight. To deliberately push someone into painful awareness with no means to guide them out of that dark place is disrespectful and untrustworthy behaviour. Learning how to teach what we know is the most effective means to discover our own depth of understanding and it is an energising exercise in humility development! 

The third step is for us to have the courage to raise awareness in a sensitive and respectful way – sometimes this is done by demonstrating the knowledge; sometimes this is done by asking carefully framed questions; and sometimes it is done as a respectful challenge.  The three approaches are not mutually exclusive: leading-by-example is effective but leaders need to be teachers and healers too.  

At all stages the challenge for the leader/teacher/healer is to to ensure they maintain an OK-OK mental model of those they influence. This is the most difficult skill to attain and is the most important. The “Leadership and Self-Deception” book that is in the Library of Improvement Science is a parable that decribes this challenge.

So, how do we dissolve the One-Eyed Man in the Land of the Blind problem? How do we raise awareness of a collective blissful ignorance? How do we share something that is going to cause untold pain and misery in the future – a storm that is building over the horizon of awareness.

Ignaz Semmelweis (1818-1865) was the young Hungarian doctor who in 1847 discovered the dramatic live-saving benefit of the doctors cleaning their hands before entering the obstetric ward of the Vienna Hospital. This was before “germs” had been discovered and Semmelweis could not explain how his discovery worked – all he could do was to exhort others to do as he did. He did not learn how the method worked, he did not publish his data, and he demonstrated trust-eroding behaviour when he accused others of “murder” when they did not do as he told them.  The fact the he was correct did not justify the means by which he challenged their collective blissful ignorance (see http://www.valuesystemdesign.com for a fuller account).  The book that he eventually published in 1861 includes the data that supports our modern understanding of the importance of hand hygiene – but it also includes a passionate diatribe of how he had been wronged by others – a dramatic example of the “I’m OK and The Rest of the World is Not OK” worldview. Semmelweis was committed to a lunatic asylum and died there in 1865.   

W Edwards Deming (1900-1993) was the American engineer, mathematician, mathematical physicist, statistician and student of Walter A. Shewhart who learned the importance of quality in design. After WWII he was part of the team who helped to rebuild the Japanese economy and he taught the Japanese what he had learned and practiced during WWII – which was how to create a high-quality, high-speed, high-efficiency process which, ironically, was building ships for the war effort. Later Deming attempted, and failed, to influence the post-war generation of managers that were being churned out by the new business schools to serve the growing global demand for American mass produced consumer goods. Deming returned to relative obscurity in the USA until 1980 when his teachings were rediscovered when Japan started to challenge the USA economically by producing higher-quality-and-lower-cost consumer products such as cars and electronics ( http://en.wikipedia.org/wiki/W._Edwards_Deming). Before he died in 1993 Deming wrote two books – Out of The Crisis and The New Economics in which he outlines his learning and his philosophy and in which he unreservedly and passionately blames the managers and the business schools that trained them for their arrogant attitude and disrespectful behaviour. Like Semmelweis, the fact that his books contain a deep well of wisdom does not justify the means by which he disseminated his criticism of poeple – in particular of senior management. By doing so he probably created resistance and delayed the spread of knowledge.  

History is repeating itself: the same story is being played out in the global healthcare system. Neither senior doctors nor senior managers are aware of the opportunity that the learning of Semmelweis and Deming represent – the opportunity of Improvement Science and of the theory, techniques and tools of Operations Management. The global healthcare system is in a state of collective blissful ignorance.  Our descendents be the recipients of of decisions and the judges of our behaviour – and time is running out – we do not have the luxury of learning by making the same mistake.
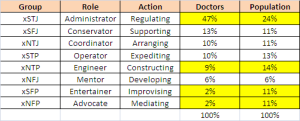
Fortunately, there is an growing group of people who are painfully aware of the problem and are voicing their concerns – such as the Institute of Healthcare Improvement  in America. There is a smaller and less well organised network of people who have acquired and applied some of the knowledge and are able to demonstrate how it works – the Know Hows. There appears to be an even smaller group who understand and use the principles but do it intuitively and unconsciously – they dem0nstrate what is possible but find it difficult to teach others how to do what they do. It is the Know How group that is the key to dissolving the problem.

The first collective challenge is to sign-post some safe paths from Collective Blissful Ignorance to Individual Know How. The second collective challenge is to learn an effective and respectful way to raise awareness of the problem – a way to outline the current reality and the future opportunity – and a way that illuminates the paths that link the two.

In the land of the blind the one-eyed man is the person who discovers that everyone is wearing a head-torch by accidentally finding his own and switching it on!


The Ten Billion Barrier

I love history – not the dry boring history of learning lists of dates – the inspiring history of how leaps in understanding happen after decades of apparently fruitless search.  One of the patterns that stands out for me in recent history is how the growth of the human population has mirrored the changes in our understanding of the Universe.  This pattern struck me as curious – given that this has happened only in the last 10,000 years – and it cannot be genetic evolution because the timescale is to short. So what has fuelled this population growth? On further investigation I discovered that the population growth is exponential rather than linear – and very recent – within the last 1000 years.  Exponential growth is a characteristic feature of a system that has a positive feedback loop in it that is not balanced by an equal and opposite negative feedback loop. So, what is being fed back into the system that is creating this unbalanced behaviour? My conclusion so far is “collective improvement in understanding”.

However, exponential growth has a dark side – it is not sustainable. At some point a negative feedback loop will exert itself – and there are two extremes to how fast this can happen: gradual or sudden. Sudden negative feedback is a shock is the one to avoid because it is usually followed by a dramatic reversal of growth which if catastrophic enough is fatal to the system.  When it is less sudden and less severe it can lead into repeating cycles  of growth and decline – boom and bust – which is just a more painful path to the same end.  This somewhat disquieting conclusion led me to conduct the thought experiment that is illustrated by the diagram: If our growth is fuelled by our ability to learn, to use and to maintain our collective knowledge what changes in how we do this must have happened over the last 1000 years?  Biologically we are social animals and using our genetic inheritance we seem only able to maintain about 100 active relationships – which explains the natural size of family groups where face-to-face communication is paramount.  To support a stable group that is larger than 100 we must have developed learned behaviours and social structures. History tells us that we created communities by differentiating into specialised functions and to be stable these were cooperative rather than competitive and the natural multiplier seems to be about 100.  A community with more than 10,000 people is difficult to sustain with an ad hoc power structure with a powerful leader and we develop collective “rules” and a more democratic design – which fuels another 100 fold expansion to 1 million – the order of magnitide of a country or city. Multiply by 100 again and we get the size that is typical of a country and the social structures required to achieve stablity on this scale are different again – we needed to develop a way of actively seeking new knowledge, continuously re-writing the rule books, and industrialising our knowkedge. This has only happened over the last 300 years.  The next multipler takes us to Ten Billion – the order of magnitude of the current global population – and it is at this stage that  our current systems seem to be struggling again.

From this geometric perspective we appear to be approaching a natural human system barrier that our current knowledge management methods seem inadequate to dismantle – and if we press on in denial then we face the prospect of a sudden and catastrophic change – for the worse. Regression to a bygone age would have the same effect because those systems are not designed to suport the global economy.

So, what would have to change in the way we manage our collective knowledge that would avoid a Big Crunch and would steer us to a stable and sustainable future?

Disruptive Innovation

Africa is a fascinating place.  According to a documentary that I saw last year we are ALL descended from a small tribe who escaped from North East Africa about 90,000 years ago. Our DNA carries clues to the story of our journey and it shows that modern man (Africans, Europeans, Asians, Chinese, Japanese, Australians, Americans, Russians etc) – all come from a common stock. It is salutory to reflect how short this time scale is, how successful this tribe has been in replacing all the other branches of the human evolutionary tree, and how the genetic differences between colours and creeds are almost insignificant.  All the evolution that has happened in the last 90,000 years that has transformed the world and the way we live is learned behaviour. This means that, unlike our genes, it is possible to turn the clock backwards 90,000 years in just one generation. To avoid this we need to observe how the descendents of the original tribe learned to do many new things – forced by their new surroundings to adapt or perish.  This is essence of Improvement Science – changing context continuously creates new challenges – from which we can learn, adapt and flourish.

To someone born in rural England a mobile phone appears to be a relatively small step on a relentless technological evolution – to someone born in rural Africa it is a radical and world-changing paradigm shift – one that has already changed their lives.  In some parts of Africa money is now managed using mobile phones and this holds the promise of bypassing the endemic bureaucratic and corrupt practices that so often strangle the greens shoots of innovation and improvement. Information and communication is the lifeblood of improvement and to introduce a communication technology that is reliable, effective, and affordable into a vast potential for cultural innovation is rather like introducing a match to the touchpaper of a firework. Once the fuse has started to fizz there is no going back. The name given to this destabilising phenomenon is “disruptive innovation” and fortunately it can work for the good of all – so long as we steer it in a win-win-win direction. And that is a big challenge because our history suggests that we find exploitation easier than evolution and exploitation always leads to lose-lose-lose outcomes.

So while our global tribe may have learned enough to create a global phone system we still have much to learn about how to create a global social system.

Small Step or Giant Leap?

This iconic image of Earthrise over the Moonscape reveals the dynamic complexity of the living Earth contrasting starkly with the static simplicity of the dead Moon. The feeling of fragility that this picture evokes sounds a warning bell for us – “Death is Irreversible and Life is not Inevitable”. In reality this image was a small technical step that created a giant cultural leap.

And so it is with much of Improvement Science – the perception of the size of the challenge changes once the challenge is overcome. With the benefit of hindsight it was easy, even obvious – but with only the limit of foresight it looked difficult and obscure.  Our ability to challenge, learn and adopt a new perspective is the source of much gain and much pain. We gain the excitement of new understanding and we feel the pain of being forced to face our old ignorance.  Many of us deny ourselves the gain because we cannot face the pain – but it does not have to be that way. We have a tendency to store the pain up until we are forced to face it – and by this means we create what feel like insurmountable barriers to improvement.  There is an alternative – bite sized improvement – taking small steps towards a realistic goal that is on a path to our distant objective.  The small-step method has many advantages – we can do things that matter to us and are within our circle of influence; we can learn and practice the skills in safety; and we can start immediately.

In prospect it will feel like a giant leap and in retrospect it will look like a small step – that is the way of Improvement Science – and as our confidence and curiosity grow we take bigger steps and make smaller leaps.  

Deming’s “System of Profound Knowledge”

W. Edwards Deming (1900-1993) is sometimes referred to as the Father of Quality. He made such a significant contribution to Japan’s burgeoning post-war reputation for innovative high-quality products, and the rapid development of their economic power, that he is regarded as having made more of a difference than any other individual not of Japanese heritage.

Though best known as a statistician and economist, he was initially educated as an electrical engineer and mathematical physicist. To me however he was more of a social scientist – interested in the science of improvement and the creation of value for customers. A lifelong learner, in his later years (1) he became fascinated by epistemology – the processes by which knowledge is created – and this led him into wanting to know more about the psychology of human behaviour and its underlying motivations.

In his nineties he put his whole life of learning into one model – his System of Profound Knowledge (SoPK). What follows is my brief take on each of the four elements of the SoPK and how they fit together.

THE PSYCHOLOGY OF HUMAN BEHAVIOUR
Everyone is different, and we all SEE things differently. We then DO things based on how we see things – and we GET results – of some kind. Over time we shore up our own particular view of the world – some call this a “paradigm” – our own particular world view – multiple loops of DO-GET-SEE (2) are self-reinforcing and as our sense making becomes increasingly fixed we BEHAVE – BECOME – BELIEVE. The trouble is we each to some extent get divorced from reality, or at least how most others see it – in extreme cases we might even get classified by some people as “insane” – indeed the clinical definition of insanity is doing the same things whilst expecting different results.

THE ACQUISITION OF KNOWLEDGE
So when we DO things it would be helpful if we could do them as little experiments that test our sense of what works and what is real. Even better we might get others to help us interpret the results from the benefit of their particular world view/ paradigm. Did you study science at school? If so you might recognize that learning in this way by experimentation is the “scientific method” in action. Through these cycles of learning knowledge gets continually refined and builds. It is also where improvement comes from and how reality evolves. Deming referred to this as the PLAN-DO-STUDY-ACT Cycle (1) – personally i prefer the words in this adjacent diagram. For me the cycle is as much about good mental health as acquiring knowledge, because effective learning (3) keeps individuals and organizations connected to reality and in control of their lives.

UNDERSTANDING VARIATION
The origins of PDSA lie with Walter Shewhart (4) who in 1925 – invented it to help people in organizations methodically and continually inquire into what is happening. He observed that when workers or managers make changes in their working practices so that their processes run better, the results vary, and that this variation often fools them. So he invented a tool for collecting numbers in real time so that each process can be listened in to as a “system” – much like a doctor uses a stethoscope to collect data and interpret how their patient’s system is behaving, by asking what might be contributing to – actually causing – the system’s outcomes. Shewhart named the tool Statistical Process Control – three words, each of which for many people are an instant turn-off. This means they miss his critical insight that there are two distinct types of variation – noise and signal, and that whilst all systems contain noise, only some contain signals – which if present can be taken to be assignable causes of systemic behaviour. Indeed to make it more palatable the tool might better be referred to as a “system behaviour chart”. It is meant to be interpreted like a doctor or nurse interprets the vital sign graph on the end of a patient’s bed i.e. to decide what action if any to take and when. Here is an example that has been created in BaseLine© which is specifically designed to offer the agnostic direct access to the power of Shewhart’s thinking. (5).

THINKING SYSTEMICALLY
What is meant by the word “system”? It means all the parts connected and interrelated as a whole (3). It is often helpful to get representatives of the various stakeholder groups to map the system – with its parts, the flows and the connections – so they can see how different people make sense of say.. their family system, their work system, a particular process of interest.. indeed any system of any kind that feels important to them. The map shown here is one used that might be used generically by manufacturers to help them investigate the separate causal sources of systemic variation – from the Suppliers of Inputs received, to the Processes that convert those inputs into Outputs, which can then be received by Customers – all made possible by vital support processes. This map (1) was taught by Deming in 1950 to Japan’s leaders. When making sense of their own particular systemic context others may prefer a different kind of map, but why? How come others prefer to make sense of things in their own way? To answer this Peter Senge (3) in his own equivalent to the SoPK says you need 5 distinct disciplines: the ability to think systemically, to learn as a team, to create a shared vision, to understand how our mental models get ingrained, and lastly “personal mastery” … which takes me back to where I started.

Aware that he was at the end of his life of learning, Deming bequeathed his System of Profound Knowledge to us so that we might continue his work. Personally, I love the SoPK because it is so complete. It is hard however to keep such a model, complete and as a whole, continually in the front of our minds – such that everything we think and do can be viewed as a fractal of that elegant whole. Indeed as a system, the system of profound knowledge is seriously – even fatally – undermined if any single part is missing ..

• Without understanding the causes of human behaviour we have no empathy for other people’s worldviews, other value systems. Without empathy our ability to manage change is fundamentally impaired.

• Without being good at experimentation and turning our experience into Knowledge – the very essence of science – we threaten our very mental health.

• Without understanding variation we are all too easily deluded – ask any magician (6). We spin our own reality. In ignoring or falsely interpreting data we are even “wilfully blind” (7). Baseline© for example is designed to help people make more of their time-series data – a window onto the system that their data is representing – using its inherent variation to gain an enhanced sense of what’s actually happened, as well as what’s really happening, and what if things stay the same is most likely to happen.

• Without being able to see how things are connected – as a whole system – and seeing the uniqueness of our own particular context, moment to moment, we miss the importance of our maps – and those of others – for good sense-making. We therefore miss the sharing of our individual realities, and with it the potential to spot what really causes outcomes – which neatly takes us back to the need for empathy and for understanding the psychology of human behaviour.

For me the challenge is to be continually striving for that sense of the SoPK – as a complete whole – and by doing this to see how I might grow my influence in the world.

Julian Simcox

References

1. Deming W.E – The New Economics – 1993
2. Covey S.R. – The 7 habits of Highly Effective People – 1989
3. Senge P. M. – The Fifth Discipline: the art and practice of the learning organization – 1990
4. Wheeler D.J. & Poling S.R.– Building Continual Improvement – 1998
5. BaseLine© is available via www.threewinsacademy.co.uk.
6. Macknik S, et al – Sleights of Mind – What the neuroscience of magic reveals about our brains – 2011.
7. Heffernan M. – Wilfully Blind – 2011

Politics, Policy and Police.

I love words – they are a window into the workings of our caveman wetware. Spoken and written language is the remarkably recent innovation that opened the door to the development of civilisations because it allowed individual knowledge to accumulate, to be shared, to become collective and to span generations (the picture is 4000 year old Minoan script) .

We are social animals and we have discovered that our lives are more comfortable and more predictable if we arrange ourselves into collaborative groups – families, tribes and communities; and through our collaboration we have learned to tame our enironment enough to allow us to settle in one place and to concentrate more time and effort on new learning.  The benefits of this strategy comes at a price – because as the size of our communities grow we are forced to find new ways to make decisions that are in the best interests of everyone.  And we need to find new ways to help ourselves abide by those decisions as individuals without incurring the cost of enforcement.  The word “civis” means a person who shares the privileges and the duties of the community in which they live.  And size matters – hamlets, villages and towns developed along with our ability to behave in a “civilised” way. Eventually cities appeared around 6000 years ago – and the Greek word for a city is “polis”.  The bigger the city the greater the capacity to support learning and he specialistion of individual knowledge, skills and experience. This in turn fuels the growth of the group and the development of specialised groups – tribes within tribes. A positive feedback loop is created that drives bigger-and-bigger settlements and more and more knowledge. Until … we forget what it is that underpins the whole design – civilised behaviour.  While our knowkedge has evolved at an accelerating pace our caveman brains have not kept up – and this is where the three “Poli” words come in – they all derive from the same root “polis” and they describe a process:

1. Politic  is the method by which the collective decisions are generated.
2. Policy is the method by which the Political decisions are communicated.
3. Police is the method by which the System of Policies are implemented.

The problem arises when the growth of knowledge and the inevitable changes that result starts to challenge the current Politic+Policy+Police Paradigm that created the context for the change to happen.  The Polices are continulally evolving – as evidenced by the continuous process of legislation. The Paradigm can usually absorb a lot of change but there usually comes a point when it becomes increasingly apparent to the society the the Paradigm has to change radically to support further growth. The more rigid the Policy and the more power to enforce if present the greater the social pressure that builds before the paradigm fractures – and the greater the disruption that will ensue as the social pressure is released.  History is a long catalogue of political paradigm shifts of every size – from minor tremors to major quakes – shifts that are driven by our insatiable hunger for knowledge, understanding and meaning.

Improvement Science operates at the Policy stage and is therefore forms the critical link between Politics and Police.  The purpose of Improvement Science is to design, test and implement Policies that deliver the collective Win-Win-Win outcomes.  Improvement Science is an embodiment of civilised behaviour and it embraces both the constraints that are decided by the People and the constraints that are defined by the Physics.

The Plague of Niggles

Historians tell us that in the Middle Ages about 25 million people, one third of the population of Europe, were wiped out by a series of Plagues! We now know that the cause was probably a bacteria called Yersinia Pestis that was spread by fleas when they bite their human hosts to get a meal of blood. The fleas were carried by rats and ships carried the rats from one country to another.  The unsanitary living conditions of the ports and towns at the time provided the ideal conditions for rats and fleas and, with a superstitious belief that cats were evil, without their natural predator the population of rats increased, so the population of fleas increased, so the likehood of transmission of the lethal bacteria increased, and the number of people decreased. A classic example of a chance combination of factors that together created an unstable and deadly system.

The Black Death was not eliminated by modern hi-tech medicine; it just went away when some of the factors that fuelled the instability were reduced. A tangible one being the enforced rebuilding of London after the Great Fire in Sept 1666 which gutted the medieval city and which followed the year after the last Great Plague in 1665 that killed 20% of the population. 

The story is an ideal illustration of how apparently trivial, albeit  annoying, repeated occurences can ultimately combine and lead to a catastrophic outcome.  I have a name for these apparently trivial, annoying and repeated occurences – I call them Niggles – and we are plagued by them. Every day we are plagued by junk mail, unpredictable deliveries, peak time traffic jams, car parking, email storms, surly staff, always-engaged call centres, bad news, bureaucracy, queues, confusion, stress, disappointment, depression. Need I go on?  The Plague of Niggles saps our spirit just as the Plague of Fleas sucked our ancestors blood.  And the Plague of Niggles infect us with a life-limiting disease – not a rapidly fatal one like the Black Death – instead we are infected with a slow, progressive, wasting disease that affects our attitude and behaviour and which manifests itself as criticism, apathy and cynicism.  A disease that seems as terifying, mysterious and incurable to us today as the Plague was to our ancestors. 

History repeats itself and we now know that complex systems behave in characteristic ways – so our best strategy may the same – prevention. If we use the lesson of history as our guide we should be proactive and focus our attention on the Niggles. We should actively seek them out; see them for what they really are; exercise our amazing ability to understand and solve them; and then share the nuggets of new knowledge that we generate.

Seek-See-Solve-Share.

What Happens if We Cut the Red Tape?

Later in his career, the famous artist William Heath-Robinson (1872-1944) created works of great ingenuity that showed complex inventions that were created to solve real everyday problems.  The genius of his work was that his held-together-with-string contraptions looked comically plausible. This genre of harmless mad-inventorism has endured, for example as the eccentric Wallace and Grommet characters.

The problem arises when this seat-of-the-pants incremental invent-patch-and-fix approach is applied to real systems – in particular a healthcare system. We end up with the same result – a Heath-Robinson contraption that is held together with Red Tape.

The complex bureaucracy both holds the system together and clogs up the working – and everyone knows it. It is not harmless though – it is expensive, slow and lethal.  How then do we remove the Red Tape to allow the machine to work more quickly, more safely and more affordably – without the whole contraption falling apart?

A good first step would be to stop adding yet more Red Tape. A sensible next step would be to learn how to make the Red Tap redundant before removing it. However, if we knew how to do that already we would not have let the Red Tapeworms infest our healthcare system in the first place!  This uncomfortable conclusion raises some questions …

What insight, knowledge and skill are we missing?
Where do we need to look to find the skills we lack?
Who knows how to safely eliminate the Red Tapeworms?
Can they teach the rest of us?
How long will it take us to learn and apply the knowledge?
Why might we justify continuing as we are?
Why might we want to maintain the status quo?
Why might we ignore the symptoms and not seek advice?
What are we scared of? Having to accept some humility?

That doesn’t sound like a large price to pay for improvement!

Anyone Heard of Henry Gantt?

Most managers have heard of Gantt charts and associate them with project management where they are widely used to help coordinate the separate threads of work so that the project finishes on time.

How many know about the man who invented them and why?

Henry Laurence Gantt (1861-1919) was an engineer and he invented the chart for a very different purpose – so that the workers and the managers could see at a glance the progress of the work and to see what was impairing the flow.  Decades before the invention of the computer, Henry Gantt created a simple and incredibly powerful visual tool for enabling workers and managers to improve processes together.

I know how simple and powerful the original Gantt chart is because I use it all the time for capturing the behaviour of a process in a visual form that stimulates constructive conversations which result in win-win-win improvements.  All you need is some squared paper, a pencil, a clock, a Mark I Eyeball or two, and a bit of practice.