A Case of Chronic A&E Pain: Part 3

Dr_Bob_ThumbnailDr Bob runs a Clinic for Sick Systems and is sharing the story of a recent case – a hospital that has presented with chronic pain in their A&E department.

It is a complicated story so Dr Bob is presenting it in bite-sized bits that only require a few minutes to read. Part 1 is here. Part 2 is here.

To summarise the case history so far:

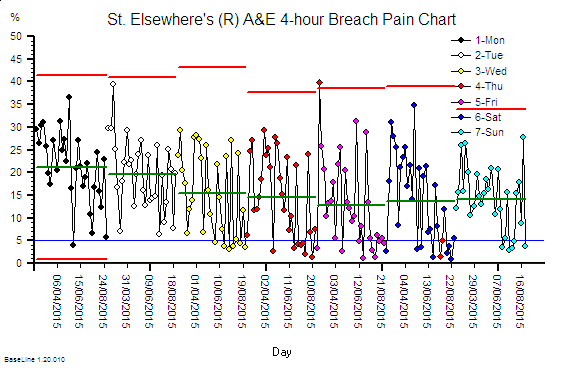
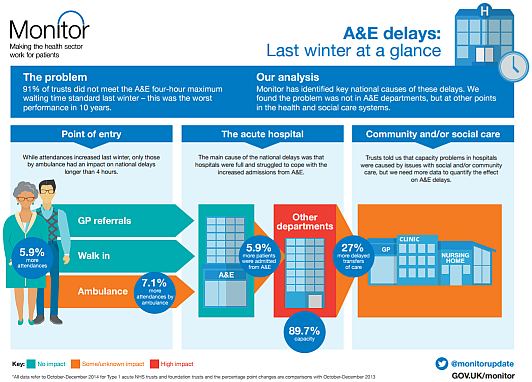
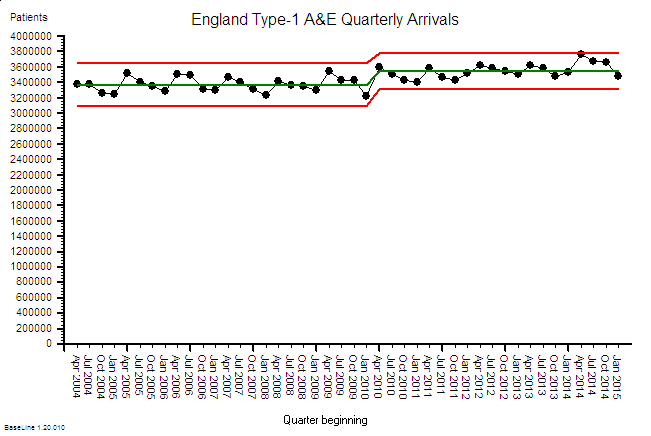
The patient is St.Elsewhere’s® Hospital, a medium sized district general hospital situated in mid-England. StE has a type-1 A&E Department that receives about 200 A&E arrivals per day which is rather average. StE is suffering with chronic pain – specifically the emotional, operational, cultural and financial pain caused by failing their 4-hour A&E target. Their Paymasters and Inspectors have the thumbscrews on, and each quarter … when StE publish their performance report that shows they have failed their A&E target (again) … the thumbscrews are tightened a few more clicks. Arrrrrrrrrrrrgh.

Dr Bob has discovered that StE routinely collect data on when individual patients arrive in A&E and when they depart, and that they use this information for three purposes:
1) To calculate their daily and quarterly 4-hour target failure rate.
2) To create action plans that they believe will eliminate their pain-of-failure.
3) To expedite patients who are approaching the 4-hour target – because that eases the pain.

But the action plans do not appear to have worked and, despite their heroic expeditionary effort, the chronic pain is getting worse. StE is desperate and has finally accepted that it needs help. The Board are worried that they might not survive the coming winter storm and when they hear whispers of P45s being armed and aimed by the P&I then they are finally scared enough to seek professional advice. So they Choose&Book an urgent appointment at Dr Bob’s clinic … and they want a solution yesterday … but they fear the worst. They fear discovering that there is no solution!

The Board, the operational managers and the senior clinicians feel like they are between a rock and a hard place.  If Dr Bob’s diagnosis is ‘terminal’ then they cannot avert the launch of the P45’s and it is Game Over for the Board and probably for StE as well.  And if Dr Bob’s diagnosis is ‘treatable’ then they cannot avert accepting the painful exposure of their past and present ineptitude – particularly if the prescribed humble pie is swallowed and has the desired effect of curing the A&E pain.

So whatever the diagnosis they appear to have an uncomfortable choice: leave or learn?

Dr Bob has been looking at the A&E data for one typical week that StE have shared.

And Dr Bob knows what to look for … the footprint of a dangerous yet elusive disease. A characteristic sign that doctors have a name for … a pathognomic sign.

Dr Bob is looking for the Horned Gaussian … and has found it!

So now Dr Bob has to deliver the bittersweet news to the patient.


<Dr Bob> Hello again. Please sit down and make yourselves comfortable. As you know I have been doing some tests on the A&E data that you shared.  I have the results of those tests and I need to be completely candid with you. There is good news and there is not-so-good news.

[pause]

Would you like to hear this news and if so … in what order?

<StE> Oh dear. We were hoping there was only good news so perhaps we should start there.

<Dr Bob> OK.  The good news is that you appear to be suffering from a treatable disease. The data shows the unmistakable footprint of a Horned Gaussian.

<StE> Phew! Thank the Stars! That is what we had hoped and prayed for! Thank you so much. You cannot imagine how much better we feel already.  But what is the not-so-good news?

<Dr Bob> The not-so-good news is that the disease is iatrogenic which is medical jargon for self-inflicted.  And I appreciate that you did not do this knowingly so you should not feel guilt or blame for doing things that you did not know are self-defeating.

[pause]

And in order to treat this disease we have to treat the root cause and that implies you have a simple choice to make.

<StE> Actually, what you are saying does not come as a surprise. We have sensed for some time that there was something that we did not really understand but we have been so consumed by fighting-the-fire that we have prevaricated in grasping that nettle.  And we think we know what the choice is: to leave or to learn. Continuing as we are is no longer an option.

<Dr Bob> You are correct.  That is the choice.


StE confers and unanimously choose to take the more courageous path … they choose to learn.


<StE> We choose to learn. Can we start immediately? Can you teach us about the Horned Gaussian?

<Dr Bob> Of course, but before that we need to understand what a Gaussian is.

Suppose we have some very special sixty-sided dice with faces numbered 1 to 59, and suppose we toss six of them and wait until they come to rest. Then suppose we count up the total score on the topmost facet of each die … and then suppose we write that total down. And suppose we do this 1500 times and then calculate the average total score. What do you suppose the average would be … approximately?

<StE> Well … the score on each die can be between 1 and 59 and each number is equally likely to happen … so the average score for 1500 throws of one die will be about 30 … so the average score for six of these mega-dice will be about 180.

<Dr Bob> Excellent. And how will the total score vary from throw to throw?

<StE> H’mm … tricky.  We know that it will vary but our intuition does not tell us by how much.

<Dr Bob> I agree. It is not intuitively obvious at all. We sense that the further away from 180 we look the less likely we are to find that score in our set of 1500 totals but that is about as close as our intuition can take us.  So we need to do an empirical experiment and we can do that easily with a spreadsheet. I have run this experiment and this is what I found …

Sixty_Sided_Dice_Game
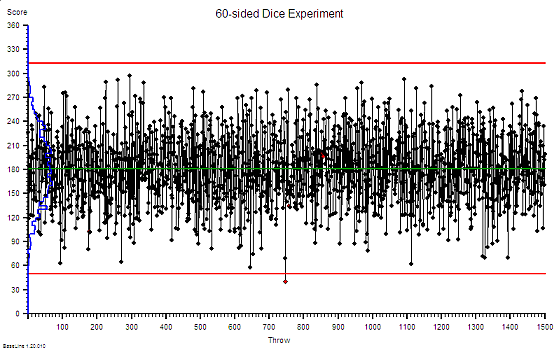
Notice that there is rather a wide spread around our expected average of 180 and remember that this is just tossing a handful of sixty-sided dice … so this variation is random … it is inherent and expected and we have no influence over it. Notice too that on the left the distribution of the scores is plotted as a histogram … the blue line. Notice the symmetrical hump-like shape … this is the footprint of a Gaussian.

<StE> So what? This is a bit abstract and theoretical for us. How does it help us?

<Dr Bob> Please bear with me a little longer. I have also plotted the time that each of your patients were in A&E last week on the same sort of chart. What do you notice?

StE_A&E_Actual

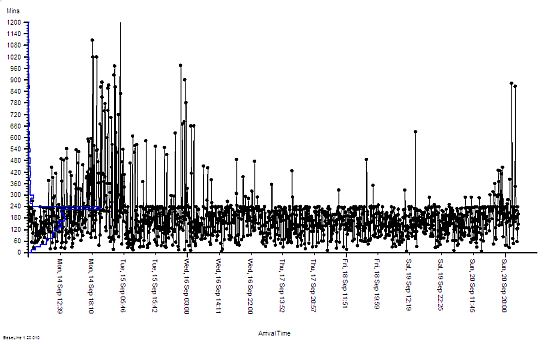
<StE> H’mm. This is very odd. It looks like someone has taken a blunt razor to the data … they fluffed the first bit but sharpened up their act for the rest of it. And the histogram looks a bit like the one on your chart, well the lower half does, then there is a big spike. Is that the Horned thingamy?

<Dr Bob> Yes. This is the footprint of a Horned Gaussian. What this picture of your data says is that something is distorting the natural behaviour of your A&E system and that something is cutting in at 240 minutes. Four hours.

<StE> Wait a minute! That is exactly what we do. We admit patients who are getting close to the 4-hour target to stop the A&E clock and reduce the pain of 4-hour failure.  But we can only admit as many as we have space for … and sometimes we run out of space.  That happened last Monday evening. The whole of StE hospital was gridlocked and we had no option but to store the A&E patients in the corridors – some for more than 12 hours! Just as the chart shows.

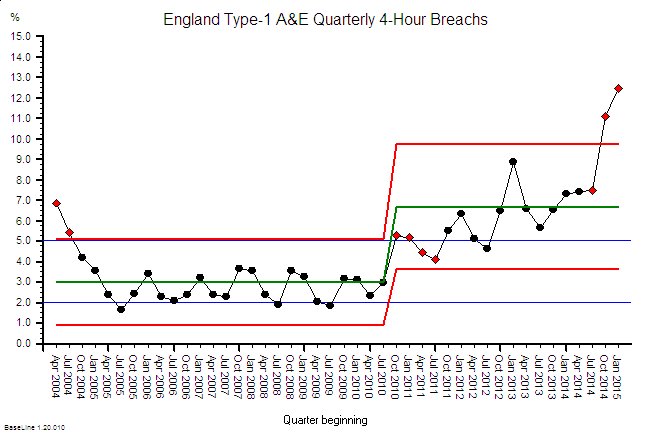
<Dr Bob> And by distorting your natural system behaviour in this way you are also distorting the data.  Your 4-hour breach rate is actually a lot lower that it would otherwise be … until the system gridlocks then it goes through the roof.  This design is unstable and unsafe.

[pause]

Are Mondays always like this?

<StE> Usually, yes. Tuesday feels less painful and the agony eases up to Friday then it builds up again.  It is worse than Groundhog Day … it is more like Groundhog Week!  The chaos and firefighting is continuous though, particularly in the late afternoon and evenings.      

<Dr Bob> So now we are gaining some understanding.  The uncomfortable discovery when we look in the mirror is that: part of the cause is our own policies that create the symptoms and obscure the disease. We have looked in the mirror and “we have seen the enemy and the enemy is us“. This is an iatrogenic disease and in my experience a common root cause is something called carveoutosis.  Understanding the pathogenesis of carveoutosis is the path to understanding what is needed to treat it.  Are you up for that?

<StE> You bet we are!

<Dr Bob> OK. First we need to establish a new habit. You need to start plotting your A&E data just like this. Every day. Every week. Forever. This is your primary feedback loop. This chart will tell you when real improvement is happening. Your quarterly average 4-hour breach percentage will not. The Paymasters, Inspectors and Government will still ask for that quarterly aggregated target failure data but you will use these diagnostic and prognostic system behaviour charts for all your internal diagnosis, decisions and actions.  And next week we will explore carveoutosis … 


St.Elsewhere’s® is a registered trademark of Kate Silvester Ltd.
And to read more real cases of 4-hour pain download Kate’s:
 The Christmas Crisis


A Case of Chronic A&E Pain: Part 2

Dr_Bob_ThumbnailHello, Dr Bob here.

This week we will continue to explore the Case of Chronic Pain in the A&E Department of St.Elsewhere’s Hospital.

Last week we started by ‘taking a history’.  We asked about symptoms and we asked about the time patterns and associations of those symptoms. The subjective stuff.

And as we studied the pattern of symptoms a list of plausible diagnoses started to form … with chronic carveoutosis as a hot contender.

Carveoutosis is a group of related system diseases that have a common theme. So if we find objective evidence of carveoutosis then we will talk about it … but for now we need to keep an open mind.


The next step is to ‘examine the patient’ – which means that we use the pattern of symptoms to focus our attention on seeking objective signs that will help us to prune our differential diagnosis.

But first we need to be clear what the pain actually is. We need a more detailed description.

<Dr Bob> Can you explain to me what the ‘4-hour target’ is?

<StE> Of course. When a new patient arrives at our A&E Department we start a clock for that patient, and when the patient leaves we stop their clock.  Then we work out how long they were in the A&E Department and we count the number that were longer than 4-hours for each day.  Then we divide this number by the number of patients who arrived that day to give us a percentage: a 4-hour target failure rate. Then we average those daily rates over three months to give us our Quarterly 4-hour A&E Target Performance; one of the Key Performance Indicators (KPIs) that are written into our contract and which we are required to send to our Paymasters and Inspectors.  If that is more than 5% we are in breach of our contract and we get into big trouble, if it is less than 5% we get left alone. Or to be more precise the Board get into big trouble and they share the pain with us.

<Dr Bob> That is much clearer now.  Do you know how many new patients arrive in A&E each day, on average.

<StE> About two hundred, but it varies quite a lot from day-to-day.


Dr Bob does a quick calculation … about 200 patients for 3 months is about 18,000 pieces of data on how long the patients were in the A&E Department …  a treasure trove of information that could help to diagnose the root cause of the chronic 4-hour target pain.  And all this data is boiled down into a binary answer to the one question in their quarterly KPI report:

Q: Did you fail the 4-hour A&E target this quarter? [Yes] [No]       

That implies that more than 99.99% of the available information is not used.

Which is like driving on a mountain road at night with your lights on but your eyes closed! Dangerous and scary!

Dr Bob now has a further addition to his list of diagnoses: amaurosis agnosias which roughly translated means ‘turning a blind eye’.


<Dr Bob> Can I ask how you use this clock information in your minute-to-minute management of patients?

<StE> Well for the first three hours we do not use it … we just get on with managing the patients.  Some are higher priority and more complicated than others, we call them Majors and we put them in the Majors Area. Some are lower priority and easier so we call them Minors and we put them in the Minors Area. Our doctors and nurses then run around looking after the highest clinical priority patients first … for obvious reasons. However, as a patient’s clock starts to get closer to 4-hours then that takes priority and those patients start to leapfrog up the queue of who to see next.  We have found that this is an easy and effective way to improve our 4-hour performance. It can make the difference between passing or failing a quarter and reducing our referred pain! To assist us implement the Leapfrog Policy our Board have invested in some impressive digital technology … a huge computer monitor on the wall that shows exactly who is closest to the 4-hour target.  This makes it much easier for us to see which patients needs to be leapfrogged for decision and action.

<Dr Bob>  Do you, by any chance, keep any of the individual patient clock data?

<StE> Yes, we have to do that because we are required to complete a report each week for the causes of 4-hour failures and we also have to submit an Action Plan for how we will eliminate them.  So we keep the data and then spend hours going back through the thousands of A&E cards to identify what we think are the causes of the delays. There are lots of causes and many patients are affected by more than one; and there does not appear to be any clear pattern … other than ‘too busy’. So our action plan is the same each week … write yet another business case asking for more staff and for more space. 

<Dr Bob> Could you send me some of that raw clock data?  Anonymous of course. I just need the arrival date and time and the departure date and time for an average week.

<StE> Yes of course – we will send the data from last week – there were about 1500 patients.


Dr Bob now has all the information needed to explore the hunch that the A&E Department is being regularly mauled by a data mower … one that makes the A&E performance look better … on paper … and that obscures the actual problem.

Just like treating a patient’s symptoms and making their underlying disease harder to diagnose and therefore harder to cure.

To be continued … here

A Case of Chronic A&E Pain: Part 1


Dr_Bob_Thumbnail

The blog last week seems to have caused a bit of a stir … so this week we will continue on the same theme.

I’m Dr Bob and I am a hospital doctor: I help to improve the health of poorly hospitals.

And I do that using the Science of Improvement – which is the same as all sciences, there is a method to it.

Over the next few weeks I will outline, in broad terms, how this is done in practice.

And I will use the example of a hospital presenting with pain in their A&E department.  We will call it St.Elsewhere’s ® Hospital … a fictional name for a real patient.


It is a while since I learned science at school … so I thought a bit of a self-refresher would be in order … just to check that nothing fundamental has changed.

Science_Sequence

This is what I found on page 2 of a current GCSE chemistry textbook.

Note carefully that the process starts with observations; hypotheses come after that; then predictions and finally designing experiments to test them.

The scientific process starts with study.

Which is reassuring because when helping a poorly patient or a poorly hospital that is exactly where we start.

So, first we need to know the symptoms; only then can we start to suggest some hypotheses for what might be causing those symptoms – a differential diagnosis; and then we look for more specific and objective symptoms and signs of those hypothetical causes.


<Dr Bob> What is the presenting symptom?

<StE> “Pain in the A&E Department … or more specifically the pain is being felt by the Executive Department who attribute the source to the A&E Department.  Their pain is that of 4-hour target failure.

<Dr Bob> Are there any other associated symptoms?

<StE> “Yes, a whole constellation.  Complaints from patients and relatives; low staff morale, high staff turnover, high staff sickness, difficulty recruiting new staff, and escalating locum and agency costs. The list is endless.”

<Dr Bob> How long have these symptoms been present?

<StE> “As long as we can remember.”

<Dr Bob> Are the symptoms staying the same, getting worse or getting better?

<StE> “Getting worse. It is worse in the winter and each winter is worse than the last.”

<Dr Bob> And what have you tried to relieve the pain?

<StE> “We have tried everything and anything – business process re-engineering, balanced scorecards, Lean, Six Sigma, True North, Blue Oceans, Golden Hours, Perfect Weeks, Quality Champions, performance management, pleading, podcasts, huddles, cuddles, sticks, carrots, blogs  and even begging. You name it we’ve tried it! The current recommended treatment is to create a swarm of specialist short-stay assessment units – medical, surgical, trauma, elderly, frail elderly just to name a few.” 

<Dr Bob> And how effective have these been?

<StE> “Well some seemed to have limited and temporary success but nothing very spectacular or sustained … and the complexity and cost of our processes just seem to go up and up with each new initiative. It is no surprise that everyone is change weary and cynical.”


The pattern of symptoms is that of a chronic (longstanding) illness that has seasonal variation, which is getting worse over time and the usual remedies are not working.

And it is obvious that we do not have a clear diagnosis; or know if our unclear diagnosis is incorrect; or know if we are actually dealing with an incurable disease.

So first we need to focus on establishing the diagnosis.

And Dr Bob is already drawing up a list of likely candidates … with carveoutosis at the top.


<Dr Bob> Do you have any data on the 4-hour target pain?  Do you measure it?

<StE> “We are awash with data! I can send the quarterly breach performance data for the last ten years!”

<Dr Bob> Excellent, that will be useful as it should confirm that this is a chronic and worsening problem but it does not help establish a diagnosis.  What we need is more recent, daily data. Just the last six months should be enough. Do you have that?

<StE> “Yes, that is how we calculate the quarterly average that we are performance managed on. Here is the spreadsheet. We are ‘required’ to have fewer than 5% 4-hour breaches on average. Or else.”


This is where Dr Bob needs some diagnostic tools.  He needs to see the pain scores presented as  picture … so he can see the pattern over time … because it is a very effective way to generate plausible causal hypotheses.

Dr Bob can do this on paper, or with an Excel spreadsheet, or use a tool specifically designed for the job. He selects his trusted visualisation tool : BaseLine©.


StE_4hr_Pain_Chart

<Dr Bob> This is your A&E pain data plotted as a time-series chart.  At first glance it looks very chaotic … that is shown by the wide and flat histogram. Is that how it feels?

<StE> “That is exactly how it feels … earlier in the year it was unremitting pain and now we have a constant background ache with sharp, severe, unpredictable stabbing pains on top. I’m not sure what is worse!

<Dr Bob> We will need to dig a bit deeper to find the root cause of this chronic pain … we need to identify the diagnosis or diagnoses … and your daily pain data should offer us some clues.

StE_4hr_Pain_Chart_RG_DoWSo I have plotted your data in a different way … grouping by day of the week … and this shows there is a weekly pattern to your pain. It looks worse on Mondays and least bad on Fridays.  Is that your experience?

<StE> “Yes, the beginning of the week is definitely worse … because it is like a perfect storm … more people referred by their GPs on Mondays and the hospital is already full with the weekend backlog of delayed discharges so there are rarely beds to admit new patients into until late in the day. So they wait in A&E.  


Dr Bob’s differential diagnosis is firming up … he still suspects acute-on-chronic carveoutosis as the primary cause but he now has identified an additional complication … Forrester’s Syndrome.

And Dr Bob suspects an unmentioned problem … that the patient has been traumatised by a blunt datamower!

So that is the evidence we will look for next … here

The Catastrophe is Coming

Monitor_Summary


This week an interesting report was published by Monitor – about some possible reasons for the A&E debacle that England experienced in the winter of 2014.

Summary At A Glance

“91% of trusts did not  meet the A&E 4-hour maximum waiting time standard last winter – this was the worst performance in 10 years”.


So it seems a bit odd that the very detailed econometric analysis and the testing of “Ten Hypotheses” did not look at the pattern of change over the previous 10 years … it just compared Oct-Dec 2014 with the same period for 2013! And the conclusion: “Hospitals were fuller in 2014“.  H’mm.


The data needed to look back 10 years is readily available on the various NHS England websites … so here it is plotted as simple time-series charts.  These are called system behaviour charts or SBCs. Our trusted analysis tools will be a Mark I Eyeball connected to the 1.3 kg of wetware between our ears that runs ChimpOS 1.0 …  and we will look back 11 years to 2004.

A&E_Arrivals_2004-15First we have the A&E Arrivals chart … about 3.4 million arrivals per quarter. The annual cycle is obvious … higher in the summer and falling in the winter. And when we compare the first five years with the last six years there has been a small increase of about 5% and that seems to associate with a change of political direction in 2010.

So over 11 years the average A&E demand has gone up … a bit … but only by about 5%.


A&E_Admissions_2004-15In stark contrast the A&E arrivals that are admitted to hospital has risen relentlessly over the same 11 year period by about 50% … that is about 5% per annum … ten times the increase in arrivals … and with no obvious step in 2010. We can see the annual cycle too.  It is a like a ratchet. Click click click.


But that does not make sense. Where are these extra admissions going to? We can only conclude that over 11 years we have progressively added more places to admit A&E patients into.  More space-capacity to store admitted patients … so we can stop the 4-hour clock perhaps? More emergency assessment units perhaps? Places to wait with the clock turned off perhaps? The charts imply that our threshold for emergency admission has been falling: Admission has become increasingly the ‘easier option’ for whatever reason.  So why is this happening? Do more patients need to be admitted?


In a recent empirical study we asked elderly patients about their experience of the emergency process … and we asked them just after they had been discharged … when it was still fresh in their memories. A worrying pattern emerged. Many said that they had been admitted despite them saying they did not want to be.  In other words they did not willingly consent to admission … they were coerced.

This is anecdotal data so, by implication, it is wholly worthless … yes?  Perhaps from a statistical perspective but not from an emotional one.  It is a red petticoat being waved that should not be ignored.  Blissful ignorance comes from ignoring anecdotal stuff like this. Emotionally uncomfortable anecdotal stories. Ignore the early warning signs and suffer the potentially catastrophic consequences.


A&E_Breaches_2004-15And here is the corresponding A&E 4-hour Target Failure chart.  Up to 2010 the imposed target was 98% success (i.e. 2% acceptable failure) and, after bit of “encouragement” in 2004-5, this was actually achieved in some of the summer months (when the A&E demand was highest remember).

But with a change of political direction in 2010 the “hated” 4-hour target was diluted down to 95% … so a 5% failure rate was now ‘acceptable’ politically, operationally … and clinically.

So it is no huge surprise that this is what was achieved … for a while at least.

In the period 2010-13 the primary care trusts (PCTs) were dissolved and replaced by clinical commissioning groups (CCGs) … the doctors were handed the ignition keys to the juggernaut that was already heading towards the cliff.

The charts suggest that the seeds were already well sown by 2010 for an evolving catastrophe that peaked last year; and the changes in 2010 and 2013 may have just pressed the accelerator pedal a bit harder. And if the trend continues it will be even worse this coming winter. Worse for patients and worse for staff and worse for commissioners and  worse for politicians. Lose lose lose lose.


So to summarise the data from the NHS England’s own website:

1. A&E arrivals have gone up 5% over 11 years.
2. Admissions from A&E have gone up 50% over 11 years.
3. Since lowering the threshold for acceptable A&E performance from 98% to 95% the system has become unstable and “fallen off the cliff” … but remember, a temporal association does not prove causation.

So what has triggered the developing catastrophe?

Well, it is important to appreciate that when a patient is admitted to hospital it represents an increase in workload for every part of the system that supports the flow through the hospital … not just the beds.  Beds represent space-capacity. They are just where patients are stored.  We are talking about flow-capacity; and that means people, consumables, equipment, data and cash.

So if we increase emergency admissions by 50% then, if nothing else changes, we will need to increase the flow-capacity by 50% and the space-capacity to store the work-in-progress by 50% too. This is called Little’s Law. It is a mathematically proven Law of Flow Physics. It is not negotiable.

So have we increased our flow-capacity and our space-capacity (and our costs) by 50%? I don’t know. That data is not so easy to trawl from the websites. It will be there though … somewhere.

What we have seen is an increase in bed occupancy (the red box on Monitor’s graphic above) … but not a 50% increase … that is impossible if the occupancy is already over 85%.  A hospital is like a rigid metal box … it cannot easily expand to accommodate a growing queue … so the inevitable result in an increase in the ‘pressure’ inside.  We have created an emergency care pressure cooker. Well lots of them actually.

And that is exactly what the staff who work inside hospitals says it feels like.

And eventually the relentless pressure and daily hammering causes the system to start to weaken and fail, gradually at first then catastrophically … which is exactly what the NHS England data charts are showing.


So what is the solution?  More beds?

Nope.  More beds will create more space and that will relieve the pressure … for a while … but it will not address the root cause of why we are admitting 50% more patients than we used to; and why we seem to need to increase the pressure inside our hospitals to squeeze the patients through the process and extrude them out of the various exit nozzles.

Those are the questions we need to have understandable and actionable answers to.

Q1: Why are we admitting 5% more of the same A&E arrivals each year rather than delivering what they need in 4 hours or less and returning them home? That is what the patients are asking for.

Q2: Why do we have to push patients through the in-hospital process rather than pulling them through? The staff are willing to work but not inside a pressure cooker.


A more sensible improvement strategy is to look at the flow processes within the hospital and ensure that all the steps and stages are pulling together to the agreed goals and plan for each patient. The clinical management plan that was decided when the patient was first seen in A&E. The intended outcome for each patient and the shortest and quickest path to achieving it.


Our target is not just a departure within 4 hours of arriving in A&E … it is a competent diagnosis (study) and an actionable clinical management plan (plan) within 4 hours of arriving; and then a process that is designed to deliver (do) it … for every patient. Right, first time, on time, in full and at a cost we can afford.

Q: Do we have that?
A: Nope.

Q: Is that within our gift to deliver?
A: Yup.

Q: So what is the reason we are not already doing it?
A: Good question.  Who in the NHS is trained how to do system-wide flow design like this?