Managing Complex Change

There is no doubt about it: Change is Difficult. None of us like it. We all prefer the comfort and security of sameness. We are wired that way. Yet, change is inevitable. So, what can we do?

One option is to ignore it. Another is to resist it. And another is to make the best of it. It is even possible to embrace and celebrate it!

And what if we are responsible for managing change that will have an effect on others? That is a whole order of magnitude more difficult. There is an oft quoted statistic that 70% of change initiatives fail – which proves that it must be more difficult than the originators anticipated. Yet, if we look around we can examples of successful change everywhere – so it must be possible to manage it. How is it done? What are the traps to avoid? What do we need? What don’t we need? Where do we start? Who can we ask for guidance?

If we search the Web or use an AI assistant like ChatGPT, we will discover a multitude of change models such as Kurt Lewin’s Unfreeze-Change-Refreeze model or John Kotter’s Eight Steps. And if we compare and contrast these recipes we will find common themes such as the importance of leadership, and vision and a clear plan. That all makes sense.

What is more difficult to find are root cause analyses of failed changes that we can learn from. No one likes to talk about their failures but we need to compare the successes and failures to find the nuggets of wisdom that we can learn from and use to reduce the risk of failure for our own change initiatives. Learn to fail or fail to learn.

And how do we know if we are on track? What are the early warning signs of an impending failure that we could use to get us back on track or give us the confidence to abandon the attempt before too much time, money, blood, sweat and tears are wasted?


These are questions that have been buzzing around for years and recently I chanced across something that caught my eye. It was diagram that I had not come across before.

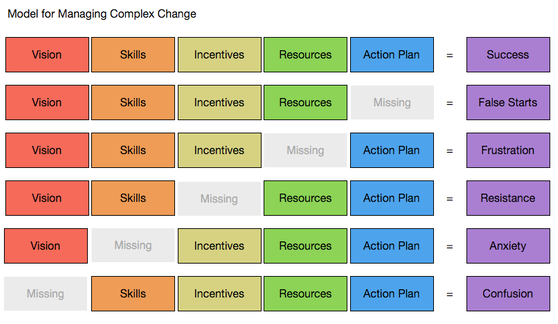
Two things immediately struck me. The first was the explicit inclusion of “Skills’ in the recipe for success. That made sense to me. The second was the symptoms of what happens if an ingredient of the complex change recipe is missing. Those made sense to me too because I have experienced them all.

The diagram I found was not attributed so I did a bit of searching – using the five ingredients as a starter. What I discovered was fascinating – a sort of Chinese Whispers story with different names attached to emergent variants of the diagram. I persevered and eventually found the original source – Dr Mary Lippitt who created and copyrighted the diagram in 1987.


The next thing I did was float the Lippitt diagram with other people who are actively working in applying the science of improvement in the health care sector – and who are faced with the challenge of having to manage complex change. The Lippitt diagram resonated strongly with them too – which I saw as a good sign.
I then found Dr Mary Lippitt’s email address and emailed her, out of the blue. And she replied almost immediately, thanked me, and we arranged to have a Zoom chat. It was fascinating. What I learned was that her passion for complex change blossomed when she inherited her father Gordon’s consulting business. He, like his older brother Ronald, worked in the organisational change domain and he wrote a book entitled “Organization Renewal” whose second edition was published in 1982. And I discovered that Ronald Lippitt was a colleague of Kurt Lewin – the Father of Social Psychology. So, the pedigree of the diagram I came across by chance is impeccable!


Changing even a small part of a health care system is a tough sociotechnical challenge and I have learned the hard way that a combination of social and technical skills are required. Many of these skills appear to be missing in health care organisations and that skills gap leads to the commonest source of resistance to change that I see: Anxiety.

It also goes some way to explain why we made significant progress in delivering health care service improvements when we focussed on giving the front line staff

a) the necessary technical skills to diagnose the causes of their service issues, and

b) the skills to redesign their processes to release the improvements they wanted to see.

We now have good evidence that we also, unwittingly, developed the complementary social skills to help spread the word of what is possible and how to achieve it organically across teams, departments and organisations.

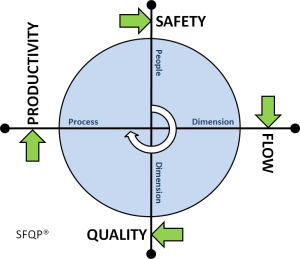
So, with her generous permission, we will be using Dr Mary Lippitt’s diagram to tell the story of how to manage complex change, and we will share what we learn as we go.

Crossing the Chasm

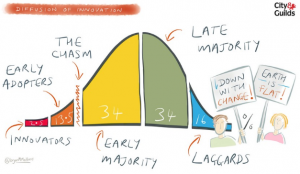
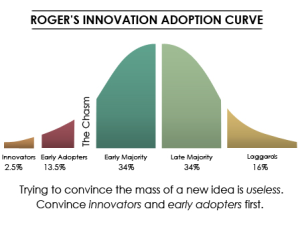
Innovation means anything new and new ideas spread through groups of people in a characteristic way that was described by Everett Rogers in the 1970’s.

The evidence showed that innovation started with the small minority of innovators (about 2%)  and  diffuses through the population – first to the bigger minority called early adopters.

Later, it became apparent that the diffusion path was not smooth and that there was a chasm into which many promising innovations fell and from which they did not emerge.

If this change chasm can be bridged then a tipping point is achieved when wider adoption by the majority becomes much more likely.

And for innovations that fundamentally change the way we live and work, this whole process can take decades! Generations even.

Take mobile phones and the Internet as good examples. How many can remember life before those innovations?  And we are living the transition to renewable energy, artificial intelligence and electric cars.


So, it is very rewarding to see growing evidence that the innovators who started the health care improvement movement back in the 1990’s, such as Dr Don Berwick in the USA and Dr Kate Silvester in the UK, have grown a generation of early adopters who now appear to have crossed the chasm.

The evidence for that can be found on the NHS Improvement website – for example the QSIR site (Quality, Service Improvement and Redesign).

Browsing through the QSIR catalogue of improvement tools I recognised them all from previous incarnations developed and tested by the NHS Modernisation Agency and NHS Institute for Innovation and Improvement.  And although those organisations no longer exist, they served as incubators for the growing community of healthcare improvement practitioners (CHIPs) and their legacy lives on.

This is all good news because we now also have a new NHS Long Term Plan which sets out an ambitious vision for the next 10 years and it is going to need a lot of work from the majority of people who work in the NHS to deliver. That will need capability-at-pace-and-scale.

And this raises some questions:

Q1: Will the legacy of the MA and NHSi scale to meet the more challenging task of designing and delivering the vision of a system of Integrated Care Systems (ICS) that include primary care, secondary care, community care, mental health and social care?

Q2: Will some more innovation be required?

If history is anything to go by, then I suspect the the answers will be “Q1: No” and “Q2: Yes”.

Bring it on!

Congratulations Kate!

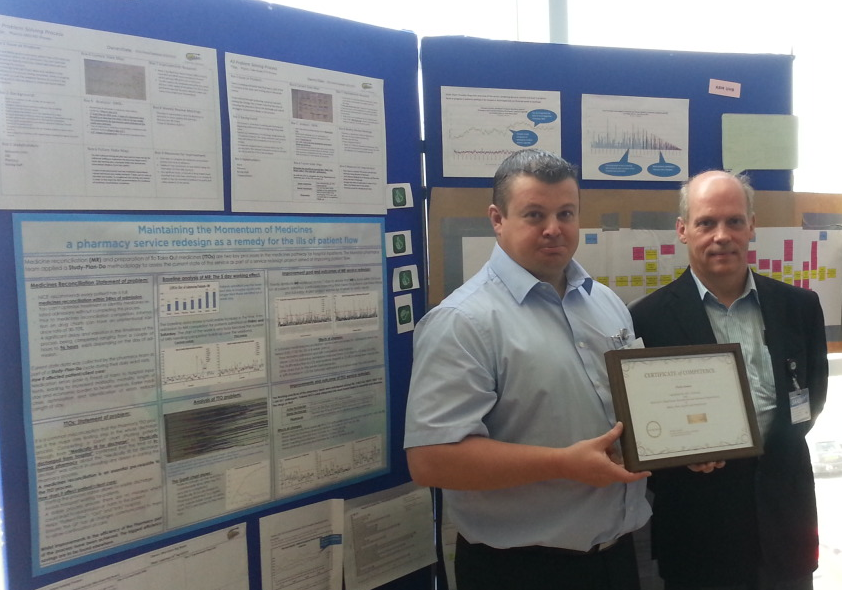
This week, it was my great pleasure to award the first Health Care Systems Engineering (HCSE) Level 2 Medal to Dr Kate Silvester, MBA, FRCOphth.

Kate is internationally recognised as an expert in health care improvement and over more than two decades has championed the adoption of improvement methods such as Lean and Quality Improvement in her national roles in the Modernisation Agency and then the NHS Institute for Innovation and Improvement.

Kate originally trained as a doctor and then left the NHS to learn manufacturing systems engineering with Lucas and Airbus.  Kate then brought these very valuable skills back with her into the NHS when she joined the Cancer Services Collaborative.

Kate is co-founder of the Journal of Improvement Science and over the last five years has been highly influential in the development of the Health Care Systems Engineering Programme – the first of its kind in the world that is designed by clinicians for clinicians.

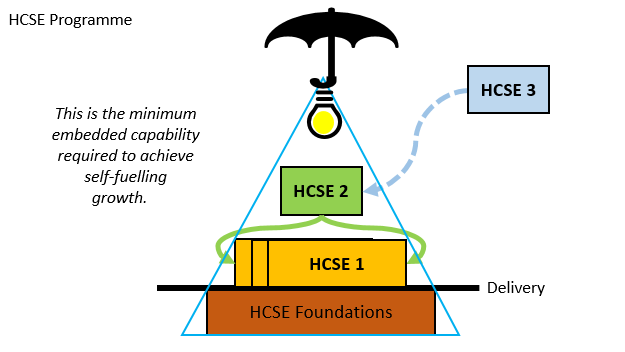
The HCSE Programme is built on the pragmatic See One-Do Some-Teach Many principle of developing competence and confidence through being trained and coached by a more experienced practitioner while doing projects of increasing complexity and training and coaching others who are less experienced.

Competence is based on evidence-of-effectiveness, and Kate has achieved HCSE Level 2 by demonstrating that she can do HCSE and that she can teach and coach others how to do HCSE as well.

To illustrate, here is a recent FHJ paper that Kate has authored which illustrates the HCSE principles applied in practice in a real hospital.  This work was done as part of the Health Foundation’s Flow, Cost and Quality project that Kate led and recent evidence proves that the improvements have sustained and spread.  South Warwickshire NHS Foundation Trust is now one of the top-performing Trusts in the NHS.

More recently, Kate has trained and coached new practitioners in Exeter and North Devon who have delivered improvements and earned their HCSE 1 wings.

Congratulations Kate!

The A.B.C.D.E. of Improvement

In medicine we use checklists as aide memoirs because they help us to avoid errors of omission, especially in an emergency when we are stressed and less able to think logically.

One that everyone learns if they do a First Aid course is A.B.C. and it stands for Airway, Breathing, Circulation.  It is designed to remind us what to do first because everything that follows depends on it, and then what to do next, and so on.  Avoiding the errors of omission improves outcomes.


In the world of improvement we are interested in change-for-the-better and there are many models of change that we can use to remind us not to omit necessary steps.

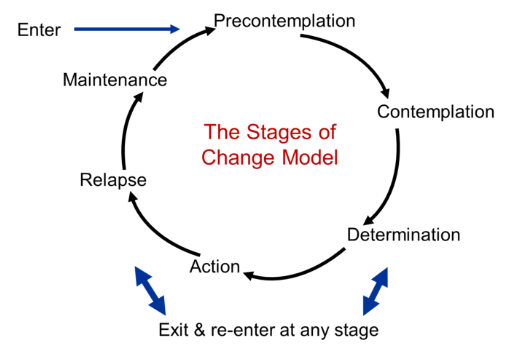
One of these is called the Six Steps model (or trans-theoretical model to use the academic title) and it is usually presented as a cycle starting with a state called pre-contemplation.

This change model arose from an empirical study of people who displayed addictive behaviours (e.g. smoking, drinking, drugs etc) and specifically, those who had overcome them without any professional assistance.

The researchers compared the stories from the successful self-healers with the accepted dogma for the management of addictions, and they found something very interesting.  The dogma advocated action, but the stories showed that there were some essential steps before action; steps that should not be omitted.  Specifically, the contemplation and determination steps.

If corrective actions were started too early then the success rate was low.  When the pre-action steps were added the success rate went up … a lot!


The first step is to raise awareness which facilitates a shift from pre-contemplation to contemplation.  The second step is to provide information that gradually increases the pros for change and at the same time gradually decreases the cons for change.

If those phases are managed skillfully then a tipping point is reached where the individual decides to make the change and moves themselves to the third step, the determination or planning phase.

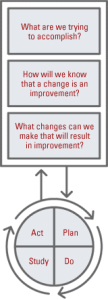
Patience and persistence is required.  The contemplation phase can last a long time.  It is the phase of exploration, evidence and explanation. It is preparing the ground for change and can be summed up in one word: Study.

Often the trigger for determination (i.e. Plan) and then action (i.e. Do) is relatively small because when we are close to the tipping point it does not take much to nudge us to step across the line.


And there is an aide memoir we can use for this change cycle … one that is a bit easier to remember:

A = Awareness
B = Belief
C = Capability
D = Delivery
E = Excellence (+enjoyment, +evidence, +excitement, +engagement)

First we raise awareness of the issue.
Then we learn a solution is possible and that we can learn the know-how.
Then we plan the work.
Then we work the plan.
Then we celebrate what worked and learn from what did and what did not.

Experience shows that the process is not discrete and sequential and it cannot be project managed into defined time boxes.  Instead, it is a continuum and the phases overlap and blend from one to the next in a more fluid and adaptive way.


Raising awareness requires both empathy and courage because this issue is often treated as undiscussable, and even the idea of discussing it is undiscussable too. Taboo.

But for effective change we need to grasp the nettle, explore the current reality, and start the conversation.

Cognitive Traps for Hefalumps

One of the really, really cool things about the 1.3 kg of “ChimpWare” between our ears is the way it learns.

We have evolved the ability to predict the likely near-future based on just a small number of past experiences.

And we do that by creating stored mental models.

Not even the most powerful computers can do it as well as we do – and we do it without thinking. Literally. It is an unconscious process.

This ability to pro-gnose (=before-know) gave our ancestors a major survival advantage when we were wandering about on the savanna over 10 million years ago.  And we have used this amazing ability to build societies, mega-cities and spaceships.


But this capability is not perfect.  It has a flaw.  Our “ChimpOS” does not store a picture of reality like a digital camera; it stores a patchy and distorted perception of reality, and then fills in the gaps with guesses (i.e. gaffes).  And we do not notice – consciously.

The cognitive trap is set and sits waiting to be sprung.  And to trip us up.


Here is an example:

“Improvement implies change”

Yes. That is a valid statement because we can show that whenever improvement has been the effect, then some time before that a change happened.  And we can show that when there are no changes, the system continues to behave as it always has.  Status quo.

The cognitive trap is that our ChimpOS is very good at remembering temporal associations – for example an association between “improvement” and “change” because we remember in the present.  So, if two concepts are presented at the same time, and we spice-the-pie with a bit of strong emotion, then we are more likely to associate them. Which is OK.

The problem comes when we play back the memory … it can come back as …

“change implies improvement” which is not valid.  And we do not notice.

To prove it is not valid we just need to find one example where a change led to a deterioration; an unintended negative consequence, a surprising, confusing and disappointing failure to achieve our intended improvement.

An embarrassing gap between our intent and our impact.

And finding that evidence is not hard.  Failures and disappointments in the world of improvement are all too common.


And then we can fall into the same cognitive trap because we generalise from a single, bad experience and the lesson our ChimpOS stores for future reference is “change is bad”.

And forever afterwards we feel anxious whenever the idea of change is suggested.

It is a very effective survival tactic – for a hominid living on the African savanna 10 million years ago, and at risk of falling prey to sharp-fanged, hungry predators.  It is a less useful tactic in the modern world where the risk of being eaten-for-lunch is minimal, and where the pace of change is accelerating.  We must learn to innovate and improve to survive in the social jungle … and we are not well equipped!


Here is another common cognitive trap:

Excellence implies no failures.

Yes. If we are delivering a consistently excellent service then the absence of failures will be a noticeable feature.

No failures implies excellence.

This is not a valid inference.  If quality-of-service is measured on a continuum from Excrement-to-Excellent, then we can be delivering a consistently mediocre service, one that is barely adequate, and also have no failures.


The design flaw here is that our ChimpWare/ChimpOS memory system is lossy.

We do not remember all the information required to reconstruct an accurate memory of reality – because there is too much information.  So we distort, we delete and we generalise.  And we do that because when we evolved it was a good enough solution, and it enabled us to survive as a species, so the ChimpWare/ChimpOS genes were passed on.

We cannot reverse millions of years of evolution.  We cannot get a wetware or a software upgrade.  We need to learn to manage with the limitations of what we have between our ears.

And to avoid the cognitive traps we need to practice the discipline of bringing our unconscious assumptions up to conscious awareness … and we do that by asking carefully framed questions.

Here is another example:

A high-efficiency design implies high-utilisation of resources.

Yes, that is valid. Idle resources means wasted resources which means lower efficiency.

Q1: Is the converse also valid?
Q2: Is there any evidence that disproves the converse is valid?

If high-utilisation does not imply high-efficiency, what are the implications of falling into this cognitive trap?  What is the value of measuring utilisation? Does it have a value?

These are useful questions.

The Awareness Ability Gap

It is always rewarding when separate but related ideas come together and go “click”.

And this week I had one of those “ah ha” moments while attempting to explain how the process of engagement works.

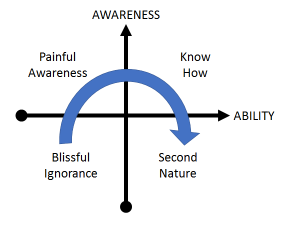
Many years ago I was introduced to the conscious-competence model of learning which I found really insightful.  Sometime later I renamed it as the awareness-ability model because the term “incompetent” felt too judgemental.

The idea is that when we learn, we all start from a position of being unaware of our inability.  We don’t know what we don’t know.

This state is called blissful ignorance.

And it is only when we try to do something that we become aware of what we cannot do; which can lead to temper tantrums!

As we ask, listen, reflect, learn, and practice our ability improves and we enter the zone of Know How.  We become able to demonstrate what we can do, and explain how we are doing it.

The Zone of Known Known.

The final phase comes when our ability becomes so habitual that we forget how we achieve our skill – it has become so intuitive and second nature.


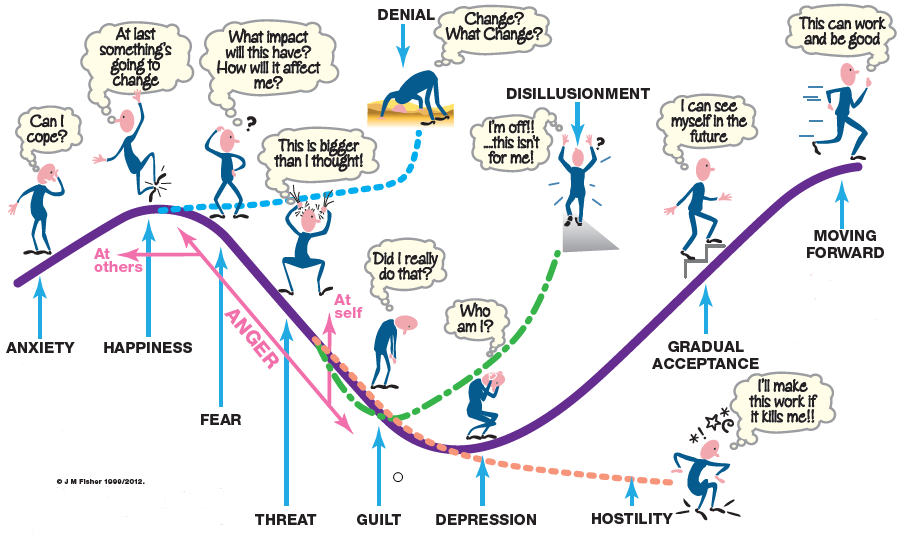
Some years later I was introduced to the Nerve Curve which is the emotional roller-coaster ride that accompanies change.  Any form of change.

The multi-step model was described in the context of bereavement by psychiatrist Elisabeth Kübler-Ross in her 1969 book “On Death & Dying: What the Dying Have to Teach Doctors, Nurses, Clergy and their Families.

More recently this grief reaction has been extended and applied by authors such as William Bridges and John Fisher in the less emotionally traumatic contexts called transitions.

The characteristic sequence of emotions are triggered by external events are:

  • shock
  • denial
  • frustration
  • blame
  • guilt
  • depression
  • acceptance
  • engagement
  • excitement.

The important messages in both of these models is that (a) this is a normal and expected process and (b) we can get stuck along the path of transition.  We can disengage at several points, signalling to others that we have come off the track.  When we do that we exhibit behaviours such as denial, disillusionment and hostility.


More recently I was introduced to the work of the late Chris Argyris and specifically the concept of “defensive reasoning“.

The essence of the concept:  As we start to become aware of a gap between our intentions and our impact, then we feel threatened and our natural emotional reaction is defensive.  This is the essence of the behaviour called “resistance to change”, and it is interesting to note that “smart” people are particularly adept at it.


These three concepts are clearly related in some way.   But how?


As a systems engineer I am used to cyclical processes and the concepts of wavelength, amplitude, phase and offset, and I found myself looking at the Awareness-Ability cycle and asking:

“How could that cycle generate the characteristic shape of the transition curve?”

Then the Argyris idea of the gap between intent and impact popped up and triggered another question:

“What if we look at the gap between our ability and our awareness?”

So, I conducted a thought experiment and imagined myself going around the cycle – and charting my ability, awareness and emotional state along the way … and this sketch emerged. Ah ha!

When my awareness exceeded my ability I felt disheartened. That is the defensive reasoning that Chris Argyris talks about, the emotional barrier to self-improvement.

But that sense is, paradoxically, associated with the steepest part of the learning curve.  It is almost as it there is a piece of emotional elastic linking the blue and green lines and how we feel is related to how much it is being stretched and in what direction.


This insight suggested to me that the process of building self-engagement requires opening the ability-versus-awareness gap a little-bit-at-a-time, then sensing the emotional discomfort, and then actively releasing the tension by learning a new concept, principle, technique or tool (and usually all four).  That makes sense.

The Q-Community

At some point in the life-cycle of an innovation, there is the possibility of crossing an invisible line called the tipping point.

This happens when enough people have experienced the benefits of the innovation and believe that the innovation is the future.  These lone innovators start to connect and build a new community.

It is an emergent behaviour of a complex adaptive system.


This week I experienced what could be a tipping point.

I attended the Q-Community launch event for the West Midlands that was held at the ICC in Birmingham … and it was excellent.

The invited speakers were both engaging and inspiring – boosting the emotional charge in the old engagement batteries; which have become rather depleted of late by the incessant wailing from the all-too-numerous peddlers of doom-and-gloom.

There was an opportunity to re-connect with fellow radicals who, over nearly two decades, have had the persistent temerity to suggest that improvement is necessary, is possible, have invested in learning how to do it, and have disproved the impossibility hypothesis.

There were new connections with like-minded people who want to both share what they know about the science of improvement and to learn what they do not.

And there were hand-outs, side-shows and break-outs.  Something for everyone.


The voice of the Q-Community will grow louder – and for it to be listened to it will need to be patiently and persistently broadcasting the news stories of what has been achieved, and how it was achieved, and who has demonstrated they can walk-the-talk.  News stories like this one:

Improving safety, flow, quality and affordability of unscheduled care of the elderly.


I sincerely hope that in the future, with the benefit of hindsight, we in the West Midlands will say – the 19th July 2017 was our Q-Community tipping point.

And I pledge to do whatever I can to help make that happen.

Catch-22

There is a Catch-22 in health care improvement and it goes a bit like this:

Most people are too busy fire-fighting the chronic chaos to have time to learn how to prevent the chaos, so they are stuck.

There is a deeper Catch-22 as well though:

The first step in preventing chaos is to diagnose the root cause and doing that requires experience, and we don’t have that experience available, and we are too busy fire-fighting to develop it.


Health care is improvement science in action – improving the physical and psychological health of those who seek our help. Patients.

And we have a tried-and-tested process for doing it.

First we study the problem to arrive at a diagnosis; then we design alternative plans to achieve our intended outcome and we decide which plan to go with; and then we deliver the plan.

Study ==> Plan ==> Do.

Diagnose  ==> Design & Decide ==> Deliver.

But here is the catch. The most difficult step is the first one, diagnosis, because there are many different illnesses and they often present with very similar patterns of symptoms and signs. It is not easy.

And if we make a poor diagnosis then all the action plans that follow will be flawed and may lead to disappointment and even harm.

Complaints and litigation follow in the wake of poor diagnostic ability.

So what do we do?

We defer reassuring our patients, we play safe, we request more tests and we refer for second opinions from specialists. Just to be on the safe side.

These understandable tactics take time, cost money and are not 100% reliable.  Diagnostic tests are usually precisely focused to answer specific questions but can have false positive and false negative results.

To request a broad batch of tests in the hope that the answer will appear like a rabbit out of a magician’s hat is … mediocre medicine.


This diagnostic dilemma arises everywhere: in primary care and in secondary care, and in non-urgent and urgent pathways.

And it generates extra demand, more work, bigger queues, longer delays, growing chaos, and mounting frustration, disappointment, anxiety and cost.

The solution is obvious but seemingly impossible: to ensure the most experienced diagnostician is available to be consulted at the start of the process.

But that must be impossible because if the consultants were seeing the patients first, what would everyone else do?  How would they learn to become more expert diagnosticians? And would we have enough consultants?


When I was a junior surgeon I had the great privilege to have the opportunity to learn from wise and experienced senior surgeons, who had seen it, and done it and could teach it.

Mike Thompson is one of these.  He is a general surgeon with a special interest in the diagnosis and treatment of bowel cancer.  And he has a particular passion for improving the speed and accuracy of the diagnosis step; because it can be a life-saver.

Mike is also a disruptive innovator and an early pioneer of the use of endoscopy in the outpatient clinic.  It is called point-of-care testing nowadays, but in the 1980’s it was a radically innovative thing to do.

He also pioneered collecting the symptoms and signs from every patient he saw, in a standard way using a multi-part printed proforma. And he invested many hours entering the raw data into a computer database.

He also did something that even now most clinicians do not do; when he knew the outcome for each patient he entered that into his database too – so that he could link first presentation with final diagnosis.


Mike knew that I had an interest in computer-aided diagnosis, which was a hot topic in the early 1980’s, and also that I did not warm to the Bayesian statistical models that underpinned it.  To me they made too many simplifying assumptions.

The human body is a complex adaptive system. It defies simplification.

Mike and I took a different approach.  We  just counted how many of each diagnostic group were associated with each pattern of presenting symptoms and signs.

The problem was that even his database of 8000+ patients was not big enough! This is why others had resorted to using statistical simplifications.

So we used the approach that an experienced diagnostician uses.  We used the information we had already gleaned from a patient to decide which question to ask next, and then the next one and so on.


And we always have three pieces of information at the start – the patient’s age, gender and presenting symptom.

What surprised and delighted us was how easy it was to use the database to help us do this for the new patients presenting to his clinic; the ones who were worried that they might have bowel cancer.

And what surprised us even more was how few questions we needed to ask arrive at a statistically robust decision to reassure-or-refer for further tests.

So one weekend, I wrote a little computer program that used the data from Mike’s database and our simple bean-counting algorithm to automate this process.  And the results were amazing.  Suddenly we had a simple and reliable way of using past experience to support our present decisions – without any statistical smoke-and-mirror simplifications getting in the way.

The computer program did not make the diagnosis, we were still responsible for that; all it did was provide us with reliable access to a clear and comprehensive digital memory of past experience.


What it then enabled us to do was to learn more quickly by exploring the complex patterns of symptoms, signs and outcomes and to develop our own diagnostic “rules of thumb”.

We learned in hours what it would take decades of experience to uncover. This was hot stuff, and when I presented our findings at the Royal Society of Medicine the audience was also surprised and delighted (and it was awarded the John of Arderne Medal).

So, we called it the Hot Learning System, and years later I updated it with Mike’s much bigger database (29,000+ records) and created a basic web-based version of the first step – age, gender and presenting symptom.  You can have a play if you like … just click HERE.


So what are the lessons here?

  1. We need to have the most experienced diagnosticians at the start of the improvement process.
  2. The first diagnostic assessment can be very quick so long as we have developed evidence-based heuristics.
  3. We can accelerate the training in diagnostic skills using simple information technology and basic analysis techniques.

And exactly the same is true in the health care system improvement.

We need to have an experienced health care improvement practitioner involved at the start, because if we skip this critical study step and move to plan without a correct diagnosis, then we will make errors, poor decisions, and counter-productive actions.  And then generate more work, more queues, more delays, more chaos, more distress and increased costs.

Exactly the opposite of what we want.

Q1: So, how do we develop experienced improvement practitioners more quickly?

Q2: Is there a hot learning system for improvement science?

A: Yes, there is. It can be found here.

The Marmite Effect

Have you heard the phrase “you either love it or you hate it“?  It is called the Marmite Effect.

Improvement science has Marmite-like effect on some people, or more specifically, the theory part does.

Both evidence and experience show that most people prefer to learn-by-doing first; and then consolidate their learning with the minimum, necessary amount of supporting theory.

But that is not how we usually share what we know with others.  We usually attempt to teach the theory first, perhaps in the belief that it will speed up the process of learning.

Sadly, it usually has the opposite effect. Too much theory too soon often creates a barrier to engagement. It actually slows learning down! Which was not the impact we were intending.


The implications of this is that teachers of the science of improvement need to provide a range of different ways to engage with the subject.  Complementary ways.  And leave the choice of which suits whom … to the learner.

And the way to tell if it is working is … the sound of laughter.

Why is that?


Laughing is a complex behaviour that leaves us feeling happier. Which is good.

Comedians make a living from being able to trigger this behaviour in their audiences, and we will gladly part with hard cash when we know something will make us feel better.

And laughing is one of the healthiest ways to feel better!

So why do we laugh when we are learning?

It is believed that one trigger for the laughter reaction is the sudden shift from one perspective to another.  More specifically, a mental shift that relieves a growing emotional tension.  The punch line of a really good joke for example.

And later-in-life learning is often more a process of unlearning.

When we challenge a learned assumption with evidence and if we disprove it … we are unlearning.  And doing that generates emotional tension. We are often very attached to our unconscious assumptions and will usually resist them being challenged.

The way to unlearn effectively is to use the evidence of our own eyes to raise doubts about our unconscious assumptions.  We need to actively generate a bit of confusion.

Then, we resolve the apparent paradox by creatively shifting perspective, often with a real example, a practical explanation or a hands-on demonstration.

And when we experience the “Ah ha! Now I see!” reaction, and we emerge from the fog of confusion, we will relieve the emotional tension and our involuntary reaction is to laugh.

But if our teacher unintentionally triggers a Marmite effect; a “Yeuk, I am NOT enjoying this!” feeling, then we need to respect that, and step back, and adopt a different tack.


Over the last few months I have been experimenting with different approaches to introducing the principles of improvement-by-design.

And the results are clear.

A minority prefer to start with the abstract theory, and then apply it in practice.

The majority have various degrees of Marmite reaction to the theory, and some are so put off that they actively disengage.  But when they have an opportunity to see the same principles demonstrated in a concrete, practical way; they learn and laugh.

Unlearning-by-doing seems to work better for the majority.

So, if you want to have fun and learn how to deliver significant and sustained improvements … then the evidence points to this as the starting point …

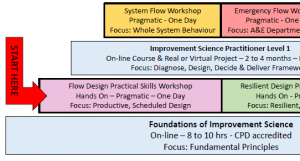
… the Flow Design Practical Skills One Day Workshop.

And if you also want to dip into a bit of the tried-and-tested theory that underpins improvement-by-design then you can do that as well, either before or later (when it becomes necessary), or both.


So, to have lots of fun and learn some valuable improvement-by-design practical skills at the same time …  click here.

The Power of Pictures

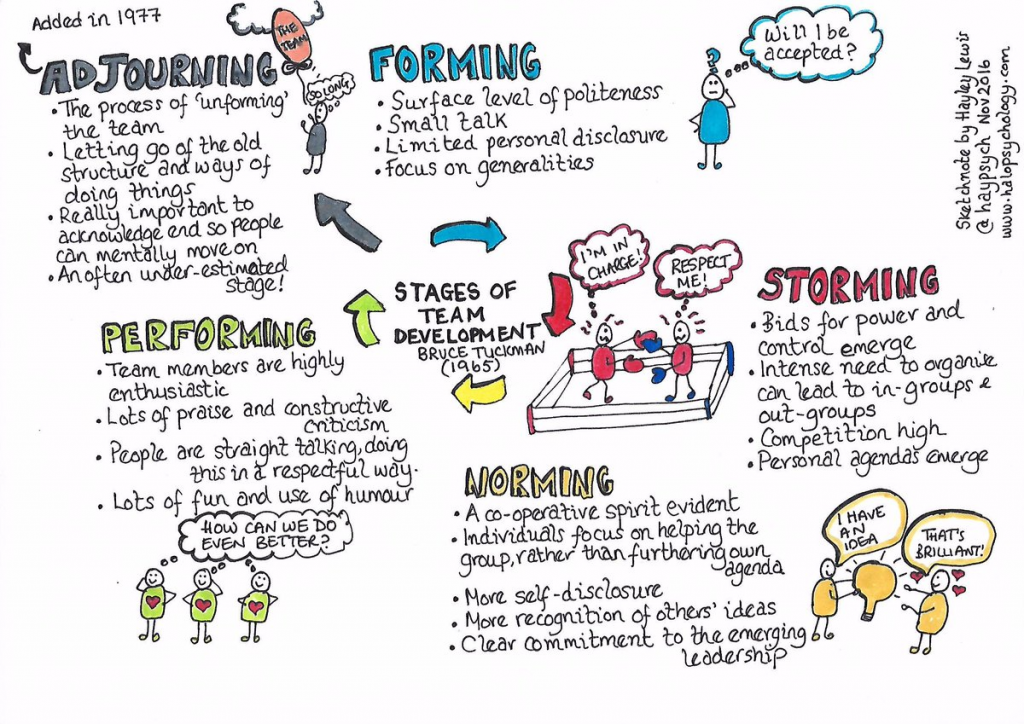
I am a big fan of pictures that tell a story … and this week I discovered someone who is creating great pictures … Hayley Lewis.

This is one of Hayley’s excellent sketch notes … the one that captures the essence of the Bruce Tuckman model of team development.

The reason that I share this particular sketch-note is because my experience of developing improvement-by-design teams is that it works just like this!

The tricky phase is the STORMING one because not all teams survive it!

About half sink in the storm – and that seems like an awful waste – and I believe it is avoidable.

This means that before starting the team development cycle, the leader needs to be aware of how to navigate themselves and the team through the storm phase … and that requires training, support and practice.

Which is the reason why coaching from a independent, experienced, capable practitioner is a critical element of the improvement process.

Pride and Joy

stick_figure_superhero_anim_150_wht_1857Have you heard the phrase “Pride comes before a fall“?

What does this mean? That the feeling of pride is the reason for the subsequent fall?

So by following that causal logic, if we do not allow ourselves to feel proud then we can avoid the fall?

And none of us like the feeling of falling and failing. We are fearful of that negative feeling, so with this simple trick we can avoid feeling bad. Yes?

But we all know the positive feeling of achievement – we feel pride when we have done good work, when our impact matches our intent.  Pride in our work.

Is that bad too?

Should we accept under-achievement and unexceptional mediocrity as the inevitable cost of avoiding the pain of possible failure?  Is that what we are being told to do here?


The phrase comes from the Bible, from the Book of Proverbs 16:18 to be precise.

proverb

And the problem here is that the phrase “pride comes before a fall” is not the whole proverb.

It has been simplified. Some bits have been omitted. And those omissions lead to ambiguity and the opportunity for obfuscation and re-interpretation.

pride_goes_before_a_fall
In the fuller New International Version we see a missing bit … the “haughty spirit” bit.  That is another way of saying “over-confident” or “arrogant”.


But even this “authorised” version is still ambiguous and more questions spring to mind:

Q1. What sort of pride are we referring to? Just the confidence version? What about the pride that follows achievement?

Q2. How would we know if our feeling of confidence is actually justified?

Q3. Does a feeling of confidence always precede a fall? Is that how we diagnose over-confidence? Retrospectively? Are there instances when we feel confident but we do not fail? Are there instances when we do not feel confident and then fail?

Q4. Does confidence cause the fall or it is just a temporal association? Is there something more fundamental that causes both high-confidence and low-competence?


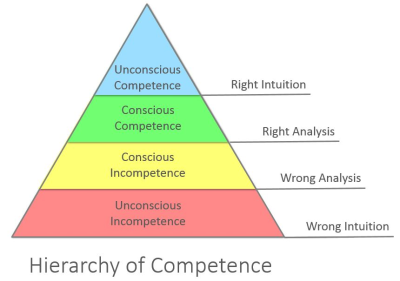
There is a well known model called the Conscious-Competence model of learning which generates a sequence of four stages to achieving a new skill. Such as one we need to achieve our intended outcomes.

We all start in the “blissful ignorance” zone of unconscious incompetence.  Our unknowns are unknown to us.  They are blind spots.  So we feel unjustifiably confident.

hierarchy_of_competence

In this model the first barrier to progress is “wrong intuition” which means that we actually have unconscious assumptions that are distorting our perception of reality.

What we perceive makes sense to us. It is clear and obvious. We feel confident. We believe our own rhetoric.

But our unconscious assumptions can trick us into interpreting information incorrectly.  And if we derive decisions from unverified assumptions and invalid analysis then we may do the wrong thing and not achieve our intended outcome.  We may unintentionally cause ourselves to fail and not be aware of it.  But we are proud and confident.

Then the gap between our intent and our impact becomes visible to all and painful to us. So we are tempted to avoid the social pain of public failure by retreating behind the “Yes, But” smokescreen of defensive reasoning. The “doom loop” as it is sometimes called. The Victim Vortex. “Don’t name, shame and blame me, I was doing my best. I did not intent that to happen. To err is human”.


The good news is that this learning model also signposts a possible way out; a door in the black curtain of ignorance.  It suggests that we can learn how to correct our analysis by using feedback from reality to verify our rhetorical assumptions.  Those assumptions which pass the “reality check” we keep, those which fail the “reality check” we redesign and retest until they pass.  Bit by bit our inner rhetoric comes to more closely match reality and the wisdom of our decisions will improve.

And what we then see is improvement.  Our impact moves closer towards our intent. And we can justifiably feel proud of that achievement. We do not need to be best-compared-with-the-rest; just being better-than-we-were-before is OK. That is learning.

the_learning_curve

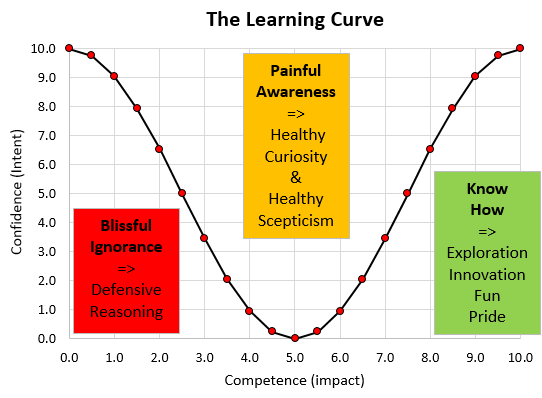
And this is how it feels … this is the Learning Curve … or the Nerve Curve as we call it.

What it says is that to be able to assess confidence we must also measure competence. Outcomes. Impact.

And to achieve excellence we have to be prepared to actively look for any gap between intent and impact.  And we have to be prepared to see it as an opportunity rather than as a threat. And we will need to be able to seek feedback and other people’s perspectives. And we need to be to open to asking for examples and explanations from those who have demonstrated competence.

It says that confidence is not a trustworthy surrogate for competence.

It says that we want the confidence that flows from competence because that is the foundation of trust.

Improvement flows at the speed of trust and seeing competence, confidence and trust growing is a joyous thing.

Pride and Joy are OK.

Arrogance and incompetence comes before a fall would be a better proverb.

Value, Verify and Validate

thinker_figure_unsolve_puzzle_150_wht_18309Many of the challenges that we face in delivering effective and affordable health care do not have well understood and generally accepted solutions.

If they did there would be no discussion or debate about what to do and the results would speak for themselves.

This lack of understanding is leading us to try to solve a complicated system design challenge in our heads.  Intuitively.

And trying to do it this way is fraught with frustration and risk because our intuition tricks us. It was this sort of challenge that led Professor Rubik to invent his famous 3D Magic Cube puzzle.

It is difficult enough to learn how to solve the Magic Cube puzzle by trial and error; it is even more difficult to attempt to do it inside our heads! Intuitively.


And we know the Rubik Cube puzzle is solvable, so all we need are some techniques, tools and training to improve our Rubik Cube solving capability.  We can all learn how to do it.


Returning to the challenge of safe and affordable health care, and to the specific problem of unscheduled care, A&E targets, delayed transfers of care (DTOC), finance, fragmentation and chronic frustration.

This is a systems engineering challenge so we need some systems engineering techniques, tools and training before attempting it.  Not after failing repeatedly.

se_vee_diagram

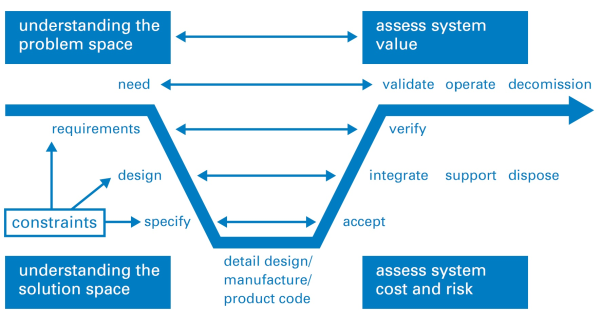
One technique that a systems engineer will use is called a Vee Diagram such as the one shown above.  It shows the sequence of steps in the generic problem solving process and it has the same sequence that we use in medicine for solving problems that patients present to us …

Diagnose, Design and Deliver

which is also known as …

Study, Plan, Do.


Notice that there are three words in the diagram that start with the letter V … value, verify and validate.  These are probably the three most important words in the vocabulary of a systems engineer.


One tool that a systems engineer always uses is a model of the system under consideration.

Models come in many forms from conceptual to physical and are used in two main ways:

  1. To assist the understanding of the past (diagnosis)
  2. To predict the behaviour in the future (prognosis)

And the process of creating a system model, the sequence of steps, is shown in the Vee Diagram.  The systems engineer’s objective is a validated model that can be trusted to make good-enough predictions; ones that support making wiser decisions of which design options to implement, and which not to.


So if a systems engineer presented us with a conceptual model that is intended to assist our understanding, then we will require some evidence that all stages of the Vee Diagram process have been completed.  Evidence that provides assurance that the model predictions can be trusted.  And the scope over which they can be trusted.


Last month a report was published by the Nuffield Trust that is entitled “Understanding patient flow in hospitals”  and it asserts that traffic flow on a motorway is a valid conceptual model of patient flow through a hospital.  Here is a direct quote from the second paragraph in the Executive Summary:

nuffield_report_01
Unfortunately, no evidence is provided in the report to support the validity of the statement and that omission should ring an alarm bell.

The observation that “the hospitals with the least free space struggle the most” is not a validation of the conceptual model.  Validation requires a concrete experiment.


To illustrate why observation is not validation let us consider a scenario where I have a headache and I take a paracetamol and my headache goes away.  I now have some evidence that shows a temporal association between what I did (take paracetamol) and what I got (a reduction in head pain).

But this is not a valid experiment because I have not considered the other seven possible combinations of headache before (Y/N), paracetamol (Y/N) and headache after (Y/N).

An association cannot be used to prove causation; not even a temporal association.

When I do not understand the cause, and I am without evidence from a well-designed experiment, then I might be tempted to intuitively jump to the (invalid) conclusion that “headaches are caused by lack of paracetamol!” and if untested this invalid judgement may persist and even become a belief.


Understanding causality requires an approach called counterfactual analysis; otherwise known as “What if?” And we can start that process with a thought experiment using our rhetorical model.  But we must remember that we must always validate the outcome with a real experiment. That is how good science works.

A famous thought experiment was conducted by Albert Einstein when he asked the question “If I were sitting on a light beam and moving at the speed of light what would I see?” This question led him to the Theory of Relativity which completely changed the way we now think about space and time.  Einstein’s model has been repeatedly validated by careful experiment, and has allowed engineers to design and deliver valuable tools such as the Global Positioning System which uses relativity theory to achieve high positional precision and accuracy.


So let us conduct a thought experiment to explore the ‘faster movement requires more space‘ statement in the case of patient flow in a hospital.

First, we need to define what we mean by the words we are using.

The phrase ‘faster movement’ is ambiguous.  Does it mean higher flow (more patients per day being admitted and discharged) or does it mean shorter length of stage (the interval between the admission and discharge events for individual patients)?

The phrase ‘more space’ is also ambiguous. In a hospital that implies physical space i.e. floor-space that may be occupied by corridors, chairs, cubicles, trolleys, and beds.  So are we actually referring to flow-space or storage-space?

What we have in this over-simplified statement is the conflation of two concepts: flow-capacity and space-capacity. They are different things. They have different units. And the result of conflating them is meaningless and confusing.


However, our stated goal is to improve understanding so let us consider one combination, and let us be careful to be more precise with our terminology, “higher flow always requires more beds“. Does it? Can we disprove this assertion with an example where higher flow required less beds (i.e. space-capacity)?

The relationship between flow and space-capacity is well understood.

The starting point is Little’s Law which was proven mathematically in 1961 by J.D.C. Little and it states:

Average work in progress = Average lead time  X  Average flow.

In the hospital context, work in progress is the number of occupied beds, lead time is the length of stay and flow is admissions or discharges per time interval (which must be the same on average over a long period of time).

(NB. Engineers are rather pedantic about units so let us check that this makes sense: the unit of WIP is ‘patients’, the unit of lead time is ‘days’, and the unit of flow is ‘patients per day’ so ‘patients’ = ‘days’ * ‘patients / day’. Correct. Verified. Tick.)

So, is there a situation where flow can increase and WIP can decrease? Yes. When lead time decreases. Little’s Law says that is possible. We have disproved the assertion.


Let us take the other interpretation of higher flow as shorter length of stay: i.e. shorter length of stay always requires more beds.  Is this correct? No. If flow remains the same then Little’s Law states that we will require fewer beds. This assertion is disproved as well.

And we need to remember that Little’s Law is proven to be valid for averages, does that shed any light on the source of our confusion? Could the assertion about flow and beds actually be about the variation in flow over time and not about the average flow?


And this is also well understood. The original work on it was done almost exactly 100 years ago by Agner Krarup Erlang and the problem he looked at was the quality of customer service of the early telephone exchanges. Specifically, how likely was the caller to get the “all lines are busy, please try later” response.

What Erlang showed was there there is a mathematical relationship between the number of calls being made (the demand), the probability of a call being connected first time (the service quality) and the number of telephone circuits and switchboard operators available (the service cost).


So it appears that we already have a validated mathematical model that links flow, quality and cost that we might use if we substitute ‘patients’ for ‘calls’, ‘beds’ for ‘telephone circuits’, and ‘being connected’ for ‘being admitted’.

And this topic of patient flow, A&E performance and Erlang queues has been explored already … here.

So a telephone exchange is a more valid model of a hospital than a motorway.

We are now making progress in deepening our understanding.


The use of an invalid, untested, conceptual model is sloppy systems engineering.

So if the engineering is sloppy we would be unwise to fully trust the conclusions.

And I share this feedback in the spirit of black box thinking because I believe that there are some valuable lessons to be learned here – by us all.


To vote for this topic please click here.
To subscribe to the blog newsletter please click here.
To email the author please click here.

Courage and Constancy of Purpose

bull_by_the_horns_anim_150_wht_9609This week I witnessed an act of courage by someone prepared to take the health care bull by the horns.

On 25th October 2016 a landmark review was published about the integrated health and social care system in Northern Ireland.

It is not a comfortable read.

And the act of courage was the simultaneous publication of the document “Health and Well-being 2026” by Michelle O’Neill, the new Minister of Health.

The full document can be downloaded here.


It is courageous because it says, bluntly, that there is a burning platform, the level of service is not acceptable, doing nothing is not an option, and nothing short of a system-wide redesign will be required.

It is courageous because it sets a clear vision, a burning ambition, and is very clear that this will not be a quick fix. It is a ten year plan.

That implies a constancy of purpose will need to be maintained for at least a decade.

science_of_improvement

And it is courageous because it says that:

we will have to learn how to do this

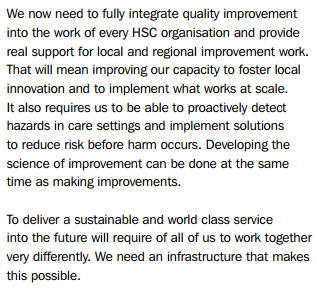
Here is one paragraph that says that:

Developing the science of improvement can be done at the same time as making improvements

and

We need an infrastructure that makes this possible.”


The good news is that this science of improvement in health care is already well advanced, and it will advance further: a whole health and social care system transformation-by-design is a challenge of some magnitude.

A health and social care system engineering (HSCSE) challenge.


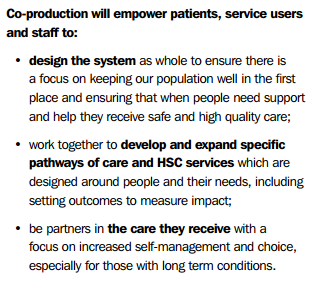
One component of the ten year plan is to develop this capability through a process called co-production.

co-productionNotice that the focus is on pro-actively preventing illness, not just re-actively managing it.

Notice that the design is centered on both the customer and the supplier, not just on the supplier.

And notice that the population served are also expected to be equal partners in the transformation-by-design process.


Courage, constancy of purpose and capability development  … a very welcome breath of fresh air!


For more posts like this please vote here.
For more information please subscribe here.

The Cream of the Crap Trap

database_transferring_data_150_wht_10400It has been a busy week.

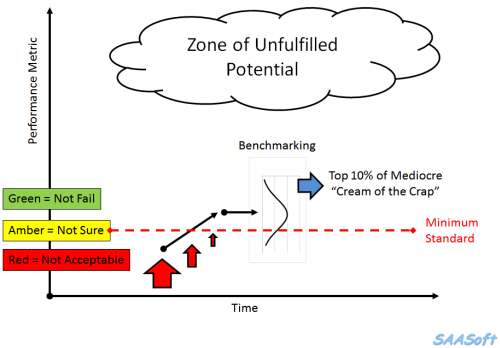
And a common theme has cropped up which I have attempted to capture in the diagram below.

It relates to how the NHS measures itself and how it “drives” improvement.

The measures are called “failure metrics” – mortality, infections, pressure sores, waiting time breaches, falls, complaints, budget overspends.  The list is long.

The data for a specific trust are compared with an arbitrary minimum acceptable standard to decide where the organisation is on the Red-Amber-Green scale.

If we are in the red zone on the RAG chart … we get a kick.  If not we don’t.

The fear of being bullied and beaten raises the emotional temperature and the internal pressure … which drives movement to get away from the pain.  A nematode worm will behave this way. They are not stupid either.

As as we approach the target line our RAG indicator turns “amber” … this is the “not statistically significant zone” … and now the stick is being waggled, ready in case the light goes red again.

So we muster our reserves of emotional energy and we PUSH until our RAG chart light goes green … but then we have to hold it there … which is exhausting.  One pain is replaced by another.

The next step is for the population of NHS nematodes to be compared with each other … they must be “bench-marked”, and some are doing better than others … as we might expect. We have done our “sadistics” training courses.

The bottom 5% or 10% line is used to set the “arbitrary minimum standard target” … and the top 10% are feted at national award ceremonies … and feast on the envy of the other 90 or 95% of “losers”.

The Cream of the Crop now have a big tick in their mission statement objectives box “To be in the Top 10% of Trusts in the UK“.  Hip hip huzzah.

And what has this system design actually achieved? The Cream of the Crap.

Oops!


It is said that every system is perfectly designed to deliver what it delivers.

And a system that has been designed to only use failure and fear to push improvement can only ever achieve chronic mediocrity – either chaotic mediocrity or complacent mediocrity.

So, if we want to tap into the vast zone of unfulfilled potential, and if we want to escape the perpetual pain of the Cream of the Crap Trap … we need a better system design.

And maybe we might need a splash of humility and some system engineers to help us do that.

This week I met some at the Royal Academy of Engineering in London, and it felt like finding a candle of hope amidst the darkness of despair.

I said it had been a busy week!

The Capstan

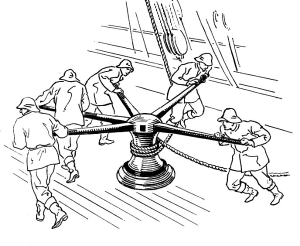
CapstanA capstan is a simple machine for combining the effort of many people and enabling them to achieve more than any of them could do alone.

The word appears to have come into English from the Portuguese and Spanish sailors at around the time of the Crusades.

Each sailor works independently of the others. There is no requirement them to be equally strong because the capstan will combine their efforts.  And the capstan also serves as a feedback loop because everyone can sense when someone else pushes harder or slackens off.  It is an example of simple, efficient, effective, elegant design.


In the world of improvement we also need simple, efficient, effective and elegant ways to combine the efforts of many in achieving a common purpose.  Such as raising the standards of excellence and weighing the anchors of resistance.

In health care improvement we have many simultaneous constraints and we have many stakeholders with specific perspectives and special expertise.

And if we are not careful they will tend to pull only in their preferred direction … like a multi-way tug-o-war.  The result?  No progress and exhausted protagonists.

There are those focused on improving productivity – Team Finance.

There are those focused on improving delivery – Team Operations.

There are those focused on improving safety – Team Governance.

And we are all tasked with improving quality – Team Everyone.

So we need a synergy machine that works like a capstan-of-old, and here is one design.

Engine_Of_ExcellenceIt has four poles and it always turns in a clockwise direction, so the direction of push is clear.

And when all the protagonists push in the same direction, they will get their own ‘win’ and also assist the others to make progress.

This is how the sails of success are hoisted to catch the wind of change; and how the anchors of anxiety are heaved free of the rocks of fear; and how the bureaucratic bilge is pumped overboard to lighten our load and improve our speed and agility.

And the more hands on the capstan the quicker we will achieve our common goal.

Collective excellence.

Culture – cause or effect?

The Harvard Business Review is worth reading because many of its articles challenge deeply held assumptions, and then back up the challenge with the pragmatic experience of those who have succeeded to overcome the limiting beliefs.

So the heading on the April 2016 copy that awaited me on my return from an Easter break caught my eye: YOU CAN’T FIX CULTURE.


HBR_April_2016

The successful leaders of major corporate transformations are agreed … the cultural change follows the technical change … and then the emergent culture sustains the improvement.

The examples presented include the Ford Motor Company, Delta Airlines, Novartis – so these are not corporate small fry!

The evidence suggests that the belief of “we cannot improve until the culture changes” is the mantra of failure of both leadership and management.


A health care system is characterised by a culture of risk avoidance. And for good reason. It is all too easy to harm while trying to heal!  Primum non nocere is a core tenet – first do no harm.

But, change and improvement implies taking risks – and those leaders of successful transformation know that the bigger risk by far is to become paralysed by fear and to do nothing.  Continual learning from many small successes and many small failures is preferable to crisis learning after a catastrophic failure!

The UK healthcare system is in a state of chronic chaos.  The evidence is there for anyone willing to look.  And waiting for the NHS culture to change, or pushing for culture change first appears to be a guaranteed recipe for further failure.

The HBR article suggests that it is better to stay focussed; to work within our circles of control and influence; to learn from others where knowledge is known, and where it is not – to use small, controlled experiments to explore new ground.


And I know this works because I have done it and I have seen it work.  Just by focussing on what is important to every member on the team; focussing on fixing what we could fix; not expecting or waiting for outside help; gathering and sharing the feedback from patients on a continuous basis; and maintaining patient and team safety while learning and experimenting … we have created a micro-culture of high safety, high efficiency, high trust and high productivity.  And we have shared the evidence via JOIS.

The micro-culture required to maintain the safety, flow, quality and productivity improvements emerged and evolved along with the improvements.

It was part of the effect, not the cause.


So the concept of ‘fix the system design flaws and the continual improvement culture will emerge’ seems to work at macro-system and at micro-system levels.

We just need to learn how to diagnose and treat healthcare system design flaws. And that is known knowledge.
So what is the next excuse?  Too busy?

Type II Error

figure_pointing_out_chart_data_150_clr_8005It was the time for Bob and Leslie’s regular Improvement Science coaching session.

<Leslie> Hi Bob, how are you today?

<Bob> I am getting over a winter cold but otherwise I am good.  And you?

<Leslie> I am OK and I need to talk something through with you because I suspect you will be able to help.

<Bob> OK. What is the context?

<Leslie> Well, one of the projects that I am involved with is looking at the elderly unplanned admission stream which accounts for less than half of our unplanned admissions but more than half of our bed days.

<Bob> OK. So what were you looking to improve?

<Leslie> We want to reduce the average length of stay so that we free up beds to provide resilient space-capacity to ease the 4-hour A&E admission delay niggle.
<Bob> That sounds like a very reasonable strategy.  So have you made any changes and measured any improvements?
<Leslie> We worked through the 6M Design® sequence. We studied the current system, diagnosed some time traps and bottlenecks, redesigned the ones we could influence, modified the system, and continued to measure to monitor the effect.

<Bob> And?

<Leslie> It feels better but the system behaviour charts do not show an improvement.

<Bob> Which charts, specifically?

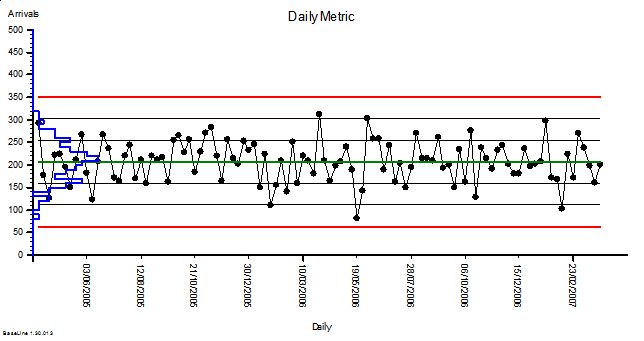
<Leslie> The BaseLine XmR charts of average length of stay for each week of activity.

<Bob> And you locked the limits when you made the changes?

<Leslie> Yes. And there still were no red flags. So that means our changes have not had a significant effect. But it definitely feels better. Am I deluding myself?

<Bob> I do not believe so. Your subjective assessment is very likely to be accurate. Our Chimp OS 1.0 is very good at some things! I think the issue is with the tool you are using to measure the change.

<Leslie> The XmR chart?  But I thought that was THE tool to use?

<Bob> Like all tools it is designed for a specific purpose.  Are you familiar with the term Type II Error.

<Leslie> Doesn’t that come from research? I seem to remember that is the error we make when we have an under-powered study.  When our sample size is too small to confidently detect the change in the mean that we are looking for.

<Bob> A perfect definition!  The same error can happen when we are doing before and after studies too.  And when it does, we see the pattern you have just described: the process feels better but we do not see any red flags on our BaseLine© chart.

<Leslie> But if our changes only have a small effect how can it feel better?

<Bob> Because some changes have cumulative effects and we omit to measure them.

<Leslie> OMG!  That makes complete sense!  For example, if my bank balance is stable my average income and average expenses are balanced over time. So if I make a small-but-sustained improvement to my expenses, like using lower cost generic label products, then I will see a cumulative benefit over time to the balance, but not the monthly expenses; because the noise swamps the signal on that chart!

<Bob> An excellent analogy!

<Leslie> So the XmR chart is not the tool for this job. And if this is the only tool we have then we risk making a Type II error. Is that correct?

<Bob> Yes. We do still use an XmR chart first though, because if there is a big enough and fast enough shift then the XmR chart will reveal it.  If there is not then we do not give up just yet; we reach for our more sensitive shift detector tool.

<Leslie> Which is?

<Bob> I will leave you to ponder on that question.  You are a trained designer now so it is time to put your designer hat on and first consider the purpose of this new tool, and then create the outline a fit-for-purpose design.

<Leslie> OK, I am on the case!

The Cost of Chaos

british_pound_money_three_bundled_stack_400_wht_2425This week I conducted an experiment – on myself.

I set myself the challenge of measuring the cost of chaos, and it was tougher than I anticipated it would be.

It is easy enough to grasp the concept that fire-fighting to maintain patient safety amidst the chaos of healthcare would cost more in terms of tears and time …

… but it is tricky to translate that concept into hard numbers; i.e. cash.


Chaos is an emergent property of a system.  Safety, delivery, quality and cost are also emergent properties of a system. We can measure cost, our finance departments are very good at that. We can measure quality – we just ask “How did your experience match your expectation”.  We can measure delivery – we have created a whole industry of access target monitoring.  And we can measure safety by checking for things we do not want – near misses and never events.

But while we can feel the chaos we do not have an easy way to measure it. And it is hard to improve something that we cannot measure.


So the experiment was to see if I could create some chaos, then if I could calm it, and then if I could measure the cost of the two designs – the chaotic one and the calm one.  The difference, I reasoned, would be the cost of the chaos.

And to do that I needed a typical chunk of a healthcare system: like an A&E department where the relationship between safety, flow, quality and productivity is rather important (and has been a hot topic for a long time).

But I could not experiment on a real A&E department … so I experimented on a simplified but realistic model of one. A simulation.

What I discovered came as a BIG surprise, or more accurately a sequence of big surprises!

  1. First I discovered that it is rather easy to create a design that generates chaos and danger.  All I needed to do was to assume I understood how the system worked and then use some averaged historical data to configure my model.  I could do this on paper or I could use a spreadsheet to do the sums for me.
  2. Then I discovered that I could calm the chaos by reactively adding lots of extra capacity in terms of time (i.e. more staff) and space (i.e. more cubicles).  The downside of this approach was that my costs sky-rocketed; but at least I had restored safety and calm and I had eliminated the fire-fighting.  Everyone was happy … except the people expected to foot the bill. The finance director, the commissioners, the government and the tax-payer.
  3. Then I got a really big surprise!  My safe-but-expensive design was horribly inefficient.  All my expensive resources were now running at rather low utilisation.  Was that the cost of the chaos I was seeing? But when I trimmed the capacity and costs the chaos and danger reappeared.  So was I stuck between a rock and a hard place?
  4. Then I got a really, really big surprise!!  I hypothesised that the root cause might be the fact that the parts of my system were designed to work independently, and I was curious to see what happened when they worked interdependently. In synergy. And when I changed my design to work that way the chaos and danger did not reappear and the efficiency improved. A lot.
  5. And the biggest surprise of all was how difficult this was to do in my head; and how easy it was to do when I used the theory, techniques and tools of Improvement-by-Design.

So if you are curious to learn more … I have written up the full account of the experiment with rationale, methods, results, conclusions and references and I have published it here.

New Meat for Old Bones

FreshMeatOldBonesEvolution is an amazing process.

Using the same building blocks that have been around for a lot time, it cooks up innovative permutations and combinations that reveal new and ever more useful properties.

Very often a breakthrough in understanding comes from a simplification, not from making it more complicated.

Knowledge evolves in just the same way.

Sometimes a well understood simplification in one branch of science is used to solve an ‘impossible’ problem in another.

Cross-fertilisation of learning is a healthy part of the evolution process.


Improvement implies evolution of knowledge and understanding, and then application of that insight in the process of designing innovative ways of doing things better.


And so it is in healthcare.  For many years the emphasis on healthcare improvement has been the Safety-and-Quality dimension, and for very good reasons.  We need to avoid harm and we want to achieve happiness; for everyone.

But many of the issues that plague healthcare systems are not primarily SQ issues … they are flow and productivity issues. FP. The safety and quality problems are secondary – so only focussing on them is treating the symptoms and not the cause.  We need to balance the wheel … we need flow science.


Fortunately the science of flow is well understood … outside healthcare … but apparently not so well understood inside healthcare … given the queues, delays and chaos that seem to have become the expected norm.  So there is a big opportunity for cross fertilisation here.  If we choose to make it happen.


For example, from computer science we can borrow the knowledge of how to schedule tasks to make best use of our finite resources and at the same time avoid excessive waiting.

It is a very well understood science. There is comprehensive theory, a host of techniques, and fit-for-purpose tools that we can pick of the shelf and use. Today if we choose to.

So what are the reasons we do not?

Is it because healthcare is quite introspective?

Is it because we believe that there is something ‘special’ about healthcare?

Is it because there is no evidence … no hard proof … no controlled trials?

Is it because we assume that queues are always caused by lack of resources?

Is it because we do not like change?

Is it because we do not like to admit that we do not know stuff?

Is it because we fear loss of face?


Whatever the reasons the evidence and experience shows that most (if not all) the queues, delays and chaos in healthcare systems are iatrogenic.

This means that they are self-generated. And that implies we can un-self-generate them … at little or no cost … if only we knew how.

The only cost is to our egos of having to accept that there is knowledge out there that we could use to move us in the direction of excellence.

New meat for our old bones?

Emergent Learning

CAS_DiagramThe theme this week has been emergent learning.

By that I mean the ‘ah ha’ moment that happens when lots of bits of a conceptual jigsaw go ‘click’ and fall into place.

When, what initially appears to be smoky confusion suddenly snaps into sharp clarity.  Eureka!  And now new learning can emerge.


This did not happen by accident.  It was engineered.


The picture above is part of a bigger schematic map of a system – in this case a system related to the global health challenge of escalating obesity.

It is a complicated arrangement of boxes and arrows. There are  dotted lines that outline parts of the system that have leaky boundaries like the borders on a political map.

But it is a static picture of the structure … it tells us almost nothing about the function, the system behaviour.

And our intuition tells us that, because it is a complicated structure, it will exhibit complex and difficult to understand behaviour.  So, guided by our inner voice, we toss it into the pile labelled Wicked Problems and look for something easier to work on.


Our natural assumption that a complicated structure always leads to complex behavior is an invalid simplification, and one that we can disprove in a matter of moments.


Exhibit 1. A system can be complicated and yet still exhibit simple, stable and predictable behavior.

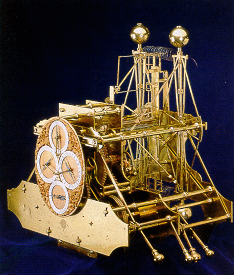
Harrison_H1The picture is of a clock designed and built by John Harrison (1693-1776).  It is called H1 and it is a sea clock.

Masters of sailing ships required very accurate clocks to calculate their longitude, the East-West coordinate on the Earth’s surface. And in the 18th Century this was a BIG problem. Too many ships were getting lost at sea.

Harrison’s sea clock is complicated.  It has many moving parts, but it was the most stable and accurate clock of its time.  And his later ones were smaller, more accurate and even more complicated.


Exhibit 2.  A system can be simple yet still exhibit complex, unstable and unpredictable behavior.

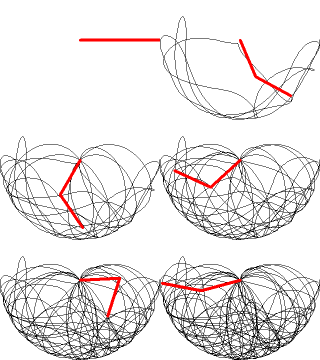
Double-compound-pendulumThe image is of a pendulum made of only two rods joined by a hinge.  The structure is simple yet the behavior is complex, and this can only be appreciated with a dynamic visualisation.

The behaviour is clearly not random. It has an emergent structure. It is called chaotic.

So, with these two real examples we have disproved our assumption that a complicated structure always leads to complex behaviour; and we have also disproved its inverse … that complex behavior always comes from a complicated structure.

The cognitive trap we have exposed here is over-generalisation, the unconscious habit of slipping in the implied [always].


This deeper understanding gives us hope.

John Harrison was a rare, naturally-gifted, mechanical genius.  And to make it easier, he was working on a purely mechanical system comprised of non-living parts that only obeyed the Laws of Newtonian physics.  And even with those advantages it took him decades to learn how to design and to build his sea clocks.  He was the first to do so and he was self-educated so his learning was emergent.

If there were a way to design complicated systems to exhibit stable and predictable behaviour, how could more of us learn how to do that?


Our healthcare system is not made of passive, mechanical cogs and springs.  The parts are active, living people whose actions are limited by physical Laws but whose decisions are steered by other policies … learned ones … and ones that can change.  These learned rules of thumb are called heuristics and they vary from person-to-person and from minute-to-minute.  Heuristics can be learned, unlearned, updated, and evolved.

This is called emergent learning.

And to generate it we only need to create the context for it … the rest happens … as if by magic … but only if we design a fit-for-purpose context.


This week I personally observed over a dozen healthcare staff simultaneously re-invent a complicated process scheduling technique, at the same time as using it to eliminate the  queues, waiting and chaos in the system they wanted to improve.

Their queues just evaporated … without requiring any extra capacity or money. Eureka!


We did not show them how to do it so they could not have just copied what we did.

We designed and built the context for their learning to emerge … and it did.  On its own.

The One Day Practical Skills Workshop delivered emergent learning … just as it was designed to do.

A health care system is a complex adaptive system (CAS), and system improvement-by-design is what systems engineers (SE) are trained to do.

And this emerging style of complex adaptive systems engineering (CASE) is at the cutting edge of human knowledge, and when applied in the health care domain it is called health care systems engineering (HCSE).

Our experience of the emergent learning that flows from the practical skills workshops verifies that CASE is both possible, learnable, teachable, applicable and effective.

The Two-Points-In-Time Comparison Trap

comparing_information_anim_5545[Bzzzzzz] Bob’s phone vibrated to remind him it was time for the regular ISP remote coaching session with Leslie. He flipped the lid of his laptop just as Leslie joined the virtual meeting.

<Leslie> Hi Bob, and Happy New Year!

<Bob> Hello Leslie and I wish you well in 2016 too.  So, what shall we talk about today?

<Leslie> Well, given the time of year I suppose it should be the Winter Crisis.  The regularly repeating annual winter crisis. The one that feels more like the perpetual winter crisis.

<Bob> OK. What specifically would you like to explore?

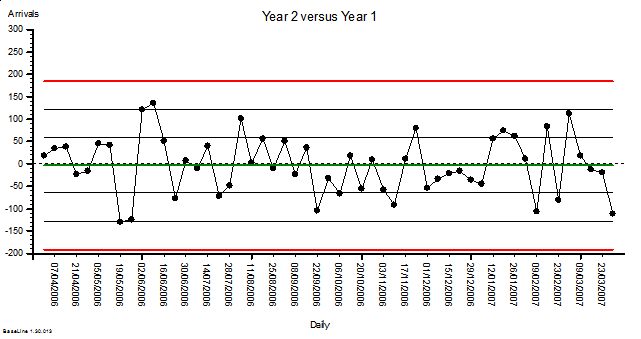
<Leslie> Specifically? The habit of comparing of this year with last year to answer the burning question “Are we doing better, the same or worse?”  Especially given the enormous effort and political attention that has been focused on the hot potato of A&E 4-hour performance.

<Bob> Aaaaah! That old chestnut! Two-Points-In-Time comparison.

<Leslie> Yes. I seem to recall you usually add the word ‘meaningless’ to that phrase.

<Bob> H’mm.  Yes.  It can certainly become that, but there is a perfectly good reason why we do this.

<Leslie> Indeed, it is because we see seasonal cycles in the data so we only want to compare the same parts of the seasonal cycle with each other. The apples and oranges thing.

<Bob> Yes, that is part of it. So what do you feel is the problem?

<Leslie> It feels like a lottery!  It feels like whether we appear to be better or worse is just the outcome of a random toss.

<Bob> Ah!  So we are back to the question “Is the variation I am looking at signal or noise?” 

<Leslie> Yes, exactly.

<Bob> And we need a scientifically robust way to answer it. One that we can all trust.

<Leslie> Yes.

<Bob> So how do you decide that now in your improvement work?  How do you do it when you have data that does not show a seasonal cycle?

<Leslie> I plot-the-dots and use an XmR chart to alert me to the presence of the signals I am interested in – especially a change of the mean.

<Bob> Good.  So why can we not use that approach here?

<Leslie> Because the seasonal cycle is usually a big signal and it can swamp the smaller change I am looking for.

<Bob> Exactly so. Which is why we have to abandon the XmR chart and fall back the two points in time comparison?

<Leslie> That is what I see. That is the argument I am presented with and I have no answer.

<Bob> OK. It is important to appreciate that the XmR chart was not designed for doing this.  It was designed for monitoring the output quality of a stable and capable process. It was designed to look for early warning signs; small but significant signals that suggest future problems. The purpose is to alert us so that we can identify the root causes, correct them and the avoid a future problem.

<Leslie> So we are using the wrong tool for the job. I sort of knew that. But surely there must be a better way than a two-points-in-time comparison!

<Bob> There is, but first we need to understand why a TPIT is a poor design.

<Leslie> Excellent. I’m all ears.

<Bob> A two point comparison is looking at the difference between two values, and that difference can be positive, zero or negative.  In fact, it is very unlikely to be zero because noise is always present.

<Leslie> OK.

<Bob> Now, both of the values we are comparing are single samples from two bigger pools of data.  It is the difference between the pools that we are interested in but we only have single samples of each one … so they are not measurements … they are estimates.

<Leslie> So, when we do a TPIT comparison we are looking at the difference between two samples that come from two pools that have inherent variation and may or may not actually be different.

<Bob> Well put.  We give that inherent variation a name … we call it variance … and we can quantify it.

<Leslie> So if we do many TPIT comparisons then they will show variation as well … for two reasons; first because the pools we are sampling have inherent variation; and second just from the process of sampling itself.  It was the first lesson in the ISP-1 course.

<Bob> Well done!  So the question is: “How does the variance of the TPIT sample compare with the variance of the pools that the samples are taken from?”

<Leslie> My intuition tells me that it will be less because we are subtracting.

<Bob> Your intuition is half-right.  The effect of the variation caused by the signal will be less … that is the rationale for the TPIT after all … but the same does not hold for the noise.

<Leslie> So the noise variation in the TPIT is the same?

<Bob> No. It is increased.

<Leslie> What! But that would imply that when we do this we are less likely to be able to detect a change because a small shift in signal will be swamped by the increase in the noise!

<Bob> Precisely.  And the degree that the variance increases by is mathematically predictable … it is increased by a factor of two.

<Leslie> So as we usually present variation as the square root of the variance, to get it into the same units as the metric, then that will be increased by the square root of two … 1.414

<Bob> Yes.

<Leslie> I need to put this counter-intuitive theory to the test!

<Bob> Excellent. Accept nothing on faith. Always test assumptions. And how will you do that?

<Leslie> I will use Excel to generate a big series of normally distributed random numbers; then I will calculate a series of TPIT differences using a fixed time interval; then I will calculate the means and variations of the two sets of data; and then I will compare them.

<Bob> Excellent.  Let us reconvene in ten minutes when you have done that.


10 minutes later …


<Leslie> Hi Bob, OK I am ready and I would like to present the results as charts. Is that OK?

<Bob> Perfect!

<Leslie> Here is the first one.  I used our A&E performance data to give me some context. We know that on Mondays we have an average of 210 arrivals with an approximately normal distribution and a standard deviation of 44; so I used these values to generate the random numbers. Here is the simulated Monday Arrivals chart for two years.

TPIT_SourceData

<Bob> OK. It looks stable as we would expect and I see that you have plotted the sigma levels which look to be just under 50 wide.

<Leslie> Yes, it shows that my simulation is working. So next is the chart of the comparison of arrivals for each Monday in Year 2 compared with the corresponding week in Year 1.

TPIT_DifferenceData <Bob> Oooookaaaaay. What have we here?  Another stable chart with a mean of about zero. That is what we would expect given that there has not been a change in the average from Year 1 to Year 2. And the variation has increased … sigma looks to be just over 60.

<Leslie> Yes!  Just as the theory predicted.  And this is not a spurious answer. I ran the simulation dozens of times and the effect is consistent!  So, I am forced by reality to accept the conclusion that when we do two-point-in-time comparisons to eliminate a cyclical signal we will reduce the sensitivity of our test and make it harder to detect other signals.

<Bob> Good work Leslie!  Now that you have demonstrated this to yourself using a carefully designed and conducted simulation experiment, you will be better able to explain it to others.

<Leslie> So how do we avoid this problem?

<Bob> An excellent question and one that I will ask you to ponder on until our next chat.  You know the answer to this … you just need to bring it to conscious awareness.


And?

take_a_walk_text_10710One of the barriers to improvement is jumping to judgment too quickly.

Improvement implies innovation and action …

doing something different …

and getting a better outcome.

Before an action is a decision.  Before a decision is a judgment.

And we make most judgments quickly, intuitively and unconsciously.  Our judgments are a reflection of our individual, inner view of the world. Our mental model.

So when we judge intuitively and quickly then we will actually just reinforce our current worldview … and in so doing we create a very effective barrier to learning and improvement.

We guarantee the status quo.


So how do we get around this barrier?

In essence we must train ourselves to become more consciously aware of the judgment step in our thinking process.  And one way to flush it up to the surface is to ask the deceptively powerful question … And?

When someone is thinking through a problem then an effective contribution that we can offer is to listen, reflect, summarize, clarify and to encourage by asking “And?”

This process has a name.  It is called a coaching conversation.

And anyone can learn to how do it. Anyone.

Survival of the Fittest

business_race__PA_150_wht_3222There is a widely held belief that competition is the only way to achieve improvement.

This is a limiting belief.

But our experience tells us that competition is an essential part of improvement!

So which is correct?


When two athletes compete they both have to train hard to improve their individual performance. The winner of the race is the one who improves the most.  So by competing with each other they are forced to improve.

The goal of improvement is excellence and the test-of-excellence is performed in the present and is done by competing with others. The most excellent is labelled the “best” or “winner”. Everyone else is branded “second best” or “loser”.

This is where we start to see the limiting belief of competition.

It has a crippling effect.  Many competitive people will not even attempt the race if they do not feel they can win.  Their limiting belief makes them too fearful. They fear loss of self-esteem. Their ego is too fragile. They value hubris more than humility. And by not taking part they abdicate any opportunity to improve. They remain arrogantly mediocre and blissfully ignorant of it. They are the real losers.


So how can we keep the positive effect of competition and at the same time escape the limiting belief?

There are two ways:

First we drop the assumption that the only valid test of excellence is a comparison of us with others in the present.  And instead we adopt the assumption that it is equally valid to compare us with ourselves in the past.

We can all improve compared with what we used to be. We can all be winners of that race.

And as improvement happens our perspective shifts.  What becomes normal in the present would have been assumed to be impossible in the past.


This week I sat at my desk in a state of wonder.

I held in my hand a small plastic widget about the size of the end of my thumb.  It was a new USB data stick that had just arrived, courtesy of Amazon, and on one side in small white letters it proudly announced that it could hold 64 Gigabytes of data (that is 64 x 1024 x 1024 x 1024). And it cost less than a take-away curry.

About 30 years ago, when I first started to learn how to design, build and program computer system, a memory chip that was about the same size and same cost could hold 4 kilobytes (4 x 1024).  

So in just 30 years we have seen a 16-million-fold increase in data storage capacity. That is astounding! Our collective knowledge of how to design and build memory chips has improved so much. And yet we take it for granted.


The second way to side-step the limiting belief is even more powerful.

It is to drop the belief that individual improvement is enough.

Collective improvement is much, much, much more effective.


Cell_StructureEvidence:

The human body is made up of about 50 trillion (50 x 1000 x 1000 x 1000 x 1000) cells – about the same as the number of bytes could store on 1000 of my wonderful new 64 Gigabyte data sticks!

And each cell is a microscopic living individual. A nano-engineered adaptive system of wondrous complexity and elegance.

Each cell breathes, eats, grows, moves, reproduces, senses, learns and remembers. These cells are really smart too! And they talk to each other, and they learn from each other.

And what makes the human possible is that its community of 50 trillion smart cells are a collaborative community … not a competitive community.

If all our cells started to compete with each other we would be very quickly reduced to soup (which is what the Earth was bathed in for about 2.7 billions years).

The first multi-celled organisms gained a massive survival advantage when they learned how to collaborate.

The rest is the Story of Evolution.  Even Charles Darwin missed the point – evolution is more about collaboration than competition – and we are only now beginning to learn that lesson. The hard way.  


come_join_the_team_150_wht_10876So survival is about learning and improving.

And survival of the fittest does not mean the fittest individual … it means the fittest group.

Collaborative improvement is the process through which we can all achieve win-win-win excellence.

And the understanding of how to do this collaborative improvement has a name … it is called Improvement Science.

Whip or WIP?

smack_head_in_disappointment_150_wht_16653The NHS appears to be suffering from some form of obsessive-compulsive disorder.

OCD sufferers feel extreme anxiety in certain situations. Their feelings drive their behaviour which is to reduce the perceived cause of their feelings. It is a self-sustaining system because their perception is distorted and their actions are largely ineffective. So their anxiety is chronic.

Perfectionists demonstrate a degree of obsessive-compulsive behaviour too.


In the NHS the triggers are called ‘targets’ and usually take the form of failure metrics linked to arbitrary performance specifications.

The anxiety is the fear of failure and its unpleasant consequences: the name-shame-blame-game.


So a veritable industry has grown around ways to mitigate the fear. A very expensive and only partially effective industry.

Data is collected, cleaned, manipulated and uploaded to the Mothership (aka NHS England). There it is further manipulated, massaged and aggregated. Then the accumulated numbers are posted on-line, every month for anyone with a web-browser to scrutinise and anyone with an Excel spreadsheet to analyse.

An ocean of measurements is boiled and distilled into a few drops of highly concentrated and sanitized data and, in the process, most of the useful information is filtered out, deleted or distorted.


For example …

One of the failure metrics that sends a shiver of angst through a Chief Operating Officer (COO) is the failure to deliver the first definitive treatment for any patient within 18 weeks of referral from a generalist to a specialist.

The infamous and feared 18-week target.

Service providers, such as hospitals, are actually fined by their Clinical Commissioning Groups (CCGs) for failing to deliver-on-time. Yes, you heard that right … one NHS organisation financially penalises another NHS organisation for failing to deliver a result over which they have only partial control.

Service providers do not control how many patients are referred, or a myriad of other reasons that delay referred patients from attending appointments, tests and treatments. But the service providers are still accountable for the outcome of the whole process.

This ‘Perform-or-Pay-The-Price Policy‘ creates the perfect recipe for a lot of unhappiness for everyone … which is exactly what we hear and what we see.


So what distilled wisdom does the Mothership share? Here is a snapshot …

RTT_Data_Snapshot

Q1: How useful is this table of numbers in helping us to diagnose the root causes of long waits, and how does it help us to decide what to change in our design to deliver a shorter waiting time and more productive system?

A1: It is almost completely useless (in this format).


So what actually happens is that the focus of management attention is drawn to the part just before the speed camera takes the snapshot … the bit between 14 and 18 weeks.

Inside that narrow time-window we see a veritable frenzy of target-failure-avoiding behaviour.

Clinical priority is side-lined and management priority takes over.  This is a management emergency! After all, fines-for-failure are only going to make the already bad financial situation even worse!

The outcome of this fire-fighting is that the bigger picture is ignored. The focus is on the ‘whip’ … and avoiding it … because it hurts!


Message from the Mothership:    “Until morale improves the beatings will continue”.


The good news is that the undigestible data liquor does harbour some very useful insights.  All we need to do is to present it in a more palatable format … as pictures of system behaviour over time.

We need to use the data to calculate the work-in-progress (=WIP).

And then we need to plot the WIP in time-order so we can see how the whole system is behaving over time … how it is changing and evolving. It is a dynamic living thing, it has vitality.

So here is the WIP chart using the distilled wisdom from the Mothership.

RTT_WIP_RunChart

And this picture does not require a highly trained data analyst or statistician to interpret it for us … a Mark I eyeball linked to 1.3 kg of wetware running ChimpOS 1.0 is enough … and if you are reading this then you must already have that hardware and software.

Two patterns are obvious:

1) A cyclical pattern that appears to have an annual frequency, a seasonal pattern. The WIP is higher in the summer than in the winter. Eh? What is causing that?

2) After an initial rapid fall in 2008 the average level was steady for 4 years … and then after March 2012 it started to rise. Eh? What is causing is that?

The purpose of a WIP chart is to stimulate questions such as:

Q1: What happened in March 2012 that might have triggered this change in system behaviour?

Q2: What other effects could this trigger have caused and is there evidence for them?


A1: In March 2012 the Health and Social Care Act 2012 became Law. In the summer of 2012 the shiny new and untested Clinical Commissioning Groups (CCGs) were authorised to take over the reins from the exiting Primary care Trusts (PCTs) and Strategic Health Authorities (SHAs). The vast £80bn annual pot of tax-payer cash was now in the hands of well-intended GPs who believed that they could do a better commissioning job than non-clinicians. The accountability for outcomes had been deftly delegated to the doctors.  And many of the new CCG managers were the same ones who had collected their redundancy checks when the old system was shut down. Now that sounds like a plausible system-wide change! A massive political experiment was underway and the NHS was the guinea-pig.

A2: Another NHS failure metric is the A&E 4-hour wait target which, worringly, also shows a deterioration that appears to have started just after July 2010, i.e. just after the new Government was elected into power.  Maybe that had something to do with it? Maybe it would have happened whichever party won at the polls.

A&E_Breaches_2004-15

A plausible temporal association does not constitute proof – and we cannot conclude a political move to a CCG-led NHS has caused the observed behaviour. Retrospective analysis alone is not able to establish the cause.

It could just as easily be that something else caused these behaviours. And it is important to remember that there are usually many causal factors combining together to create the observed effect.

And unraveling that Gordian Knot is the work of analysts, statisticians, economists, historians, academics, politicians and anyone else with an opinion.


We have a more pressing problem. We have a deteriorating NHS that needs urgent resuscitation!


So what can we do?

One thing we can do immediately is to make better use of our data by presenting it in ways that are easier to interpret … such as a work in progress chart.

Doing that will trigger different conversions; ones spiced with more curiosity and laced with less cynicism.

We can add more context to our data to give it life and meaning. We can season it with patient and staff stories to give it emotional impact.

And we can deepen our understanding of what causes lead to what effects.

And with that deeper understanding we can begin to make wiser decisions that will lead to more effective actions and better outcomes.

This is all possible. It is called Improvement Science.


And as we speak there is an experiment running … a free offer to doctors-in-training to learn the foundations of improvement science in healthcare (FISH).

In just two weeks 186 have taken up that offer and 13 have completed the course!

And this vanguard of curious and courageous innovators have discovered a whole new world of opportunity that they were completely unaware of before. But not anymore!

So let us ease off applying the whip and ease in the application of WIP.


PostScript

Here is a short video describing how to create, animate and interpret a form of diagnostic Vitals Chart® using the raw data published by NHS England.  This is a training exercise from the Improvement Science Practitioner (level 2) course.

How to create an 18 weeks animated Bucket Brigade Chart (BBC)

The Bit In The Middle

RIA_graphicA question that is often asked by doctors in particular is “What is the difference between Research, Audit and Improvement Science?“.

It is a very good question and the diagram captures the essence of the answer.

Improvement science is like a bridge between research and audit.

To understand why that is we first need to ask a different question “What are the purposes of research, improvement science and audit? What do they do?

In a nutshell:

Research provides us with new knowledge and tells us what the right stuff is.
Improvement Science provides us with a way to design our system to do the right stuff.
Audit provides us with feedback and tells us if we are doing the right stuff right.


Research requires a suggestion and an experiment to test it.   A suggestion might be “Drug X is better than drug Y at treating disease Z”, and the experiment might be a randomised controlled trial (RCT).  The way this is done is that subjects with disease Z are randomly allocated to two groups, the control group and the study group.  A measure of ‘better’ is devised and used in both groups. Then the study group is given drug X and the control group is given drug Y and the outcomes are compared.  The randomisation is needed because there are always many sources of variation that we cannot control, and it also almost guarantees that there will be some difference between our two groups. So then we have to use sophisticated statistical data analysis to answer the question “Is there a statistically significant difference between the two groups? Is drug X actually better than drug Y?”

And research is often a complicated and expensive process because to do it well requires careful study design, a lot of discipline, and usually large study and control groups. It is an effective way to help us to know what the right stuff is but only in a generic sense.


Audit requires a standard to compare with and to know if what we are doing is acceptable, or not. There is no randomisation between groups but we still need a metric and we still need to measure what is happening in our local reality.  We then compare our local experience with the global standard and, because variation is inevitable, we have to use statistical tools to help us perform that comparison.

And very often audit focuses on avoiding failure; in other words the standard is a ‘minimum acceptable standard‘ and as long as we are not failing it then that is regarded as OK. If we are shown to be failing then we are in trouble!

And very often the most sophisticated statistical tool used for audit is called an average.  We measure our performance, we average it over a period of time (to remove the troublesome variation), and we compare our measured average with the minimum standard. And if it is below then we are in trouble and if it is above then we are not.  We have no idea how reliable that conclusion is though because we discounted any variation.


A perfect example of this target-driven audit approach is the A&E 95% 4-hour performance target.

The 4-hours defines the metric we are using; the time interval between a patient arriving in A&E and them leaving. It is called a lead time metric. And it is easy to measure.

The 95% defined the minimum  acceptable average number of people who are in A&E for less than 4-hours and it is usually aggregated over three months. And it is easy to measure.

So, if about 200 people arrive in a hospital A&E each day and we aggregate for 90 days that is about 18,000 people in total so the 95% 4-hour A&E target implies that we accept as OK for about 900 of them to be there for more than 4-hours.

Do the 900 agree? Do the other 17,100?  Has anyone actually asked the patients what they would like?


The problem with this “avoiding failure” mindset is that it can never lead to excellence. It can only deliver just above the minimum acceptable. That is called mediocrity.  It is perfectly possible for a hospital to deliver 100% on its A&E 4 hour target by designing its process to ensure every one of the 18,000 patients is there for exactly 3 hours and 59 minutes. It is called a time-trap design.

We can hit the target and miss the point.

And what is more the “4-hours” and the “95%” are completely arbitrary numbers … there is not a shred of research evidence to support them.

So just this one example illustrates the many problems created by having a gap between research and audit.


And that is why we need Improvement Science to help us to link them together.

We need improvement science to translate the global knowledge and apply it to deliver local improvement in whatever metrics we feel are most important. Safety metrics, flow metrics, quality metrics and productivity metrics. Simultaneously. To achieve system-wide excellence. For everyone, everywhere.

When we learn Improvement Science we learn to measure how well we are doing … we learn the power of measurement of success … and we learn to avoid averaging because we want to see the variation. And we still need a minimum acceptable standard because we want to exceed it 100% of the time. And we want continuous feedback on just how far above the minimum acceptable standard we are. We want to see how excellent we are, and we want to share that evidence and our confidence with our patients.

We want to agree a realistic expectation rather than paint a picture of the worst case scenario.

And when we learn Improvement Science we will see very clearly where to focus our improvement efforts.


Improvement Science is the bit in the middle.


Early Adoption

Rogers_CurveThe early phases of a transformation are where most fall by the wayside.

And the failure rate is horrifying – an estimated 80% of improvement initiatives fail to achieve their goals.

The recent history of the NHS is littered with the rusting wreckage of a series of improvement bandwagons.  Many who survived the crashes are too scarred and too scared to try again.


Transformation and improvement imply change which implies innovation … new ways of thinking, new ways of behaving, new techniques, new tools, and new ways of working.

And it has been known for over 50 years that innovation spreads in a very characteristic way. This process was described by Everett Rogers in a book called ‘Diffusion of Innovations‘ and is described visually in the diagram above.

The horizontal axis is a measure of individual receptiveness to the specific innovation … and the labels are behaviours: ‘I exhibit early adopter behaviour‘ (i.e. not ‘I am an early adopter’).

What Roger’s discovered through empirical observation was that in all cases the innovation diffuses from left-to-right; from innovation through early adoption to the ‘silent’ majority.


Complete diffusion is not guaranteed though … there are barriers between the phases.

One barrier is between innovation and early adoption.

There are many innovations that we never hear about and very often the same innovation appears in many places and often around the same time.

This innovation-adoption barrier is caused by two things:
1) most are not even aware of the problem … they are blissfully ignorant;
2) news of the innovation is not shared widely enough.

Innovators are sensitive people.  They sense there is a problem long before others do. They feel the fear and the excitement of need for innovation. They challenge their own assumptions and they actively seek solutions. They swim against the tide of ignorance, disinterest, skepticism and often toxic cynicism.  So when they do discover a way forward they often feel nervous about sharing it. They have learned (the hard way) that the usual reaction is to be dismissed and discounted.  Most people do not like to learn about unknown problems and hazards; and they like it even less to learn that there are solutions that they neither recognise nor understand.


But not everyone.

There is a group called the early adopters who, like the innovators, are aware of the problem. They just do not share the innovator’s passion to find a solution … irrespective of the risks … so they wait … their antennae tuned for news that a solution has been found.

Then they act.

And they act in one of two ways:

1) Talkers … re-transmit the news of the problem and the discovery of a generic solution … which is essential in building awareness.

2) Walkers … try the innovative approach themselves and in so doing learn a lot about their specific problem and the new ways to solving it.

And it is the early adopters that do both of these actions that are the most effective and the most valuable to everyone else.  Those that talk-the-new-walk and walk-the-new-talk.

And we can identify who they are because they will be able to tell stories of how they have applied the innovation in their world; and the results that they have achieved; and how they achieved them; and what worked well; and what did not; and what they learned; and how they evolved and applied the innovation to meet their specific needs.

They are the leaders, the coaches and the teachers of improvement and transformation.

They See One, Do Some, and Teach Many.

The early adopters are the bridge across the Innovation and Transformation Chasm.

The Five-day versus Seven-day Bun-Fight

Dr_Bob_ThumbnailThere is a big bun-fight kicking off on the topic of 7-day working in the NHS.

The evidence is that there is a statistical association between mortality in hospital of emergency admissions and day of the week: and weekends are more dangerous.

There are fewer staff working at weekends in hospitals than during the week … and delays and avoidable errors increase … so risk of harm increases.

The evidence also shows that significantly fewer patients are discharged at weekends.


So the ‘obvious’ solution is to have more staff on duty at weekends … which will cost more money.


Simple, obvious, linear and wrong.  Our intuition has tricked us … again!


Let us unravel this Gordian Knot with a bit of flow science and a thought experiment.

1. The evidence shows that there are fewer discharges at weekends … and so demonstrates lack of discharge flow-capacity. A discharge process is not a single step, there are many things that must flow in sync for a discharge to happen … and if any one of them is missing or delayed then the discharge does not happen or is delayed.  The weakest link effect.

2. The evidence shows that the number of unplanned admissions varies rather less across the week; which makes sense because they are unplanned.

3. So add those two together and at weekends we see hospitals filling up with unplanned admissions – not because the sick ones are arriving faster – but because the well ones are leaving slower.

4. The effect of this is that at weekends the queue of people in beds gets bigger … and they need looking after … which requires people and time and money.

5. So the number of staffed beds in a hospital must be enough to hold the biggest queue – not the average or some fudged version of the average like a 95th percentile.

6. So a hospital running a 5-day model needs more beds because there will be more variation in bed use and we do not want to run out of beds and delay the admission of the newest and sickest patients. The ones at most risk.

7. People do not get sicker because there is better availability of healthcare services – but saying we need to add more unplanned care flow capacity at weekends implies that it does.  What is actually required is that the same amount of flow-resource that is currently available Mon-Fri is spread out Mon-Sun. The flow-capacity is designed to match the customer demand – not the convenience of the supplier.  And that means for all parts of the system required for unplanned patients to flow.  What, where and when. It costs the same.

8. Then what happens is that the variation in the maximum size of the queue of patients in the hospital will fall and empty beds will appear – as if by magic.  Empty beds that ensure there is always one for a new, sick, unplanned admission on any day of the week.

9. And empty beds that are never used … do not need to be staffed … so there is a quick way to reduce expensive agency staff costs.

So with a comprehensive 7-day flow-capacity model the system actually gets safer, less chaotic, higher quality and less expensive. All at the same time. Safety-Flow-Quality-Productivity.

Study-Plan-Do

knee_jerk_reflexA commonly used technique for continuous improvement is the Plan-Do-Study-Act or PDSA cycle.

This is a derivative of the PDCA cycle first described by Walter Shewhart in the 1930’s … where C is Check.

The problem with PDSA is that improvement does not start with a plan, it starts with some form of study … so SAPD would be a better order.


IHI_MFITo illustrate this point if we look at the IHI Model for Improvement … the first step is a pair of questions related to purpose “What are we trying to accomplish?” and “How will we know a change is an improvement?

With these questions we are stepping back and studying our shared perspective of our desired future.

It is a conscious and deliberate act.

We are examining our mental models … studying them … and comparing them.  We have not reached a diagnosis or a decision yet, so we cannot plan or do yet.

The third question is a combination of diagnosis and design … we need to understand our current state in order to design changes that will take up to our improved future state.

We cannot plan what to do or how to do it until we have decided and agreed what the future design will look like, and tested that our proposed future design is fit-4-purpose.


So improvement by discovery or by design does not start with plan, it starts with study.


And another word for study is ‘sense’ which may be a better one … because study implies a deliberate, conscious, often slow process … while sense is not so restrictive.

Very often our actions are not the result of a deliberative process … they are automatic and reflex. We do not think about them. They just sort of happen.

The image of the knee-jerk reflex illustrates the point.

In fact we have little conscious control over these automatic motor reflexes which respond much more quickly than our conscious thinking process can.  We are aware of the knee jerk after it has happened, not before, so we may be fooled into thinking that we ‘Do’ without a ‘Plan’.  But when we look in more detail we can see the sensory input and the hard-wired ‘plan’ that links to to motor output.  Study-Plan-Do.


The same is true for many other actions – our unconscious mind senses, processes, decides, plans and acts long before we are consciously aware … and often the only clue we have is a brief flash of emotion … and usually not even that.  Our behaviour is largely habitual.


And even in situations when we need to make choices the sense-recognise-act process is fast … such as when a patient suddenly becomes very ill … we switch into the Resuscitate mode which is a pre-planned sequence of steps that is guided by what are sensing … but it is not made up on the spot. There is no committee. No meetings. We just do what we have learned and practiced how to do … because it was designed to.   It still starts with Study … it is just that the Study phase is very short … we just need enough information to trigger the pre-prepared plan. ABC – Airway … Breathing … Circulation. No discussion. No debate.


So, improvement starts with Study … and depending on what we sense what happens next will vary … and it will involve some form of decision and plan.

1. Unconscious, hard-wired, knee jerk reflex.
2. Unconscious, learned, habitual behaviour.
3. Conscious, pre-planned, steered response.
4. Conscious, deliberation-diagnosis-design then delivery.

The difference is just the context and the timing.   They are all Study-Plan-Do.

 And the Plan may be to Do Nothing …. the Deliberate Act of Omission.


And when we go-and-see and study the external reality we sometimes get a surprise … what we see is not what we expect. We feel a sense of confusion. And before we can plan we need to adjust our mental model so that it better matches reality. We need to establish clarity.  And in this situation we are doing Study-Adjust-Plan-Do …. S(A)PD.

Celebrate and Share

There comes a point in every improvement journey when it is time to celebrate and share. This is the most rewarding part of the Improvement Science Practitioner (ISP) coaching role so I am going to share a real celebration that happened this week.

The picture shows Chris Jones holding his well-earned ISP-1 Certificate of Competence.  The “Maintaining the Momentum of Medicines”  redesign project is shown on the poster on the left and it is the tangible Proof of Competence. The hard evidence that the science of improvement delivers.

Chris_Jones_Poster_and_Certificate

Behind us are the A3s for one of the Welsh Health Boards;  ABMU in fact.


An A3 is a way of summarising an improvement project very succinctly – the name comes from the size of paper used.  A3 is the biggest size that will go through an A4 fax machine (i.e. folded over) and the A3 discipline is to be concise and clear at the same time.

The three core questions that the A3 answers are:
Q1: What is the issue?
Q2: What would improvement need to look like?
Q3: How would we know that a change is an improvement?

This display board is one of many in the room, each sharing a succinct story of a different improvement journey and collectively a veritable treasure trove of creativity and discovery.

The A3s were of variable quality … and that is OK and is expected … because like all skills it takes practice. Lots of practice. Perfection is not the goal because it is unachievable. Best is not the goal because only one can be best. Progress is the goal because everyone can progress … and so progress is what we share and what we celebrate.


The event was the Fifth Sharing Event in the Welsh Flow Programme that has been running for just over a year and Chris is the first to earn an ISP-1 Certificate … so we all celebrated with him and shared the story.  It is a team achievement – everyone in the room played a part in some way – as did many more who were not in the room on the day.


stick_figure_look_point_on_cliff_anim_8156Improvement is like mountain walking.

After a tough uphill section we reach a level spot where we can rest; catch our breath; take in the view; reflect on our progress and the slips, trips and breakthroughs along the way; perhaps celebrate with drink and nibble of our chocolate ration; and then get up, look up, and square up for the next uphill bit.

New territory for us.  New challenges and new opportunities to learn and to progress and to celebrate and share our improvement stories.

Over-Egged Expectation

FISH_ISP_eggs_jumpingResistance-to-change is an oft quoted excuse for improvement torpor. The implied sub-message is more like “We would love to change but They are resisting“.

Notice the Us-and-Them language.  This is the observable evidence of an “We‘re OK and They’re Not OK” belief.  And in reality it is this unstated belief and the resulting self-justifying behaviour that is an effective barrier to systemic improvement.

This Us-and-Them language generates cultural friction, erodes trust and erects silos that are effective barriers to the flow of information, of innovation and of learning.  And the inevitable reactive solutions to this Us-versus-Them friction create self-amplifying positive feedback loops that ensure the counter-productive behaviour is sustained.

One tangible manifestation are DRATs: Delusional Ratios and Arbitrary Targets.


So when a plausible, rational and well-evidenced candidate for an alternative approach is discovered then it is a reasonable reaction to grab it and to desperately spray the ‘magic pixie dust’ at everything.

This a recipe for disappointment: because there is no such thing as ‘improvement magic pixie dust’.

The more uncomfortable reality is that the ‘magic’ is the result of a long period of investment in learning and the associated hard work in practising and polishing the techniques and tools.

It may look like magic but is isn’t. That is an illusion.

And some self-styled ‘magicians’ choose to keep their hard-won skills secret … because by sharing them know that they will lose their ‘magic powers’ in a flash of ‘blindingly obvious in hindsight’.

And so the chronic cycle of despair-hope-anger-and-disappointment continues.


System-wide improvement in safety, flow, quality and productivity requires that the benefits of synergism overcome the benefits of antagonism.  This requires two changes to the current hope-and-despair paradigm.  Both are necessary and neither are sufficient alone.

1) The ‘wizards’ (i.e. magic folk) share their secrets.
2) The ‘muggles’ (i.e. non-magic folk) invest the time and effort in learning ‘how-to-do-it’.


The transition to this awareness is uncomfortable so it needs to be managed pro-actively … by being open about the risk … and how to mitigate it.

That is what experienced Practitioners of Improvement Science (and ISP) will do. Be open about the challenged ahead.

And those who desperately want the significant and sustained SFQP improvements; and an end to the chronic chaos; and an end to the gaming; and an end to the hope-and-despair cycle …. just need to choose. Choose to invest and learn the ‘how to’ and be part of the future … or choose to be part of the past.


Improvement science is simple … but it is not intuitively obvious … and so it is not easy to learn.

If it were we would be all doing it.

And it is the behaviour of a wise leader of change to set realistic and mature expectations of the challenges that come with a transition to system-wide improvement.

That is demonstrating the OK-OK behaviour needed for synergy to grow.

Circles

SFQP_enter_circle_middle_15576For a system to be both effective and efficient the parts need to work in synergy. This requires both alignment and collaboration.

Systems that involve people and processes can exhibit complex behaviour. The rules of engagement also change as individuals learn and evolve their beliefs and their behaviours.

The values and the vision should be more fixed. If the goalposts are obscure or oscillate then confusion and chaos is inevitable.


So why is collaborative alignment so difficult to achieve?

One factor has been mentioned. Lack of a common vision and a constant purpose.

Another factor is distrust of others. Our fear of exploitation, bullying, blame, and ridicule.

Distrust is a learned behaviour. Our natural inclination is trust. We have to learn distrust. We do this by copying trust-eroding behaviours that are displayed by our role models. So when leaders display these behaviours then we assume it is OK to behave that way too.  And we dutifully emulate.

The most common trust eroding behaviour is called discounting.  It is a passive-aggressive habit characterised by repeated acts of omission:  Such as not replying to emails, not sharing information, not offering constructive feedback, not asking for other perspectives, and not challenging disrespectful behaviour.


There are many causal factors that lead to distrust … so there is no one-size-fits-all solution to dissolving it.

One factor is ineptitude.

This is the unwillingness to learn and to use available knowledge for improvement.

It is one of the many manifestations of incompetence.  And it is an error of omission.


Whenever we are unable to solve a problem then we must always consider the possibility that we are inept.  We do not tend to do that.  Instead we prefer to jump to the conclusion that there is no solution or that the solution requires someone else doing something different. Not us.

The impossibility hypothesis is easy to disprove.  If anyone has solved the problem, or a very similar one, and if they can provide evidence of what and how then the problem cannot be impossible to solve.

The someone-else’s-fault hypothesis is trickier because proving it requires us to influence others effectively.  And that is not easy.  So we tend to resort to easier but less effective methods … manipulation, blame, bullying and so on.


A useful way to view this dynamic is as a set of four concentric circles – with us at the centre.

The outermost circle is called the ‘Circle of Ignorance‘. The collection of all the things that we do not know we do not know.

Just inside that is the ‘Circle of Concern‘.  These are things we know about but feel completely powerless to change. Such as the fact that the world turns and the sun rises and falls with predictable regularity.

Inside that is the ‘Circle of Influence‘ and it is a broad and continuous band – the further away the less influence we have; the nearer in the more we can do. This is the zone where most of the conflict and chaos arises.

The innermost is the ‘Circle of Control‘.  This is where we can make changes if we so choose to. And this is where change starts and from where it spreads.


SFQP_enter_circle_middle_15576So if we want system-level improvements in safety, flow, quality and productivity (or cost) then we need to align these four circles. Or rather the gaps in them.

We start with the gaps in our circle of control. The things that we believe we cannot do … but when we try … we discover that we can (and always could).

With this new foundation of conscious competence we can start to build new relationships, develop trust and to better influence others in a win-win-win conversation.

And then we can collaborate to address our common concerns – the ones that require coherent effort. We can agree and achieve our common purpose, vision and goals.

And from there we will be able to explore the unknown opportunities that lie beyond. The ones we cannot see yet.

Cumulative Sum

Dr_Bob_Thumbnail[Bing] Bob logged in for the weekly Webex coaching session. Leslie was not yet on line, but joined a few minutes later.

<Leslie> Hi Bob, sorry I am a bit late, I have been grappling with a data analysis problem and did not notice the time.

<Bob> Hi Leslie. Sounds interesting. Would you like to talk about that?

<Leslie> Yes please! It has been driving me nuts!

<Bob> OK. Some context first please.

<Leslie> Right, yes. The context is an improvement-by-design assignment with a primary care team who are looking at ways to reduce the unplanned admissions for elderly patients by 10%.

<Bob> OK. Why 10%?

<Leslie> Because they said that would be an operationally very significant reduction.  Most of their unplanned admissions, and therefore costs for admissions, are in that age group.  They feel that some admissions are avoidable with better primary care support and a 10% reduction would make their investment of time and effort worthwhile.

<Bob> OK. That makes complete sense. Setting a new design specification is OK.  I assume they have some baseline flow data.

<Leslie> Yes. We have historical weekly unplanned admissions data for two years. It looks stable, though rather variable on a week-by-week basis.

<Bob> So has the design change been made?

<Leslie> Yes, over three months ago – so I expected to be able to see something by now but there are no red flags on the XmR chart of weekly admissions. No change.  They are adamant that they are making a difference, particularly in reducing re-admissions.  I do not want to disappoint them by saying that all their hard work has made no difference!

<Bob> OK Leslie. Let us approach this rationally.  What are the possible causes that the weekly admissions chart is not signalling a change?

<Leslie> If there has not been a change in admissions. This could be because they have indeed reduced readmissions but new admissions have gone up and is masking the effect.

<Bob> Yes. That is possible. Any other ideas?

<Leslie> That their intervention has made no difference to re-admissions and their data is erroneous … or worse still … fabricated!

<Bob> Yes. That is possible too. Any other ideas?

<Leslie> Um. No. I cannot think of any.

<Bob> What about the idea that the XmR chart is not showing a change that is actually there?

<Leslie> You mean a false negative? That the sensitivity of the XmR chart is limited? How can that be? I thought these charts will always signal a significant shift.

<Bob> It depends on the degree of shift and the amount of variation. The more variation there is the harder it is to detect a small shift.  In a conventional statistical test we would just use bigger samples, but that does not work with an XmR chart because the run tests are all fixed length. Pre-defined sample sizes.

<Leslie> So that means we can miss small but significant changes and come to the wrong conclusion that our change has had no effect! Isn’t that called a Type 2 error?

<Bob> Yes, it is. And we need to be aware of the limitations of the analysis tool we are using. So, now you know that how might you get around the problem?

<Leslie> One way would be to aggregate the data over a longer time period before plotting on the chart … we know that will reduce the sample variation.

<Bob> Yes. That would work … but what is the downside?

<Leslie> That we have to wait a lot longer to show a change, or not. We do not want that.

<Bob> I agree. So what we do is we use a chart that is much more sensitive to small shifts of the mean.  And that is called a cusum chart. These were not invented until 30 years after Shewhart first described his time-series chart.  To give you an example, do you recall that the work-in-progress chart is much more sensitive to changes in flow than either demand or activity charts?

<Leslie> Yes, and the WIP chart also reacts immediately if either demand or activity change. It is the one I always look at first.

<Bob> That is because a WIP chart is actually a cusum chart. It is the cumulative sum of the difference between demand and activity.

<Leslie> OK! That makes sense. So how do I create and use a cusum chart?

<Bob> I have just emailed you some instructions and a few examples. You can try with your unplanned admissions data. It should only take a few minutes. I will get a cup of tea and a chocolate Hobnob while I wait.

[Five minutes later]

<Leslie> Wow! That is just brilliant!  I can see clearly on the cusum chart when the shifts happened and when I split the XmR chart at those points the underlying changes become clear and measurable. The team did indeed achieve a 10% reduction in admissions just as they claimed they had.  And I checked with a statistical test which confirmed that it is statistically significant.

<Bob> Good work.  Cusum charts take a bit of getting used to and we have be careful about the metric we are plotting and a few other things but it is a useful trick to have up our sleeves for situations like this.

<Leslie> Thanks Bob. I will bear that in mind.  Now I just need to work out how to explain cusum charts to others! I do not want to be accused of using statistical smoke-and-mirrors! I think a golf metaphor may work with the GPs.

Persistence and Patience

magnify_text_anim_16253(1)There is no doubt about it …

… change is not easy.

If it were we would all be doing it …

… all of the time.

So one skill that an effective agent of change demonstrates is persistence.

And also patience. And also reflective learning.


A recent change project demonstrated objective, measurable outcomes which showed that the original design goal was achieved. In budget. It took two years from first contact to final report.

Why two years? Could it have been done quicker?

In principle – ‘Emphatically, yes’.  In practice – ‘Evidently, no’.


With the benefit of hindsight it is always clearer what might have caused the delay.  Maybe the experience-based advice of those guiding the process was discounted.  Maybe the repeated recommendation that an initial investment in learning the basic science of improvement would deliver a quicker return was ignored.  Maybe.


So the reflective learning from the first wave was re-invested in the second wave.

And the second wave delivered a significant and objectively measurable improvement in one year.

And the reflective learning from the second wave was re-invested in the third wave.

And the third wave delivered a significant and objectively measurable improvement in six months.

And the three improvement projects were of comparable complexity.


So what is happening here?

The process of improvement is itself being improved.  Experience and learning are being re-invested.

And two repeating themes emerge ….

Patience is needed to await outcomes and to learn from them.

Persistence is needed to re-examine old paradigms with this new knowledge and new understanding.


Patience and Persistence. And these principles apply as much to the teacher as to the taught.

A School for Rebels

Troublemaker_vs_RebelSystem-wide, significant, and sustained improvement implies system-wide change.

And system-wide change implies more than 20% of the people commit to action. This is the cultural tipping point.

These critical 20% have a badge … they call themselves rebels … and they are perceived as troublemakers by those who profit most from the status quo.

But troublemakers and rebels are radically different … as shown in the summary by Lois Kelly.


Rebels share a common, future-focussed purpose.  A mission.  They are passionate, optimistic and creative.  They understand synergy and how to release and align the stored emotional energy of both themselves and others.  And most importantly they are value-led and that makes them attractive.  Values such as honesty, integrity and industry are what make leaders together-effective.

SHCR_logoAnd as we speak there is school for rebels in healthcare gaining momentum …  and their programme is current, open to all and free to access. And the change agent development materials are excellent!

Click here to download their study guide.


Converting possibilities into realities is the essence of design … so our merry band of rebels will also need to learn how to convert their positive rhetoric into practical reality. And that is more physics than psychology.

Streams flow because of physics not because of passion.SFQP_Compass

And this is why the science of improvement is important because it is the synthesis of the people dimension and the process dimension – into a system that delivers significant and sustained improvement.

On all dimensions. Safety, Flow, Quality and Productivity.

The lighthouse is our purpose; the whale represents the magnitude of our challenge; the blue sky is the creative thinking we need … to avoid trying to boil the ocean.

And the noisy, greedy, s****y seagulls are the troublemakers who always will plague us.

[Image by Malaika Art].


The Nanny McPhee Coaching Contract

Nanny_McPheeThere comes a point in every improvement-by-design journey when it is time for the improvement guide to leave.

An experienced improvement coach knows when that time has arrived and the expected departure is in the contract.

The Nanny McPhee Coaching Contract:

“When you need me but do not want me then I have to stay. And when you want me but do not need me then I have to leave.”


The science of improvement can appear like ‘magic’ at first because seemingly impossible simultaneous win-win-win benefits are seen to happen with minimal effort.

It is not magic.  It requires years of training and practice to become a ‘magician’.  So those who have invested in learning the know-how are just catalysts.  When their catalysts-of-change work is done then they must leave to do it elsewhere.

The key to managing this transition is to set this expectation clearly and right at the start; so it does not come as a surprise. And to offer reminders along the way.

And it is important to follow through … when the time is right.


It is not always easy though.

There are three commonly encountered situations that will test the temptation of the guide.

1) When things are going very badly because the coaching contract is being breached; usually by old, habitual, trust-eroding, error-of-omission behaviours such as: not communicating, not sharing learning, and not delivering on commitments. The coach, fearing loss of reputation and face, is tempted to stay longer and to try harder. Often getting angry and frustrated in the process.  This is an error of judgement. If the coaching contract is being persistently breached then the Exit Clause should be activated clearly and cleanly.

2) When things are going OK, it is easy to become complacent and the temptation then is to depart too soon, only to hear later that the solo-flyers “crashed and burned”, because they were not quite ready and could not (or would not) see it.  This is the “need but do not want” part of the Nanny McPhee Coaching Contract.  One role of the coach is to respectfully challenge the assertion that ‘We can do it ourselves‘ … by saying ‘OK, please demonstrate‘.

3) When things are going very well it is tempting to blow the Trumpet of Success too early, attracting the attention of others who will want to take short cuts, to bypass the effort of learning for themselves, and to jump onto someone else’s improvement bus.  The danger here is that they bring their counter-productive, behavioural baggage with them. This can cause the improvement bus to veer off course on the twists and turns of the Nerve Curve; or grind to a halt on the steeper parts of the learning curve.


An experienced improvement coach will respectfully challenge the individuals and the teams to help them develop their experience, competence and confidence. And just as they start to become too comfortable with having someone to defer to for all decisions, the coach will announce their departure and depart as announced.

This is the “want but do not need” part of the Nanny McPhee Coaching Contract.


And experience teaches us that this mutually respectful behaviour works better.

Guess-work or Grunt-work?

back_and_forth_questions_150_wht_8159Improvement flows from change. Change flows from action. Action flows from decision.

And we can make a decision in one of two ways – we can use guess-work or we can use grunt-work.

Of course it does not feel as black and white as that so let us put those two options at the opposite ends of a spectrum. Pure guess-work at one and and pure grunt-work at the other.

Guess-work is the easier end. To guess we just need a random number generator of some sort – like a dice.  Grunt-work is the harder end.  And what exactly is “grunt-work”?


Using available knowledge to work out a decision that will get us to our intended  outcome is grunt-work.  It does not require creativity, imagination, assumptions, beliefs, judgements and all the usual machinery that we humans employ to make decisions. It just requires following the tried-and-tested recipe and doing the grunt-work. A computer does grunt-work. It just follows the recipe we give it.

But experience shows that we even with hard work we do not always get the outcome we intend. So what is going wrong?

When the required knowledge is available and we do not use it we are exhibiting ineptitude. So in that context then we have a clear path of improvement: We invest first in dissolving our own ineptitude. We invest in learning what is already known.  And that is grunt-work. Hard work.

When the required knowledge is not available then we are exhibiting ignorance.  And our ignorance is exposed in two ways: firstly when we cannot make a decision of what to do because we have no option other than to guess. And secondly when what we predicted would happen as a result of our action did not actually happen. Reality disproved our rhetoric.

When we are ignorant we have a different path of improvement – first we need to do research to improve our knowledge and understanding, and only then when we are able to apply the new knowledge to make reliable predictions. We need tested and trusted knowledge to design a path to out intended outcome.

And as Richard Feynman perceptively observed … research starts with an educated guess.  We might call it an hypothesis but it is a guess nevertheless. From that we make predictions and then we do experiments using reality to test our rhetoric. All guesses that fail the reality-check are rejected. So our vast body of scientific knowledge is the accumulation of guesses that did not fail the reality-check.

The critical word in the paragraph above is “educated”. How do researchers make educated guesses?

What does the word “educated” imply?


School is all about learning what is already “known”.  There is no debate.  The teachers are always right, only the students can be wrong. It is assumed.

But most of our learning comes from what we experience before and after school.  We are all enrolled in the University of Life – and the teacher there is reality, not rhetoric.

And when we are tested by reality we are very often found to be lacking something.  Well actually we are always found to be lacking.  Sometimes we flunk the test outright and have to go back to the bottom of the learning ladder. Sometimes we scrape a bare pass … we survive … but we know we came close to failing.  Sometimes we secure a safe pass … and still we know we could have done better.  We can always do better.

But how?  Is it because we were ignorant?  Or was it because we were inept?

Examinations at The University of Rhetoric are designed to measure our ineptitude.

The University of Life is not so didactic or autocratic.  The challenges it presents come from anywhere in the Ignorance-Ineptitude Zone.  We need educated guesswork to survive there.


So one problem we face is how do we differentiate ignorance from ineptitude?

At this point it is important to separate individual ignorance from collective ignorance; and individual ineptitude from collective ineptitude. There are two dimensions at play.

The history of science is characterised by individuals who first resolved their individual ignorance when they discover something new. Only later was it appreciated that they were the first. So long as that discovery is shared then collective ignorance has reduced too. There is no need for everyone to rediscover everything when we share our learning.

Newton’s “discovery” of the Laws of Motion is a good example of an individual discovery quickly becoming collective knowledge. And with that collective knowledge we have proved we are able to land a spaceship on a far distant comet! That is grunt-work.

Einstein’s “discovery” of Relativity did not disprove Newton’s Laws of Motion, it re-framed and re-fined them so that even more profound predictions could be made. Some of the predictions are only now being tested as our technology has evolved to be able to perform the measurements with sufficient precision and accuracy. That is grunt-work.  And it is increasingly collective grunt-work.


We are all born individually ignorant and individually inept.

Through experience and education we become aware of collective knowledge and with that we develop our individual capabilities. We do not re-invent every wheel.

And with that individual capability we are able to survive. We can secure a “pass” in the University of Life Survival Challenge.

But it leaves a lot of room for improvement.

Continuing to build collective knowledge through scientific research into more and more complicated and complex challenges, such as climate change, is necessary. But it is not sufficient. We need more.

Developing  our collective capability to put that knowledge to the service of every living thing on the Earth is our challenge.  And that is not grunt-work because we do not have a recipe to follow. We have to discover how to do that.

And that journey of discovery is called Improvement Science.


People first or Process first?

stick_figure_balance_mind_heart_150_wht_9344A recurring theme this week has been the interplay between the cultural and the technical dimensions of system improvement.

The hearts and the minds.  The people and the process.  The psychology and the physics.

Reflecting on the many conversations what became clear was that both are required but not always in the same amount and in the same sequence.

The context is critical.

In some cases we can start with some technical stuff. Some flow physics and a Gantt and Run chart or two.

In other cases we have to start with some cultural stuff. Some conversations about values, beliefs and behaviours.

And they are both tricky but in different ways.


The technical stuff is counter-intuitive.  We have to engage our logical, rational thinking brains and work it through step-by-step, making every assumption explicit and every definition clear.

If we go with our gut we get it wrong (although we feel it is right) and then we fail, and then we blame others or ourselves. Either way we lose confidence.  The logical thinking is hard work. It makes our heads ache. So we cut corners.

But once we have understood then it gets much easier because we can then translate our hard won understanding into a trusted heuristic.  We do not need to work it out every time. We can just look up the correct recipe.

And there lurks a trap … the problem that was at first unrecognised, then impossible, then difficult, and then doable … becomes easy and even obvious … but only after we have worked out a solution. And that obvious-in-hindsight effect is a source of many dangers …

… we can become complacent, over-confident, and even dismissive of others who have not been through the ‘pain’ of learning. We may be tempted to elevate our status and to inflate our importance by hoarding our hard-won understanding. We risk losing our humility … and when we do that we stop being curious and we stop learning. And then we are part of the problem again.

So to avoid those traps we need to hold ourselves in the role of the teacher and coach. We need to actively share what we have learned and explain how we came to know it.  One step at a time … the blood, the sweat and the tears … the confusion and eureka moments. Not one giant leap from where we started to where we got to.  And when we have the generosity to share our knowledge … it is surprising how much we learn!  We learn more from teaching than by being taught.


The cultural stuff is counter-intuitive too.  We have to engage our emotional, irrational, feeling brains and step back from the objective fine-print to look at the subjective full-picture. We have to become curious. We have to look at the problem from as many perspectives as we can. We have to practice humble inquiry by asking others what they see.

If we go with our gut  and rely only on our learned and habitual beliefs, our untested assumptions and our prejudices … we get it wrong. When we filter reality to match our rhetoric, we leap to invalid conclusions, and we make unwise decisions, and they lead to counter-productive actions.

Our language and behaviour gives the game away … we cannot help it … because all this is happening unconsciously and out of our awareness.

So we need to solicit unfiltered feedback from trusted others who will describe what they see.  And that is tough to do.


So how do we know where to act first? Cultural or technical?

The conclusion I have come to is to use a check-list … the Safe System Improvement check-list so to speak.

Check cultural first – Is there a need to do some people stuff? If so then do it.

Check technical second – Is there a need to do some process stuff? If so then do it.

If neither are needed then we need to get out of the way and let the people redesign the processes. Only they can.

Catalyst

everyone_has_an_idea_300_wht_12709[Bing Bong] Bob was already logged into the weekly coaching Webex when Leslie arrived: a little late.

<Bob> Hi Leslie, how has your week been?

<Leslie> Hi Bob, sorry I am a bit late. It has been a very interesting week.

<Bob> My curiosity is pricked … are you willing to share?

<Leslie> Yes indeed! First an update on the improvement project was talked about a few weeks ago.

<Bob> The call centre one?

<Leslie> Yes.  The good news is that the improvement has been sustained. It was not a flash in the pan. The chaos is gone and the calm has continued.

<Bob> That is very good to hear. And how did the team react?

<Leslie> That is one of the interesting things. They went really quiet.  There was no celebration, no cheering, no sounds of champagne corks popping.  It was almost as if they did not believe what they were seeing and they feared that if they celebrated too early they would somehow trigger a failure … or wake up from a dream.

<Bob> That is a very common reaction.  It takes a while for reality to sink in – the reality that they have changed something, that the world did not end, and that their chronic chaos has evaporated.  It is like a grief reaction … they have to mourn the loss of their disbelief. That takes time. About six weeks usually.

<Leslie> Yes, that is exactly what has happened – and I know they have now got over the surprise because the message I got this week was simply “OK, that appears to have worked exactly as you predicted it would. Will you help us solve the next impossible problem?

<Bob> Well done Leslie!  You have helped them break through the “Impossibility Barrier”.  So what was your answer?

<Leslie> Well I was really tempted to say “Of course, let me at it!” but I did not. Instead I asked a question “What specifically do you need my help to do?

<Bob> OK.  And how was that reply received?

<Leslie> They were surprised, and they said “But we could not have done this on our own. You know what to do right at the start and even with your help it took us months to get to the point where we were ready to make the change. So you can do this stuff much more quickly than we can.

<Bob> Well they are factually correct.

<Leslie> Yes I know, so I pointed out that although the technical part of the design does not take very long … that was not the problem … what slowed us down was the cultural part of the change.  And that is done now so does not need to be repeated. The next study-plan-do cycle will be much quicker and they only need me for the technical bits they have not seen before.

<Bob> Excellent. So how would you now describe your role?

<Leslie> More of a facilitator and coach with a bit of only-when-needed training thrown in.

<Bob> Exactly … and I have a label for this role … I call it a Catalyst.

<Leslie> That is interesting, why so?

<Bob> Because the definition of a catalyst fits rather well. Using the usual scientific definition, a catalyst increases the yield and rate of a chemical reaction. With a catalyst, reactions occur faster and with less energy and catalysts are not consumed, they are recycled, so only tiny amounts are required.

<Leslie> Ah yes, that feels about right.  But I am not just catalysing the reaction that produced the desired result am I?

<Bob> No. What else are you doing?

<Leslie> I am also converting some of the substrate into potential future catalysts too.

<Bob> Yes, you are. And that is what is needed for the current paradigm to shift.

<Leslie> Wow! I see that. This is powerful stuff!

<Bob> It is indeed. And the reaction you are catalysing is the combination of wisdom with ineptitude.

<Leslie> Eh? Can you repeat that again. Wisdom and ineptitude? Those are not words that I hear very often. I hear words like dumb, stupid, ignorant, incompetent and incapable. What is the reason you use those words?

<Bob> Simply because the dictionary definitions fit. Ineptitude means not knowing what to do to get the result we want, which is not the same as just not knowing stuff or not having the necessary skills.  What we need are decisions which lead to effective actions and to intended outcomes. Wise decisions. If we demonstrate ineptitude we reveal that we lack the wisdom to make those effective decisions.  So we need to combine ineptitude with wisdom to get the capability to achieve our purpose.

<Leslie> But why use the word “wisdom”? Why not just “knowledge”?

<Bob> Because knowledge is not enough.  Knowledge just implies that I recognise what I am seeing. “I know this. I have seen it before“.  Appreciating the implication of what I recognise is something more … it is called “understanding”.

<Leslie> Ah! I know this. I have seen this before. I know what a time-series chart is and I know how to create one but it takes guidance, time and practice to understand the implications of what the chart is saying about the system.  But where does wisdom fit?

<Bob>Understanding is past-focussed. We understand how we got to where we are in the present. We cannot change the past so understanding has nothing to do with wise decisions or effective actions or intended outcomes. It is retrospection.

<Leslie> So wisdom is future-focussed. It is prospective. It is the ability to predict the outcome of an action and that ability is necessary to make wise decisions. That is why wisdom is the antidote to ineptitude!

<Bob> Well put! And that is what you did long before you made the change in the call centre … you learned how to make reliable predictions … and the results have confirmed yours was a wise decision.  They got their intended outcome. You are not inept.

<Leslie> Ah! Now I understand the difference. I am a catalyst for improvement because I am able to diagnose and treat ineptitude. That is what you did for me. You are a catalyst.

<Bob> Welcome to the world of the Improvement Science Practitioner.  You have earned your place.


Atul_GawandeThe word “ineptitude” is coined by Dr Atul Gawande in the first of the 2014 Reith Lectures entitled “Why Do Doctors Fail?“.

Click HERE to listen to his first lecture (30 minutes).

In his second lecture he describes how it is the design of the system that delivers apparently miraculous outcomes.  It is the way that the parts work together and the attention to context and to detail that counts.

Click HERE to hear his second lecture  “The Century of the System” (30 minutes).

And Atul has a proven track record in system improvement … he is the doctor-surgeon-instigator of the WHO Safer Surgery Check List – a simple idea borrowed from aviation that is now used worldwide and is preventing 1000’s of easily avoidable deaths during and after surgery.

Click HERE to hear his third lecture  “The Problem of Hubris” (30 minutes).

Click HERE to hear his fourth lecture  “The Idea of Wellbeing” (30 minutes).


Seeing and Believing

Flow_Science_Works[Beep] It was time again for the weekly Webex coaching session. Bob dialled into the teleconference to find Leslie already there … and very excited.

<Leslie> Hi Bob, I am so excited. I cannot wait to tell you about what has happened this week.

<Bob> Hi Leslie. You really do sound excited. I cannot wait to hear.

<Leslie> Well, let us go back a bit in the story.  You remember that I was really struggling to convince the teams I am working with to actually make changes.  I kept getting the ‘Yes … but‘ reaction from the sceptics.  It was as if they were more comfortable with complaining.

<Bob> That is the normal situation. We are all very able to delude ourselves that what we have is all we can expect.

<Leslie> Well, I listened to what you said and I asked them to work through what they predicted could happen if they did nothing.  Their healthy scepticism then worked to build their conviction that doing nothing was a very dangerous choice.

<Bob> OK. And I am guessing that insight was not enough.

<Leslie> Correct.  So then I shared some examples of what others had achieved and how they had done it, and I started to see some curiosity building, but no engagement still.  So I kept going, sharing stories of ‘what’, and ‘how’.  And eventually I got an email saying “We have thought about what you said about a one day experiment and we are prepared to give that a try“.

<Bob> Excellent. How long ago was that?

<Leslie> Three months. And I confess that I was part of the delay.  I was so surprised that they said ‘OK‘ that I was not ready to follow on.

<Bob> OK. It sounds like you did not really believe it was possible either. So what did you do next?

<Leslie> Well I knew for sure that we would only get one chance.  If the experiment failed then it would be Game Over. So I needed to know before the change what the effect would be.  I needed to be able to predict it accurately. I also needed to feel reassured enough to take the leap of faith.

<Bob> Very good, so did you use some of your ISP-2 skills?

<Leslie> Yes! And it was a bit of a struggle because doing it in theory is one thing; doing it in reality is a lot messier.

<Bob> So what did you focus on?

<Leslie> The top niggle of course!  At St Elsewhere® we have a call-centre that provides out-of-office-hours telephone advice and guidance – and it is especially busy at weekends.  We are required to answer all calls quickly, which we do, and then we categorise them into ‘urgent’  and ‘non-urgent’ and pass them on to the specialists.  They call the clients back and provide expert advice and guidance for their specific problem.

<Bob>So you do not use standard scripts?

<Leslie> No, that does not work. The variety of the problems we have to solve is too wide. And the specialist has to come to a decision quite quickly … solve the problem over the phone, arrange a visit to an out of hours clinic, or to dispatch a mobile specialist to the client immediately.

<Bob> OK. So what was the top niggle?

<Leslie> We have contractual performance specifications we have to meet for the maximum waiting time for our specialists to call clients back; and we were not meeting them.  That implied that we were at risk of losing the contract and that meant loss of revenue and jobs.

<Bob> So doing nothing was not an option.

<Leslie> Correct. And asking for more resources was not either … the contract was a fixed price one. We got it because we offered the lowest price. If we employed more staff we would go out of business.  It was a rock-and-a-hard-place problem.

<Bob> OK.  So if this was ranked as your top niggle then you must have had a solution in mind.

<Leslie> I had a diagnosis.  The Vitals Chart© showed that we already had enough resources to do the work. The performance failure was caused by a scheduling policy – one that we created – our intuitively-obvious policy.

<Bob> Ah ha! So you suggested doing something that felt counter-intuitive.

<Leslie> Yes. And that generated all the ‘Yes .. but‘  discussion.

<Bob> OK. Do you have the Vitals Chart© to hand? Can you send me the Wait-Time run chart?

<Leslie> Yes, I expected you would ask for that … here it is.

StE_CallCentre_Before<Bob> OK. So I am looking at the run chart of waiting time for the call backs for one Saturday, and it is in call arrival order, and the blue line is the maximum allowed waiting time is that correct?

<Leslie>Yup. Can you see the diagnosis?

<Bob> Yes. This chart shows the classic pattern of ‘prioritycarveoutosis’.  The upper border is the ‘non-urgents’ and the lower group are the ‘urgents’ … the queue jumpers.

<Leslie> Spot on.  It is the rising tide of non-urgent calls that spill over the specification limit.  And when I shared this chart the immediate reaction was ‘Well that proves we need more capacity!

<Bob> And the WIP chart did not support that assertion.

<Leslie> Correct. It showed we had enough total flow-capacity already.

<Bob> So you suggested a change in the scheduling policy would solve the problem without costing any money.

<Leslie> Yes. And the reaction to that was ‘That is impossible. We are already working flat out. We need more capacity because to work quicker will mean cutting corners and it is unsafe to cut-corners‘.

<Bob> So how did you get around that invalid but widely held belief?

<Leslie> I used one of the FISH techniques. I got a few of them to play a table top game where we simulated a much simpler process and demonstrated the same waiting time pattern on a hand-drawn run chart.

<Bob> Excellent.  Did that get you to the ‘OK, we will give it a go for one day‘ decision.

<Leslie>Yes. But then I had to come up with a new design and I had test it so I know it would work.

<Bob> Because that was a step too far for them. And It sounds like you achieved that.

<Leslie> Yes.  It was tough though because I knew I had to prove to myself I could do it. If I had asked you I know what you would have said – ‘I know you can do this‘.  And last Saturday we ran the ‘experiment’. I was pacing up and down like an expectant parent!

<Bob> I expect rather like the ESA team who have just landed Rosetta’s little probe-child on an asteroid travelling at 38,000 miles per hour, billions of miles from Earth after a 10 year journey through deep space!  Totally inspiring stuff!

<Leslie> Yes. And that is why I am so excited because OUR DESIGN WORKED!  Exactly as predicted.

<Bob> Three cheers for you!  You have experienced that wonderful feeling when you see the effect of improvement-by-design with your own eyes. When that happens then you really believe what opportunities become possible.

<Leslie> So I want to show you the ‘after’ chart …

StE_CallCentre_After

<Bob> Wow!  That is a spectacular result! The activity looks very similar, and other than a ‘blip’ between 15:00 and 19:00 the prioritycarveoutosis has gone. The spikes have assignable causes I assume?

<Leslie> Spot on again!  The activity was actually well above average for a Saturday.  The subjective feedback was that the new design felt calm and under-control. The chaos had evaporated.  The performance was easily achieved and everyone was very positive about the whole experience.  The sceptics were generous enough to say it had gone better than they expected.  And yes, I am now working through the ‘spikes’ and excluding them … but only once I have a root cause that explains them.

<Bob> Well done Leslie! I sense that you now believe what is possible whereas before you just hoped it would be.

<Leslie> Yes! And the most important thing to me is that we did it ourselves. Which means improvement-by-design can be learned. It is not obvious, it feels counter-intuitive, so it is not easy … but it works.

<Bob> Yes. That is the most important message. And you have now earned your ISP Certificate of Competency.

World Class Improvement

figure_weight_lift_success_150_wht_12334Improvement Science is exactly like a sport: it requires training and practice to do well.

Elite athletes do not just turn up and try hard … they have invested thousands of hours of blood, sweat and tears to even be eligible to turn up.

And their preparation is not random or haphazard … it is structured and scientific.  Sport is a science.

So it is well worth using this sporting metaphor to outline some critical-to-success factors … because the statistics on improvement projects is not good.

It is said that over 70% of improvement projects fail to achieve their goals.

figure_weight_lift_fail_anim_150_wht_12338That is a shocking statistic. It is like saying 70% of runners who start a race do not finish!

And in sport if you try something that you are not ready for then you can seriously damage your health. So just turning up and trying hard is not enough. In can actually be counter-productive!

Common sense tells us that those fail to complete the course were not well enough prepared to undertake the challenge.  We know that only one person can win a race … but everyone else could finish it.  And to start and finish a tough race is a major achievement for each participant.

It is actually their primary goal.

Being good enough to when we need to is the actual objective;  being the best-on-the-day is a bonus. Not winning is not a failure. Not finishing is.


So how does an Improvement Scientist prepare for the improvement challenge?

First, we need enough intrinsic motivation to get out of bed and to invest the required time and effort.  We must have enough passion to get started and to keep going.  We must be disappointed enough with past failures to commit to preventing future ones.  We must be angry enough with the present problems to take action … not on the people … but on the problem. We must be fearful enough of the future consequences of inaction to force us to act. And we need to be excited enough by the prospect of success to reach out for it.

Second, we need some technical training.  How to improve the behaviour and performance of  a complex adaptive system is not obvious. If it were we would all know how to do it. Many of the most effective designs appear counter-intuitive at first sight.  Many of our present assumptions and beliefs are actually a barrier to change.  So we need help and guidance in identifying what assumptions we need to unlearn.

stick_woman_toe_touch_150_wht_12023Third, We need to practice what we have learned until it becomes second-nature, and almost effortless. Deceptively easy to the untrained eye.  And we develop our capability incrementally by taking on challenges of graded difficulty. Each new challenge is a bit of a stretch, and we build on what we have achieved already.  There are no short cuts or quick fixes if we want to be capable and confident at taking on BIG improvement challenges.


And we need a coach as well as a trainer.

The role of a trainer is to teach us technical skills and to develop our physical strength, stamina and resilience.

The role of the coach is to help us develop our emotional stamina and resilience.  We need to learn to manage our minds as much as our muscles. We all harbour self-defeating attitudes, beliefs and behaviours. Bad habits that trip us up and cause us to slip, fall and bruise our egos and confidence.

The psychological development is actually more important than the physical … because if is our self-defeating “can’t do” and “yes but” inner voices that sap our intrinsic motivation and prevent us crawling out of bed and getting started.

bicycle_racer_150_wht_5606The UK Cycling Team that won multiple goal medals in the 2012 Olympics did not just train hard and have the latest and best equipment. They also had the support of a very special type of coach. Dr Steve Peters … who showed them how to manage their inner Chimp … and how to develop their mental strength in synergy with their technical ability. The result was a multi-gold medal winning engine.

And we can all benefit from this wisdom just by reading The Chimp Paradox by Dr Steve Peters.


So when we take on a difficult improvement challenge, one that many have tried and failed to overcome, and if we want world class performance as the outcome … then we need to learn the hard-won lessons of the extreme athletes … and we need to model their behaviour.

Because that is what it takes to become an Improvement Science Practitioner.

Our goal is to finish each improvement race that we start … to deliver a significant and sustained improvement.  We do not need to be perfect or the best … we just need to start and finish the race.

Spring the Trap

trapped_in_question_PA_300_wht_3174[Beeeeeep] It was time for the weekly coaching chat.  Bob, a seasoned practitioner of flow science, dialled into the teleconference with Lesley.

<Bob> Good afternoon Lesley, can I suggest a topic today?

<Lesley> Hi Bob. That would be great, and I am sure you have a good reason for suggesting it.

<Bob> I would like to explore the concept of time-traps again because it something that many find confusing. Which is a shame because it is often the key to delivering surprisingly dramatic and rapid improvements; at no cost.

<Lesley> Well doing exactly that is what everyone seems to be clamouring for so it sounds like a good topic to me.  I confess that I am still not confident to teach others about time-traps.

<Bob> OK. Let us start there. Can you describe what happens when you try to teach it?

<Lesley> Well, it seems to be when I say that the essence of a time-trap is that the lead time and the flow are independent.  For example, the lead time stays the same even though the flow is changing.  That really seems to confuse people; and me too if I am brutally honest.

<Bob> OK.  Can you share the example that you use?

<Lesley> Well it depends on who I am talking to.  I prefer to use an example that they are familiar with.  If it is a doctor I might use the example of the ward round.  If it is a manager I might use the example of emails or meetings.

<Bob> Assume I am a doctor then – an urgent care physician.

<Lesley> OK.  Let us take it that I have done the 4N Chart and the  top niggle is ‘Frustration because the post-take ward round takes so long that it delays the discharge of patients who then often have to stay an extra night which then fills up the unit with waiting patients and we get blamed for blocking flow from A&E and causing A&E breaches‘.

<Bob> That sounds like a good example. What is the time-trap in that design?

<Lesley> The  post-take ward round.

<Bob> And what justification is usually offered for using that design?

<Lesley> That it is a more efficient use of the expensive doctor’s time if the whole team congregate once a day and work through all the patients admitted over the previous 24 hours.  They review the presentation, results of tests, diagnosis, management plans, response to treatment, decide the next steps and do the paperwork.

<Bob> And why is that a time-trap design?

<Lesley> Because  it does not matter if one patient is admitted or ten, the average lead time from the perspective of the patient is the same – about one day.

<Bob> Correct. So why is the doctor complaining that there are always lots of patients to see?

<Lesley> Because there are. The emergency short stay ward is usually full by the time the post take ward round happens.

<Bob> And how do you present the data that shows the lead time is independent of the flow?

<Lesley> I use a Gantt chart, but the problem I find is that there is so much variation and queue jumping it is not blindingly obvious from the Gantt chart that there is a time-trap. There is so much else clouding the picture.

<Bob>Is that where the ‘but I do not understand‘ conversation starts?

<Lesley> Yes. And that is where I get stuck too.

<Bob> OK.  The issue here is that a Gantt chart is not the ideal visualisation tool when there are lots of crossed-streams, frequently changing priorities, and many other sources of variation.  The Gantt chart gets ‘messy’.   The trick here is to use a Vitals Chart – and you can derive that from the same data you used for the Gantt chart.

<Lesley> You are right about the Gantt chart getting messy. I have seen massive wall-sized Gantt charts that are veritable works-of-art and that have taken hours to create; and everyone standing looking at it and saying ‘Wow! That is an impressive piece of work.  So what does it tell us? How does it help?

<Bob> Yes, I have experienced that too. I think what happens is that those who do the foundation training and discover the Gantt chart then try to use it to solve every flow problem – and in their enthusiasm they discount any warning advice.  Desperation drives over-inflated expectation which is often the pre-cursor to disappointment, and then disillusionment.  The Nerve Curve again.

<Lesley> But a Vitals Chart is an HCSE level technique and you said that we do not need to put everyone through HCSE training.

<Bob>That is correct. I am advocating an HCSE-in-training using a Vitals Chart to explain the concept of a time-trap so that everyone understands it well enough to see the flaw in the design.

<Lesley> Ah ha!  Yes, I see.  So what is my next step?

<Bob> I will let you answer that.

<Lesley> Um, let me think.

The outcome I want is everyone understands the concept of a time-trap well enough to feel comfortable with trying a time-trap-free design because they can see the benefits for them.

And to get that depth of understanding I need to design a table top exercise that starts with a time-trap design and generates raw data that we can use to build both a Gantt chart and the Vitals Chart; so I can point out and explain the characteristic finger-print of a time trap.

And then we can ‘test’ an alternative time-trap-free design and generate the prognostic Gantt and Vitals Chart and compare with the baseline diagnostic charts to reveal the improvement.

<Bob> That sounds like a good plan to me.  And if you do that, and your team apply it to a real improvement exercise, and you see the improvement and you share the story, then that will earn you a coveted HCSE Certificate of Competency.

<Lesley>Ah ha! Now I understand the reason you suggested this topic!  I am on the case!

Fit-4-Purpose

F4P_PillsWe all want a healthcare system that is fit for purpose.

One which can deliver diagnosis, treatment and prognosis where it is needed, when it is needed, with empathy and at an affordable cost.

One that achieves intended outcomes without unintended harm – either physical or psychological.

We want safety, delivery, quality and affordability … all at the same time.

And we know that there are always constraints we need to work within.

There are constraints set by the Laws of the Universe – physical constraints.

These are absolute,  eternal and are not negotiable.

Dr Who’s fantastical tardis is fictional. We cannot distort space, or travel in time, or go faster than light – well not with our current knowledge.

There are also constraints set by the Laws of the Land – legal constraints.

Legal constraints are rigid but they are also adjustable.  Laws evolve over time, and they are arbitrary. We design them. We choose them. And we change them when they are no longer fit for purpose.

The third limit is often seen as the financial constraint. We are required to live within our means. There is no eternal font of  limitless funds to draw from.  We all share a planet that has finite natural resources  – and ‘grow’ in one part implies ‘shrink’ in another.  The Laws of the Universe are not negotiable. Mass, momentum and energy are conserved.

The fourth constraint is perceived to be the most difficult yet, paradoxically, is the one that we have most influence over.

It is the cultural constraint.

The collective, continuously evolving, unwritten rules of socially acceptable behaviour.


Improvement requires challenging our unconscious assumptions, our beliefs and our habits – and selectively updating those that are no longer fit-4-purpose.

To learn we first need to expose the gaps in our knowledge and then to fill them.

We need to test our hot rhetoric against cold reality – and when the fog of disillusionment forms we must rip up and rewrite what we have exposed to be old rubbish.

We need to examine our habits with forensic detachment and we need to ‘unlearn’ the ones that are limiting our effectiveness, and replace them with new habits that better leverage our capabilities.

And all of that is tough to do. Life is tough. Living is tough. Learning is tough. Leading is tough. But it energising too.

Having a model-of-effective-leadership to aspire to and a peer-group for mutual respect and support is a critical piece of the jigsaw.

It is not possible to improve a system alone. No matter how smart we are, how committed we are, or how hard we work.  A system can only be improved by the system itself. It is a collective and a collaborative challenge.


So with all that in mind let us sketch a blueprint for a leader of systemic cultural improvement.

What values, beliefs, attitudes, knowledge, skills and behaviours would be on our ‘must have’ list?

What hard evidence of effectiveness would we ask for? What facts, figures and feedback?

And with our check-list in hand would we feel confident to spot an ‘effective leader of systemic cultural improvement’ if we came across one?


This is a tough design assignment because it requires the benefit of  hindsight to identify the critical-to-success factors: our ‘must have and must do’ and ‘must not have and must not do’ lists.

H’mmmm ….

So let us take a more pragmatic and empirical approach. Let us ask …

“Are there any real examples of significant and sustained healthcare system improvement that are relevant to our specific context?”

And if we can find even just one Black Swan then we can ask …

Q1. What specifically was the significant and sustained improvement?
Q2. How specifically was the improvement achieved?
Q3. When exactly did the process start?
Q4. Who specifically led the system improvement?

And if we do this exercise for the NHS we discover some interesting things.

First let us look for exemplars … and let us start using some official material – the Monitor website (http://www.monitor.gov.uk) for example … and let us pick out ‘Foundation Trusts’ because they are the ones who are entrusted to run their systems with a greater degree of capability and autonomy.

And what we discover is a league table where those FTs that are OK are called ‘green’ and those that are Not OK are coloured ‘red’.  And there are some that are ‘under review’ so we will call them ‘amber’.

The criteria for deciding this RAG rating are embedded in a large balanced scorecard of objective performance metrics linked to a robust legal contract that provides the framework for enforcement.  Safety metrics like standardised mortality ratios, flow metrics like 18-week and 4-hour target yields, quality metrics like the friends-and-family test, and productivity metrics like financial viability.

A quick tally revealed 106 FTs in the green, 10 in the amber and 27 in the red.

But this is not much help with our quest for exemplars because it is not designed to point us to who has improved the most, it only points to who is failing the most!  The league table is a name-and-shame motivation-destroying cultural-missile fuelled by DRATs (delusional ratios and arbitrary targets) and armed with legal teeth.  A projection of the current top-down, Theory-X, burn-the-toast-then-scrape-it management-of-mediocrity paradigm. Oh dear!

However,  despite these drawbacks we could make better use of this data.  We could look at the ‘reds’ and specifically at their styles of cultural leadership and compare with a random sample of all the ‘greens’ and their models for success. We could draw out the differences and correlate with outcomes: red, amber or green.

That could offer us some insight and could give us the head start with our blueprint and check-list.


It would be a time-consuming and expensive piece of work and we do not want to wait that long. So what other avenues are there we can explore now and at no cost?

Well there are unofficial sources of information … the ‘grapevine’ … the stuff that people actually talk about.

What examples of effective improvement leadership in the NHS are people talking about?

Well a little blue bird tweeted one in my ear this week …

And specifically they are talking about a leader who has learned to walk-the-improvement-walk and is now talking-the-improvement-walk: and that is Sir David Dalton, the CEO of Salford Royal.

Here is a copy of the slides from Sir David’s recent lecture at the Kings Fund … and it is interesting to compare and contrast it with the style of NHS Leadership that led up to the Mid Staffordshire Failure, and to the Francis Report, and to the Keogh Report and to the Berwick Report.

Chalk and cheese!


So if you are an NHS employee would you rather work as part of an NHS Trust where the leaders walk-DD’s-walk and talk-DD’s-talk?

And if you are an NHS customer would you prefer that the leaders of your local NHS Trust walked Sir David’s walk too?


We are the system … we get the leaders that we deserve … we make the  choice … so we need to choose wisely … and we need to make our collective voice heard.

Actions speak louder than words.  Walk works better than talk.  We must be the change we want to see.

A Little Law and Order

teamwork_puzzle_build_PA_150_wht_2341[Bing bong]. The sound heralded Lesley logging on to the weekly Webex coaching session with Bob, an experienced Improvement Science Practitioner.

<Bob> Good afternoon Lesley.  How has your week been and what topic shall we explore today?

<Lesley> Hi Bob. Well in a nutshell, the bit of the system that I have control over feels like a fragile oasis of calm in a perpetual desert of chaos.  It is hard work keeping the oasis clear of the toxic sand that blows in!

<Bob> A compelling metaphor. I can just picture it.  Maintaining order amidst chaos requires energy. So what would you like to talk about?

<Lesley> Well, I have a small shoal of FISHees who I am guiding  through the foundation shallows and they are getting stuck on Little’s Law.  I confess I am not very good at explaining it and that suggests to me that I do not really understand it well enough either.

<Bob> OK. So shall we link those two theme – chaos and Little’s Law?

<Lesley> That sounds like an excellent plan!

<Bob> OK. So let us refresh the foundation knowledge. What is Little’s Law?

<Lesley>It is a fundamental Law of process physics that relates flow, with lead time and work in progress.

<Bob> Good. And specifically?

<Lesley> Average lead time is equal to the average flow multiplied by the average work in progress.

<Bob>Yes. And what are the units of flow in your equation?

<Lesley> Ah yes! That is  a trap for the unwary. We need to be clear how we express flow. The usual way is to state it as number of tasks in a defined period of time, such as patients admitted per day.  In Little’s Law the convention is to use the inverse of that which is the average interval between consecutive flow events. This is an unfamiliar way to present flow to most people.

<Bob> Good. And what is the reason that we use the ‘interval between events’ form?

<Leslie> Because it is easier to compare it with two critically important  flow metrics … the takt time and the cycle time.

<Bob> And what is the takt time?

<Leslie> It is the average interval between new tasks arriving … the average demand interval.

<Bob> And the cycle time?

<Leslie> It is the shortest average interval between tasks departing …. and is determined by the design of the flow constraint step.

<Bob> Excellent. And what is the essence of a stable flow design?

<Lesley> That the cycle time is less than the takt time.

<Bob>Why less than? Why not equal to?

<Leslie> Because all realistic systems need some flow resilience to exhibit stable and predictable-within-limits behaviour.

<Bob> Excellent. Now describe the design requirements for creating chronically chaotic system behaviour?

<Leslie> This is a bit trickier to explain. The essence is that for chronically chaotic behaviour to happen then there must be two feedback loops – a destabilising loop and a stabilising loop.  The destabilising loop creates the chaos, the stabilising loop ensures it is chronic.

<Bob> Good … so can you give me an example of a destabilising feedback loop?

<Leslie> A common one that I see is when there is a long delay between detecting a safety risk and the diagnosis, decision and corrective action.  The risks are often transitory so if the corrective action arrives long after the root cause has gone away then it can actually destabilise the process and paradoxically increase the risk of harm.

<Bob> Can you give me an example?

<Leslie>Yes. Suppose a safety risk is exposed by a near miss.  A delay in communicating the niggle and a root cause analysis means that the specific combination of factors that led to the near miss has gone. The holes in the Swiss cheese are not static … they move about in the chaos.  So the action that follows the accumulation of many undiagnosed near misses is usually the non-specific mantra of adding yet another safety-check to the already burgeoning check-list. The longer check-list takes more time to do, and is often repeated many times, so the whole flow slows down, queues grow bigger, waiting times get longer and as pressure comes from the delivery targets corners start being cut, and new near misses start to occur; on top of the other ones. So more checks are added and so on.

<Bob> An excellent example! And what is the outcome?

<Leslie> Chronic chaos which is more dangerous, more disordered and more expensive. Lose lose lose.

<Bob> And how do the people feel who work in the system?

<Leslie> Chronically naffed off! Angry. Demotivated. Cynical.

<Bob>And those feelings are the key symptoms.  Niggles are not only symptoms of poor process design, they are also symptoms of a much deeper problem: a violation of values.

<Leslie> I get the first bit about poor design; but what is that second bit about values?

<Bob>  We all have a set of values that we learned when we were very young and that have bee shaped by life experience.  They are our source of emotional energy, and our guiding lights in an uncertain world. Our internal unconscious check-list.  So when one of our values is violated we know because we feel angry. How that anger is directed varies from person to person … some internalise it and some externalise it.

<Leslie> OK. That explains the commonest emotion that people report when they feel a niggle … frustration which is the same as anger.

<Bob>Yes.  And we reveal our values by uncovering the specific root causes of our niggles.  For example if I value ‘Hard Work’ then I will be niggled by laziness. If you value ‘Experimentation’ then you may be niggled by ‘Rigid Rules’.  If someone else values ‘Safety’ then they may value ‘Rigid Rules’ and be niggled by ‘Innovation’ which they interpret as risky.

<Leslie> Ahhhh! Yes, I see.  This explains why there is so much impassioned discussion when we do a 4N Chart! But if this behaviour is so innate then it must be impossible to resolve!

<Bob> Understanding  how our values motivate us actually helps a lot because we are naturally attracted to others who share the same values – because we have learned that it reduces conflict and stress and improves our chance of survival. We are tribal and tribes share the same values.

<Leslie> Is that why different  departments appear to have different cultures and behaviours and why they fight each other?

<Bob> It is one factor in the Silo Wars that are a characteristic of some large organisations.  But Silo Wars are not inevitable.

<Leslie> So how are they avoided?

<Bob> By everyone knowing what common purpose of the organisation is and by being clear about what values are aligned with that purpose.

<Leslie> So in the healthcare context one purpose is avoidance of harm … primum non nocere … so ‘safety’ is a core value.  Which implies anything that is felt to be unsafe generates niggles and well-intended but potentially self-destructive negative behaviour.

<Bob> Indeed so, as you described very well.

<Leslie> So how does all this link to Little’s Law?

<Bob>Let us go back to the foundation knowledge. What are the four interdependent dimensions of system improvement?

<Leslie> Safety, Flow, Quality and Productivity.

<Bob> And one measure of  productivity is profit.  So organisations that have only short term profit as their primary goal are at risk of making poor long term safety, flow and quality decisions.

<Leslie> And flow is the key dimension – because profit is just  the difference between two cash flows: income and expenses.

<Bob> Exactly. One way or another it all comes down to flow … and Little’s Law is a fundamental Law of flow physics. So if you want all the other outcomes … without the emotionally painful disorder and chaos … then you cannot avoid learning to use Little’s Law.

<Leslie> Wow!  That is a profound insight.  I will need to lie down in a darkened room and meditate on that!

<Bob> An oasis of calm is the perfect place to pause, rest and reflect.

Feel the Fear

monster_in_closet_150_wht_14500We spend a lot of time in a state of anxiety and fear. It is part and parcel of life because there are many real threats that we need to detect and avoid.

For our own safety and survival.

Unfortunately there are also many imagined threats that feel just as real and just as terrifying.

In these cases it is our fear that does the damage because it paralyses our decision making and triggers our ‘fright’ then ‘fight’ or ‘flight’ reaction.

Fear is not bad … the emotional energy it releases can be channelled into change and improvement. Just as anger can.


So we need to be able to distinguish the real fears from the imaginary ones. And we need effective strategies to defuse the imaginary ones.  Because until we do that we will find it very difficult to listen, learn, experiment, change and improve.

So let us grasp the nettle and talk about a dozen universal fears …

Fear of dying before one’s time.
Fear of having one’s basic identity questioned.
Fear of poverty or loss of one’s livelihood.
Fear of being denied one’s fundamental rights and liberties.

Fear of being unjustly accused of wrongdoing.
Fear of public humiliation.
Fear of being unjustly seen as lacking character.
Fear of being discovered as inauthentic – a fraud.

Fear of radical change.
Fear of feedback.
Fear of failure.
Fear of the unknown.

Notice that some of these fears are much ‘deeper’ than others … this list is approximately in depth order. Some relate to ‘self’; some relate to ‘others’ and all are inter-related to some degree. Fear of failure links to fear of humiliation and to fear of loss-of-livelihood.


Of these the four that are closest to the surface are the easiest to tackle … fear of radical change, fear of feedback, fear of failure, and fear of the unknown.  These are the Four Fears that block personal improvement.


Fear of the unknown is the easiest to defuse. We just open the door and look … from an emotionally safe distance so that we can run away if our worst fears are realised … which does not happen when the fear is imagined.

This is an effective strategy for defusing the emotionally and socially damaging effects of self-generated phobias.

And we find overcoming fear-of-the-unknown exhilarating … that is how theme parks and roller-coaster rides work.

First we open our eyes, we look, we see, we observe, we reflect, we learn and we convert the unknown to the unfamiliar and then to the familiar. We may not conquer our fear completely … there may be some reasonable residual anxiety … but we have learned to contain it and to control it. We have made friends with our inner Chimp. We climb aboard the roller coaster that is called ‘life’.


Fear of failure is next.  We defuse this by learning how to fail safely so that we can learn-by-doing and by that means we reduce the risk of future failures. We make frequent small safe failures in order to learn how to avoid the rare big unsafe ones!

Many people approach improvement from an academic angle. They sit on the fence. They are the reflector-theorists. And this may because they are too fearful-of-failing to learn the how-by-doing. So they are unable to demonstrate the how and their fear becomes the fear-of-fraud and the fear-of-humiliation. They are blocked from developing their pragmatist/activist capability by their self-generated fear-of-failure.

So we start small, we stay focussed, we stay inside our circle of control, and we create a safe zone where we can learn how to fail safely – first in private and later in public.

One of the most inspiring behaviours of an effective leader is the courage to learn in public and to make small failures that demonstrate their humility and humanity.

Those who insist on ‘perfect’ leaders are guaranteed to be disappointed.


And one thing that we all fail repeatedly is to ask for, to give and to receive effective feedback. This links to the deeper fear-of-humiliation.

And it is relatively easy to defuse this fear-of-feedback too … we just need a framework to support us until we find our feet and our confidence.

The key to effective feedback is to make it non-judgemental.

And that can only be done by developing our ability to step back and out of the Drama Triangle and to cultivate an I’m OK- You’re OK  mindset.

The mindset of mutual respect. Self-respect and Other-respect.

And remember that Other-respect does not imply trust, alignment, agreement, or even liking.

Sworn enemies can respect each other while at the same time not trusting, liking or agreeing with each other.

Judgement-free feedback (JFF) is a very effective technique … both for defusing fear and for developing mutual respect.

And from that foundation radical change becomes possible, even inevitable.

Wacky Language

wacky_languageAll innovative ideas are inevitably associated with new language.

Familiar words used in an unfamiliar context so that the language sounds ‘wacky’ to those in the current paradigm.

Improvement science is no different.

A problem arises when familiar words are used in a new context and therefore with a different meaning. Confusion.

So we try to avoid this cognitive confusion by inventing new words, or by using foreign words that are ‘correct’ but unfamiliar.

This use of novel and foreign language exposes us to another danger: the evolution of a clique of self-appointed experts who speak the new and ‘wacky’ language.

This self-appointed expert clique can actually hinder change because it can result yet another us-and-them division.  Another tribe. More discussion. More confusion. Less improvement.


So it is important for an effective facilitator-of-improvement to define any new language using the language of the current paradigm.  This can be achieved by sharing examples of new concepts and their language in familiar contexts and with familiar words, because we learn what words mean from their use-in-context.

For example:

The word ‘capacity’ is familiar and we all know what we think it means.  So when we link it to another familiar word, ‘demand’, then we feel comfortable that we understand what the phrase ‘demand-and-capacity’ means.

But do we?

The act of recognising a word is a use of memory or knowledge. Understanding what a word means requires more … it requires knowing the context in which the word is used.  It means understanding the concept that the word is a label for.

To a practitioner of flow science the word ‘capacity’ is confusing – because it is too fuzzy.  There are many different forms of capacity: flow-capacity, space-capacity, time-capacity, and so on.  Each has a different unit and they are not interchangeable. So the unqualified term ‘capacity’ will trigger the question:

What sort of capacity are you referring to?

[And if that is not the reaction then you may be talking to someone who has little understanding of flow science].


Then there are the foreign words that are used as new labels for old concepts.

Lean zealots seem particularly fond of peppering their monologues with Japanese words that are meaningless to anyone else but other Lean zealots.  Words like muda and muri and mura which are labels for important and useful flow science concepts … but the foreign name gives no clue as to what that essential concept is!

[And for a bit of harmless sport ask a Lean zealot to explain what these three words actually mean but only using  language that you understand. If they cannot to your satisfaction then you have exposed the niggle. And if they can then it is worth asking ‘What is the added value of the foreign language?’]

And for those who are curious to know the essential concepts that these four-letter M words refer to:

muda means ‘waste’ and refers to the effects of poor process design in terms of the extra time (and cost) required for the process to achieve its intended purpose.  A linked concept is a ‘niggle’ which is the negative emotional effect of a poor process design.

muri means ‘overburdening’ and can be illustrated  with an example.  Suppose you work in a system where there is always a big backlog of work waiting to be done … a large queue of patients in the waiting room … a big heap of notes on the trolley. That ‘burden’ generates stress and leads to other risky behaviours such as rushing, corner-cutting, deflection and overspill. It is also an outcome of poor process design, so  is avoidable.

mura means variation or uncertainty. Again an example helps. Suppose we are running an emergency service then, by definition, a we have no idea what medical problem the next patient that comes through the door will present us with. It could be trivial or life-threatening. That is unplanned and expected variation and is part of the what we need our service to be designed to handle.  Suppose when we arrive for our shift that we have no idea how many staff will be available to do the work because people phone in sick at the last minute and there is no resilience on the staffing capacity.  Our day could be calm-and-capable (and rewarding) or chaotic-and-incapable (and unrewarding).  It is the stress of not knowing that creates the emotional and cultural damage, and is the expected outcome of incompetent process design. And is avoidable.


And finally we come to words that are not foreign but are not very familiar either.

Words like praxis.

This sounds like ‘practice’ but is not spelt the same. So is the the same?

And it sounds like a medical condition called dyspraxia which means:  poor coordination of movement.

And when we look up praxis in an English dictionary we discover that one definition is:

the practice and practical side of a profession or field of study, as opposed to theory.

Ah ah! So praxis is a label for the the concept of ‘how to’ … and someone who has this ‘know how’ is called a practitioner.  That makes sense.

On deeper reflection we might then describe our poor collective process design capability as dyspraxic or uncoordinated. That feels about right too.


An improvement science practitioner (ISP) is someone who knows the science of improvement; and can demonstrate their know-how in practice; and can explain the principles that underpin their praxis using the language of the learner. Without any wacky language.

So if we want to diagnose and treat our organisational dyspraxia;

… and if we want smooth and efficient services (i.e. elimination of chaos and reduction of cost);

… and if we want to learn this know-how,  practice or praxis;

… then we could study the Foundations of Improvement Science in Healthcare (FISH);

… and we could seek the wisdom of  the growing Community of Healthcare Improvement Practitioners (CHIPs).


FISH & CHIPs … a new use for a familiar phrase?

Strength and Resilience

figure_breaking_through_wall_anim_150_wht_15036The dictionary definition of resilience is “something that is capable of  returning to its original shape after being stretched, bent or otherwise deformed“.

The term is applied to inanimate objects, to people and to systems.

A rubber ball is resilient … it is that physical property that gives it bounce.

A person is described as resilient if they are able to cope with stress without being psychologically deformed in the process.  Emotional resilience is regarded as an asset.

Systems are described as resilient when they are able to cope with variation without failing. And this use of the term is associated with another concept: strength.

Strong things can withstand a lot of force before they break. Strength is not the same as resilience.

Engineers use another term – strain – which means the amount of deformation that happens when a force is applied.

Stress is the force applied, strain is the deformation that results.

So someone who is strong and resilient will not buckle under high pressure and will absorb variation – like the suspension of you car.

But is strength-and-resilience always an asset?


Suppose some strong and resilient people finds themselves in a relentlessly changing context … one in which they actually need to adapt and evolve to survive in the long term.

How well does their highly valued strength-and-resilience asset serve them?

Not very well.

They will resist the change – they are resilient – and they will resist it for a long time – they are strong.

But the change is relentless and eventually the limit of their strength will be reached … and they snap!

And when that happens all the stored energy is suddenly released. So they do not just snap – they explode!

Just like the wall in the animation above.

The final straw that triggers the sudden failure may appear insignificant … and at any other time  it would be.

But when the pressure is really on and the system is at the limit then it can be just enough to trigger the catastrophic failure from which there is no return.


Social systems behave in exactly the same way.

Those that have demonstrated durability are both strong and resilient – but in a relentlessly changing context even they will fail eventually, and when they do the collapse is sudden and catastrophic.

Structural engineers know that catastrophic failure usually starts as a localised failure and spreads rapidly through the hyper-stressed structure; each part failing in sequence as it becomes exposed and exceeds the limit of its strength.  That is how the strong and resilient Twin Towers failed and fell on Sept 11th 2001. They were not knocked over. They were weakened to the point of catastrophic failure.

When systems are exposed to varying strains then these localised micro-fractures only occur at the peaks of stress and may not have time to spread very far. The damage is done though. The system is a bit weaker than it was before. And catastrophic failure is more likely in the future.

That is what caused the sudden loss of some of the first jet airliners which inexplicably just fell out of the sky on otherwise uneventful flights.  It took a long time for the root cause to be uncovered … the square windows.

Jet airliners fly at high altitude because it allows higher speeds and requires less fuel and so allows long distance flight over wide oceans, steppes, deserts and icecaps. But the air pressure is low at high altitude and passengers could not tolerate that; so the air pressure inside an airliner at high altitude is much higher than outside. It is a huge pressurised metal flying cannister.  And as it goes up and down the thin metal skin is exposed to high variations in stress which a metal tube can actually handle rather well … until we punch holes in it to fit windows to allow our passengers a nice view of the clouds outside.  We are used to square windows in our houses (because they are easier to make) so the original aircraft engineers naturally put square windows in the early airliners.  And that is where the problem arose … the corners of the windows concentrate the stress and over time, with enough take-offs and landings,  the metal skin at the corners of the windows will accumulate invisible micro-fractures. The metal actually fatigues. Then one day – pop – a single rivet at the corner of a square window fails and triggers the catastrophic failure of the whole structure. But the aircraft designers did not understand that process and it took quite a long time to diagnose the root cause.

The solution?

A more resilient design – use round-cornered windows that dissipate the strain rather than concentrate it.  It was that simple!


So what is the equivalent resilient design for social system? Adaptability.

But how it is possible for a system to be strong, resilient and adaptable?

The design trick is to install “emotional strain gauges” that indicate when and where the internal cultural stress is being concentrated and where the emotional strain shows first.

These emotometers will alert us to where the stresses and strains are being felt strongest and most often – rather like pain detectors. We use the patterns of information from our network of emotometers to help us focus our re-design attention to continuously adapt parts of our system to relieve the strain and to reduce the system wide risk of catastrophic failure.

And by installing emotometers across our system we will move towards a design that is strong, resilient and that continuously adapts to a changing environment.

It really is that simple.

Welcome to complex adaptive systems engineering (CASE).

A Sisyphean Nightmare

cardiogram_heart_signal_150_wht_5748[Beep] It was time for the weekly e-mentoring session so Bob switched on his laptop, logged in to the virtual meeting site and found that Lesley was already there.

<Bob> Hi Lesley. What shall we talk about today?

<Lesley> Hello Bob. Another old chestnut I am afraid. Queues.  I keep hitting the same barrier where people who are fed up with the perpetual queue chaos have only one mantra “If you want to avoid long waiting times then we need more capacity.

<Bob> So what is the problem? You know that is not the cause of chronic queues.

<Lesley> Yes, I know that mantra is incorrect – but I do not yet understand how to respectfully challenge it and how to demonstrate why it is incorrect and what the alternative is.

<Bob> OK. I understand. So could you outline a real example that we can work with.

<Lesley> Yes. Another old chestnut: the Emergency Department 4-hour breaches.

<Bob> Do you remember the Myth of Sisyphus?

<Leslie> No, I do not remember that being mentioned in the FISH course.

<Bob> Ho ho! No indeed,  it is much older. In Greek mythology Sisyphus was a king of Ephyra who was punished by the Gods for chronic deceitfulness by being compelled to roll an immense boulder up a hill, only to watch it roll back down, and then to repeat this action forever.

Sisyphus_Cartoon

<Lesley> Ah! I see the link. Yes, that is exactly how people in the ED feel.  Everyday it feels like they are pushing a heavy boulder uphill – only to have to repeat the same labour the next day. And they do not believe it can ever be any better with the resources they have.

<Bob> A rather depressing conclusion! Perhaps a better metaphor is the story in the film  “Ground Hog Day” where Bill Murray plays the part of a rather arrogant newsreader who enters a recurring nightmare where the same day is repeated, over and over. He seems powerless to prevent it.  He does eventually escape when he learns the power of humility and learns how to behave differently.

<Lesley> So the message is that there is a way out of this daily torture – if we are humble enough to learn the ‘how’.

<Bob> Well put. So shall we start?

<Lesley> Yes please!

<Bob> OK. As you know very well it is important not to use the unqualified term ‘capacity’.  We must always state if we are referring to flow-capacity or space-capacity.

<Lesley> Because they have different units and because they are intimately related to lead time by Little’s Law.

<Bob> Yes.  Little’s Law is mathematically proven Law of flow physics – it is not negotiable.

<Lesley> OK. I know that but how does it solve problem we started with?

<Bob> Little’s Law is necessary but it is not sufficient. Little’s Law relates to averages – and is therefore just the foundation. We now need to build the next level of understanding.

<Lesley> So you mean we need to introduce variation?

<Bob> Yes. And the tool we need for this is a particular form of time-series chart called a Vitals Chart.

<Lesley> And I am assuming that will show the relationship between flow, lead time and work in progress … over time ?

<Bob> Exactly. It is the temporal patterns on the Vitals Chart that point to the root causes of the Sisyphean Chaos. The flow design flaws.

<Lesley> Which are not lack of flow-capacity or space-capacity.

<Bob> Correct. If the chaos is chronic then there must already be enough space-capacity and flow-capacity. Little’s Law shows that, because if there were not the system would have failed completely a long time ago. The usual design flaw in a chronically chaotic system is one or more misaligned policies.  It is as if the system hardware is OK but the operating software is not.

<Lesley> So to escape from the Sisyphean Recurring ED 4-Hour Breach Nightmare we just need enough humility and enough time to learn how to diagnose and redesign some of our ED system operating software? Some of our own policies? Some of our own mantras?

<Bob> Yup.  And not very much actually. Most of the software is OK. We need to focus on the flaws.

<Lesley> So where do I start?

<Bob> You need to do the ISP-1 challenge that is called Brainteaser 104.  That is where you learn how to create a Vitals Chart.

<Lesley> OK. Now I see what I need to do and the reason:  understanding how to do that will help me explain it to others. And you are not going to just give me the answer.

<Bob> Correct. I am not going to just give you the answer. You will not fully understand unless you are able to build your own Vitals Chart generator. You will not be able to explain the how to others unless you demonstrate it to yourself first.

<Lesley> And what else do I need to do that?

<Bob> A spreadsheet and your raw start and finish event data.

<Lesley> But we have tried that before and neither I nor the database experts in our Performance Department could work out how to get the real time work in progress from the events – so we assumed we would have to do a head count or a bed count every hour which is impractical.

<Bob> It is indeed possible as you are about to discover for yourself. The fact that we do not know how to do something does not prove that it is impossible … humility means accepting our inevitable ignorance and being open to learning. Those who lack humility will continue to live the Sisyphean Nightmare of ED Ground Hog Day. The choice to escape is ours.

<Lesley> I choose to learn. Please send me BT104.

<Bob> It is on its way …

The Jigsaw

6MDesignJigsawSystems are made of interdependent parts that link together – rather like a jigsaw.

If pieces are distorted, missing, or in the wrong place then the picture is distorted and the system does not work as well as it could.

And if pieces of one jigsaw are mixed up with those of another then it is even more difficult to see any clear picture.

A system of improvement is just the same.

There are many improvement jigsaws each of which have pieces that fit well together and form a synergistic whole. Lean, Six Sigma, and Theory of Constraints are three well known ones.

Each improvement jigsaw evolved in a different context so naturally the picture that emerges is from a particular perspective: such as manufacturing.

So when the improvement context changes then the familiar jigsaws may not work as well: such as when we shift context from products to services, and from commercial to public.

A public service such as healthcare requires a modified improvement jigsaw … so how do we go about getting that?


One way is to ‘evolve’ an old jigsaw into a new context. That is tricky because it means adding new pieces and changing old pieces and the ‘zealots’ do not like changing their familiar jigsaw so they resist.

Another way is to ‘combine’ several old jigsaws in the hope that together they will provide enough perspectives. That is even more tricky because now you have several tribes of zealots who resist having their familiar jigsaws modified.

What about starting with a blank canvas and painting a new picture from scratch? Well it is actually very difficult to create a blank canvas for learning because we cannot erase what we already know. Our current mental model is the context we need for learning new knowledge.


So what about using a combination of the above?

What about first learning a new creative approach called design? And within that framework we can then create a new improvement jigsaw that better suits our specific context using some of the pieces of the existing ones. We may need to modify the pieces a bit to allow them to fit better together, and we may need to fashion new pieces to fill the gaps that we expose. But that is part of the fun.


6MDesignJigsawThe improvement jigsaw shown here is a new hybrid.

It has been created from a combination of existing improvement knowledge and some innovative stuff.

Pareto analysis was described by Vilfredo Pareto over 100 years ago.  So that is tried and tested!

Time-series charts were invented by Walter Shewhart almost 100 years ago. So they are tried and tested too!

The combination of Pareto and Shewhart tools have been used very effectively for over 50 years. The combination is well proven.

The other two pieces are innovative. They have different parents and different pedigrees. And different purposes.

The Niggle-o-Gram® is related to 2-by-2, FMEA and EIQ and the 4N Chart®.  It is the synthesis of them that creates a powerful lens for focussing our improvement efforts on where the greatest return-on-investment will be.

The Right-2-Left Map® is a descendent of the Design family and has been crossed with Graph Theory and Causal Network exemplars to introduce their best features.  Its purpose is to expose errors of omission.

The emergent system is synergistic … much more effective than each part individually … and more even than their linear sum.


So when learning this new Science of Improvement we have to focus first on learning about the individual pieces and we do that by seeing examples of them used in practice.  That in itself is illuminating!

As we learn about more pieces a fog of confusion starts to form and we run the risk of mutating into a ‘tool-head’.  We know about the pieces in detail but we still do not see the bigger picture.

To avoid the tool-head trap we must balance our learning wheel and ensure that we invest enough time in learning-by-doing.

Then one day something apparently random will happen that triggers a ‘click’.  Familiar pieces start to fit together in a unfamiliar way and as we see the relationships, the sequences, and the synergy – then a bigger picture will start to emerge. Slowly at first and then more quickly as more pieces aggregate.

Suddenly we feel a big CLICK as the final pieces fall into place.  The fog of confusion evaporates in the bright sunlight of a paradigm shift in our thinking.

The way forward that was previously obscured becomes clearly visible.

Ah ha!

And we are off on the next stage  of our purposeful journey of improvement.

See-and-Share

stick_figure_liking_it_150_wht_9170Common-sense tells us that to achieve system-wide improvement we need to grasp the “culture nettle”.

Most of us believe that culture drives attitudes; and attitudes drive behaviour; and behaviour drives improvement.

Therefore to get improvement we must start with culture.

And that requires effective leadership.

So our unspoken assumptions about how leaders motivate our behaviour seem rather important to understand.

In 1960 a book was published with the  title “The Human Side of Enterprise” which went right to the heart of this issue.   The author was Doug McGregor who was a social scientist and his explanation of why improvement appears to be so difficult in large organisations was a paradigm shift in thinking.  His book inspired many leaders to try a different approach – and they discovered that it worked and that enterprise-wide transformation followed.  The organisations that these early-adopters led evolved into commercial successes and more enjoyable places to work.

The new leaders learned to create the context for change – not to dictate the content.

Since then social scientists have disproved many other ‘common sense’ beliefs by applying a rigorous scientific approach and using robust evidence.

They have busted the culture-drives-change myth …. the evidence shows that it is the other way around … change drives culture.

And what changes first is behaviour.

We are social  animals …. most of us are much more likely to change our behaviour if we see other people doing the same.  We do not like being too different.

As we speak there is a new behaviour spreading – having a bucket of cold water tipped over your head as part of a challenge to raise money for charity.

This craze has a positive purpose … feeling good about helping others through donating money to a worthwhile cause … but most of us need a nudge to get us to do it.

Seeing well-known public figures having iced-water dumped on them on a picture or video shared through multiple, parallel, social media channels is a powerful cultural signal that says “This new behaviour is OK”.

Exhortation and threats are largely ineffective – fear will move people – it will scatter them, not align them. Shaming-and-blaming into behaving differently is largely ineffective too – it generates short-term anger and long-term resentment.

This is what Doug McGregor highlighted over half a century ago … and his message is timeless.

“.. the research evidence indicates quite clearly that skillful and sensitive membership behaviour is the real clue to effective group operation“.

Appreciating this critical piece of evidence opens a new door to system-wide improvement … one that we can all walk through:  Sharing improvement stories.

Sharing stories of actions that others have done and the benefits they achieved as a result; and also sharing stories of things that we ourselves have done and achieved.

Stories of small changes that delivered big benefits for others and for ourselves.  Win-win-wins. Stories of things that took little time and little effort to do because they fell inside our circles of control.

See-and-Share is an example of skillful and sensitive membership behaviour.

Effective leaders are necessary … yes … they are needed to create the context for change. It is we members who create and share the content.

Learning in Style

PARTImprovement implies learning – new experiences, new insights, new models and new ways of doing things.

So understanding the process of learning is core to the science of improvement.

What many people do not fully appreciate is that we differ in the way we prefer to learn.  These are habitual behaviours that we have acquired.

The diagram shows one model – the Honey and Mumford model that evolved from an earlier model described by Kolb.

One interesting feature of this diagram is the two dimensions – Perception and Processing which are essentially the same as the two core dimensions in the Myers-Briggs Type Index.

What the diagram above does not show so well is that the process of learning is a cycle – the clockwise direction in this diagram – Pragmatist then Activist then Reflector then Theorist and back to Pragmatist.

This is the PART sequence.  And it can start at any point … ARTP, RTPA, TPAR.

We all use all of these learning styles – but we have a preference for some more than others – our preferred learning styles are our learning comfort zones.

The large observational studies conducted in the 1980’s using the PART model revealed that most people have moderate to strong preferences for only one or two of these styles. Less than 20% have a preference for three and very few feel equally comfortable with all four.

The commonest patterns are illustrated by the left and right sides of the diagram: the Pragmatist-Activist combination and the Reflector-Theorist combination.

It is not that one is better than the other … all four are synergistic and an effective and efficient learning process requires being comfortable with using all four in a continuous sequence.

Imagine this as a wheel – an imbalance between the four parts represents a distorted wheel. So when this learning wheel ‘turns’  it delivers an emotionally bumpy ‘ride’.  Past experience of being pushed through this pain-and-gain process will tend to inhibit or even block learning completely.

So to get a more comfortable learning journey we first need to balance our PART wheel – and that implies knowing what our preferred styles are and then developing the learning styles that we use least to build our competence and confidence with them.  And that is possible because these are learned habits. With guidance, focus and practice we can all strengthen our less favoured learning ‘muscles’.

Those with a preference for planning-and-doing would focus on developing their reflection and then their abstraction skills. For example by monitoring the effects of their actions in reality and using that evidence to challenge their underlying assumptions and to generate new ‘theories’ for pragmatic experimentation. Actively seeking balanced feedback and reflecting on it is one way to do that.

Those with a preference for studying-and-abstracting would focus on developing their design and then their delivery skills and become more comfortable with experimenting to test their rhetoric against reality. Actively seeking opportunities to learn-by-doing is one way.

And by creating the context for individuals to become more productive self-learners we can see how learning organisations will follow naturally. And that is what we need to deliver system-wide improvement at scale and pace.