Business as Usual

At last the light appears to be visible at the end of the tunnel for Covid-19 in the UK. And we have our fingers-crossed that we can contemplate getting back to business as usual. What ever that is.

For the NHS, attention will no doubt return to patient access targets. The data has continued to be collected, processed and published for the last 16 months, so we are able to see the impact that the Covid-19 epidemic has had on the behaviour of the hospital-based emergency system. The Emergency Departments.

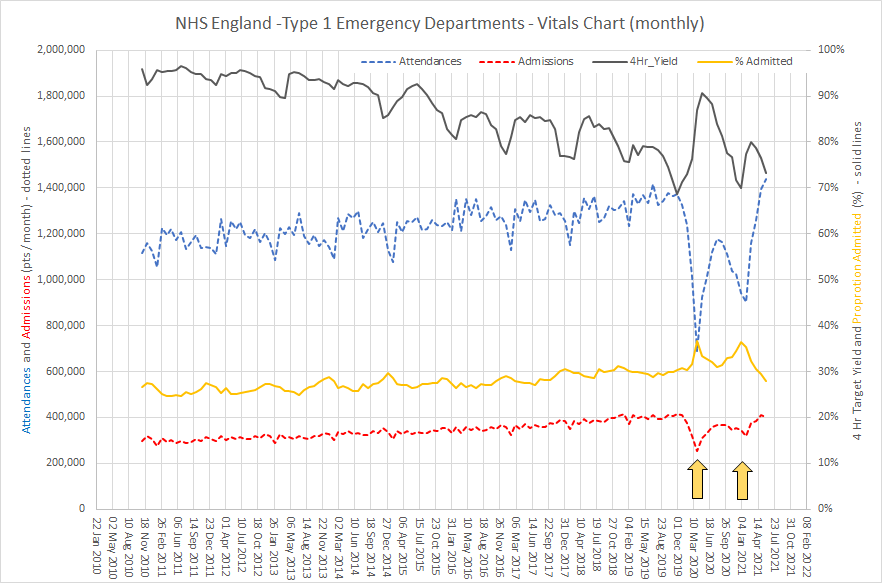
The run chart below shows the monthly reported ED metrics for England from Nov 2010.

The solid grey line is the infamous 4 Hr target – the proportion of ED attendances that are seen and admitted or discharged within 4 hours. It reveals that the progressive decline over the last decade improved during the first and second waves. And if we look for plausible causes we can see that the ED attendances dropped precipitously (blue dotted line) in both the first and second waves. We dutifully “Stayed at Home to Protect the NHS and Save Lives”.

The drop in ED attendances was accompanied by a drop in ED admissions (dotted red line) but a higher proportion of those who did attend were admitted (solid orange line) – which suggests they were sicker patients. So, all that makes sense.

And as restrictions are relaxed we can see that attendances, admissions, 4 Hr yield and proportion admitted are returning to the projected levels. Business as Usual.


Up to March 2021 the chart says that 70-75% of patients who attend ED did not need to be admitted to hospital. So this begs a raft of questions

Q1: What is that makes nearly 35,000 people per day to go to ED and then home?

Q2. How can the ED footfall drop by 50% almost overnight?

Q3. Where did those patients go for the services they were previously seeking in ED?

Q4. What were their outcomes?

Q5. What are the reasons they were choosing to go to ED rather than their GP before March 2020?

Q6. How much of the ED demand is spillover from Primary Care?

Q7: How much of the ED workload is diagnostic testing to exclude serious illness?

Q8: What lessons can be learned to mitigate the growing pressure on EDs?

Q9: Can urgent care services for this 70% be provided in a more distributed way?


And if we can do drive-thru urgent testing during Covid-19 and we can do and drive-thru urgent treatment during Covid-19 then perhaps we can do more drive-thru urgent care after Covid-19?

No Queue Vaccination

Vaccinating millions of vulnerable people in the middle of winter requires a safe, efficient and effective process.

It is not safe to have queues of people waiting outside in the freezing cold.  It is not safe to have queues of people packed into an indoor waiting area.

It is not safe to have queues full stop.

And let us face it, the NHS is not brilliant at avoiding queues.

My experience is that the commonest cause of queues in health care processes something called the Flaw of Averages.

This is where patients are booked to arrive at an interval equal to the average rate they can be done.

For example, suppose I can complete 15 vaccinations in an hour … that is one every 4 minutes on average … so common sense tells me it that the optimum way to book patients for their jab is one every four minutes.  Yes?

Actually, No.  That is the perfect design for generating a queue – and the reason is because, in reality, patients don’t arrive exactly on time, and they don’t arrive at exactly one every three minutes, and  there will be variation in exactly how long it takes me to do each jab, and unexpected things will happen.  In short, there are lots of sources of variation.  Some random and some not.  And just that variation is enough to generate a predictably unpredictable queue.  A chaotic queue.

The Laws of Physics decree it.


So, to illustrate the principles of creating a No Queue design here are some videos of a simulated mass vaccination process.

The process is quite simple – there are three steps that every patient must complete in sequence:

1) Pre-Jab Safety Check – Covid Symptoms + Identity + Clinical Check.
2) The Jab.
3) Post-Jab Safety Check (15 minutes of observation … just-in-case).

And the simplest layout of a sequential process is a linear one with the three steps in sequence.

So, let’s see what happens.

Notice where the queue develops … this tells us that we have a flow design problem.  A queue is signpost that points to the cause.

The first step is to create a “balanced load, resilient flow” design.

Hurrah! The upstream queue has disappeared and we finish earlier.  The time from starting to finishing is called the makespan and the shorter this is, the more efficient the design.

OK. Let’s scale up and have multiple, parallel, balanced-load lanes running with an upstream FIFO (first-in-first-out) buffer and a round-robin stream allocation policy (the sorting hat in the video).  Oh, and can we see some process performance metrics too please.

Good, still no queues.  We are making progress.  Only problem is our average utilisation is less than 90% and The Accountants won’t be happy with that.  Also, the Staff are grumbling that they don’t get rest breaks.

Right, let’s add a Flow Coordinator to help move things along quicker and hit that optimum 100% utilisation target that The Accountants desire.

Oh dear!  Adding a Flow Coordinator seems to made queues worse rather than better; and we’ve increased costs so The Accountants will be even less happy.  And the Staff are still grumbling because they still don’t get any regular rest breaks.  The Flow Coordinator is also grumbling because they are running around like a blue a***d fly.  Everyone is complaining now.  That was not the intended effect.  I wonder what went wrong?

But, to restore peace let’s take out the Flow Coordinator and give the Staff regular rest breaks.

H’mm.  We still seem to have queues.  Maybe we just have to live with the fact that patients have to queue.  So long as The Accountants are happy and the Staff  get their breaks then that’s as good as we can expect. Yes?

But … what if … we flex the Flow Coordinator to fill staggered Staff rest breaks and keep the flow moving calmly and smoothly all day without queues?

At last! Everyone is happy. Patients don’t wait. Staff are comfortably busy and also get regular rest breaks. And we actually have the most productive (value for money) design.

This is health care systems engineering (HCSE) in action.

PS. The Flaw of Averages error is a consequence of two widely held and invalid assumptions:

  1. That time is money. It isn’t. Time costs money but they are not interchangeable.
  2. That utilisation and efficiency are interchangeable.  They aren’t.  It is actually often possible to increase efficiency and reduce utilisation at the same time!

Second Wave

The summer holidays are over and schools are open again – sort of.

Restaurants, pubs and nightclubs are open again – sort of.

Gyms and leisure facilities are open again – sort of.

And after two months of gradual easing of social restrictions and massive expansion of test-and-trace we now have the spectre of a Second Wave looming.  It has happened in Australia, Italy, Spain and France so it can happen here.

As usual, the UK media are hyping up the general hysteria and we now also have rioting disbelievers claiming it is all a conspiracy and that re-applying local restrictions is an infringement of their liberty.

So, what is all the fuss about?

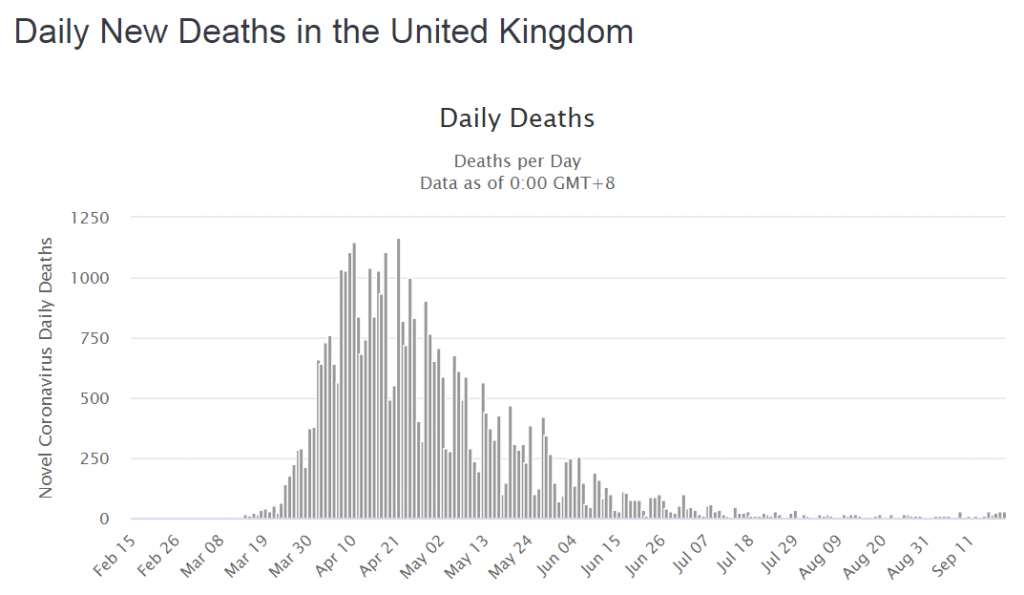
We need to side-step the gossip and get some hard data from a reliable source (i.e. not a newspaper). Here is what worldometer is sharing …

OMG!  It looks like The Second Wave is here already!  There are already as many cases now as in March and we still have the mantra “Stay At Home – Protect the NHS – Save Lives” ringing in our ears.  But something is not quite right.  No one is shouting that hospitals are bursting at the seams.  No one is reporting that the mortuaries are filling up.  Something is different.  What is going on?  We need more data.That is odd!  We can clearly see that cases and deaths went hand-in-hand in the First Wave with about 1:5 cases not making it.  But this time the deaths are not rising with the cases.

Ah ha!  Maybe that is because the virus has mutated into something much more benign and because we have got much better at diagnosing and treating this illness – the ventilators and steroids saved the day.  Hurrah!  It’s all a big fuss about nothing … we should still be able to have friends round for parties and go on pub crawls again!

But … what if there was a different explanation for the patterns on the charts above?

It is said that “data without context is meaningless” … and I’d go further than that … data without context is dangerous because if it leads to invalid conclusions and inappropriate decisions we can get well-intended actions that cause unintended harm.  Death.

So, we need to check the context of the data.

In the First Wave the availability of the antigen (swab) test was limited so it was only available to hospitals and the “daily new cases” were in patients admitted to hospital – the ones with severe enough symptoms to get through the NHS 111 telephone triage.  Most people with symptoms, even really bad ones, stayed at home to protect the NHS.  They didn’t appear in the statistics.

But did the collective sacrifice of our social lives save actual lives?

The original estimates of the plausible death toll in the UK ranged up to 500,000 from coronavirus alone (and no one knows how many more from the collateral effects of an overwhelmed NHS).  The COVID-19 body count to date is just under 50000, so putting a positive spin on that tragic statistic, 90% of the potential deaths were prevented.  The lock-down worked.  The NHS did not collapse.  The Nightingales stood ready and idle – an expensive insurance policy.  Lives were actually saved.

Why isn’t that being talked about?

And the context changed in another important way.  The antigen testing capacity was scaled up despite being mired in confusing jargon.  Who thought up the idea of calling them “pillars”?

But, if we dig about on the GOV.UK website long enough there is a definition:

So, Pillar 1 = NHS testing capacity Pillar 2 = commercial testing capacity and we don’t actually know how much was in-hospital testing and how much was in-community testing because the definitions seem to reflect budgets rather than patients.  Ever has it been thus in the NHS!

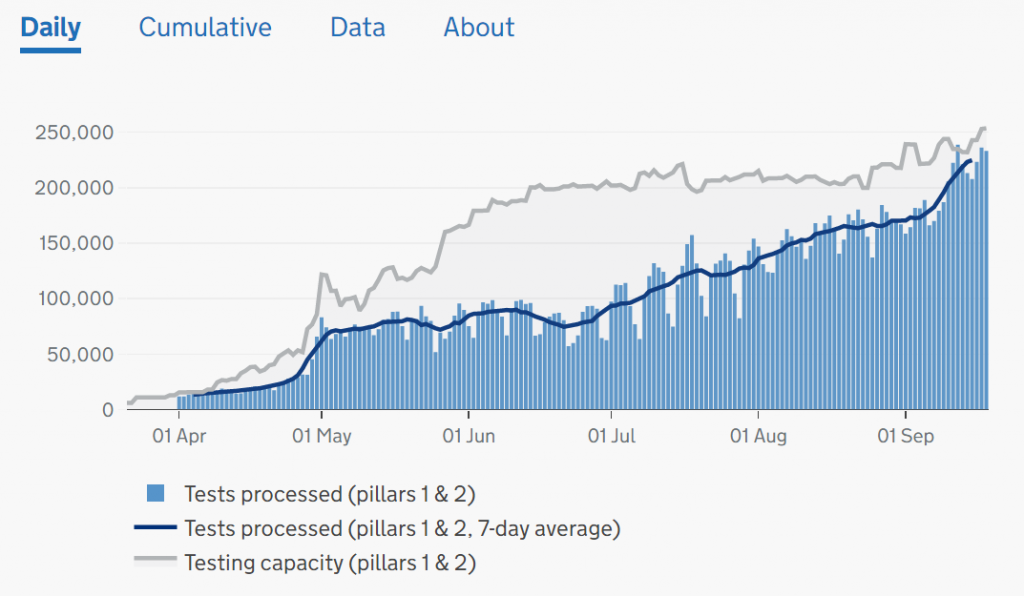
However, we can see from the chart below that testing activity (blue bars) has increased many-fold but the two testing streams (in hospital and outside hospital) are combined in one chart.  Well, it is one big pot of tax-payers cash after all and it is the same test.

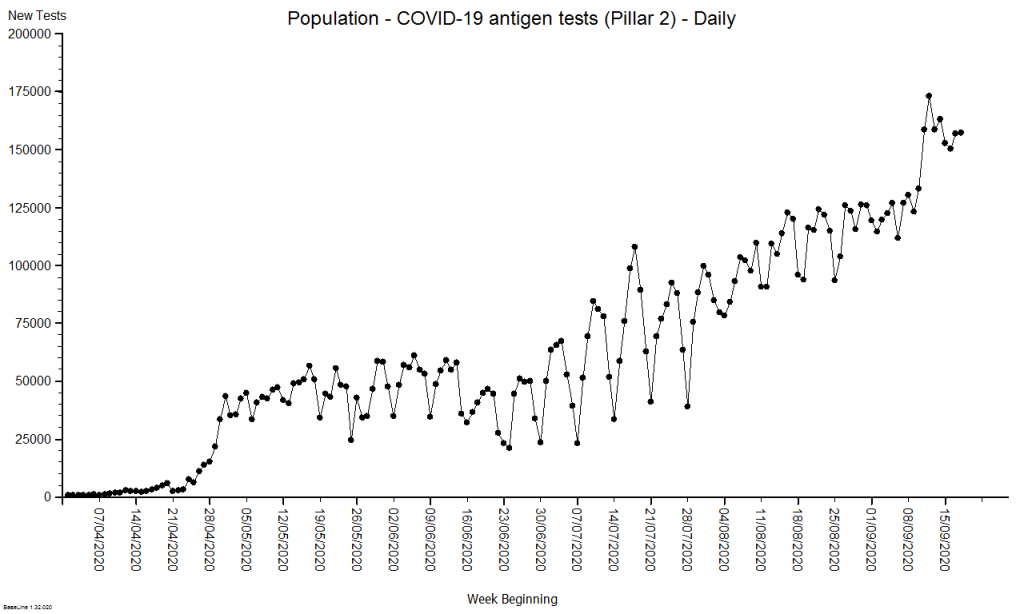
To unravel this a bit we have to dig into the website, download the raw data, and plot it ourselves.  Looking at Pillar 2 (commercial) we can see they had a late start, caught the tail of the First Wave, and then ramped up activity as the population testing caught up with the available capacity (because hospital activity has been falling since late April).

Now we can see that the increased number of positive tests could be explained by the fact that we are now testing anyone with possible COVID-19 symptoms who steps up – mainly in the community.  And we were unable to do this before because the testing capacity did not exist.

The important message is that in the First Wave we were not measuring what was happening in the community – it was happening though – it must have been.  We measured the knock on effects: hospital admissions with positive tests and deaths after positive tests.

So, to present the daily positive tests as one time-series chart that conflates both ‘pillars’ is both meaningless and dangerous and it is no surprise that people are confused.


This raises a question: Can we estimate how many people there would have been in the community in the First Wave so that we can get a sense of what the rising positive test rate means now?

The way that epidemiologists do this is to build a generic simulation of the system dynamics of an epidemic (a SEIR multi-compartment model) and then use the measured data to calibrate the this model so that it can then be used for specific prediction and planning.

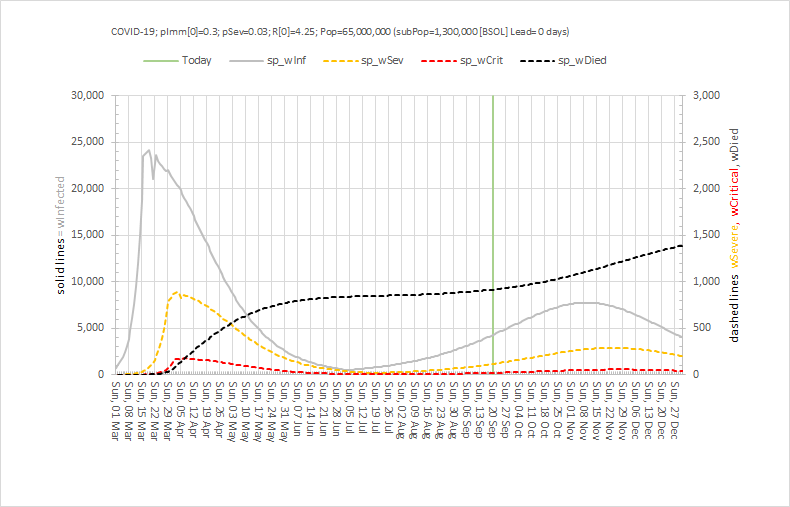
Here is an example of the output of a calibrated multi-compartment system dynamics model of the UK COVID-19 epidemic for a nominal 1.3 million population.  The compartments that are included are Susceptible, Exposed, Infectious, and Recovered (i.e. not infectious) and this model also simulates the severity of the illness i.e. Severe (in hospital), Critical (in ITU) and Died.

The difference in size of the various compartments is so great that the graph below requires two scales – the solid line (Infectious) is plotted on the left hand scale and the others are plotted on the right hand scale which is 10 times smaller.  The green line is today and the reported data up to that point has been used to calibrate the model and to estimate the historical metrics that we did not measure – such as how many people in the community were infectious (and would have tested positive).

At the peak of the First Wave, for this population of 1.3 million, the model estimates there were about 800 patients in hospital (which there were) and 24,000 patients in the community who would have tested positive if we had been able to test them.  24,000/800 = 30 which means the peak of the grey line is 30 x higher than the peak of the orange line – hence the need for the two Y-axes with a 10-fold difference in scale.

Note the very rapid rise in the number of infectious people from the beginning of March when the first UK death was announced, before the global pandemic was declared and before the UK lock-down was enacted in law and implemented.  Coronavirus was already spreading very rapidly.

Note how this rapid rise in the number of infectious people came to an abrupt halt when the UK lock-down was put into place in the third week of March 2020.  Social distancing breaks the chain of transmission from one infectious person to many other susceptible ones.

Note how the peaks of hospital admissions, critical care admissions and deaths lag after the rise in infectious people (because it takes time for the coronavirus to do its damage) and how each peak is smaller (because only about 1:30 get sick enough to need admission, and only 1:5 of hospital admissions do not survive.

Note how the fall in the infectious group was more gradual than the rise (because the lock-down was partial,  because not everyone could stay at home (essential services like the NHS had to continue), and because there was already a big pool of infectious people in the community.


So, by early July 2020 it was possible to start a gradual relaxation of the lock down and from then we can see a gradual rise in infectious people again.  But now we were measuring them because of the growing capacity to perform antigen tests in the community.  The relatively low level and the relatively slow rise are much less dramatic than what was happening in March (because of the higher awareness and the continued social distancing and use of face coverings).  But it is all too easy to become impatient and complacent.

But by early September 2020 it was clear that the number on infectious people was growing faster in the community – and then we saw hospital admissions reach a minimum and start to rise again.  And then the number if deaths reach a minimum and start to rise again.  And this evidence proves that the current level of social distancing is not enough to keep a lid on this disease.  We are in the foothills of a Second Wave.


So what do we do next?

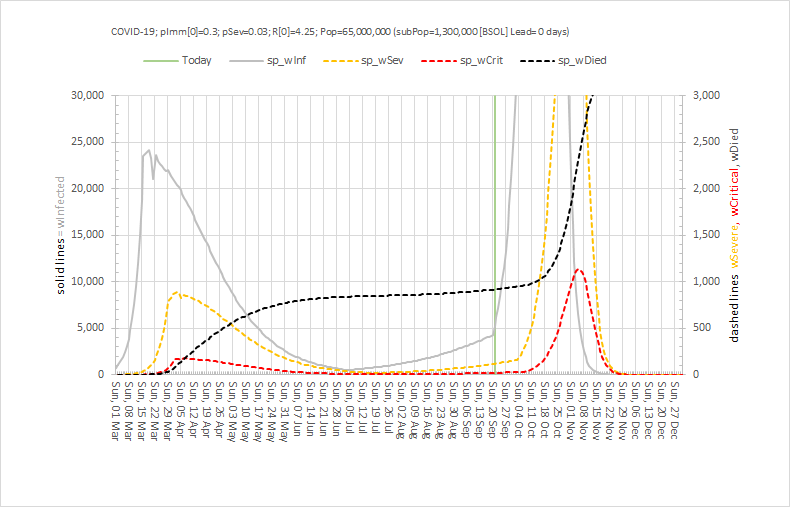
First, we must estimate the effect that the current social distancing policies are having and one way to do that would be to stop doing them and see what happens.  Clearly that is not an ethical experiment to perform given what we already know.  But, we can simulate that experiment using our calibrated SEIR model.  Here is what is predicted to happen if we went back to the pre-lockdown behaviours: There would be a very rapid spread of the virus followed by a Second Wave that would be many times bigger than the first!!  Then it would burn itself out and those who had survived could go back to some semblance of normality.  The human sacrifice would be considerable though.

So, despite the problems that the current social distancing is causing, they pale into insignificance compared to what could happen if they were dropped.

The previous model shows what is predicted would happen if we continue as we are with no further easing of restrictions and assuming people stick to them.  In short, we will have COVID-for-Christmas and it could be a very nasty business indeed as it would come at the same time as other winter-associated infectious diseases such as influenza and norovirus.

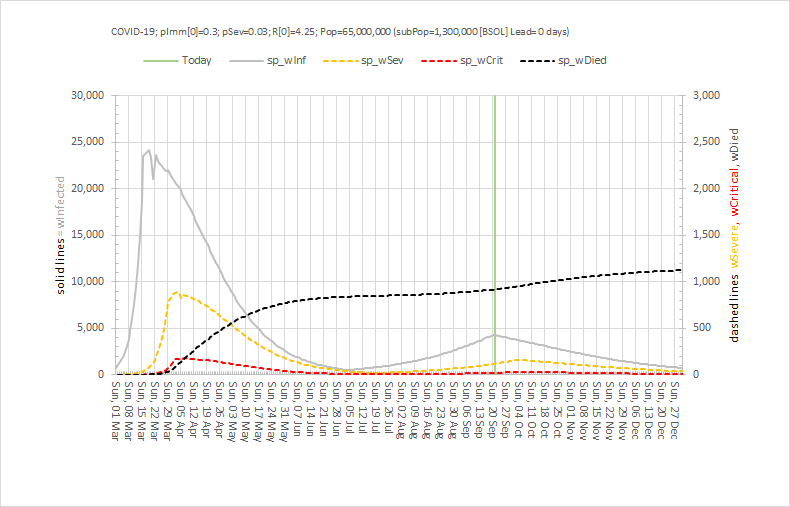
The next chart shows what could happen if we squeeze the social distancing brake a bit harder by focusing only on the behaviours that the track-and-trace-and-test system is highlighting as the key drivers of the growth infections, admissions and deaths.

What we see is an arrest of the rise of the number of infectious people (as we saw before), a small and not sustained increase in hospital admissions, then a slow decline back to the levels that were achieved in early July – and at which point it would be reasonable to have a more normal Christmas.

And another potential benefit of a bit more social distancing might be a much less problematic annual flu epidemic because that virus would also find it harder to spread – plus we have a flu vaccination which we can use to reduce that risk further.


It is not going to be easy.  We will have to sacrifice a bit of face-to-face social life for a bit longer.  We will have to measure, monitor, model and tweak the plan as we go.

And one thing we can do immediately is to share the available information in a more informative and less histrionic way than we are seeing at the moment.


Update: Sunday 1st November 2020

Yesterday the Government had to concede that the policy of regional restrictions had failed and bluffing it out and ignoring the scientific advice was, with the clarity of hindsight, an unwise strategy.

In the face of the hard evidence of rapidly rising COVID+ve hospital admissions and deaths, the decision to re-impose a national 4-week lock-down was announced.  This is the only realistic option to prevent overwhelming the NHS at a time of year that it struggles with seasonal influenza causing a peak of admissions and deaths.

Paradoxically, this year the effect of influenza may be less because social distancing will reduce the spread of that as well and also because there is a vaccination for influenza.  Many will have had their flu jab early … I certainly did.

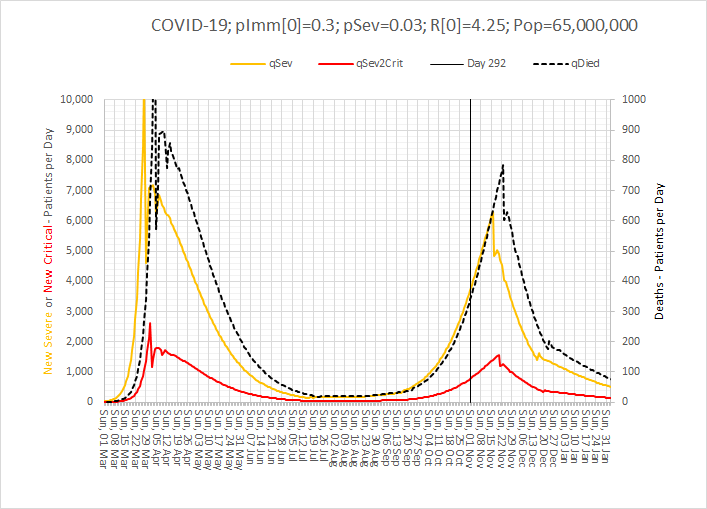
So, what is the predicted effect of a 4 week lock down?  Well, the calibrated model (also used to generate the charts above) estimates that it could indeed suppress the Second Wave and mitigate a nasty COVID-4-Christmas scenario.  But even with it the hospital admissions and associated mortality will continue to increase until the effect kicks in.

Brace yourselves.

Coronavirus


The start of a new year, decade, century or millennium is always associated with a sense of renewal and hope.  Little did we know that in January 2020 a global threat had hatched and was growing in the city of Wuhan, Hubei Province, China.  A virus of the family coronaviridae had mutated and jumped from animal to man where it found a new host and a vehicle to spread itself.   Several weeks later the World became aware of the new threat and in the West … we ignored it.  Maybe we still remember the SARS epidemic which was heralded as a potential global catastrophe but was contained in the Far East and fizzled out.  So, maybe we assumed this SARS-like virus would do the same.

It didn’t.  This mutant was different.  It caused a milder illness and unwitting victims were infectious before they were symptomatic.  And most got better on their own, so they spread the mutant to many other people.  Combine that mutant behaviour with the winter (when infectious diseases spread more easily because we spend more time together indoors), Chinese New Year and global air travel … and we have the perfect recipe for cooking up a global pandemic of a new infectious disease.  But we didn’t know that at the time and we carried on as normal, blissfully unaware of the catastrophe that was unfolding.

By February 2020 it became apparent that the mutant had escaped containment in China and was wreaking havoc in other countries – with Italy high on the casualty list.  We watched in horror at the scenes on television of Italian hospitals overwhelmed with severely ill people fighting for breath as the virus attacked their lungs.  The death toll rose sharply but we still went on our ski holidays and assumed that the English Channel and our Quarantine Policy would protect us.

They didn’t.  This mutant was different.  We now know that it had already silently gained access into the UK and was growing and spreading.  The first COVID-19 death reported in the UK was in early March 2020 and only then did we sit up and start to take notice.  This was getting too close to home.

But it was too late.  The mathematics of how epidemics spread was worked out 100 years ago, not long after the 1918 pandemic of Spanish Flu that killed tens of millions of people before it burned itself out.  An epidemic is like cancer.  By the time it is obvious it is already far advanced because the growth is not linear – it is exponential.

As a systems engineer I am used to building simulation models to reveal the complex and counter-intuitive behaviour of nonlinear systems using the methods first developed by Jay W. Forrester in the 1950’s.  And when I looked up the equations that describe epidemics (on Wikipedia) I saw that I could build a system dynamics model of a COVID-19 epidemic using no more than an Excel spreadsheet.

So I did.  And I got a nasty surprise.  Using the data emerging from China on the nature of the spread of the mutant virus, the incidence of severe illness and the mortality rate … my simple Excel model predicted that, if COVID-19 was left to run its natural course in the UK, then it would burn itself out over several months but the human cost would be 500,000 deaths and the NHS would be completely overwhelmed with a “tsunami of sick”.  And I could be one of them!  The fact that there is no treatment and no vaccine for this novel threat excluded those options.  My basic Excel model confirmed that the only effective option to mitigate this imminent catastrophe was to limit the spread of the virus through social engineering i.e. an immediate and drastic lock-down.  Everyone who was not essential to maintaining core services should “Stay at home, Protect the NHS and Save lives“.  That would become the mantra.  And others were already saying this – epidemiologists whose careers are spent planning for this sort of eventuality.  But despite all this there still seemed to be little sense of urgency, perhaps because their super-sophisticated models predicted that the peak of the UK epidemic would be in mid-June so there was time to prepare.  My basic model predicted that the peak would be in mid-April, in about 4 weeks, and that it was already too late to prevent about 50,000 deaths.

It turns out I was right.  That is exactly what happened.  By mid-March 2020 London was already seeing an exponential rise in hospital admissions, intensive care admissions and deaths and suddenly the UK woke up and panicked.  By that time I had enlisted the help of a trusted colleague who is a public health doctor and who had studied epidemiology, and together we wrote up and published the emerging story as we saw it:

An Acute Hospital Demand Surge Planning Model for the COVID-19 Epidemic using Stock-and-Flow Simulation in Excel: Part 1. Journal of Improvement Science 2020: 68; 1-20.  The link to download the full paper is here.

I also shared the draft paper with another trusted friend and colleague who works for my local clinical commissioning group (CCG) and I asked “Has the CCG a sense of the speed and magnitude of what is about to happen and has it prepared for the tsunami of sick that primary care will need to see?

What then ensued was an almost miraculous emergence of a coordinated and committed team of health care professionals and NHS managers with a single, crystal clear goal:  To design, build and deliver a high-flow, drive-through community-based facility to safely see-and-assess hundreds of patients per day with suspected COVID-19 who were too sick/worried to be managed on the phone, but not sick enough to go to A&E.  This was not a Nightingale Ward – that was a parallel, more public and much more expensive endeavour designed as a spillover for overwhelmed acute hospitals.  Our purpose was to help to prevent that and the time scale was short.  We had three weeks to do it because Easter weekend was the predicted peak of the COVID-19 surge if the national lock-down policy worked as hoped.  No one really had an accurate estimate how effective the lock-down would be and how big the peak of the tsunami of sick would rise as it crashed into the NHS.  So, we planned for the worst and hoped for the best.  The Covid Referral Centre (CRC) was an insurance policy and we deliberately over-engineered it use to every scrap of space we had been offered in a small car park on the south side of the NEC site.

The CRC needed to open by Sunday 12th April 2020 and we were ready, but the actual opening was delayed by NHS bureaucracy and politics.  It did eventually open on 22nd April 2020, just four weeks after we started, and it worked exactly as designed.  The demand was, fortunately, less than our worst case scenario; partly because we had missed the peak by 10 days and we opened the gates to a falling tide; and partly because the social distancing policy had been more effective than hoped; and partly because it takes time for risk-averse doctors to develop trust and to change their ingrained patterns of working.  A drive-thru COVID-19 see-and-treat facility? That was innovative and untested!!

The CRC expected to see a falling demand as the first wave of COVID-19 washed over, and that exactly is what happened.  So, as soon as that prediction was confirmed, the CRC was progressively repurposed to provide other much needed services such as drive-thru blood tests, drive-thru urgent care, and even outpatient clinics in the indoor part of the facility.

The CRC closed its gates to suspected COVID-19 patients on 31st July 2020, as planned and as guided by the simple Excel computer model.

This is health care systems engineering in action.

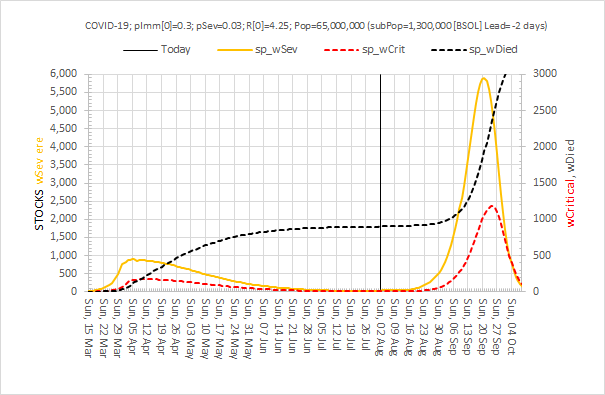
And the simple Excel model has been continuously re-calibrated as fresh evidence has emerged.  The latest version predicts that a second peak of COVID-19 (that is potentially worse than the first) will happen in late summer or autumn if social distancing is relaxed too far (see below).

But we don’t know what “too far” looks like in practical terms.  Oh, and a second wave could kick off just just when we expect the annual wave of seasonal influenza to arrive.  Or will it?  Maybe the effect of social distancing for COVID-19 in other countries will suppress the spread of seasonal flu as well?  We don’t know that either but the data of the incidence of flu from Australia certainly supports that hypothesis.

We may need a bit more health care systems engineering in the coming months. We shall see.

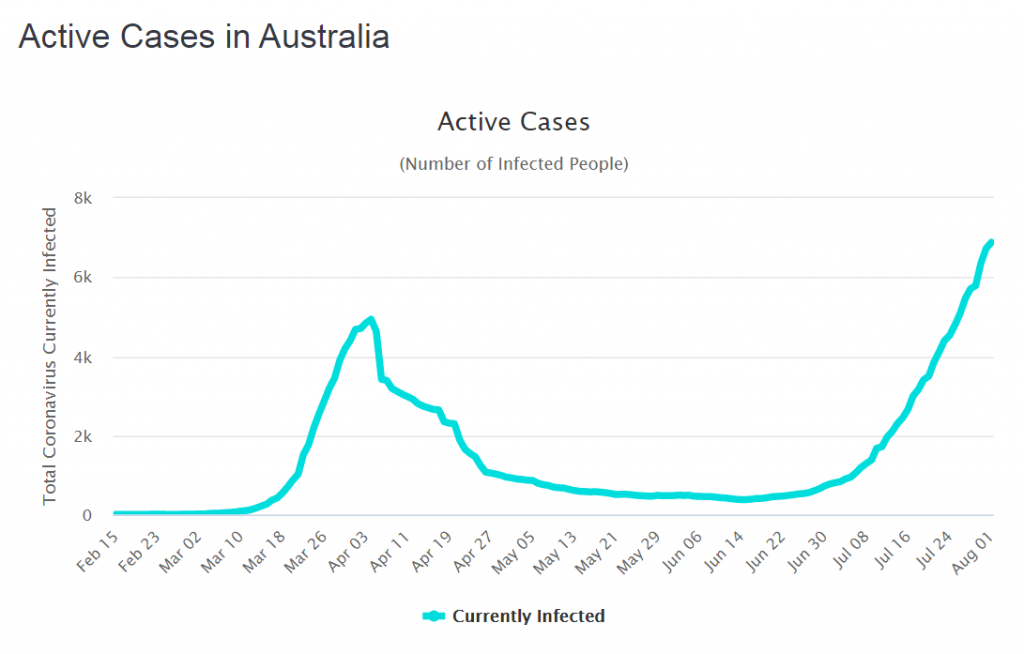
Oh, and if we are complacent enough to think a second wave could never happen in the UK … here is what is happening in Australia.

Co-Diagnosis, Co-Design and Co-Delivery

The thing that gives me the biggest buzz when it comes to improvement is to see a team share their story of what they have learned-by-doing; and what they have delivered that improves their quality of life and the quality of their patients’ experience.

And while the principles that underpin these transformations are generic, each story is unique because no two improvement challenges are exactly the same and no two teams are exactly the same.

The improvement process is not a standardised production line.  It is much more organic and adaptive experience and that requires calm, competent, consistent, compassionate and courageous facilitation.

So when I see a team share their story of what they have done and learned then I know that behind the scenes there will have been someone providing that essential ingredient.

This week a perfect example of a story like this was shared.

It is about the whole team who run the Diabetic Complex Cases Clinic at Guy’s and St. Thomas’ NHS Trust in London.  Everyone involved in the patient care was involved.  It tells the story of how they saw what might be possible and how they stepped up to the challenge of learning to apply the same principles in their world.  And it tells their story of what they diagnosed, what they designed and what they delivered.

The facilitation and support was provided Ellen Pirie who works for the Health Innovation Network (HIN) in South London and who is a Level 2 Health Care Systems Engineer.

And the link to the GSTT Diabetic Complex Clinic Team story is here.

Restoring Pride-in-Work

In 1986, Dr Don Berwick from Boston attended a 4-day seminar run by Dr W. Edwards Deming in Washington.  Dr Berwick was a 40 year old paediatrician who was also interested in health care management and improving quality and productivity.  Dr Deming was an 86 year old engineer and statistician who, when he was in his 40’s, helped the US to improve the quality and productivity of the industrial processes supporting the US and Allies in WWII.

Don Berwick describes attending the seminar as an emotionally challenging life-changing experience when he realised that his well-intended attempts to improve quality by inspection-and-correction was a counterproductive, abusive approach that led to fear, demotivation and erosion of pride-in-work.  His blinding new clarity of insight led directly to the Institute of Healthcare Improvement in the USA in the early 1990’s.

One of the tenets of Dr Deming’s theories is that the ingrained beliefs and behaviours that erode pride-in-work also lead to the very outcomes that management do not want – namely conflict between managers and workers and economic failure.

So, an explicit focus on improving pride-in-work as an early objective in any improvement exercise makes very good economic sense, and is a sign of wise leadership and competent management.


Last week a case study was published that illustrates exactly that principle in action.  The important message in the title is “restore the calm”.

One of the most demotivating aspects of health care that many complain about is the stress caused a chaotic environment, chronic crisis and perpetual firefighting.  So, anything that can restore calm will, in principle, improve motivation – and that is good for staff, patients and organisations.

The case study describes, in detail, how calm was restored in a chronically chaotic chemotherapy day unit … on Weds, June 19th 2019 … in one day and at no cost!

To say that the chemotherapy nurses were surprised and delighted is an understatement.  They were amazed to see that they could treat the same number of patients, with the same number of staff, in the same space and without the stress and chaos.  And they had time to keep up with the paperwork; and they had time for lunch; and they finished work 2 hours earlier than previously!

Such a thing was not possible surely? But here they were experiencing it.  And their patients noticed the flip from chaos-to-strangely-calm too.

The impact of the one-day-test was so profound that the nurses voted to adopt the design change the following week.  And they did.  And the restored calm has been sustained.


What happened next?

The chemotherapy nurses were able to catch up with their time-owing that had accumulated from the historical late finishes.  And the problem of high staff turnover and difficultly in recruitment evaporated.  Highly-trained chemotherapy nurses who had left because of the stressful chaos now want to come back.  Pride-in-work has been re-established.  There are no losers.  It is a win-win-win result for staff, patients and organisations.


So, how was this “miracle” achieved?

Well, first of all it was not a miracle.  The flip from chaos-to-calm was predicted to happen.  In fact, that was the primary objective of the design change.

So, how what this design change achieved?

By establishing the diagnosis first – the primary cause of the chaos – and it was not what the team believed it was.  And that is the reason they did not believe the design change would work; and that is the reason they were so surprised when it did.

So, how was the diagnosis achieved?

By using an advanced systems engineering technique called Complex Physical System (CPS) modelling.  That was the game changer!  All the basic quality improvement techniques had been tried and had not worked – process mapping, direct observation, control charts, respectful conversations, brainstorming, and so on.  The system structure was too complicated. The system behaviour was too complex (i.e. chaotic).

What CPS revealed was that the primary cause of the chaotic behaviour was the work scheduling policy.  And with that clarity of focus, the team were able to re-design the policy themselves using a simple paper-and-pen technique.  That is why it cost nothing to change.

So, why hadn’t they been able to do this before?

Because systems engineering is not a taught component of the traditional quality improvement offerings.  Healthcare is rather different to manufacturing! As the complexity of the health care system increases we need to learn the more advanced tools that are designed for this purpose.

What is the same is the principle of restoring pride-in-work and that is what Dr Berwick learned from Dr Deming in 1986, and what we saw happen on June 19th, 2019.

To read the story of how it was done click here.

Leverage Points

One of the most surprising aspects of systems is how some big changes have no observable effect and how some small changes are game-changers. Why is that?

The technical name for this phenomenon is leverage points.

When a nudge is made at a leverage point in a real system the impact is amplified – so a small cause can have a big effect.

And when a big kick is made where there is no leverage point the effort is dissipated. Like flogging a dead horse.

Other names for leverage points are triggers, buttons, catalysts, fuses etc.


The fact that there is a big effect does not imply it is a good effect.

Poking a leverage point can trigger a catastrophe just as it can trigger a celebration. It depends on how it is poked.

Perhaps that is one reason people stay away from them.

But when our heath care system performance is in decline, if we do nothing or if we act but stay away from leverage points (i.e. flog the dead horse) then we will deny ourselves the opportunity of improvement.

So, we need a way to (a) identify the leverage points and (b) know how to poke them positively and know how to not poke them into delivering a catastrophe.


Here is a couple of real examples.


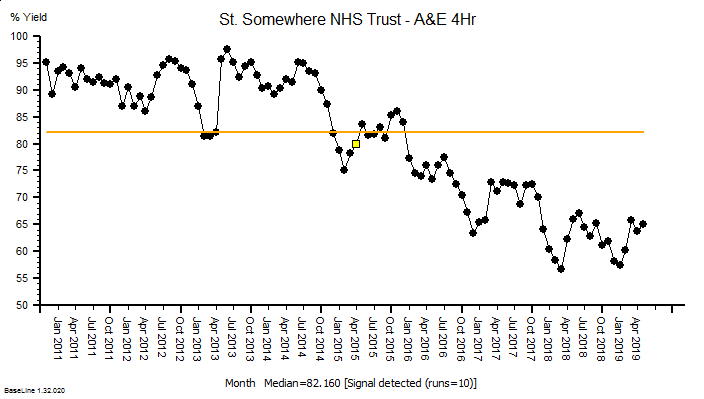
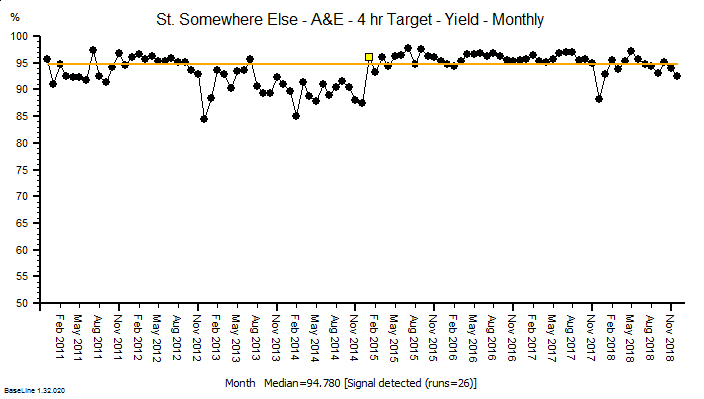
The time-series chart above shows the A&E performance of a real acute trust.  Notice the pattern as we read left-to-right; baseline performance is OKish and dips in the winters, and the winter dips get deeper but the baseline performance recovers.  In April 2015 (yellow flag) the system behaviour changes, and it goes into a steady decline with added winter dips.  This is the characteristic pattern of poking a leverage point in the wrong way … and the fact it happened at the start of the financial year suggests that Finance was involved.  Possibly triggered by a cost-improvement programme (CIP) action somewhere else in the system.  Save a bit of money here and create a bigger problem over there. That is how systems work. Not my budget so not my problem.

Here is a different example, again from a real hospital and around the same time.  It starts with a similar pattern of deteriorating performance and there is a clear change in system behaviour in Jan 2015.  But in this case the performance improves and stays improved.  Again, the visible sign of a leverage point being poked but this time in a good way.

In this case I do know what happened.  A contributory cause of the deteriorating performance was correctly diagnosed, the leverage point was identified, a change was designed and piloted, and then implemented and validated.  And it worked as predicted.  It was not a fluke.  It was engineered.


So what is the reason that the first example much more commonly seen than the second?

That is a very good question … and to answer it we need to explore the decision making process that leads up to these actions because I refuse to believe that anyone intentionally makes decisions that lead to actions that lead to deterioration in health care performance.

And perhaps we can all learn how to poke leverage points in a positive way?

Warts-and-All

This week saw the publication of a landmark paper – one that will bring hope to many.  A paper that describes the first step of a path forward out of the mess that healthcare seems to be in.  A rational, sensible, practical, learnable and enjoyable path.


This week I also came across an idea that triggered an “ah ha” for me.  The idea is that the most rapid learning happens when we are making mistakes about half of the time.

And when I say ‘making a mistake’ I mean not achieving what we predicted we would achieve because that implies that our understanding of the world is incomplete.  In other words, when the world does not behave as we expect, we have an opportunity to learn and to improve our ability to make more reliable predictions.

And that ability is called wisdom.


When we get what we expect about half the time, and do not get what we expect about the other half of the time, then we have the maximum amount of information that we can use to compare and find the differences.

Was it what we did? Was it what we did not do? What are the acts and errors of commission and omission? What can we learn from those? What might we do differently next time? What would we expect to happen if we do?


And to explore this terrain we need to see the world as it is … warts and all … and that is the subject of the landmark paper that was published this week.


The context of the paper is improvement of cancer service delivery, and specifically of reducing waiting time from referral to first appointment.  This waiting is a time of extreme anxiety for patients who have suspected cancer.

It is important to remember that most people with suspected cancer do not have it, so most of the work of an urgent suspected cancer (USC) clinic is to reassure and to relieve the fear that the spectre of cancer creates.

So, the sooner that reassurance can happen the better, and for the unlucky minority who are diagnosed with cancer, the sooner they can move on to treatment the better.

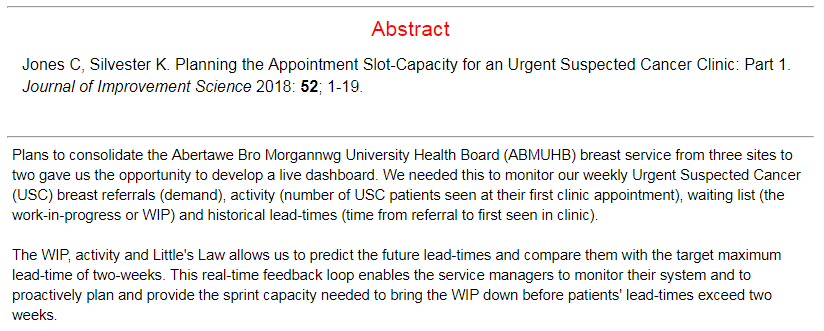
The more important paragraph in the abstract is the second one … which states that seeing the system behaviour as it is, warts-and-all,  in near-real-time, allows us to learn to make better decisions of what to do to achieve our intended outcomes. Wiser decisions.

And the reason this is the more important paragraph is because if we can do that for an urgent suspected cancer pathway then we can do that for any pathway.


The paper re-tells the first chapter of an emerging story of hope.  A story of how an innovative and forward-thinking organisation is investing in building embedded capability in health care systems engineering (HCSE), and is now delivering a growing dividend.  Much bigger than the investment on every dimension … better safety, faster delivery, higher quality and more affordability. Win-win-win-win.

The only losers are the “warts” – the naysayers and the cynics who claim it is impossible, or too “wicked”, or too difficult, or too expensive.

Innovative reality trumps cynical rhetoric … and the full abstract and paper can be accessed here.

So, well done to Chris Jones and the whole team in ABMU.

And thank you for keeping the candle of hope alight in these dark, stormy and uncertain times for the NHS.

From Push to Pull

One of the most frequent niggles that I hear from patients is the difficultly they have getting an appointment with their general practitioner.  I too have personal experience of the distress caused by the ubiquitous “Phone at 8AM for an Appointment” policy, so in June 2018 when I was approached to help a group of local practices redesign their appointment booking system I said “Yes, please!


What has emerged is a fascinating, enjoyable and rewarding journey of co-evolution of learning and co-production of an improved design.  The multi-skilled design team (MDT) we pulled together included general practitioners, receptionists and practice managers and my job was to show them how to use the health care systems engineering (HCSE) framework to diagnose, design, decide and deliver what they wanted: A safe, calm, efficient, high quality, value-4-money appointment booking service for their combined list of 50,000 patients.


This week they reached the start of the ‘decide and deliver‘ phase.  We have established the diagnosis of why the current booking system is not delivering what we all want (i.e. patients and practices), and we have assembled and verified the essential elements of an improved design.

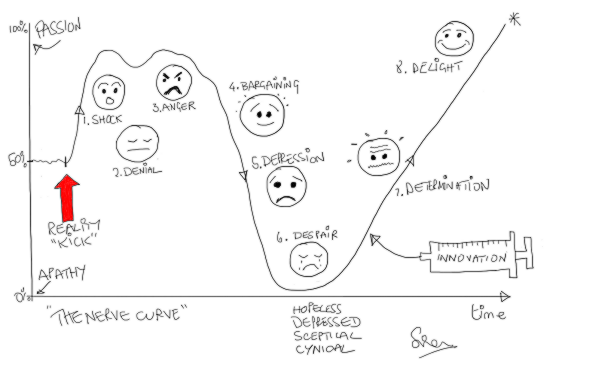
And the most important outcome for me is that the Primary Care MDT now feel confident and capable to decide what and how to deliver it themselves.   That is what I call embedded capability and achieving it is always an emotional roller coaster ride that we call The Nerve Curve.

What we are dealing with here is called a complex adaptive system (CAS) which has two main components: Processes and People.  Both are complicated and behave in complex ways.  Both will adapt and co-evolve over time.  The processes are the result of the policies that the people produce.  The policies are the result of the experiences that the people have and the explanations that they create to make intuitive sense of them.

But, complex systems often behave in counter-intuitive ways, so our intuition can actually lead us to make unwise decisions that unintentionally perpetuate the problem we are trying to solve.  The name given to this is a wicked problem.

A health care systems engineer needs to be able to demonstrate where these hidden intuitive traps lurk, and to explain what causes them and how to avoid them.  That is the reason the diagnosis and design phase is always a bit of a bumpy ride – emotionally – our Inner Chimp does not like to be challenged!  We all resist change.  Fear of the unknown is hard-wired into us by millions of years of evolution.

But we know when we are making progress because the “ah ha” moments signal a slight shift of perception and a sudden new clarity of insight.  The cognitive fog clears a bit and a some more of the unfamiliar terrain ahead comes into view.  We are learning.

The Primary Care MDT have experienced many of these penny-drop moments over the last six months and unfortunately there is not space here to describe them all, but I can share one pivotal example.


A common symptom of a poorly designed process is a chronically chaotic queue.

[NB. In medicine the term chronic means “long standing”.  The opposite term is acute which means “recent onset”].

Many assume, intuitively, that the cause of a chronically chaotic queue is lack of capacity; hence the incessant calls for ‘more capacity’.  And it appears that we have learned this reflex response by observing the effect of adding capacity – which is that the queue and chaos abate (for a while).  So that proves that lack of capacity was the cause. Yes?

Well actually it doesn’t.  Proving causality requires a bit more work.  And to illustrate this “temporal association does not prove causality trap” I invite you to consider this scenario.

I have a headache => I take a paracetamol => my headache goes away => so the cause of my headache was lack of paracetamol. Yes?

Errr .. No!

There are many contributory causes of chronically chaotic queues and lack of capacity is not one of them because the queue is chronic.  What actually happens is that something else triggers the onset of chaos which then consumes the very resource we require to avoid the chaos.  And once we slip into this trap we cannot escape!  The chaos-perpretuating behaviour we observe is called fire-fighting and the necessary resource it consumes is called resilience.


Six months ago, the Primary Care MDT believed that the cause of their chronic appointment booking chaos was a mismatch between demand and capacity – i.e. too much patient demand for the appointment capacity available.  So, there was a very reasonable resistance to the idea of making the appointment booking process easier for patients – they justifiably feared being overwhelmed by a tsunami of unmet need!

Six months on, the Primary Care MDT understand what actually causes chronic queues and that awareness has been achieved by a step-by-step process of explanation and experimentation in the relative safety of the weekly design sessions.

We played simulation games – lots of them.

One particularly memorable “Ah Ha!” moment happened when we played the Carveout Game which is done using dice, tiddly-winks, paper and coloured-pens.  No computers.  No statistics.  No queue theory gobbledygook.  No smoke-and-mirrors.  No magic.

What the Carveout Game demonstrates, practically and visually, is that an easy way to trigger the transition from calm-efficiency to chaotic-ineffectiveness is … to impose a carveout policy on a system that has been designed to achieve optimum efficiency by using averages.  Boom!  We slip on the twin banana skins of the Flaw-of-Averages and Sub-Optimisation, slide off the performance cliff, and career down the rocky slope of Chronic Chaos into the Depths of Despair – from which we cannot then escape.

This visual demonstration was a cognitive turning point for the MDT.  They now believed that there is a rational science to improvement and from there we were on the step-by-step climb to building the necessary embedded capability.


It now felt like the team were pulling what they needed to know.  I was no longer pushing.  We had flipped from push-to-pull.  That is called the tipping point.

And that is how health care systems engineering (HCSE) works.


Health care is a complex adaptive system, and what a health care systems engineer actually “designs” is a context-sensitive  incubator that nurtures the seeds of innovation that already exist in the system and encourages them to germinate, grow and become strong enough to establish themselves.

That is called “embedded improvement-by-design capability“.

And each incubator need to be different – because each system is different.  One-solution-fits-all-problems does not work here just as it does not in medicine.  Each patient is both similar and unique.


Just as in medicine, first we need to diagnose the actual cause;  second we need to design some effective solutions; third we need to decide which design to implement and fourth we need to deliver it.

But the how-to-do-it feels a bit counter-intuitive, and if it were not we would already be doing it. But the good news is that anyone can learn how to do HCSE.

Reflect and Celebrate

As we approach the end of 2018 it is a good time to look back and reflect on what has happened this year.

It has been my delight to have had the opportunity to work with front-line teams at University Hospital of North Midlands (UHNM) and to introduce them to the opportunity that health care systems engineering (HCSE) offers.

This was all part of a coordinated, cooperative strategy commissioned by the Staffordshire Clinical Commissioning Groups, and one area we were asked to look at was unscheduled care.

It was not my brief to fix problems.  I was commissioned to demonstrate how a systems engineer might approach them.  The first step was to raise awareness, then develop some belief and then grow some embedded capability – in the system itself.

The rest was up to the teams who stepped up to the challenge.  So what happened?

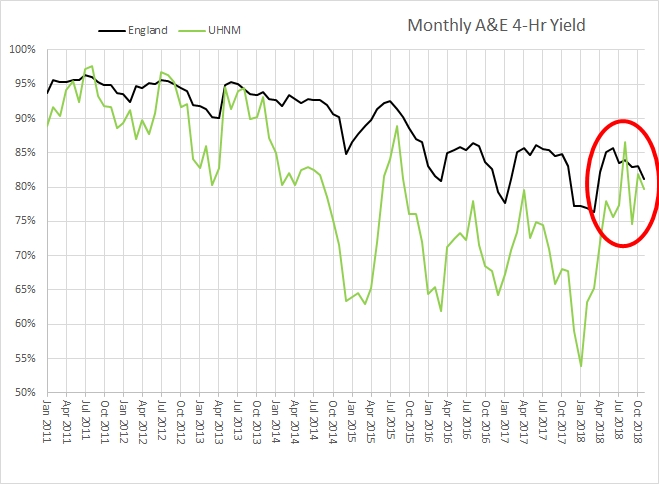
Winter is always a tough time for the NHS and especially for unscheduled care so let us have a look  and compare UHNM with NHS England as a whole – using the 4 hour A&E target yield – and over a longer time period of 7 years (so that we can see some annual cycles and longer term trends).

The A&E performance for the NHS in England as whole has been deteriorating at an accelerating pace over the 7 years.  This is a system-wide effect and there are a multitude of plausible causes.

The current UHNM system came into being at the end of 2014 with the merger of the Stafford and Stoke Hospital Trusts – and although their combined A&E performance dropped below average for England – the chart above shows that it did not continue to slide.

The NHS across the UK had a very bad time in the winter of 2017/18 – with a double whammy of sequential waves of Flu B and Flu A not helping!

But look at what happened at UHNM since Feb 2018.  Something has changed for the better and this is a macro system effect.  There has been a positive deviation from the expectation with about a 15% improvement in A&E 4-hr yield.  That is outstanding!

Now, I would say that news is worth celebrating and shouting “Well done everyone!” and then asking “How was that achieved?” and “What can we all learn that we can take forward into 2019 and build on?

Merry Christmas.

The Strangeness of LoS

It had been some time since Bob and Leslie had chatted so an email from the blue was a welcome distraction from a complex data analysis task.

<Bob> Hi Leslie, great to hear from you. I was beginning to think you had lost interest in health care improvement-by-design.

<Leslie> Hi Bob, not at all.  Rather the opposite.  I’ve been very busy using everything that I’ve learned so far.  It’s applications are endless, but I have hit a problem that I have been unable to solve, and it is driving me nuts!

<Bob> OK. That sounds encouraging and interesting.  Would you be able to outline this thorny problem and I will help if I can.

<Leslie> Thanks Bob.  It relates to a big issue that my organisation is stuck with – managing urgent admissions.  The problem is that very often there is no bed available, but there is no predictability to that.  It feels like a lottery; a quality and safety lottery.  The clinicians are clamoring for “more beds” but the commissioners are saying “there is no more money“.  So the focus has turned to reducing length of stay.

<Bob> OK.  A focus on length of stay sounds reasonable.  Reducing that can free up enough beds to provide the necessary space-capacity resilience to dramatically improve the service quality.  So long as you don’t then close all the “empty” beds to save money, or fall into the trap of believing that 85% average bed occupancy is the “optimum”.

<Leslie> Yes, I know.  We have explored all of these topics before.  That is not the problem.

<Bob> OK. What is the problem?

<Leslie> The problem is demonstrating objectively that the length-of-stay reduction experiments are having a beneficial impact.  The data seems to say they they are, and the senior managers are trumpeting the success, but the people on the ground say they are not. We have hit a stalemate.


<Bob> Ah ha!  That old chestnut.  So, can I first ask what happens to the patients who cannot get a bed urgently?

<Leslie> Good question.  We have mapped and measured that.  What happens is the most urgent admission failures spill over to commercial service providers, who charge a fee-per-case and we have no choice but to pay it.  The Director of Finance is going mental!  The less urgent admission failures just wait on queue-in-the-community until a bed becomes available.  They are the ones who are complaining the most, so the Director of Governance is also going mental.  The Director of Operations is caught in the cross-fire and the Chief Executive and Chair are doing their best to calm frayed tempers and to referee the increasingly toxic arguments.

<Bob> OK.  I can see why a “Reduce Length of Stay Initiative” would tick everyone’s Nice If box.  So, the data analysts are saying “the length of stay has come down since the Initiative was launched” but the teams on the ground are saying “it feels the same to us … the beds are still full and we still cannot admit patients“.

<Leslie> Yes, that is exactly it.  And everyone has come to the conclusion that demand must have increased so it is pointless to attempt to reduce length of stay because when we do that it just sucks in more work.  They are feeling increasingly helpless and hopeless.

<Bob> OK.  Well, the “chronic backlog of unmet need” issue is certainly possible, but your data will show if admissions have gone up.

<Leslie> I know, and as far as I can see they have not.

<Bob> OK.  So I’m guessing that the next explanation is that “the data is wonky“.

<Leslie> Yup.  Spot on.  So, to counter that the Information Department has embarked on a massive push on data collection and quality control and they are adamant that the data is complete and clean.

<Bob> OK.  So what is your diagnosis?

<Leslie> I don’t have one, that’s why I emailed you.  I’m stuck.


<Bob> OK.  We need a diagnosis, and that means we need to take a “history” and “examine” the process.  Can you tell me the outline of the RLoS Initiative.

<Leslie> We knew that we would need a baseline to measure from so we got the historical admission and discharge data and plotted a Diagnostic Vitals Chart®.  I have learned something from my HCSE training!  Then we planned the implementation of a visual feedback tool that would show ward staff which patients were delayed so that they could focus on “unblocking” the bottlenecks.  We then planned to measure the impact of the intervention for three months, and then we planned to compare the average length of stay before and after the RLoS Intervention with a big enough data set to give us an accurate estimate of the averages.  The data showed a very obvious improvement, a highly statistically significant one.

<Bob> OK.  It sounds like you have avoided the usual trap of just relying on subjective feedback, and now have a different problem because your objective and subjective feedback are in disagreement.

<Leslie> Yes.  And I have to say, getting stuck like this has rather dented my confidence.

<Bob> Fear not Leslie.  I said this is an “old chestnut” and I can say with 100% confidence that you already have what you need in your T4 kit bag?

<Leslie>Tee-Four?

<Bob> Sorry, a new abbreviation. It stands for “theory, techniques, tools and training“.

<Leslie> Phew!  That is very reassuring to hear, but it does not tell me what to do next.

<Bob> You are an engineer now Leslie, so you need to don the hard-hat of Improvement-by-Design.  Start with your Needs Analysis.


<Leslie> OK.  I need a trustworthy tool that will tell me if the planned intervention has has a significant impact on length of stay, for better or worse or not at all.  And I need it to tell me that quickly so I can decide what to do next.

<Bob> Good.  Now list all the things that you currently have that you feel you can trust.

<Leslie> I do actually trust that the Information team collect, store, verify and clean the raw data – they are really passionate about it.  And I do trust that the front line teams are giving accurate subjective feedback – I work with them and they are just as passionate.  And I do trust the systems engineering “T4” kit bag – it has proven itself again-and-again.

<Bob> Good, and I say that because you have everything you need to solve this, and it sounds like the data analysis part of the process is a good place to focus.

<Leslie> That was my conclusion too.  And I have looked at the process, and I can’t see a flaw. It is driving me nuts!

<Bob> OK.  Let us take a different tack.  Have you thought about designing the tool you need from scratch?

<Leslie> No. I’ve been using the ones I already have, and assume that I must be using them incorrectly, but I can’t see where I’m going wrong.

<Bob> Ah!  Then, I think it would be a good idea to run each of your tools through a verification test and check that they are fit-4-purpose in this specific context.

<Leslie> OK. That sounds like something I haven’t covered before.

<Bob> I know.  Designing verification test-rigs is part of the Level 2 training.  I think you have demonstrated that you are ready to take the next step up the HCSE learning curve.

<Leslie> Do you mean I can learn how to design and build my own tools?  Special tools for specific tasks?

<Bob> Yup.  All the techniques and tools that you are using now had to be specified, designed, built, verified, and validated. That is why you can trust them to be fit-4-purpose.

<Leslie> Wooohooo! I knew it was a good idea to give you a call.  Let’s get started.


[Postscript] And Leslie, together with the other stakeholders, went on to design the tool that they needed and to use the available data to dissolve the stalemate.  And once everyone was on the same page again they were able to work collaboratively to resolve the flow problems, and to improve the safety, flow, quality and affordability of their service.  Oh, and to know for sure that they had improved it.

The Disbelief to Belief Transition

The NHS appears to be descending in a frenzy of fear as the winter looms and everyone says it will be worse than last and the one before that.

And with that we-are-going-to-fail mindset, it almost certainly will.

Athletes do not start a race believing that they are doomed to fail … they hold a belief that they can win the race and that they will learn and improve even if they do not. It is a win-win mindset.

But to succeed in sport requires more than just a positive attitude.

It also requires skills, training, practice and experience.

The same is true in healthcare improvement.


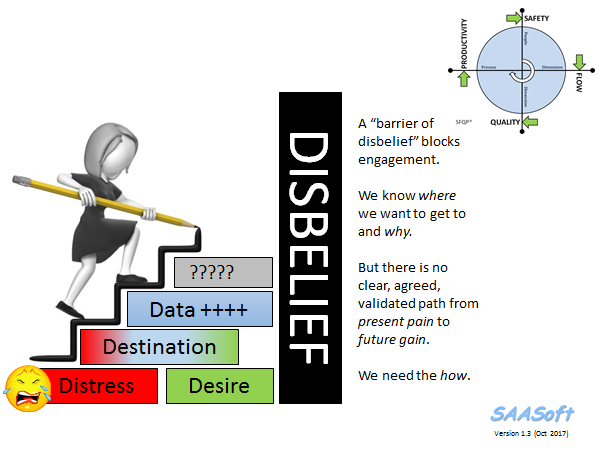
That is not the barrier though … the barrier is disbelief.

And that comes from not having experienced what it is like to take a system that is failing and transform it into one that is succeeding.

Logically, rationally, enjoyably and surprisingly quickly.

And, the widespread disbelief that it is possible is paradoxical because there are plenty of examples where others have done exactly that.

The disbelief seems to be “I do not believe that will work in my world and in my hands!

And the only way to dismantle that barrier-of-disbelief is … by doing it.


How do we do that?

The emotionally safest way is in a context that is carefully designed to enable us to surface the unconscious assumptions that are the bricks in our individual Barriers of Disbelief.

And to discard the ones that do not pass a Reality Check, and keep the ones that are OK.

This Disbelief-Busting design has been proven to be effective, as evidenced by the growing number of individuals who are learning how to do it themselves, and how to inspire, teach and coach others to as well.


So, if you would like to flip disbelief-and-hopeless into belief-and-hope … then the door is here.

Evidence-Based Co-Design

The first step in a design conversation is to understand the needs of the customer.

It does not matter if you are designing a new kitchen, bathroom, garden, house, widget, process, or system.  It is called a “needs analysis”.

Notice that it is not called a “wants analysis”.  They are not the same thing because there is often a gap between what we want (and do not want) and what we need (and do not need).

The same is true when we are looking to use a design-based approach to improve something that we already have.


This is especially true when we are improving services because the the needs and wants of a service tend to drift and shift continuously, and we are in a continual state of improvement.

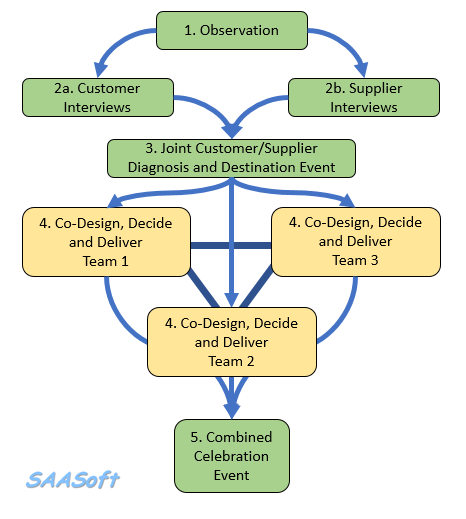
For design to work the “customers” and the “suppliers” need work collaboratively to ensure that they both get what they need.

Frustration and fragmentation are the symptoms of a combative approach where a “win” for one is a “lose” for the other (NB. In absolute terms both will end up worse off than they started so both lose in the long term.)


And there is a tried and tested process to collaborative improvement-by-design.

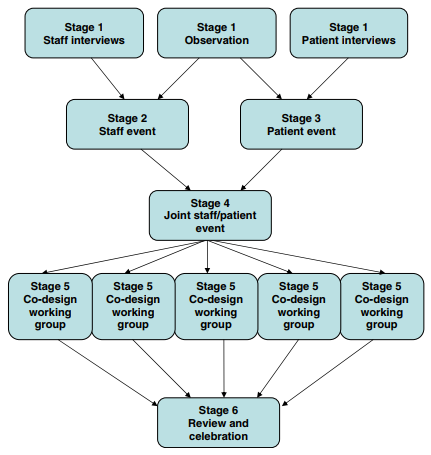
One version is called “experience based co-design” (EBCD) and it was cooked up in a health care context about 20 years ago and shown to work in a few small pilot studies.

The “experience” that triggered the projects was almost always a negative one and was associated with feelings of frustration, anxiety and disappointment. So, the EBCD case studies were more focused on helping the protagonists to share their perspectives, in the belief that will be enough to solve the problem.  And it is indeed a big step forwards.

It has a limitation though.  It assumes that the staff and patients know how to design processes so that they are fit-4-purpose, and the evidence to support that assumption is scanty.

In one pilot in mental health, the initial improvement (a fall in patient and carer complaints) was not sustained.  The reason given was that the staff who were involved in the pilot inevitably moved on, and as they did the old attitudes, beliefs and behaviours returned.


So, an improved version of EBCD is needed.  One that is based on hard evidence of what works and what does not.  One that is also focused on moving towards a future-purpose rather than just moving away from past-problems.

Let us call this improved version “Evidence-Based Co-Design“.

And we already know that by a different name:

Health Care Systems Engineering (HCSE).

O.O.D.A.

OODA is something we all do thousands of times a day without noticing.

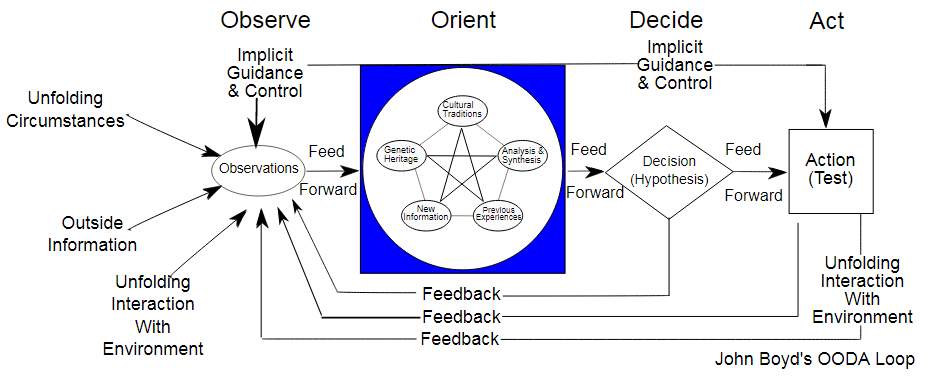
Observe – Orient – Decide – Act.

The term is attributed to Colonel John Boyd, a real world “Top Gun” who studied economics and engineering, then flew and designed fighter planes, then became a well-respected military strategist.

OODA is a continuous process of updating our mental model based on sensed evidence.

And it is a fast process because happens largely out of awareness.

This was Boyd’s point: In military terms, the protagonist that can make wiser and faster decisions are more likely to survive in combat.


And notice that it is not a simple linear sequence … it is a system … there are parallel paths and both feed-forward and feed-backward loops … there are multiple information flow paths.

And notice that the Implicit Guidance & Control links do not go through Decision – this means they operate out of awareness and are much faster.

And notice the Feed Forward links link the OODA steps – this is the conscious, sequential, future looking process that we know by another name:

Study-Adjust-Plan-Do.


We use the same process in medicine: first we study the patient and the problem they are presenting (history, examination, investigation), then we adjust our generic mental model of how the body works to the specific patient (diagnosis), then we plan and decide a course of action to achieve the intended outcome, and then we act, we do it (treatment).

But at any point we can jump back to an earlier step and we can jump forwards to a later one.  The observe, orient, decide, act modes are running in parallel.

And the more experience we have of similar problems the faster we can complete the OODA (or SAPD) work because we learn what is the most useful information to attend to, and we learn how to interpret it.

We learn the patterns and what to look for – and that speeds up the process – a lot!


This emergent learning is then re-inforced if the impact of our action matches our intent and prediction and our conscious learning is then internalised as unconscious “rules of thumb” called heuristics.


We start by thinking our way consciously and slowly … and … we finish by feeling our way unconsciously and quickly.


Until … we  encounter a novel problem that does not fit any of our learned pattern matching neural templates. When that happens, our unconscious, parallel processing, pattern-matching system alerts us with a feeling of confusion and bewilderment – and we freeze (often with fright!)

Now we have a choice: We can retreat to using familiar, learned, reactive, knee-jerk patterns of behaviour (presumably in the hope that they will work) or we can switch into a conscious learning loop and start experimenting with novel ideas.

If we start at Hypothesis then we have the Plan-Do-Study-Act cycle; where we generate novel hypotheses to explain the unexpected, and we then plan experiments to test our hypotheses; and we then study the outcome of the experiments and we then we act on our conclusions.

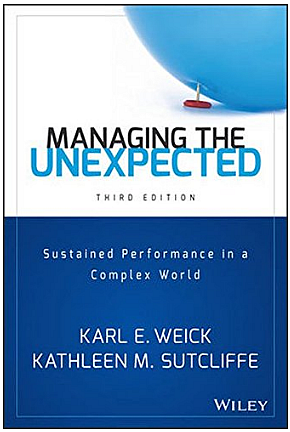
This mindful mode of thinking is well described in the book “Managing the Unexpected” by Weick and Sutcliffe and is the behaviour that underpins the success of HROs – High Reliability Organisations.

The image is of the latest (3rd edition) but the previous (2nd edition) is also worth reading.

So we have two interdependent problem solving modes – the parallel OODA system and the sequential SAPD process.

And we can switch between them depending on the context.


Which is an effective long-term survival strategy because the more we embrace the unexpected, the more opportunities we will have to switch into exploration mode and learn new patterns; and the more patterns we recognise the more efficient and effective our unconscious decision-making process will become.

This complex adaptive system behaviour has another name … Resilience.

The Rise And Fall of Quality Improvement

“Those who cannot remember the past are condemned to repeat it”.

Aphorism by George Santayana, philosopher (1863-1952).

And the history of quality improvement (QI) is worth reflecting on, because there is massive pressure to grow QI capability in health care as a way of solving some chronic problems.

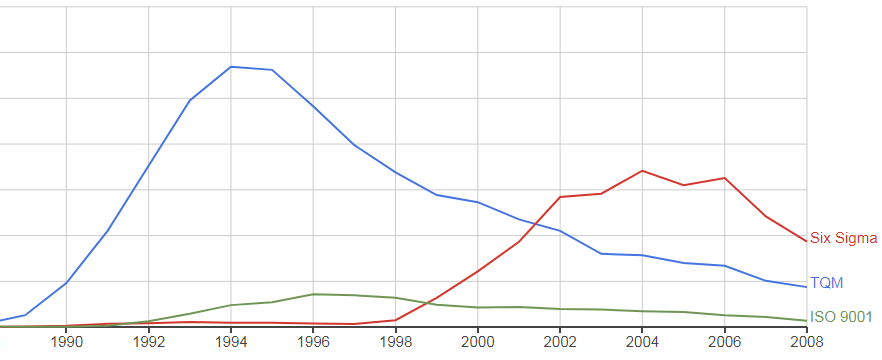
The chart below is a Google Ngram, it was generated using some phrases from the history of Quality Improvement:

TQM = the total quality management movement that grew from the work of Walter Shewhart in the 1920’s and 30’s and was “incubated” in Japan after being transplanted there by Shewhart’s student W. Edwards Deming in the 1950’s.
ISO 9001 = an international quality standard first published in 2000 that developed from the British Standards Institute (BSI) in the 1970’s via ISO 9000 that was first published in 1987.
Six Sigma = a highly statistical quality improvement / variation reduction methodology that originated in the rapidly expanding semiconductor industry in the 1980’s.

The rise-and-fall pattern is characteristic of how innovations spread; there is a long lag phase, then a short accelerating growth phase, then a variable plateau phase and then a long, decelerating decline phase.

It is called a life-cycle. It is how complex adaptive systems behave. It is how innovations spread. It is expected.

So what happened?

Did the rise of TQM lead to the rise of ISO 9000 which triggered the development of the Six Sigma methodology?

It certainly looks that way.

So why is Six Sigma “dying”?  Or is it just being replaced by something else?


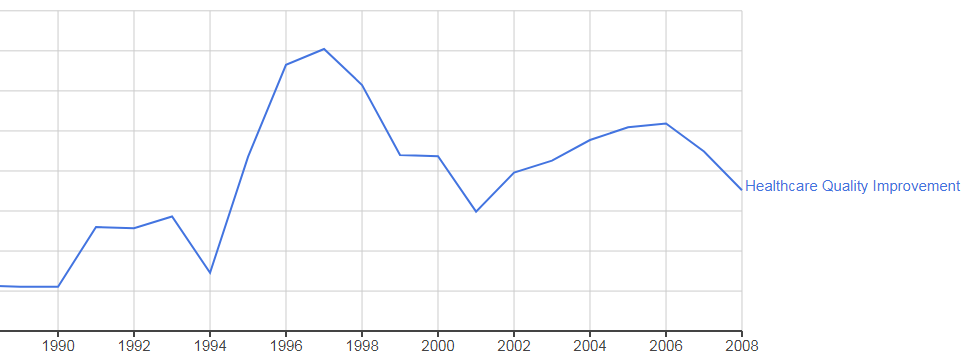
This is the corresponding Ngram for “Healthcare Quality Improvement” which seems to sit on the timeline in about the same place as ISO 9001 and that suggests that it was triggered by the TQM movement. 

The Institute of Healthcare Improvement (IHI) was officially founded in 1991 by Dr Don Berwick, some years after he attended one of the Deming 4-day workshops and had an “epiphany”.

Don describes his personal experience in a recent plenary lecture (from time 01:07).  The whole lecture is worth watching because it describes the core concepts and principles that underpin QI.


So given the fact that safety and quality are still very big issues in health care – why does the Ngram above suggest that the use of the term Quality Improvement does not sustain?

Will that happen in healthcare too?

Could it be that there is more to improvement than just a focus on safety (reducing avoidable harm) and quality (improving patient experience)?

Could it be that flow and productivity are also important?

The growing angst that permeates the NHS appears to be more focused on budgets and waiting-time targets (4 hrs in A&E, 63 days for cancer, 18 weeks for scheduled care, etc.).

Mortality and Quality hardly get a mention any more, and the nationally failed waiting time targets are being quietly dropped.

Is it too politically embarrassing?

Has the NHS given up because it firmly believes that pumping in even more money is the only solution, and there isn’t any more in the tax pot?


This week another small band of brave innovators experienced, first-hand, the application of health care systems engineering (HCSE) to a very common safety, flow, quality and productivity problem …

… a chronically chaotic clinic characterized by queues and constant calls for more capacity and cash.

They discovered that the queues, delays and chaos (i.e. a low quality experience) were not caused by lack of resources; they were caused by flow design.  They were iatrogenic.  And when they applied the well-known concepts and principles of scheduling design, they saw the queues and chaos evaporate, and they measured a productivity increase of over 60%.

OMG!

Improvement science is more than just about safety and quality, it is about flow and productivity as well; because we all need all four to improve at the same time.

And yes we need all the elements of Deming’s System of Profound Knowledge (SoPK), but need more than that.  We need to harness the knowledge of the engineers who for centuries have designed and built buildings, bridges, canals, steam engines, factories, generators, telephones, automobiles, aeroplanes, computers, rockets, satellites, space-ships and so on.

We need to revisit the legacy of the engineers like Watt, Brunel, Taylor, Gantt, Erlang, Ford, Forrester and many, many others.

Because it does appear to be possible to improve-by-design as well as to improve-by-desire.

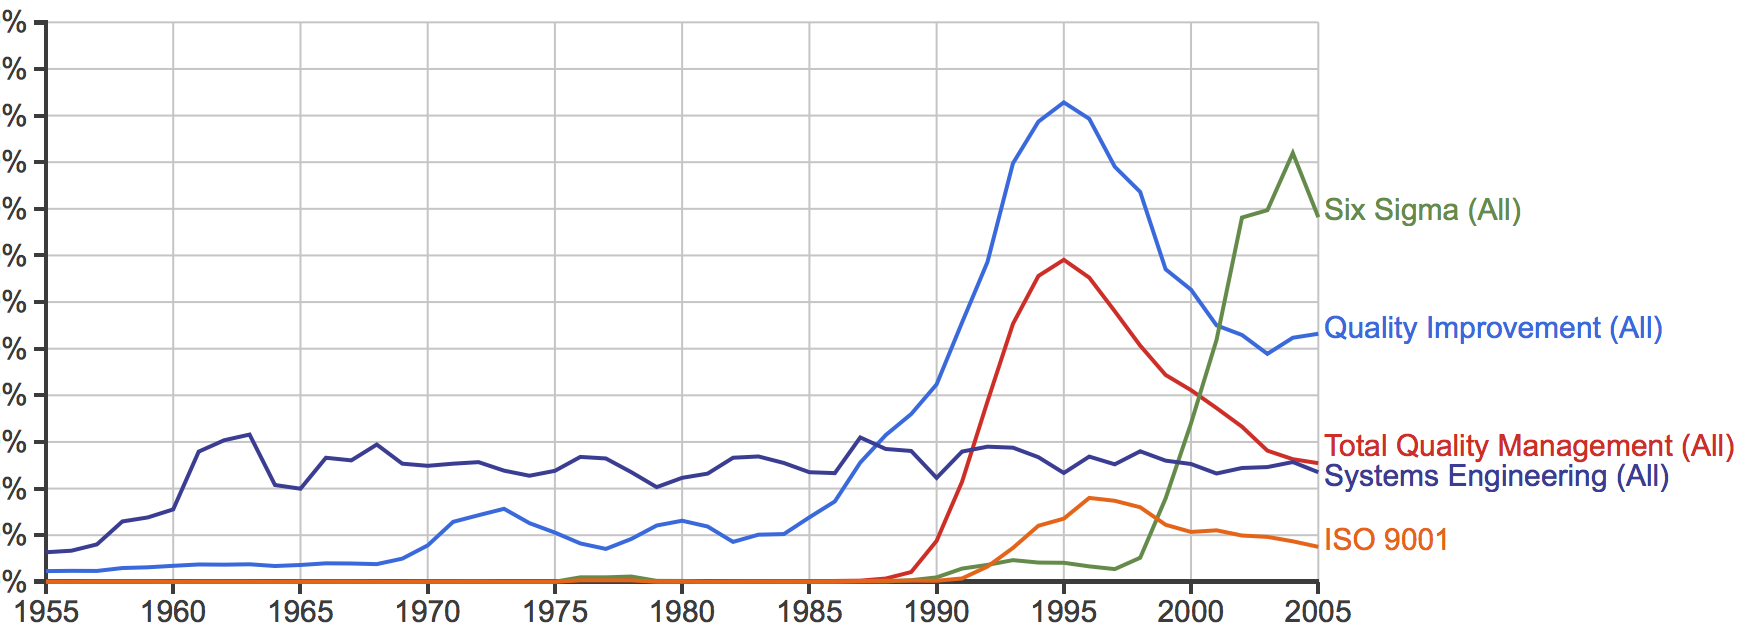
Here is the Ngram with “Systems Engineering” (SE) added and the time line extended back to 1955.  Note the rise of SE in the 1950’s and 1960’s and note that it has sustained.

That pattern of adoption only happens when something is proven to be fit-4-purpose, and is valued and is respected and is promoted and is taught.

What opportunity does systems engineering offer health care?

That question is being actively explored … here.

One Step Back; Two Steps Forward.

This week a ground-breaking case study was published.

It describes how a team in South Wales discovered how to make the flows visible in a critical part of their cancer pathway.

Radiology.

And they did that by unintentionally falling into a trap!  A trap that many who set out to improve health care services fall into.  But they did not give up.  They sought guidance and learned some profound lessons.

Part 1 of their story is shared here.


One lesson they learned is that, as they take on more complex improvement challenges, they need to be equipped with the right tools, and they need to be trained to use them, and they need to have practiced using them.

Another lesson they learned is that making the flows in a system visible is necessary before the current behaviour of the system can be understood.

And they learned that they needed a clear diagnosis of how the current system is not performing; before they can attempt to design an intervention to deliver the intended improvement.

They learned how the Study-Plan-Do cycle works, and they learned the reason it starts with “Study”, and not with “Plan”.


They tried, failed, took one step back, asked, listened and learned.


Then with their new knowledge, more advanced tools, and deeper understanding they took two steps forward; diagnosed problem, designed an intervention, and delivered a significant improvement.

And visualised just how significant.

Then they shared Part 2 of their story … here.


Eating the Elephant in the Room

The Elephant in the Room is an English-language metaphorical idiom for an obvious problem or risk no one wants to discuss.

An undiscussable topic.

And the undiscussability is also undiscussable.

So the problem or risk persists.

And people come to harm as a result.

Which is not the intended outcome.

So why do we behave this way?

Perhaps it is because the problem looks too big and too complicated to solve in one intuitive leap, and we give up and label it a “wicked problem”.


The well known quote “When eating an elephant take one bite at a time” is attributed to Creighton Abrams, a US Chief of Staff.


It says that even seemingly “impossible” problems can be solved so long as we proceed slowly and carefully, in small steps, learning as we go.

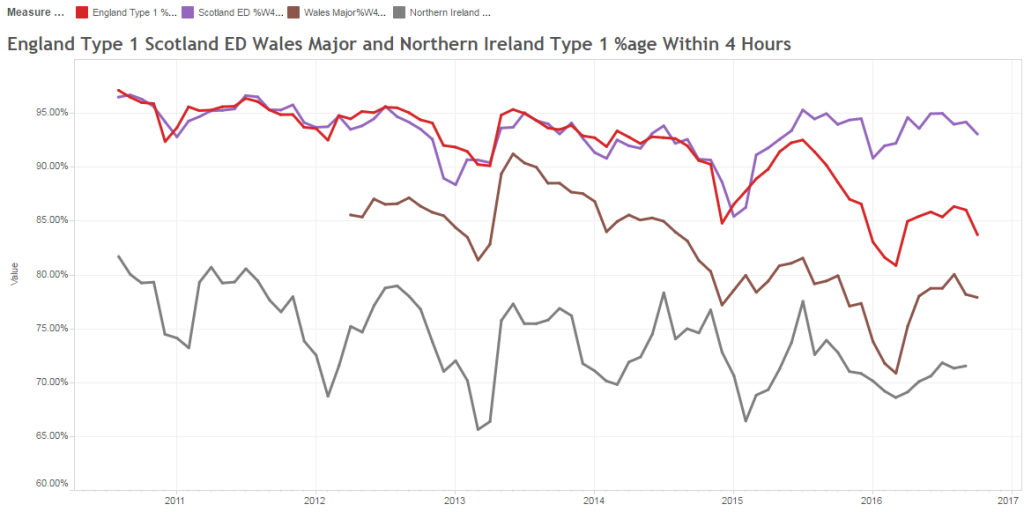
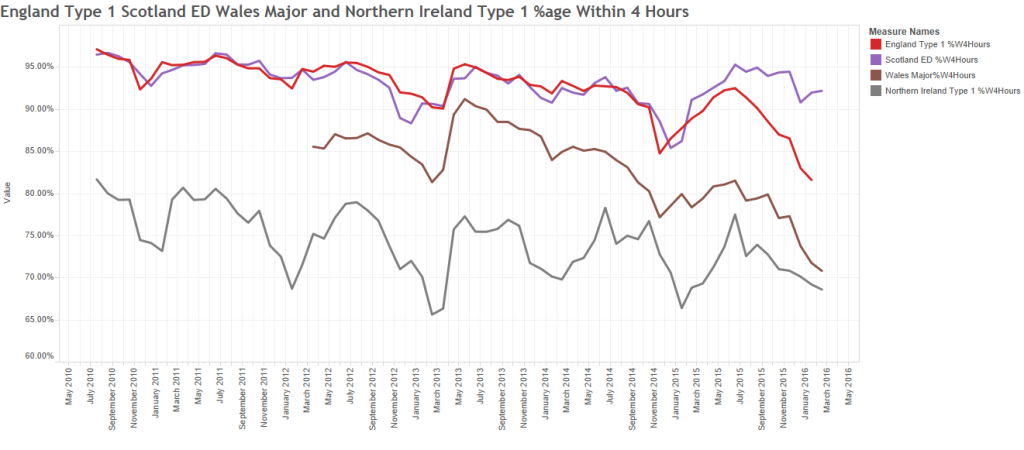
And the continued decline of the NHS UK Unscheduled Care performance seems to be an Elephant-in-the-Room problem, as shown by the monthly A&E 4-hour performance over the last 10 years and the fact that this chart is not published by the NHS.

Red = England, Brown=Wales, Grey=N.Ireland, Purple=Scotland.


This week I experienced a bite of this Elephant being taken and chewed on.

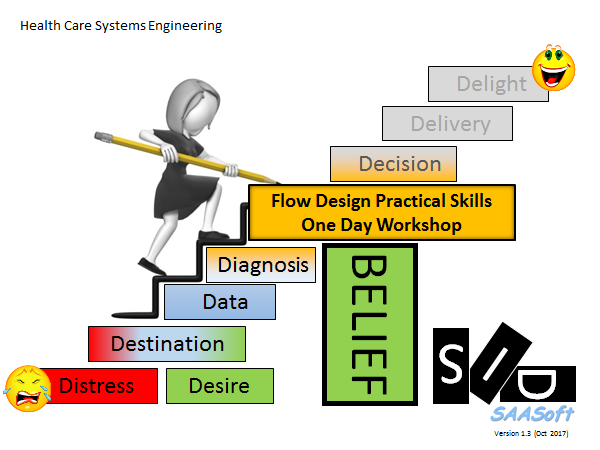
The context was a Flow Design – Practical Skills – One Day Workshop and the design challenge posed to the eager delegates was to improve the quality and efficiency of a one stop clinic.

A seemingly impossible task because the delegates reported that the queues, delays and chaos that they experienced in the simulated clinic felt very realistic.

Which means that this experience is accepted as inevitable, and is impossible to improve without more resources, but financial cuts prevent that, so we have to accept the waits.


At the end of the day their belief had been shattered.

The queues, delays and chaos had evaporated and the cost to run the new one stop clinic design was actually less than the old one.

And when we combined the quality metrics with the cost metrics and calculated the measured improvement in productivity; the answer was over 70%!

The delegates experienced it all first-hand. They did the diagnosis, design, and delivery using no more than squared-paper and squeaky-pen.

And at the end they were looking at a glaring mismatch between their rhetoric and the reality.

The “impossible to improve without more money” hypothesis lay in tatters – it had been rationally, empirically and scientifically disproved.

I’d call that quite a big bite out of the Elephant-in-the-Room.


So if you have a healthy appetite for Elephant-in-the-Room challenges, and are not afraid to try something different, then there is a whole menu of nutritious food-for-thought at a FISH&CHIPs® practical skills workshop.

Unknown-Knowns

This is the now-infamous statement that Donald Rumsfeld made at a Pentagon Press Conference which triggered some good-natured jesting from the assembled journalists.

But there is a problem with it.

There is a fourth combination that he does not mention: the Unknown-Knowns.

Which is a shame because they are actually the most important because they cause the most problems.  Avoidable problems.


Suppose there is a piece of knowledge that someone knows but that someone else does not; then we have an unknown-known.

None of us know everything and we do not need to, because knowledge that is of no value to us is irrelevant for us.

But what happens when the unknown-known is of value to us, and more than that; what happens when it would be reasonable for someone else to expect us to know it; because it is our job to know.


A surgeon would be not expected to know a lot about astronomy, but they would be expected to know a lot about anatomy.


So, what happens if we become aware that we are missing an important piece of knowledge that is actually already known?  What is our normal human reaction to that discovery?

Typically, our first reaction is fear-driven and we express defensive behaviour.  This is because we fear the potential loss-of-face from being exposed as inept.

From this sudden shock we then enter a characteristic emotional pattern which is called the Nerve Curve.

After the shock of discovery we quickly flip into denial and, if that does not work then to anger (i.e. blame).  We ignore the message and if that does not work we shoot the messenger.


And when in this emotionally charged state, our rationality tends to take a back seat.  So, if we want to benefit from the discovery of an unknown-known, then we have to learn to bite-our-lip, wait, let the red mist dissipate, and then re-examine the available evidence with a cool, curious, open mind.  A state of mind that is receptive and open to learning.


Recently, I was reminded of this.


The context is health care improvement, and I was using a systems engineering framework to conduct some diagnostic data analysis.

My first task was to run a data-completeness-verification-test … and the data I had been sent did not pass the test.  There was some missing.  It was an error of omission (EOO) and they are the hardest ones to spot.  Hence the need for the verification test.

The cause of the EOO was an unknown-known in the department that holds the keys to the data warehouse.  And I have come across this EOO before, so I was not surprised.

Hence the need for the verification test.

I was not annoyed either.  I just fed back the results of the test, explained what the issue was, explained the cause, and they listened and learned.


The implication of this specific EOO is quite profound though because it appears to be ubiquitous across the NHS.

To be specific it relates to the precise details of how raw data on demand, activity, length of stay and bed occupancy is extracted from the NHS data warehouses.

So it is rather relevant to just about everything the NHS does!

And the error-of-omission leads to confusion at best; and at worst … to the following sequence … incomplete data =>  invalid analysis => incorrect conclusion => poor decision => counter-productive action => unintended outcome.

Does that sound at all familiar?


So, if would you like to learn about this valuable unknown-known is then I recommend the narrative by Dr Kate Silvester, an internationally recognised expert in healthcare improvement.  In it, Kate re-tells the story of her emotional roller-coaster ride when she discovered she was making the same error.


Here is the link to the full abstract and where you can download and read the full text of Kate’s excellent essay, and help to make it a known-known.

That is what system-wide improvement requires – sharing the knowledge.

The Storyboard

This week about thirty managers and clinicians in South Wales conducted two experiments to test the design of the Flow Design Practical Skills One Day Workshop.

Their collective challenge was to diagnose and treat a “chronically sick” clinic and the majority had no prior exposure to health care systems engineering (HCSE) theory, techniques, tools or training.

Two of the group, Chris and Jat, had been delegates at a previous ODWS, and had then completed their Level-1 HCSE training and real-world projects.

They had seen it and done it, so this experiment was to test if they could now teach it.

Could they replicate the “OMG effect” that they had experienced and that fired up their passion for learning and using the science of improvement?

Continue reading “The Storyboard”

The Pathology of Variation I

In medical training we have to learn about lots of things. That is one reason why it takes a long time to train a competent and confident clinician.

First, we learn the anatomy (structure) and the physiology (function) of the normal, healthy human.

Then we learn about how this amazingly complicated system can go wrong.  We learn about pathology.  And we do that so that we understand the relationship between the cause (disease) and the effect (symptoms and signs).

Then we learn about diagnostics – which is how to work backwards from the effects to the most likely cause(s).

And only then can we learn about therapeutics – the design and delivery of a treatment plan that we are confident will relieve the symptoms by curing the disease.

And we learn about prevention – how to avoid some illnesses (and delay others) by addressing the root causes earlier.  Much of the increase in life expectancy over the last 200 years has come from prevention, not from cure.


The NHS is an amazingly complicated system, and it too can go wrong.  It can exhibit a wide spectrum of symptoms and signs; medical errors, long delays, unhappy patients, burned-out staff, and overspent budgets.

But, there is no equivalent training in how to diagnose and treat a sick health care system.  And this is not acceptable, especially given that the knowledge of how to do this is already available.

It is called complex adaptive systems engineering (CASE).


Before the Renaissance, the understanding of how the body works was primitive and it was believed that illness was “God’s Will” so we had to just grin-and-bear (and pray).

The Scientific Revolution brought us new insights, profound theories, innovative techniques and capability-extending tools.  And the impact has been dramatic.  Those who do have access to this knowledge live better and longer than ever.  Those who do not … do not.

Our current understanding of how health care systems work is, to be blunt, medieval.  The current approaches amount to little more than rune reading, incantations and the prescription of purgatives and leeches.  And the impact is about as effective.

So we need to study the anatomy, physiology, pathology, diagnostics and therapeutics of complex adaptive systems like healthcare.  And most of all we need to understand how to prevent catastrophes happening in the first place.  We need the NHS to be immortal.


And this week a prototype complex adaptive pathology training system was tested … and it employed cutting-edge 21st Century technology: Pasta Twizzles.

The specific topic under scrutiny was variation.  A brain-bending concept that is usually relegated to the mystical smoke-and-mirrors world called “Sadistics”.

But no longer!

The Mists-of-Jargon and Fog-of-Formulae were blown away as we switched on the Fan-of-Facilitation and the Light-of-Simulation and went exploring.

Empirically. Pragmatically.


And what we discovered was jaw-dropping.

A disease called the “Flaw of Averages” and its malignant manifestation “Carveoutosis“.


And with our new knowledge we opened the door to a previously hidden world of opportunity and improvement.

Then we activated the Laser-of-Insight and evaporated the queues and chaos that, before our new understanding, we had accepted as inevitable and beyond our understanding or control.

They were neither. And never had been. We were deluding ourselves.

Welcome to the Resilient Design – Practical Skills – One Day Workshop.

Validation Test: Passed.

Diagnose-Design-Deliver

A story was shared this week.

A story of hope for the hard-pressed NHS, its patients, its staff and its managers and its leaders.

A story that says “We can learn how to fix the NHS ourselves“.

And the story comes with evidence; hard, objective, scientific, statistically significant evidence.


The story starts almost exactly three years ago when a Clinical Commissioning Group (CCG) in England made a bold strategic decision to invest in improvement, or as they termed it “Achieving Clinical Excellence” (ACE).

They invited proposals from their local practices with the “carrot” of enough funding to allow GPs to carve-out protected time to do the work.  And a handful of proposals were selected and financially supported.

This is the story of one of those proposals which came from three practices in Sutton who chose to work together on a common problem – the unplanned hospital admissions in their over 70’s.

Their objective was clear and measurable: “To reduce the cost of unplanned admissions in the 70+ age group by working with hospital to reduce length of stay.

Did they achieve their objective?

Yes, they did.  But there is more to this story than that.  Much more.


One innovative step they took was to invest in learning how to diagnose why the current ‘system’ was costing what it was; then learning how to design an improvement; and then learning how to deliver that improvement.

They invested in developing their own improvement science skills first.

They did not assume they already knew how to do this and they engaged an experienced health care systems engineer (HCSE) to show them how to do it (i.e. not to do it for them).

Another innovative step was to create a blog to make it easier to share what they were learning with their colleagues; and to invite feedback and suggestions; and to provide a journal that captured the story as it unfolded.

And they measured stuff before they made any changes and afterwards so they could measure the impact, and so that they could assess the evidence scientifically.

And that was actually quite easy because the CCG was already measuring what they needed to know: admissions, length of stay, cost, and outcomes.

All they needed to learn was how to present and interpret that data in a meaningful way.  And as part of their IS training,  they learned how to use system behaviour charts, or SBCs.


By Jan 2015 they had learned enough of the HCSE techniques and tools to establish the diagnosis and start to making changes to the parts of the system that they could influence.


Two years later they subjected their before-and-after data to robust statistical analysis and they had a surprise. A big one!

Reducing hospital mortality was not a stated objective of their ACE project, and they only checked the mortality data to be sure that it had not changed.

But it had, and the “p=0.014” part of the statement above means that the probability that this 20.0% reduction in hospital mortality was due to random chance … is less than 1.4%.  [This is well below the 5% threshold that we usually accept as “statistically significant” in a clinical trial.]

But …

This was not a randomised controlled trial.  This was an intervention in a complicated, ever-changing system; so they needed to check that the hospital mortality for comparable patients who were not their patients had not changed as well.

And the statistical analysis of the hospital mortality for the ‘other’ practices for the same patient group, and the same period of time confirmed that there had been no statistically significant change in their hospital mortality.

So, it appears that what the Sutton ACE Team did to reduce length of stay (and cost) had also, unintentionally, reduced hospital mortality. A lot!


And this unexpected outcome raises a whole raft of questions …


If you would like to read their full story then you can do so … here.

It is a story of hunger for improvement, of humility to learn, of hard work and of hope for the future.

Dr Hyde and Mr Jekyll

Dr Bill Hyde was already at the bar when Bob Jekyll arrived.

Bill and  Bob had first met at university and had become firm friends, but their careers had diverged and it was only by pure chance that their paths had crossed again recently.

They had arranged to meet up for a beer and to catch up on what had happened in the 25 years since they had enjoyed the “good old times” in the university bar.

<Dr Bill> Hi Bob, what can I get you? If I remember correctly it was anything resembling real ale. Will this “Black Sheep” do?

<Bob> Hi Bill, Perfect! I’ll get the nibbles. Plain nuts OK for you?

<Dr Bill> My favourite! So what are you up to now? What doors did your engineering degree open?

<Bob> Lots!  I’ve done all sorts – mechanical, electrical, software, hardware, process, all except civil engineering. And I love it. What I do now is a sort of synthesis of all of them.  And you? Where did your medical degree lead?

<Dr Bill> To my hearts desire, the wonderful Mrs Hyde, and of course to primary care. I am a GP. I always wanted to be a GP since I was knee-high to a grasshopper.

<Bob> Yes, you always had that “I’m going to save the world one patient at a time!” passion. That must be so rewarding! Helping people who are scared witless by the health horror stories that the media pump out.  I had a fright last year when I found a lump.  My GP was great, she confidently diagnosed a “hernia” and I was all sorted in a matter of weeks with a bit of nifty day case surgery. I was convinced my time had come. It just shows how damaging the fear of the unknown can be!

<Dr Bill> Being a GP is amazingly rewarding. I love my job. But …

<Bob> But what? Are you alright Bill? You suddenly look really depressed.

<Dr Bill> Sorry Bob. I don’t want to be a damp squib. It is good to see you again, and chat about the old days when we were teased about our names.  And it is great to hear that you are enjoying your work so much. I admit I am feeling low, and frankly I welcome the opportunity to talk to someone I know and trust who is not part of the health care system. If you know what I mean?

<Bob> I know exactly what you mean.  Well, I can certainly offer an ear, “a problem shared is a problem halved” as they say. I can’t promise to do any more than that, but feel free to tell me the story, from the beginning. No blood-and-guts gory details though please!

<Dr Bill> Ha! “Tell me the story from the beginning” is what I say to my patients. OK, here goes. I feel increasingly overwhelmed and I feel like I am drowning under a deluge of patients who are banging on the practice door for appointments to see me. My intuition tells me that the problem is not the people, it is the process, but I can’t seem to see through the fog of frustration and chaos to a clear way forward.

<Bob> OK. I confess I know nothing about how your system works, so can you give me a bit more context.

<Dr Bill> Sorry. Yes, of course. I am what is called a single-handed GP and I have a list of about 1500 registered patients and I am contracted to provide primary care for them. I don’t have to do that 24 x 7, the urgent stuff that happens in the evenings and weekends is diverted to services that are designed for that. I work Monday to Friday from 9 AM to 5 PM, and I am contracted to provide what is needed for my patients, and that means face-to-face appointments.

<Bob> OK. When you say “contracted” what does that mean exactly?

<Dr Bill> Basically, the St. Elsewhere’s® Practice is like a small business. It’s annual income is a fixed amount per year for each patient on the registration list, and I have to provide the primary care service for them from that pot of cash. And that includes all the costs, including my income, our practice nurse, and the amazing Mrs H. She is the practice receptionist, manager, administrator and all-round fixer-of-anything.

<Bob> Wow! What a great design. No need to spend money on marketing, research, new product development, or advertising! Just 100% pure service delivery of tried-and-tested medical know-how to a captive audience for a guaranteed income. I have commercial customers who would cut off their right arms for an offer like that!

<Dr Bill> Really? It doesn’t feel like that to me. It feels like the more I offer, the more the patients expect. The demand is a bottomless well of wants, but the income is capped and my time is finite!

<Bob> H’mm. Tell me more about the details of how the process works.

<Dr Bill> Basically, I am a problem-solving engine. Patients phone for an appointment, Mrs H books one, the patient comes at the appointed time, I see them, and I diagnose and treat the problem, or I refer on to a specialist if it’s more complicated. That’s basically it.

<Bob> OK. Sounds a lot simpler than 99% of the processes that I’m usually involved with. So what’s the problem?

<Dr Bill> I don’t have enough capacity! After all the appointments for the day are booked Mrs H has to say “Sorry, please try again tomorrow” to every patient who phones in after that.  The patients who can’t get an appointment are not very happy and some can get quite angry. They are anxious and frustrated and I fully understand how they feel. I feel the same.

<Bob> We will come back to what you mean by “capacity”. Can you outline for me exactly how a patient is expected to get an appointment?

<Dr Bill> We tell them to phone at 8 AM for an appointment, there is a fixed number of bookable appointments, and it is first-come-first-served.  That is the only way I can protect myself from being swamped and is the fairest solution for patients.  It wasn’t my idea; it is called Advanced Access. Each morning at 8 AM we switch on the phones and brace ourselves for the daily deluge.

<Bob> You must be pulling my leg! This design is a batch-and-queue phone-in appointment booking lottery!  I guess that is one definition of “fair”.  How many patients get an appointment on the first attempt?

<Dr Bill> Not many.  The appointments are usually all gone by 9 AM and a lot are to people who have been trying to get one for several days. When they do eventually get to see me they are usually grumpy and then spring the trump card “And while I’m here doctor I have a few other things that I’ve been saving up to ask you about“. I help if I can but more often than not I have to say, “I’m sorry, you’ll have to book another appointment!“.

<Bob> I’m not surprised you patients are grumpy. I would be too. And my recollection of seeing my GP with my scary lump wasn’t like that at all. I phoned at lunch time and got an appointment the same day. Maybe I was just lucky, or maybe my GP was as worried as me. But it all felt very calm. When I arrived there was only one other patient waiting, and I was in and out in less than ten minutes – and mightily reassured I can tell you! It felt like a high quality service that I could trust if-and-when I needed it, which fortunately is very infrequently.

<Dr Bill> I dream of being able to offer a service like that! I am prepared to bet you are registered with a group practice and you see whoever is available rather than your own GP. Single-handed GPs like me who offer the old fashioned personal service are a rarity, and I can see why. We must be suckers!

<Bob> OK, so I’m starting to get a sense of this now. Has it been like this for a long time?

<Dr Bill> Yes, it has. When I was younger I was more resilient and I did not mind going the extra mile.  But the pressure is relentless and maybe I’m just getting older and grumpier.  My real fear is I end up sounding like the burned-out cynics that I’ve heard at the local GP meetings; the ones who crow about how they are counting down the days to when they can retire and gloat.

<Bob> You’re the same age as me Bill so I don’t think either of us can use retirement as an exit route, and anyway, that’s not your style. You were never a quitter at university. Your motto was always “when the going gets tough the tough get going“.

<Dr Bill> Yeah I know. That’s why it feels so frustrating. I think I lost my mojo a long time back. Maybe I should just cave in and join up with the big group practice down the road, and accept the inevitable loss of the personal service. They said they would welcome me, and my list of 1500 patients, with open arms.

<Bob> OK. That would appear to be an option, or maybe a compromise, but I’m not sure we’ve exhausted all the other options yet.  Tell me, how do you decide how long a patient needs for you to solve their problem?

<Dr Bill> That’s easy. It is ten minutes. That is the time recommended in the Royal College Guidelines.

<Bob> Eh? All patients require exactly ten minutes?

<Dr Bill> No, of course not!  That is the average time that patients need.  The Royal College did a big survey and that was what most GPs said they needed.

<Bob> Please tell me if I have got this right.  You work 9-to-5, and you carve up your day into 10-minute time-slots called “appointments” and, assuming you are allowed time to have lunch and a pee, that would be six per hour for seven hours which is 42 appointments per day that can be booked?

<Dr Bill> No. That wouldn’t work because I have other stuff to do as well as see patients. There are only 25 bookable 10-minute appointments per day.

<Bob> OK, that makes more sense. So where does 25 come from?

<Dr Bill> Ah! That comes from a big national audit. For an average GP with and average  list of 1,500 patients, the average number of patients seeking an appointment per day was found to be 25, and our practice population is typical of the national average in terms of age and deprivation.  So I set the upper limit at 25. The workload is manageable but it seems to generate a lot of unhappy patients and I dare not increase the slots because I’d be overwhelmed with the extra workload and I’m barely coping now.  I feel stuck between a rock and a hard place!

<Bob> So you have set the maximum slot-capacity to the average demand?

<Dr Bill> Yes. That’s OK isn’t it? It will average out over time. That is what average means! But it doesn’t feel like that. The chaos and pressure never seems to go away.


There was a long pause while Bob mulls over what he had heard, sips his pint of Black Sheep and nibbles on the dwindling bowl of peanuts.  Eventually he speaks.


<Bob> Bill, I have some good news and some not-so-good news and then some more good news.

<Dr Bill> Oh dear, you sound just like me when I have to share the results of tests with one of my patients at their follow up appointment. You had better give me the “bad news sandwich”!

<Bob> OK. The first bit of good news is that this is a very common, and easily treatable flow problem.  The not-so-good news is that you will need to change some things.  The second bit of good news is that the changes will not cost anything and will work very quickly.

<Dr Bill> What! You cannot be serious!! Until ten minutes ago you said that you knew nothing about how my practice works and now you are telling me that there is a quick, easy, zero cost solution.  Forgive me for doubting your engineering know-how but I’ll need a bit more convincing than that!

<Bob> And I would too if I were in your position.  The clues to the diagnosis are in the story. You said the process problem was long-standing; you said that you set the maximum slot-capacity to the average demand; and you said that you have a fixed appointment time that was decided by a subjective consensus.  From an engineering perspective, this is a perfect recipe for generating chronic chaos, which is exactly the symptoms you are describing.

<Dr Bill> Is it? OMG. You said this is well understood and resolvable? So what do I do?

<Bob> Give me a minute.  You said the average demand is 25 per day. What sort of service would you like your patients to experience? Would “90% can expect a same day appointment on the first call” be good enough as a starter?

<Dr Bill> That would be game changing!  Mrs H would be over the moon to be able to say “Yes” that often. I would feel much less anxious too, because I know the current system is a potentially dangerous lottery. And my patients would be delighted and relieved to be able to see me that easily and quickly.

<Bob> OK. Let me work this out. Based on what you’ve said, some assumptions, and a bit of flow engineering know-how; you would need to offer up to 31 appointments per day.

<Dr Bill> What! That’s impossible!!! I told you it would be impossible! That would be another hour a day of face-to-face appointments. When would I do the other stuff? And how did you work that out anyway?

<Bob> I did not say they would have to all be 10-minute appointments, and I did not say you would expect to fill them all every day. I did however say you would have to change some things.  And I did say this is a well understood flow engineering problem.  It is called “resilience design“. That’s how I was able to work it out on the back of this Black Sheep beer mat.

<Dr Bill> H’mm. That is starting to sound a bit more reasonable. What things would I have to change? Specifically?

<Bob> I’m not sure what specifically yet.  I think in your language we would say “I have taken a history, and I have a differential diagnosis, so next I’ll need to examine the patient, and then maybe do some tests to establish the actual diagnosis and to design and decide the treatment plan“.

<Dr Bill> You are learning the medical lingo fast! What do I need to do first? Brace myself for the forensic rubber-gloved digital examination?

<Bob> Alas, not yet and certainly not here. Shall we start with the vital signs? Height, weight, pulse, blood pressure, and temperature? That’s what my GP did when I went with my scary lump.  The patient here is not you, it is your St. Elsewhere’s® Practice, and we will need to translate the medical-speak into engineering-speak.  So one thing you’ll need to learn is a bit of the lingua-franca of systems engineering.  By the way, that’s what I do now. I am a systems engineer, or maybe now a health care systems engineer?

<Dr Bill> Point me in the direction of the HCSE dictionary! The next round is on me. And the nuts!

<Bob> Excellent. I’ll have another Black Sheep and some of those chilli-coated ones. We have work to do.  Let me start by explaining what “capacity” actually means to an engineer. Buckle up. This ride might get a bit bumpy.


This story is fictional, but the subject matter is factual.

Bob’s diagnosis and recommendations are realistic and reasonable.

Chapter 1 of the HCSE dictionary can be found here.

And if you are a GP who recognises these “symptoms” then this may be of interest.

Miracle on Tavanagh Avenue

Sometimes change is dramatic. A big improvement appears very quickly. And when that happens we are caught by surprise (and delight).

Our emotional reaction is much faster than our logical response. “Wow! That’s a miracle!


Our logical Tortoise eventually catches up with our emotional Hare and says “Hare, we both know that there is no such thing as miracles and magic. There must be a rational explanation. What is it?

And Hare replies “I have no idea, Tortoise.  If I did then it would not have been such a delightful surprise. You are such a kill-joy! Can’t you just relish the relief without analyzing the life out of it?

Tortoise feels hurt. “But I just want to understand so that I can explain to others. So that they can do it and get the same improvement.  Not everyone has a ‘nothing-ventured-nothing-gained’ attitude like you! Most of us are too fearful of failing to risk trusting the wild claims of improvement evangelists. We have had our fingers burned too often.


The apparent miracle is real and recent … here is a snippet of the feedback:

Notice carefully the last sentence. It took a year of discussion to get an “OK” and a month of planning to prepare the “GO”.

That is not a miracle and some magic … that took a lot of hard work!

The evangelist is the customer. The supplier is an engineer.


The context is the chronic niggle of patients trying to get an appointment with their GP, and the chronic niggle of GPs feeling overwhelmed with work.

Here is the back story …

In the opening weeks of the 21st Century, the National Primary Care Development Team (NPDT) was formed.  Primary care was a high priority and the government had allocated £168m of investment in the NHS Plan, £48m of which was earmarked to improve GP access.

The approach the NPDT chose was:

harvest best practice +
use a panel of experts +
disseminate best practice.

Dr (later Sir) John Oldham was the innovator and figure-head.  The best practice was copied from Dr Mark Murray from Kaiser Permanente in the USA – the Advanced Access model.  The dissemination method was copied from from Dr Don Berwick’s Institute of Healthcare Improvement (IHI) in Boston – the Collaborative Model.

The principle of Advanced Access is “today’s-work-today” which means that all the requests for a GP appointment are handled the same day.  And the proponents of the model outlined the key elements to achieving this:

1. Measure daily demand.
2. Set capacity so that is sufficient to meet the daily demand.
3. Simple booking rule: “phone today for a decision today”.

But that is not what was rolled out. The design was modified somewhere between aspiration and implementation and in two important ways.

First, by adding a policy of “Phone at 08:00 for an appointment”, and second by adding a policy of “carving out” appointment slots into labelled pots such as ‘Dr X’ or ‘see in 2 weeks’ or ‘annual reviews’.

Subsequent studies suggest that the tweaking happened at the GP practice level and was driven by the fear that, by reducing the waiting time, they would attract more work.

In other words: an assumption that demand for health care is supply-led, and without some form of access barrier, the system would be overwhelmed and never be able to cope.


The result of this well-intended tampering with the Advanced Access design was to invalidate it. Oops!

To a systems engineer this is meddling was counter-productive.

The “today’s work today” specification is called a demand-led design and, if implemented competently, will lead to shorter waits for everyone, no need for urgent/routine prioritization and slot carve-out, and a simpler, safer, calmer, more efficient, higher quality, more productive system.

In this context it does not mean “see every patient today” it means “assess and decide a plan for every patient today”.

In reality, the actual demand for GP appointments is not known at the start; which is why the first step is to implement continuous measurement of the daily number and category of requests for appointments.

The second step is to feed back this daily demand information in a visual format called a time-series chart.

The third step is to use this visual tool for planning future flow-capacity, and for monitoring for ‘signals’, such as spikes, shifts, cycles and slopes.

That was not part of the modified design, so the reasonable fear expressed by GPs was (and still is) that by attempting to do today’s-work-today they would unleash a deluge of unmet need … and be swamped/drowned.

So a flood defense barrier was bolted on; the policy of “phone at 08:00 for an appointment today“, and then the policy of  channeling the over spill into pots of “embargoed slots“.

The combined effect of this error of omission (omitting the measured demand visual feedback loop) and these errors of commission (the 08:00 policy and appointment slot carve-out policy) effectively prevented the benefits of the Advanced Access design being achieved.  It was a predictable failure.

But no one seemed to realize that at the time.  Perhaps because of the political haste that was driving the process, and perhaps because there were no systems engineers on the panel-of-experts to point out the risks of diluting the design.

It is also interesting to note that the strategic aim of the NPCT was to develop a self-sustaining culture of quality improvement (QI) in primary care. That didn’t seem to have happened either.


The roll out of Advanced Access was not the success it was hoped. This is the conclusion from the 300+ page research report published in 2007.


The “Miracle on Tavanagh Avenue” that was experienced this week by both patients and staff was the expected effect of this tampering finally being corrected; and the true potential of the original demand-led design being released – for all to experience.

Remember the essential ingredients?

1. Measure daily demand and feed it back as a visual time-series chart.
2. Set capacity so that is sufficient to meet the daily demand.
3. Use a simple booking rule: “phone anytime for a decision today”.

But there is also an extra design ingredient that has been added in this case, one that was not part of the original Advanced Access specification, one that frees up GP time to provide the required “resilience” to sustain a same-day service.

And that “secret” ingredient is how the new design worked so quickly and feels like a miracle – safe, calm, enjoyable and productive.

This is health care systems engineering (HCSE) in action.


So congratulations to Harry Longman, the whole team at GP Access, and to Dr Philip Lusty and the team at Riverside Practice, Tavangh Avenue, Portadown, NI.

You have demonstrated what was always possible.

The fear of failure prevented it before, just as it prevented you doing this until you were so desperate you had no other choices.

To read the fuller story click here.

PS. Keep a close eye on the demand time-series chart and if it starts to rise then investigate the root cause … immediately.


“Houston, we have a problem!”

The immortal words from Apollo 13 that alerted us to an evolving catastrophe …

… and that is what we are seeing in the UK health and social care system … using the thermometer of A&E 4-hour performance. England is the red line.

uk_ae_runchart

The chart shows that this is not a sudden change, it has been developing over quite a long period of time … so why does it feel like an unpleasant surprise?


One reason may be that NHS England is using performance management techniques that were out of date in the 1980’s and are obsolete in the 2010’s!

Let me show you what I mean. This is a snapshot from the NHS England Board Minutes for November 2016.

nhse_rag_nov_2016
RAG stands for Red-Amber-Green and what we want to see on a Risk Assessment is Green for the most important stuff like safety, flow, quality and affordability.

We are not seeing that.  We are seeing Red/Amber for all of them. It is an evolving catastrophe.

A risk RAG chart is an obsolete performance management tool.

Here is another snippet …

nhse_ae_nov_2016

This demonstrates the usual mix of single point aggregates for the most recent month (October 2016); an arbitrary target (4 hours) used as a threshold to decide failure/not failure; two-point comparisons (October 2016 versus October 2015); and a sprinkling of ratios. Not a single time-series chart in sight. No pictures that tell a story.

Click here for the full document (which does also include some very sensible plans to maintain hospital flow through the bank holiday period).

The risk of this way of presenting system performance data is that it is a minefield of intuitive traps for the unwary.  Invisible pitfalls that can lead to invalid conclusions, unwise decisions, potentially ineffective and/or counter-productive actions, and failure to improve. These methods are risky and that is why they should be obsolete.

And if NHSE is using obsolete tools than what hope do CCGs and Trusts have?


Much better tools have been designed.  Tools that are used by organisations that are innovative, resilient, commercially successful and that deliver safety, on-time delivery, quality and value for money. At the same time.

And they are obsolete outside the NHS because in the competitive context of the dog-eat-dog real world, organisations do not survive if they do not innovate, improve and learn as fast as their competitors.  They do not have the luxury of being shielded from reality by having a central tax-funded monopoly!

And please do not misinterpret my message here; I am a 100% raving fan of the NHS ethos of “available to all and free at the point of delivery” and an NHS that is funded centrally and fairly. That is not my issue.

My issue is the continued use of obsolete performance management tools in the NHS.


Q: So what are the alternatives? What do the successful commercial organisations use instead?

A: System behaviour charts.

SBCs are pictures of how the system is behaving over time – pictures that tell a story – pictures that have meaning – pictures that we can use to diagnose, design and deliver a better outcome than the one we are heading towards.

Pictures like the A&E performance-over-time chart above.

Click here for more on how and why.


Therefore, if the DoH, NHSE, NHSI, STPs, CCGs and Trust Boards want to achieve their stated visions and missions then the writing-on-the-wall says that they will need to muster some humility and learn how successful organisations do this.

This is not a comfortable message to hear and it is easier to be defensive than receptive.

The NHS has to change if it wants to survive and continue serve the people who pay the salaries. And time is running out. Continuing as we are is not an option. Complaining and blaming are not options. Doing nothing is not an option.

Learning is the only option.

Anyone can learn to use system behaviour charts.  No one needs to rely on averages, two-point comparisons, ratios, targets, and the combination of failure-metrics and us-versus-them-benchmarking that leads to the chronic mediocrity trap.

And there is hope for those with enough hunger, humility and who are prepared to do the hard-work of developing their personal, team, department and organisational capability to use better management methods.


Apollo 13 is a true story.  The catastrophe was averted.  The astronauts were brought home safely.  The film retells the story of how that miracle was achieved. Perhaps watching the whole film would be somewhere to start, because it holds many valuable lessons for us all – lessons on how effective teams behave.

Value, Verify and Validate

thinker_figure_unsolve_puzzle_150_wht_18309Many of the challenges that we face in delivering effective and affordable health care do not have well understood and generally accepted solutions.

If they did there would be no discussion or debate about what to do and the results would speak for themselves.

This lack of understanding is leading us to try to solve a complicated system design challenge in our heads.  Intuitively.

And trying to do it this way is fraught with frustration and risk because our intuition tricks us. It was this sort of challenge that led Professor Rubik to invent his famous 3D Magic Cube puzzle.

It is difficult enough to learn how to solve the Magic Cube puzzle by trial and error; it is even more difficult to attempt to do it inside our heads! Intuitively.


And we know the Rubik Cube puzzle is solvable, so all we need are some techniques, tools and training to improve our Rubik Cube solving capability.  We can all learn how to do it.


Returning to the challenge of safe and affordable health care, and to the specific problem of unscheduled care, A&E targets, delayed transfers of care (DTOC), finance, fragmentation and chronic frustration.

This is a systems engineering challenge so we need some systems engineering techniques, tools and training before attempting it.  Not after failing repeatedly.

se_vee_diagram

One technique that a systems engineer will use is called a Vee Diagram such as the one shown above.  It shows the sequence of steps in the generic problem solving process and it has the same sequence that we use in medicine for solving problems that patients present to us …

Diagnose, Design and Deliver

which is also known as …

Study, Plan, Do.


Notice that there are three words in the diagram that start with the letter V … value, verify and validate.  These are probably the three most important words in the vocabulary of a systems engineer.


One tool that a systems engineer always uses is a model of the system under consideration.

Models come in many forms from conceptual to physical and are used in two main ways:

  1. To assist the understanding of the past (diagnosis)
  2. To predict the behaviour in the future (prognosis)

And the process of creating a system model, the sequence of steps, is shown in the Vee Diagram.  The systems engineer’s objective is a validated model that can be trusted to make good-enough predictions; ones that support making wiser decisions of which design options to implement, and which not to.


So if a systems engineer presented us with a conceptual model that is intended to assist our understanding, then we will require some evidence that all stages of the Vee Diagram process have been completed.  Evidence that provides assurance that the model predictions can be trusted.  And the scope over which they can be trusted.


Last month a report was published by the Nuffield Trust that is entitled “Understanding patient flow in hospitals”  and it asserts that traffic flow on a motorway is a valid conceptual model of patient flow through a hospital.  Here is a direct quote from the second paragraph in the Executive Summary:

nuffield_report_01
Unfortunately, no evidence is provided in the report to support the validity of the statement and that omission should ring an alarm bell.

The observation that “the hospitals with the least free space struggle the most” is not a validation of the conceptual model.  Validation requires a concrete experiment.


To illustrate why observation is not validation let us consider a scenario where I have a headache and I take a paracetamol and my headache goes away.  I now have some evidence that shows a temporal association between what I did (take paracetamol) and what I got (a reduction in head pain).

But this is not a valid experiment because I have not considered the other seven possible combinations of headache before (Y/N), paracetamol (Y/N) and headache after (Y/N).

An association cannot be used to prove causation; not even a temporal association.

When I do not understand the cause, and I am without evidence from a well-designed experiment, then I might be tempted to intuitively jump to the (invalid) conclusion that “headaches are caused by lack of paracetamol!” and if untested this invalid judgement may persist and even become a belief.


Understanding causality requires an approach called counterfactual analysis; otherwise known as “What if?” And we can start that process with a thought experiment using our rhetorical model.  But we must remember that we must always validate the outcome with a real experiment. That is how good science works.

A famous thought experiment was conducted by Albert Einstein when he asked the question “If I were sitting on a light beam and moving at the speed of light what would I see?” This question led him to the Theory of Relativity which completely changed the way we now think about space and time.  Einstein’s model has been repeatedly validated by careful experiment, and has allowed engineers to design and deliver valuable tools such as the Global Positioning System which uses relativity theory to achieve high positional precision and accuracy.


So let us conduct a thought experiment to explore the ‘faster movement requires more space‘ statement in the case of patient flow in a hospital.

First, we need to define what we mean by the words we are using.

The phrase ‘faster movement’ is ambiguous.  Does it mean higher flow (more patients per day being admitted and discharged) or does it mean shorter length of stage (the interval between the admission and discharge events for individual patients)?

The phrase ‘more space’ is also ambiguous. In a hospital that implies physical space i.e. floor-space that may be occupied by corridors, chairs, cubicles, trolleys, and beds.  So are we actually referring to flow-space or storage-space?

What we have in this over-simplified statement is the conflation of two concepts: flow-capacity and space-capacity. They are different things. They have different units. And the result of conflating them is meaningless and confusing.


However, our stated goal is to improve understanding so let us consider one combination, and let us be careful to be more precise with our terminology, “higher flow always requires more beds“. Does it? Can we disprove this assertion with an example where higher flow required less beds (i.e. space-capacity)?

The relationship between flow and space-capacity is well understood.

The starting point is Little’s Law which was proven mathematically in 1961 by J.D.C. Little and it states:

Average work in progress = Average lead time  X  Average flow.

In the hospital context, work in progress is the number of occupied beds, lead time is the length of stay and flow is admissions or discharges per time interval (which must be the same on average over a long period of time).

(NB. Engineers are rather pedantic about units so let us check that this makes sense: the unit of WIP is ‘patients’, the unit of lead time is ‘days’, and the unit of flow is ‘patients per day’ so ‘patients’ = ‘days’ * ‘patients / day’. Correct. Verified. Tick.)

So, is there a situation where flow can increase and WIP can decrease? Yes. When lead time decreases. Little’s Law says that is possible. We have disproved the assertion.


Let us take the other interpretation of higher flow as shorter length of stay: i.e. shorter length of stay always requires more beds.  Is this correct? No. If flow remains the same then Little’s Law states that we will require fewer beds. This assertion is disproved as well.

And we need to remember that Little’s Law is proven to be valid for averages, does that shed any light on the source of our confusion? Could the assertion about flow and beds actually be about the variation in flow over time and not about the average flow?


And this is also well understood. The original work on it was done almost exactly 100 years ago by Agner Krarup Erlang and the problem he looked at was the quality of customer service of the early telephone exchanges. Specifically, how likely was the caller to get the “all lines are busy, please try later” response.

What Erlang showed was there there is a mathematical relationship between the number of calls being made (the demand), the probability of a call being connected first time (the service quality) and the number of telephone circuits and switchboard operators available (the service cost).


So it appears that we already have a validated mathematical model that links flow, quality and cost that we might use if we substitute ‘patients’ for ‘calls’, ‘beds’ for ‘telephone circuits’, and ‘being connected’ for ‘being admitted’.

And this topic of patient flow, A&E performance and Erlang queues has been explored already … here.

So a telephone exchange is a more valid model of a hospital than a motorway.

We are now making progress in deepening our understanding.


The use of an invalid, untested, conceptual model is sloppy systems engineering.

So if the engineering is sloppy we would be unwise to fully trust the conclusions.

And I share this feedback in the spirit of black box thinking because I believe that there are some valuable lessons to be learned here – by us all.


To vote for this topic please click here.
To subscribe to the blog newsletter please click here.
To email the author please click here.

Patient Traffic Engineering

motorway[Beep] Bob’s computer alerted him to Leslie signing on to the Webex session.

<Bob> Good afternoon Leslie, how are you? It seems a long time since we last chatted.

<Leslie> Hi Bob. I am well and it has been a long time. If you remember, I had to loop out of the Health Care Systems Engineering training because I changed job, and it has taken me a while to bring a lot of fresh skeptics around to the idea of improvement-by-design.

<Bob> Good to hear, and I assume you did that by demonstrating what was possible by doing it, delivering results, and describing the approach.

<Leslie> Yup. And as you know, even with objective evidence of improvement it can take a while because that exposes another gap, the one between intent and impact.  Many people get rather defensive at that point, so I have had to take it slowly. Some people get really fired up though.

 <Bob> Yes. Respect, challenge, patience and persistence are all needed. So, where shall we pick up?

<Leslie> The old chestnut of winter pressures and A&E targets.  Except that it is an all-year problem now and according to what I read in the news, everyone is predicting a ‘melt-down’.

<Bob> Did you see last week’s IS blog on that very topic?

<Leslie> Yes, I did!  And that is what prompted me to contact you and to re-start my CHIPs coaching.  It was a real eye opener.  I liked the black swan code-named “RC9” story, it makes it sound like a James Bond film!

<Bob> I wonder how many people dug deeper into how “RC9” achieved that rock-steady A&E performance despite a rising tide of arrivals and admissions?

<Leslie> I did, and I saw several examples of anti-carve-out design.  I have read though my notes and we have talked about carve out many times.

<Bob> Excellent. Being able to see the signs of competent design is just as important as the symptoms of inept design. So, what shall we talk about?

<Leslie> Well, by co-incidence I was sent a copy of of a report entitled “Understanding patient flow in hospitals” published by one of the leading Think Tanks and I confess it made no sense to me.  Can we talk about that?

<Bob> OK. Can you describe the essence of the report for me?

<Leslie> Well, in a nutshell it said that flow needs space so if we want hospitals to flow better we need more space, in other words more beds.

<Bob> And what evidence was presented to support that hypothesis?

<Leslie> The authors equated the flow of patients through a hospital to the flow of traffic on a motorway. They presented a table of numbers that made no sense to me, I think partly because there are no units stated for some of the numbers … I’ll email you a picture.

traffic_flow_dynamics

<Bob> I agree this is not a very informative table.  I am not sure what the definition of “capacity” is here and it may be that the authors may be equating “hospital bed” to “area of tarmac”.  Anyway, the assertion that hospital flow is equivalent to motorway flow is inaccurate.  There are some similarities and traffic engineering is an interesting subject, but they are not equivalent.  A hospital is more like a busy city with junctions, cross-roads, traffic lights, roundabouts, zebra crossings, pelican crossings and all manner of unpredictable factors such as cyclists and pedestrians. Motorways are intentionally designed without these “impediments”, for obvious reasons! A complex adaptive flow system like a hospital cannot be equated to a motorway. It is a dangerous over-simplification.

<Leslie> So, if the hospital-motorway analogy is invalid then the conclusions are also invalid?

<Bob> Sometimes, by accident, we get a valid conclusion from an invalid method. What were the conclusions?

<Leslie> That the solution to improving A&E performance is more space (i.e. hospital beds) but there is no more money to build them or people to staff them.  So the recommendations are to reduce volume, redesign rehabilitation and discharge processes, and improve IT systems.

<Bob> So just re-iterating the habitual exhortations and nothing about using well-understood systems engineering methods to accurately diagnose the actual root cause of the ‘symptoms’, which is likely to be the endemic carveoutosis multiforme, and then treat accordingly?

<Leslie> No. I could not find the term “carve out” anywhere in the document.

<Bob> Oh dear.  Based on that observation, I do not believe this latest Think Tank report is going to be any more effective than the previous ones.  Perhaps asking “RC9” to write an account of what they did and how they learned to do it would be more informative?  They did not reduce volume, and I doubt they opened more beds, and their annual report suggests they identified some space and flow carveoutosis and treated it. That is what a competent systems engineer would do.

<Leslie> Thanks Bob. Very helpful as always. What is my next step?

<Bob> Some ISP-2 brain-teasers, a juicy ISP-2 project, and some one day training workshops for your all-fired-up CHIPs.

<Leslie> Bring it on!


For more posts like this please vote here.
For more information please subscribe here.

Outliers

reading_a_book_pa_150_wht_3136An effective way to improve is to learn from others who have demonstrated the capability to achieve what we seek.  To learn from success.

Another effective way to improve is to learn from those who are not succeeding … to learn from failures … and that means … to learn from our own failings.

But from an early age we are socially programmed with a fear of failure.

The training starts at school where failure is not tolerated, nor is challenging the given dogma.  Paradoxically, the effect of our fear of failure is that our ability to inquire, experiment, learn, adapt, and to be resilient to change is severely impaired!

So further failure in the future becomes more likely, not less likely. Oops!


Fortunately, we can develop a healthier attitude to failure and we can learn how to harness the gap between intent and impact as a source of energy, creativity, innovation, experimentation, learning, improvement and growing success.

And health care provides us with ample opportunities to explore this unfamiliar terrain. The creative domain of the designer and engineer.


The scatter plot below is a snapshot of the A&E 4 hr target yield for all NHS Trusts in England for the month of July 2016.  The required “constitutional” performance requirement is better than 95%.  The delivered whole system average is 85%.  The majority of Trusts are failing, and the Trust-to-Trust variation is rather wide. Oops!

This stark picture of the gap between intent (95%) and impact (85%) prompts some uncomfortable questions:

Q1: How can one Trust achieve 98% and yet another can do no better than 64%?

Q2: What can all Trusts learn from these high and low flying outliers?

[NB. I have not asked the question “Who should we blame for the failures?” because the name-shame-blame-game is also a predictable consequence of our fear-of-failure mindset.]


Let us dig a bit deeper into the information mine, and as we do that we need to be aware of a trap:

A snapshot-in-time tells us very little about how the system and the set of interconnected parts is behaving-over-time.

We need to examine the time-series charts of the outliers, just as we would ask for the temperature, blood pressure and heart rate charts of our patients.

Here are the last six years by month A&E 4 hr charts for a sample of the high-fliers. They are all slightly different and we get the impression that the lower two are struggling more to stay aloft more than the upper two … especially in winter.


And here are the last six years by month A&E 4 hr charts for a sample of the low-fliers.  The Mark I Eyeball Test results are clear … these swans are falling out of the sky!


So we need to generate some testable hypotheses to explain these visible differences, and then we need to examine the available evidence to test them.

One hypothesis is “rising demand”.  It says that “the reason our A&E is failing is because demand on A&E is rising“.

Another hypothesis is “slow flow”.  It says that “the reason our A&E is failing is because of the slow flow through the hospital because of delayed transfers of care (DTOCs)“.

So, if these hypotheses account for the behaviour we are observing then we would predict that the “high fliers” are (a) diverting A&E arrivals elsewhere, and (b) reducing admissions to free up beds to hold the DTOCs.

Let us look at the freely available data for the highest flyer … the green dot on the scatter gram … code-named “RC9”.

The top chart is the A&E arrivals per month.

The middle chart is the A&E 4 hr target yield per month.

The bottom chart is the emergency admissions per month.

Both arrivals and admissions are increasing, while the A&E 4 hr target yield is rock steady!

And arranging the charts this way allows us to see the temporal patterns more easily (and the images are deliberately arranged to show the overall pattern-over-time).

Patterns like the change-for-the-better that appears in the middle of the winter of 2013 (i.e. when many other trusts were complaining that their sagging A&E performance was caused by “winter pressures”).

The objective evidence seems to disprove the “rising demand”, “slow flow” and “winter pressure” hypotheses!

So what can we learn from our failure to adequately explain the reality we are seeing?


The trust code-named “RC9” is Luton and Dunstable, and it is an average district general hospital, on the surface.  So to reveal some clues about what actually happened there, we need to read their Annual Report for 2013-14.  It is a public document and it can be downloaded here.

This is just a snippet …

… and there are lots more knowledge nuggets like this in there …

… it is a treasure trove of well-known examples of good system flow design.

The results speak for themselves!


Q: How many black swans does it take to disprove the hypothesis that “all swans are white”.

A: Just one.

“RC9” is a black swan. An outlier. A positive deviant. “RC9” has disproved the “impossibility” hypothesis.

And there is another flock of black swans living in the North East … in the Newcastle area … so the “Big cities are different” hypothesis does not hold water either.


The challenge here is a human one.  A human factor.  Our learned fear of failure.

Learning-how-to-fail is the way to avoid failing-how-to-learn.

And to read more about that radical idea I strongly recommend reading the recently published book called Black Box Thinking by Matthew Syed.

It starts with a powerful story about the impact of human factors in health care … and here is a short video of Martin Bromiley describing what happened.

The “black box” that both Martin and Matthew refer to is the one that is used in air accident investigations to learn from what happened, and to use that learning to design safer aviation systems.

Martin Bromiley has founded a charity to support the promotion of human factors in clinical training, the Clinical Human Factors Group.

So if we can muster the courage and humility to learn how to do this in health care for patient safety, then we can also learn to how do it for flow, quality and productivity.

Our black swan called “RC9” has demonstrated that this goal is attainable.

And the body of knowledge needed to do this already exists … it is called Health and Social Care Systems Engineering (HSCSE).


For more posts like this please vote here.
For more information please subscribe here.
To email the author please click here.


Postscript: And I am pleased to share that Luton & Dunstable features in the House of Commons Health Committee report entitled Winter Pressures in A&E Departments that was published on 3rd Nov 2016.

Here is part of what L&D shared to explain their deviant performance:

luton_nuggets

These points describe rather well the essential elements of a pull design, which is the antidote to the rather more prevalent pressure cooker design.

DIKUW

This 100 second video of the late Russell Ackoff is solid gold!

In it he describes the DIKUW hierarchy – data, information, knowledge, understanding and wisdom – and how it is critical to put effectiveness before efficiency.

A wise objective is a purpose … the intended outcome … and a well designed system will be both effective and efficient.  That is the engineers definition of productivity.  Doing the right thing first, and doing it right second.

So how do we transform data into wisdom? What are needs to be added or taken away? What is the process?

Data is what we get from our senses.

To convert data into information we add context.

To convert information into knowledge we use memory.

To convert knowledge into understanding we need to learn-by-doing.

And the test of understanding is to be able to teach someone else what we know and to be able to support them developing an understanding through practice.

To convert understanding into wisdom requires years of experience of seeing, doing and teaching.

There are no short cuts.

So the sooner we start learning-by-doing the quicker we will develop the wisdom of purpose, and the understanding of process.


For more posts like this please vote here.
For more information please subscribe here.

The Pressure Cooker

About a year ago we looked back at the previous 10 years of NHS unscheduled care performance …

click here to read

… and warned that a catastrophe was on the way because we had unintentionally created a urgent care “pressure cooker”.


Did waving the red warning flag make any difference? It seems not.

The catastrophe unfolded as predicted … A&E performance slumped to an all-time low, and has not recovered.


A pressure cooker is an elegantly simple self-regulating system.  A strong metal box with a sealed lid and a pressure-sensitive valve.  Food cooks more quickly at a higher temperature, and we can increase the boiling point of water by increasing the ambient pressure.  So all we need to do is put some water in the cooker, close the lid, set the pressure limit we need (i.e. the temperature we want) and apply some heat.  Simple.  As the water boils the steam increases the pressure inside, until the regulator valve opens and lets a bit of steam out.  The more heat we apply – the faster the steam comes out – but the internal pressure and temperature remain constant.  An elegantly simple self-regulating system.


Our unscheduled care acute hospital “pressure cooker” design is very similar – but it has an additional feature – we can squeeze raw patients in through a one-way valve labelled “admissions”.  The internal pressure will eventually squeeze them out through another one-way pressure-sensitive valve called “discharges”.

But there is not much head-space inside our hospital (i.e. empty beds) so pushing patients in will increase the pressure inside, and it will trigger an internal reaction called “fire-fighting” that generates heat (but no insight).  When the internal pressure reaches the critical level, patients are squeezed out; ready-or-not.

What emerges from the chaotic internal cauldron is a mixture of under-cooked, just-right, and over-cooked patients.  And we then conduct quality control audits and we label what we find as “quality variation”, but it looks random so it gives us no clues as to the causes or what to do next.

Equilibrium is eventually achieved – what goes in comes out – the pressure and temperature auto-regulate – the chaos becomes chronic – and the quality of the output is predictably unacceptable and unpredictable, with some of it randomly spoiled (i.e. harmed).

And our acute care pressure cooker is very resistant to external influences. It is one of its key design features, it is an auto-regulating system.


Option 1: Admissions Avoidance
Squeezing a bit less in does not make any difference to the internal pressure and temperature.  It auto-regulates.  The reduced inflow means a reduced outflow and a longer cooking time and we just get less under-cooked and more over-cooked output.  Oh, and we go bust because our revenue has reduced but our costs have not.

Option 2: Build a Bigger Hospital
Building a bigger pressure cooker (i.e. adding more beds) does not make any sustained difference either.  Again the system auto-regulates.  The extra space-capacity allows a longer cooking time – and again we get less under-cooked and more over-cooked output.  Oh, and we still go bust (same revenue but increased cost).

Option 3: Reduce the Expectation
Turning down the heat (i.e. reducing the 4 hr A&E lead time target yield from 98% to 95%) does not make any difference. Our elegant auto-regulating design adjusts itself to sustain the internal pressure and temperature.  Output is still variable, but least we do not go bust.


This metaphor may go some way to explain why the intuitively obvious “initiatives” to improve unscheduled care performance appear to have had no significant or sustained impact.
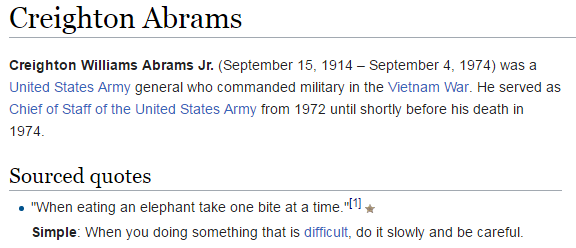
And what is more worrying is that they may even have made the situation worse.
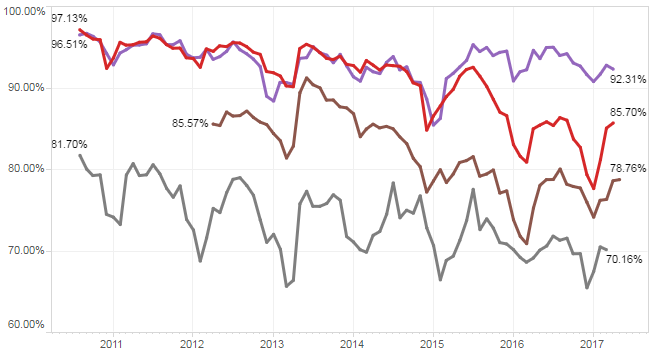
Also, working inside an urgent care pressure cooker is dangerous.  People get emotionally damaged and permanently scarred.


The good news is that a different approach is available … a health and social care systems engineering (HSCSE) approach … one that we could use to change the fundamental design from fire-fighter to flow-facilitator.

Using HSCSE theory, techniques and tools we could specify, design, build, verify, implement and validate a low-pressure, low-resistance, low-wait, low-latency, high-efficiency unscheduled care flow design that is safe, timely, effective and affordable.

But we are not training NHS staff to do that.

Why is that?  Is is because we are not aware that this is possible, or that we do not believe that it can work, or that we lack the capability to do it? Or all three?

The first step is raising awareness … so here is an example that proves it is possible.

The Fog

businessman_cloud_periscope_18347The path from chaos to calm is not clearly marked.  If it were we would not have chaotic health care processes, anxious patients, frustrated staff and escalating costs.

Many believe that there is no way out of the chaos. They have given up trying.

Some still nurture the hope that there is a way and are looking for a path through the fog of confusion.

A few know that there is a way out because they have been shown a path from chaos to calm and can show others how to find it.

Someone, a long time ago, explored the fog and discovered clarity of understanding on the far side, and returned with a Map of the Mind-field.


Q: What is causing The Fog?

When hot rhetoric meets cold reality the fog of disillusionment forms.

Q: Where does the hot rhetoric come from?

Passionate, well-intended and ill-informed people in positions of influence, authority and power. The orators, debaters and commentators.

They do not appear to have an ability to diagnose and to design, so cannot generate effective decisions and coordinate efficient delivery of solutions.

They have not learned how and seem to be unaware of it.

If they had, then they would be able to show that there is a path from chaos to calm.

A safe, quick, surprisingly enjoyable and productive path.

If they had the know-how then they could pull from the front in the ‘right’ direction, rather than push from the back in the ‘wrong’ one.


And the people who are spreading this good news are those who have just emerged from the path.  Their own fog of confusion evaporating as they discovered the clarity of hindsight for themselves.

Ah ha!  Now I see! Wow!  The view from the far side of The Fog is amazing and exciting. The opportunity and potential is … unlimited.  I must share the news. I must tell everyone! I must show them how-to.

Here is a story from Chris Jones who has recently emerged from The Fog.

And here is a description of part of the Mind-field Map, narrated in 2008 by Kate Silvester, a doctor and manufacturing systems engineer.

Notably Absent

KingsFund_Quality_Report_May_2016This week the King’s Fund published their Quality Monitoring Report for the NHS, and it makes depressing reading.

These highlights are a snapshot.

The website has some excellent interactive time-series charts that transform the deluge of data the NHS pumps out into pictures that tell a shameful story.

On almost all reported dimensions, things are getting worse and getting worse faster.

Which I do not believe is the intention.

But it is clearly the impact of the last 20 years of health and social care policy.


What is more worrying is the data that is notably absent from the King’s Fund QMR.

The first omission is outcome: How well did the NHS deliver on its intended purpose?  It is stated at the top of the NHS England web site …

NHSE_Purpose

And lets us be very clear here: dying, waiting, complaining, and over-spending are not measures of what we want: health and quality success metrics.  They are a measures of what we do not want; they are failure metrics.

The fanatical focus on failure is part of the hyper-competitive, risk-averse medical mindset:

primum non nocere (first do no harm),

and as a patient I am reassured to hear that but is no harm all I can expect?

What about:

tunc mederi (then do some healing)


And where is the data on dying in the Kings Fund QMR?

It seems to be notably absent.

And I would say that is a quality issue because it is something that patients are anxious about.  And that may be because they are given so much ‘open information’ about what might go wrong, not what should go right.


And you might think that sharp, objective data on dying would be easy to collect and to share.  After all, it is not conveniently fuzzy and subjective like satisfaction.

It is indeed mandatory to collect hospital mortality data, but sharing it seems to be a bit more of a problem.

The fear-of-failure fanaticism extends there too.  In the wake of humiliating, historical, catastrophic failures like Mid Staffs, all hospitals are monitored, measured and compared. And the negative deviants are named, shamed and blamed … in the hope that improvement might follow.

And to do the bench-marking we need to compare apples with apples; not peaches with lemons.  So we need to process the raw data to make it fair to compare; to ensure that factors known to be associated with higher risk of death are taken into account. Factors like age, urgency, co-morbidity and primary diagnosis.  Factors that are outside the circle-of-control of the hospitals themselves.

And there is an army of academics, statisticians, data processors, and analysts out there to help. The fruit of their hard work and dedication is called SHMI … the Summary Hospital Mortality Index.

SHMI_Specification

Now, the most interesting paragraph is the third one which outlines what raw data is fed in to building the risk-adjusted model.  The first four are objective, the last two are more subjective, especially the diagnosis grouping one.

The importance of this distinction comes down to human nature: if a hospital is failing on its SHMI then it has two options:
(a) to improve its policies and processes to improve outcomes, or
(b) to manipulate the diagnosis group data to reduce the SHMI score.

And the latter is much easier to do, it is called up-coding, and basically it involves camping at the pessimistic end of the diagnostic spectrum. And we are very comfortable with doing that in health care. We favour the Black Hat.

And when our patients do better than our pessimistically-biased prediction, then our SHMI score improves and we look better on the NHS funnel plot.

We do not have to do anything at all about actually improving the outcomes of the service we provide, which is handy because we cannot do that. We do not measure it!


And what might be notably absent from the data fed in to the SHMI risk-model?  Data that is objective and easy to measure.  Data such as length of stay (LOS) for example?

Is there a statistical reason that LOS is omitted? Not really. Any relevant metric is a contender for pumping into a risk-adjustment model.  And we all know that the sicker we are, the longer we stay in hospital, and the less likely we are to come out unharmed (or at all).  And avoidable errors create delays and complications that imply more risk, more work and longer length of stay. Irrespective of the illness we arrived with.

So why has LOS been omitted from SHMI?

The reason may be more political than statistical.

We know that the risk of death increases with infirmity and age.

We know that if we put frail elderly patients into a hospital bed for a few days then they will decondition and become more frail, require more time in hospital, are more likely to need a transfer of care to somewhere other than home, are more susceptible to harm, and more likely to die.

So why is LOS not in the risk-of-death SHMI model?

And it is not in the King’s Fund QR report either.

Nor is the amount of cash being pumped in to keep the HMS NHS afloat each month.

All notably absent!

The Cost of Chaos

british_pound_money_three_bundled_stack_400_wht_2425This week I conducted an experiment – on myself.

I set myself the challenge of measuring the cost of chaos, and it was tougher than I anticipated it would be.

It is easy enough to grasp the concept that fire-fighting to maintain patient safety amidst the chaos of healthcare would cost more in terms of tears and time …

… but it is tricky to translate that concept into hard numbers; i.e. cash.


Chaos is an emergent property of a system.  Safety, delivery, quality and cost are also emergent properties of a system. We can measure cost, our finance departments are very good at that. We can measure quality – we just ask “How did your experience match your expectation”.  We can measure delivery – we have created a whole industry of access target monitoring.  And we can measure safety by checking for things we do not want – near misses and never events.

But while we can feel the chaos we do not have an easy way to measure it. And it is hard to improve something that we cannot measure.


So the experiment was to see if I could create some chaos, then if I could calm it, and then if I could measure the cost of the two designs – the chaotic one and the calm one.  The difference, I reasoned, would be the cost of the chaos.

And to do that I needed a typical chunk of a healthcare system: like an A&E department where the relationship between safety, flow, quality and productivity is rather important (and has been a hot topic for a long time).

But I could not experiment on a real A&E department … so I experimented on a simplified but realistic model of one. A simulation.

What I discovered came as a BIG surprise, or more accurately a sequence of big surprises!

  1. First I discovered that it is rather easy to create a design that generates chaos and danger.  All I needed to do was to assume I understood how the system worked and then use some averaged historical data to configure my model.  I could do this on paper or I could use a spreadsheet to do the sums for me.
  2. Then I discovered that I could calm the chaos by reactively adding lots of extra capacity in terms of time (i.e. more staff) and space (i.e. more cubicles).  The downside of this approach was that my costs sky-rocketed; but at least I had restored safety and calm and I had eliminated the fire-fighting.  Everyone was happy … except the people expected to foot the bill. The finance director, the commissioners, the government and the tax-payer.
  3. Then I got a really big surprise!  My safe-but-expensive design was horribly inefficient.  All my expensive resources were now running at rather low utilisation.  Was that the cost of the chaos I was seeing? But when I trimmed the capacity and costs the chaos and danger reappeared.  So was I stuck between a rock and a hard place?
  4. Then I got a really, really big surprise!!  I hypothesised that the root cause might be the fact that the parts of my system were designed to work independently, and I was curious to see what happened when they worked interdependently. In synergy. And when I changed my design to work that way the chaos and danger did not reappear and the efficiency improved. A lot.
  5. And the biggest surprise of all was how difficult this was to do in my head; and how easy it was to do when I used the theory, techniques and tools of Improvement-by-Design.

So if you are curious to learn more … I have written up the full account of the experiment with rationale, methods, results, conclusions and references and I have published it here.

The Magic Black Box

stick_figure_magic_carpet_150_wht_5040It was the appointed time for Bob and Leslie’s regular coaching session as part of the improvement science practitioner programme.

<Leslie> Hi Bob, I am feeling rather despondent today so please excuse me in advance if you hear a lot of “Yes, but …” language.

<Bob> I am sorry to hear that Leslie. Do you want to talk about it?

<Leslie> Yes, please.  The trigger for my gloom was being sent on a mandatory training workshop.

<Bob> OK. Training to do what?

<Leslie> Outpatient demand and capacity planning!

<Bob> But you know how to do that already, so what is the reason you were “sent”?

<Leslie> Well, I am no longer sure I know how to it.  That is why I am feeling so blue.  I went more out of curiosity and I came away utterly confused and with my confidence shattered.

<Bob> Oh dear! We had better start at the beginning.  What was the purpose of the workshop?

<Leslie> To train everyone in how to use an Outpatient Demand and Capacity planning model, an Excel one that we were told to download along with the User Guide.  I think it is part of a national push to improve waiting times for outpatients.

<Bob> OK. On the surface that sounds reasonable. You have designed and built your own Excel flow-models already; so where did the trouble start?

<Leslie> I will attempt to explain.  This was a paragraph in the instructions. I felt OK with this because my Improvement Science training has given me a very good understanding of basic demand and capacity theory.

IST_DandC_Model_01<Bob> OK.  I am guessing that other delegates may have felt less comfortable with this. Was that the case?

<Leslie> The training workshops are targeted at Operational Managers and the ones I spoke to actually felt that they had a good grasp of the basics.

<Bob> OK. That is encouraging, but a warning bell is ringing for me. So where did the trouble start?

<Leslie> Well, before going to the workshop I decided to read the User Guide so that I had some idea of how this magic tool worked.  This is where I started to wobble – this paragraph specifically …

IST_DandC_Model_02

<Bob> H’mm. What did you make of that?

<Leslie> It was complete gibberish to me and I felt like an idiot for not understanding it.  I went to the workshop in a bit of a panic and hoped that all would become clear. It didn’t.

<Bob> Did the User Guide explain what ‘percentile’ means in this context, ideally with some visual charts to assist?

<Leslie> No and the use of ‘th’ and ‘%’ was really confusing too.  After that I sort of went into a mental fog and none of the workshop made much sense.  It was all about practising using the tool without any understanding of how it worked. Like a black magic box.


<Bob> OK.  I can see why you were confused, and do not worry, you are not an idiot.  It looks like the author of the User Guide has unwittingly used some very confusing and ambiguous terminology here.  So can you talk me through what you have to do to use this magic box?

<Leslie> First we have to enter some of our historical data; the number of new referrals per week for a year; and the referral and appointment dates for all patients for the most recent three months.

<Bob> OK. That sounds very reasonable.  A run chart of historical demand and the raw event data for a Vitals Chart® is where I would start the measurement phase too – so long as the data creates a valid 3 month reporting window.

<Leslie> Yes, I though so too … but that is not how the black box model seems to work. The weekly demand is used to draw an SPC chart, but the event data seems to disappear into the innards of the black box, and recommendations pop out of it.

<Bob> Ah ha!  And let me guess the relationship between the term ‘percentile’ and the SPC chart of weekly new demand was not explained?

<Leslie> Spot on.  What does percentile mean?


<Bob> It is statistics jargon. Remember that we have talked about the distribution of the data around the average on a BaseLine chart; and how we use the histogram feature of BaseLine to show it visually.  Like this example.

IST_DandC_Model_03<Leslie> Yes. I recognise that. This chart shows a stable system of demand with an average of around 150 new referrals per week and the variation distributed above and below the average in a symmetrical pattern, falling off to zero around the upper and lower process limits.  I believe that you said that over 99% will fall within the limits.

<Bob> Good.  The blue histogram on this chart is called a probability distribution function, to use the terminology of a statistician.

<Leslie> OK.

<Bob> So, what would happen if we created a Pareto chart of demand using the number of patients per week as the categories and ignoring the time aspect? We are allowed to do that if the behaviour is stable, as this chart suggests.

<Leslie> Give me a minute, I will need to do a rough sketch. Does this look right?

IST_DandC_Model_04

<Bob> Perfect!  So if you now convert the Y-axis to a percentage scale so that 52 weeks is 100% then where does the average weekly demand of about 150 fall? Read up from the X-axis to the line then across to the Y-axis.

<Leslie> At about 26 weeks or 50% of 52 weeks.  Ah ha!  So that is what a percentile means!  The 50th percentile is the average, the zeroth percentile is around the lower process limit and the 100th percentile is around the upper process limit!

<Bob> In this case the 50th percentile is the average, it is not always the case though.  So where is the 85th percentile line?

<Leslie> Um, 52 times 0.85 is 44.2 which, reading across from the Y-axis then down to the X-axis gives a weekly demand of about 170 per week.  That is about the same as the average plus one sigma according to the run chart.

<Bob> Excellent. The Pareto chart that you have drawn is called a cumulative probability distribution function … and that is usually what percentiles refer to. Comparative Statisticians love these but often omit to explain their rationale to non-statisticians!


<Leslie> Phew!  So, now I can see that the 65th percentile is just above average demand, and 85th percentile is above that.  But in the confusing paragraph how does that relate to the phrase “65% and 85% of the time”?

<Bob> It doesn’t. That is the really, really confusing part of  that paragraph. I am not surprised that you looped out at that point!

<Leslie> OK. Let us leave that for another conversation.  If I ignore that bit then does the rest of it make sense?

<Bob> Not yet alas. We need to dig a bit deeper. What would you say are the implications of this message?


<Leslie> Well.  I know that if our flow-capacity is less than our average demand then we will guarantee to create an unstable queue and chaos. That is the Flaw of Averages trap.

<Bob> OK.  The creator of this tool seems to know that.

<Leslie> And my outpatient manager colleagues are always complaining that they do not have enough slots to book into, so I conclude that our current flow-capacity is just above the 50th percentile.

<Bob> A reasonable hypothesis.

<Leslie> So to calm the chaos the message is saying I will need to increase my flow capacity up to the 85th percentile of demand which is from about 150 slots per week to 170 slots per week. An increase of 7% which implies a 7% increase in costs.

<Bob> Good.  I am pleased that you did not fall into the intuitive trap that a increase from the 50th to the 85th percentile implies a 35/50 or 70% increase! Your estimate of 7% is a reasonable one.

<Leslie> Well it may be theoretically reasonable but it is not practically possible. We are exhorted to reduce costs by at least that amount.

<Bob> So we have a finance versus governance bun-fight with the operational managers caught in the middle: FOG. That is not the end of the litany of woes … is there anything about Did Not Attends in the model?


<Leslie> Yes indeed! We are required to enter the percentage of DNAs and what we do with them. Do we discharge them or re-book them.

<Bob> OK. Pragmatic reality is always much more interesting than academic rhetoric and this aspect of the real system rather complicates things, at least for a comparative statistician. This is where the smoke and mirrors will appear and they will be hidden inside the black magic box.  To solve this conundrum we need to understand the relationship between demand, capacity, variation and yield … and it is rather counter-intuitive.  So, how would you approach this problem?

<Leslie> I would use the 6M Design® framework and I would start with a map and not with a model; least of all a magic black box one that I did not design, build and verify myself.

<Bob> And how do you know that will work any better?

<Leslie> Because at the One Day ISP Workshop I saw it work with my own eyes. The queues, waits and chaos just evaporated.  And it cost nothing.  We already had more than enough “capacity”.

<Bob> Indeed you did.  So shall we do this one as an ISP-2 project?

<Leslie> An excellent suggestion.  I already feel my confidence flowing back and I am looking forward to this new challenge. Thank you again Bob.

Emergent Learning

CAS_DiagramThe theme this week has been emergent learning.

By that I mean the ‘ah ha’ moment that happens when lots of bits of a conceptual jigsaw go ‘click’ and fall into place.

When, what initially appears to be smoky confusion suddenly snaps into sharp clarity.  Eureka!  And now new learning can emerge.


This did not happen by accident.  It was engineered.


The picture above is part of a bigger schematic map of a system – in this case a system related to the global health challenge of escalating obesity.

It is a complicated arrangement of boxes and arrows. There are  dotted lines that outline parts of the system that have leaky boundaries like the borders on a political map.

But it is a static picture of the structure … it tells us almost nothing about the function, the system behaviour.

And our intuition tells us that, because it is a complicated structure, it will exhibit complex and difficult to understand behaviour.  So, guided by our inner voice, we toss it into the pile labelled Wicked Problems and look for something easier to work on.


Our natural assumption that a complicated structure always leads to complex behavior is an invalid simplification, and one that we can disprove in a matter of moments.


Exhibit 1. A system can be complicated and yet still exhibit simple, stable and predictable behavior.

Harrison_H1The picture is of a clock designed and built by John Harrison (1693-1776).  It is called H1 and it is a sea clock.

Masters of sailing ships required very accurate clocks to calculate their longitude, the East-West coordinate on the Earth’s surface. And in the 18th Century this was a BIG problem. Too many ships were getting lost at sea.

Harrison’s sea clock is complicated.  It has many moving parts, but it was the most stable and accurate clock of its time.  And his later ones were smaller, more accurate and even more complicated.


Exhibit 2.  A system can be simple yet still exhibit complex, unstable and unpredictable behavior.

Double-compound-pendulumThe image is of a pendulum made of only two rods joined by a hinge.  The structure is simple yet the behavior is complex, and this can only be appreciated with a dynamic visualisation.

The behaviour is clearly not random. It has an emergent structure. It is called chaotic.

So, with these two real examples we have disproved our assumption that a complicated structure always leads to complex behaviour; and we have also disproved its inverse … that complex behavior always comes from a complicated structure.

The cognitive trap we have exposed here is over-generalisation, the unconscious habit of slipping in the implied [always].


This deeper understanding gives us hope.

John Harrison was a rare, naturally-gifted, mechanical genius.  And to make it easier, he was working on a purely mechanical system comprised of non-living parts that only obeyed the Laws of Newtonian physics.  And even with those advantages it took him decades to learn how to design and to build his sea clocks.  He was the first to do so and he was self-educated so his learning was emergent.

If there were a way to design complicated systems to exhibit stable and predictable behaviour, how could more of us learn how to do that?


Our healthcare system is not made of passive, mechanical cogs and springs.  The parts are active, living people whose actions are limited by physical Laws but whose decisions are steered by other policies … learned ones … and ones that can change.  These learned rules of thumb are called heuristics and they vary from person-to-person and from minute-to-minute.  Heuristics can be learned, unlearned, updated, and evolved.

This is called emergent learning.

And to generate it we only need to create the context for it … the rest happens … as if by magic … but only if we design a fit-for-purpose context.


This week I personally observed over a dozen healthcare staff simultaneously re-invent a complicated process scheduling technique, at the same time as using it to eliminate the  queues, waiting and chaos in the system they wanted to improve.

Their queues just evaporated … without requiring any extra capacity or money. Eureka!


We did not show them how to do it so they could not have just copied what we did.

We designed and built the context for their learning to emerge … and it did.  On its own.

The One Day Practical Skills Workshop delivered emergent learning … just as it was designed to do.

A health care system is a complex adaptive system (CAS), and system improvement-by-design is what systems engineers (SE) are trained to do.

And this emerging style of complex adaptive systems engineering (CASE) is at the cutting edge of human knowledge, and when applied in the health care domain it is called health care systems engineering (HCSE).

Our experience of the emergent learning that flows from the practical skills workshops verifies that CASE is both possible, learnable, teachable, applicable and effective.

Yield

Dr_Bob_ThumbnailA recurring theme this week has been the concept of ‘quality’.

And it became quickly apparent that a clear definition of quality is often elusive.

Which seems to have led to a belief that quality is difficult to measure because it is subjective and has no precise definition.

The science of quality improvement is nearly 100 years old … and it was shown a long time ago, in 1924 in fact, that it is rather easy to measure quality – objectively and scientifically.

The objective measure of quality is called “yield”.

To measure yield we simply ask all our customers this question:

Did your experience meet your expectation?” 

If the answer is ‘Yes’ then we count this as OK; if it is ‘No’ then we count it as Not OK.

Yield is the ratio of the OKs divided by the number of customers who answered.


But this tried-and-tested way of measuring quality has a design flaw:

Where does a customer get their expectation from?

Because if a customer has an unrealistically high expectation then whatever we do will be perceived by them as Not OK.

So to consistently deliver a high quality service (i.e. high yield) we need to be able to influence both the customer experience and the customer expectation.


If we set our sights on a worthwhile and realistic expectation and we broadcast that to our customers, then we also need a way of avoiding their disappointment … that our objective quality outcome audit may reveal.

One way to defuse disappointment is to set a low enough expectation … which is, sadly, the approach adopted by naysayers,  complainers, cynics and doom-mongers. The inept.

That is not the path to either improvement or to excellence. It is the path to apathy.

A better approach is to set ourselves some internal standards of expectation and to check at each step if our work meets our own standard … and if it fails then we know we need have some more work to do.

This commonly used approach to maintaining quality is called a check-and-correct design.

So let us explore the ramifications of this check-and-correct approach to quality.


Suppose the quality of the product or service that we deliver is influenced by many apparently random factors. And when we actually measure our yield we discover that the chance of getting a right-first-time outcome is about 50%.  This amounts to little more than a quality lottery and we could simulate that ‘random’ process by tossing a coin.

So to set a realistic expectation for future customers there are two further questions we need to answer:
1. How long can an typical customer expect to wait for our product or service?
2. How much can an typical customer expect to pay for our product or service?

It is not immediately and intuitively obvious what the answers to these questions are … so we need to perform an experiment to find out.

Suppose we have five customers who require our product or service … we could represent them as Post It Notes; and suppose we have a clock … we could measure how long the process is taking; and suppose we have our coin … we can simulate the yield of the step; … and suppose we do not start the lead time clock until we start the work for each customer.

We now have the necessary and sufficient components to assemble a simple simulation model of our system … a model that will give us realistic answers to our questions.

So let us see what happens … just click the ‘Start Game’ button.

Http iframes are not shown in https pages in many major browsers. Please read this post for details.


It is worth running this exercise about a dozen times and recording the data for each run … then plotting the results on a time-series chart.

The data to plot is the make-time (which is the time displayed on the top left) and the cost (which is display top middle).

The make-time is the time from starting the first game to completing the last task.

The cost is the number of coin tosses we needed to do to deliver all work to the required standard.

And here are the charts from my dozen runs (yours will be different).

PostItNote_MakeTimeChart

PostItNote_CostChart

The variation from run to run is obvious; as is the correlation between a make-time and a high cost.

The charts also answer our two questions … a make time up to 90 would not be exceptional and an average cost of 10 implies that is the minimum price we need to charge in order to stay in business.

Our customers are waiting while we check-and-correct our own errors and we are expecting them to pay for the extra work!

In the NHS we have a name for this low-quality high-cost design: Payment By Results.


The charts also show us what is possible … a make time of 20 and a cost of 5.

That happened when, purely by chance, we tossed five heads in a row in the Quality Lottery.

So with this insight we could consider how we might increase the probability of ‘throwing a head’ i.e. doing the work right-first-time … because we can see from our charts what would happen.

The improved quality and cost of changing ourselves and our system to remove the root causes of our errors.

Quality Improvement-by-Design.

That something worth learning how to do.

And can we honestly justify not doing it?

Excellent or Mediocre?

smack_head_in_disappointment_150_wht_16653Many organisations proclaim that their mission is to achieve excellence but then proceed to deliver mediocre performance.

Why is this?

It is certainly not from lack of purpose, passion or people.

So the flaw must lie somewhere in the process.


The clue lies in how we measure performance … and to see the collective mindset behind the design of the performance measurement system we just need to examine the key performance indicators or KPIs.

Do they measure failure or success?


Let us look at some from the NHS …. hospital mortality, hospital acquired infections, never events, 4-hour A&E breaches, cancer wait breaches, 18 week breaches, and so on.

In every case the metric reported is a failure metric. Not a success metric.

And the focus of action is getting away from failure.

Damage mitigation, damage limitation and damage compensation.


So we have the answer to our question: we know we are doing a good job when we are not failing.

But are we?

When we are not failing we are not doing a bad job … is that the same as doing a good job?

Q: Does excellence  = not excrement?

A: No. There is something between these extremes.

The succeed-or-fail dichotomy is a distorting simplification created by applying an arbitrary threshold to a continuous measure of performance.


And how, specifically, have we designed our current system to avoid failure?

Usually by imposing an arbitrary target connected to a punitive reaction to failure. Management by fear.

This generates punishment-avoidance and back-covering behaviour which is manifest as a lot of repeated checking and correcting of the inevitable errors that we find.  A lot of extra work that requires extra time and that requires extra money.

So while an arbitrary-target-driven-check-and-correct design may avoid failing on safety, the additional cost may cause us to then fail on financial viability.

Out of the frying pan and into the fire.

No wonder Governance and Finance come into conflict!

And if we do manage to pull off a uneasy compromise … then what level of quality are we achieving?


Studies show that if take a random sample of 100 people from the pool of ‘disappointed by their experience’ and we ask if they are prepared to complain then only 5% will do so.

So if we use complaints as our improvement feedback loop and we react to that and make changes that eliminate these complaints then what do we get? Excellence?

Nope.

We get what we designed … just good enough to avoid the 5% of complaints but not the 95% of disappointment.

We get mediocrity.


And what do we do then?

We start measuring ‘customer satisfaction’ … which is actually asking the question ‘did your experience meet your expectation?’

And if we find that satisfaction scores are disappointingly low then how do we improve them?

We have two choices: improve the experience or reduce the expectation.

But as we are very busy doing the necessary checking-and-correcting then our path of least resistance to greater satisfaction is … to lower expectations.

And we do that by donning the black hat of the pessimist and we lay out the the risks and dangers.

And by doing that we generate anxiety and fear.  Which was not the intended outcome.


Our mission statement proclaims ‘trusted to achieve excellence’ not ‘designed to deliver mediocrity’.

But mediocrity is what the evidence says we are delivering. Just good enough to avoid a smack from the Regulators.

And if we are honest with ourselves then we are forced to conclude that:

A design that uses failure metrics as the primary feedback loop can achieve no better than mediocrity.


So if we choose  to achieve excellence then we need a better feedback design.

We need a design that uses success metrics as the primary feedback loop and we use failure metrics only in safety critical contexts.

And the ideal people to specify the success metrics are those who feel the benefit directly and immediately … the patients who receive care and the staff who give it.

Ask a patient what they want and they do not say “To be treated in less than 18 weeks”.  In fact I have yet to meet a patient who has even heard of the 18-week target!

A patient will say ‘I want to know what is wrong, what can be done, when it can be done, who will do it, what do I need to do, and what can I expect to be the outcome’.

Do we measure any of that?

Do we measure accuracy of diagnosis? Do we measure use of best evidenced practice? Do we know the possible delivery time (not the actual)? Do we inform patients of what they can expect to happen? Do we know what they can expect to happen? Do we measure outcome for every patient? Do we feed that back continuously and learn from it?

Nope.


So …. if we choose and commit to delivering excellence then we will need to start measuring-4-success and feeding what we see back to those who deliver the care.

Warts and all.

So that we know when we are doing a good job, and we know where to focus further improvement effort.

And if we abdicate that commitment and choose to deliver mediocrity-by-default then we are the engineers of our own chaos and despair.

We have the choice.

We just need to make it.