Excellence By Design

top_surgeon_400_wht_7589All healthcare organisations strive for excellence, which is good, and most achieve mediocrity, which is not so good.

Why is that?

One cause is the design of their model for improvement … the one that is driven by targets, complaints, near misses, serious untoward incidents (SUIs) and never events (which are not never).

A model for improvement that is driven by failure feedback loops can only ever achieve mediocrity, not excellence.

Whaaaaaat?!* That’s rubbish”  I hear you cry … so let us see.


Try this simple test …. just ask any employee in your organisation this question (and start with yourself):

How do you know you are doing a good job?

If the first answer heard is “When no one is complaining” then you have a Mediocrity Design.


When customers have a disappointing experience most do not pen a letter or write an email to complain.  Most just sigh and lower their expectations to avoid future disappointment; many will grumble to family and friends; and only a few (about 5%) will actually complain. They are the really angry extreme.  So they can easily be fobbed off with platitudes … just being earnestly listened to and unreservedly apologised to is usually enough to take the wind out of their sails.  It will escort them back to the silent but disappointed majority whose expectation is being gradually eroded by relentless disappointment. Nothing fundamental needs to change because eventually the complaints dry up, apathy is re-established and chronic mediocrity is assured.


To achieve excellence we need a better answer to the “How do you know you are doing a good job?” question.

We need to be able to say “I know I am doing a good job because this is what a good outcome looks like; this is my essential contribution to achieving that outcome; and here are the measures of the intended outcomes that we are achieving.

In short we need a clear purpose, a defined part in the process that delivers that purpose, and we need an objective feedback loop that tells us that the purpose has been achieved and that our work is worthwhile.

And if  any of those components are missing then we know we have some improvement work to do.

The first step is usually answering the question “What is our purpose?

The second step is using the purpose to design and install the how-are-we-doing feedback loop.

And the  third step is to learn to use the success feedback loop to ensure that we are always working to have a necessary-and-sufficient process that delivers the intended outcome and that we are playing a part in that.

And when we are reliably achieving our purpose, we set ourselves an even better outcome – an even safer, calmer, higher quality and more productive one … and doing that will generate more improvement work to do.  We will not be idle.


That is the essence of Excellence-by-Design.

Celebrate and Share

There comes a point in every improvement journey when it is time to celebrate and share. This is the most rewarding part of the Improvement Science Practitioner (ISP) coaching role so I am going to share a real celebration that happened this week.

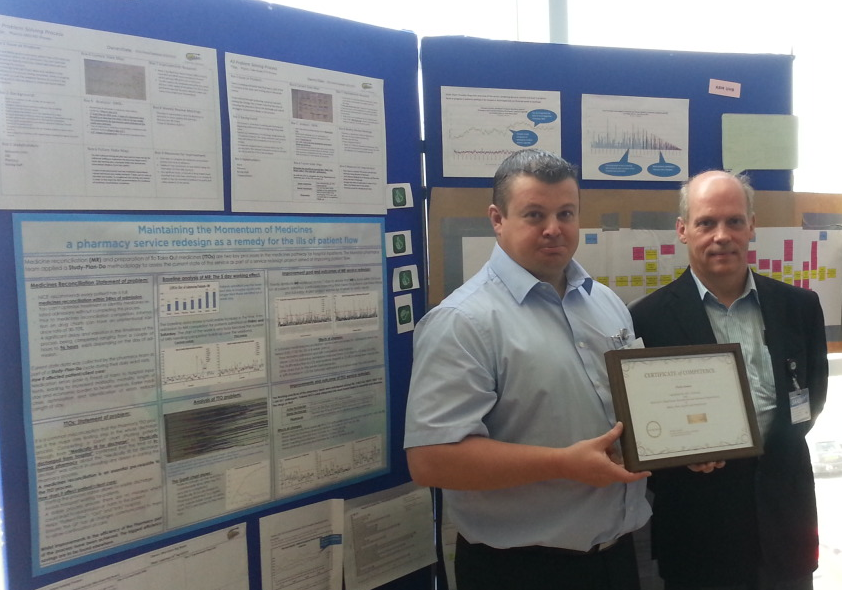
The picture shows Chris Jones holding his well-earned ISP-1 Certificate of Competence.  The “Maintaining the Momentum of Medicines”  redesign project is shown on the poster on the left and it is the tangible Proof of Competence. The hard evidence that the science of improvement delivers.

Chris_Jones_Poster_and_Certificate

Behind us are the A3s for one of the Welsh Health Boards;  ABMU in fact.


An A3 is a way of summarising an improvement project very succinctly – the name comes from the size of paper used.  A3 is the biggest size that will go through an A4 fax machine (i.e. folded over) and the A3 discipline is to be concise and clear at the same time.

The three core questions that the A3 answers are:
Q1: What is the issue?
Q2: What would improvement need to look like?
Q3: How would we know that a change is an improvement?

This display board is one of many in the room, each sharing a succinct story of a different improvement journey and collectively a veritable treasure trove of creativity and discovery.

The A3s were of variable quality … and that is OK and is expected … because like all skills it takes practice. Lots of practice. Perfection is not the goal because it is unachievable. Best is not the goal because only one can be best. Progress is the goal because everyone can progress … and so progress is what we share and what we celebrate.


The event was the Fifth Sharing Event in the Welsh Flow Programme that has been running for just over a year and Chris is the first to earn an ISP-1 Certificate … so we all celebrated with him and shared the story.  It is a team achievement – everyone in the room played a part in some way – as did many more who were not in the room on the day.


stick_figure_look_point_on_cliff_anim_8156Improvement is like mountain walking.

After a tough uphill section we reach a level spot where we can rest; catch our breath; take in the view; reflect on our progress and the slips, trips and breakthroughs along the way; perhaps celebrate with drink and nibble of our chocolate ration; and then get up, look up, and square up for the next uphill bit.

New territory for us.  New challenges and new opportunities to learn and to progress and to celebrate and share our improvement stories.

The Improvement Pyramid

IS_PyramidDeveloping productive improvement capability in an organisation is like building a pyramid in the desert.

It is not easy and it takes time before there is any visible evidence of success.

The height of the pyramid is a measure of the level of improvement complexity that we can take on.

An improvement of a single step in a system would only require a small pyramid.

Improving the whole system will require a much taller one.


But if we rush and attempt to build a sky-scraper on top of the sand then we will not be surprised when it topples over before we have made very much progress.  The Egyptians knew this!

First, we need to dig down and to lay some foundations.  Stable enough and strong enough to support the whole structure.  We will never see the foundations so it is easy to forget them in our rush but they need to be there and they need to be there first.

It is the same when developing improvement science capability  … the foundations are laid first and when enough of that foundation knowledge is in place we can start to build the next layer of the pyramid: the practitioner layer.


It is the the Improvement Science Practitioners (ISPs) who start to generate tangible evidence of progress.  The first success stories help to spur us all on to continue to invest effort, time and money in widening our foundations to be able to build even higher – more layers of capability -until we can realistically take on a system wide improvement challenge.

So sharing the first hard evidence of improvement is an important milestone … it is proof of fitness for purpose … and that news should be shared with those toiling in the hot desert sun and with those watching from the safety of the shade.

So here is a real story of a real improvement pyramid achieving this magical and motivating milestone.


V.U.T.

figure_pointing_out_chart_data_150_wht_8005It was the appointed time for the ISP coaching session and both Bob and Leslie were logged on and chatting about their Easter breaks.

<Bob> OK Leslie, I suppose we had better do some actual work, which seems a shame on such a wonderful spring day.

<Leslie> Yes, I suppose so. There is actually something I would like to ask you about because I came across it by accident and it looked very pertinent to flow design … but you have never mentioned it.

<Bob> That sounds interesting. What is it?

<Leslie> V.U.T.

<Bob> Ah ha!  You have stumbled across the Queue Theorists and the Factory Physicists.  So, what was your take on it?

<Leslie> Well it all sounded very impressive. The context is I was having a chat with a colleague who is also getting into the improvement stuff and who had been to a course called “Factory Physics for Managers” – and he came away buzzing about the VUT equation … and claimed that it explained everything!

<Bob> OK. So what did you do next?

<Leslie> I looked it up of course and I have to say the more I read the more confused I got. Maybe I am just a bid dim and not up to understanding this stuff.

<Bob> Well you are certainly not dim so your confusion must be caused by something else. Did your colleague describe how the VUT equation is applied in practice?

<Leslie> Um. No, I do not remember him describing an example – just that it explained why we cannot expect to run resources at 100% utilisation.

<Bob> Well he is correct on that point … though there is a bit more to it than that.  A more accurate statement is “We cannot expect our system to be stable if there is variation and we run flow-resources at 100% utilisation”.

<Leslie> Well that sounds just like the sort of thing we have been talking about, what you call “resilient design”, so what is the problem with the VUT equation?

<Bob> The problem is that it gives an estimate of the average waiting time in a very simple system called a G/G/1 system.

<Leslie> Eh? What is a G/G/1 system?

<Bob> Arrgh … this is the can of queue theory worms that I was hoping to avoid … but as you brought it up let us grasp the nettle.  This is called Kendall’s Notation and it is a short cut notation for describing the system design. The first letter refers to the arrivals or demand and G means a general distribution of arrival times; the second G refers to the size of the jobs or the cycle time and again the distribution is general; and the last number refers to the number of parallel resources pulling from the queue.

<Leslie> OK, so that is a single queue feeding into a single resource … the simplest possible flow system.

<Bob> Yes. But that isn’t the problem.  The problem is that the VUT equation gives an approximation to the average waiting time. It tells us nothing about the variation in the waiting time.

<Leslie> Ah I see. So it tells us nothing about the variation in the size of the queue either … so does not help us plan the required space-capacity to hold the varying queue.

<Bob> Precisely.  There is another problem too.  The ‘U’ term in the VUT equation refers to utilisation of the resource … denoted by the symbol ? or rho.  The actual term is ? / (1-?) … so what happens when rho approaches one … or in practical terms the average utilisation of the resource approaches 100%?

<Leslie> Um … 1 divided by (1-1) is 1 divided by zero which is … infinity!  The average waiting time becomes infinitely long!

<Bob> Yes, but only if we wait forever – in reality we cannot and anyway – reality is always changing … we live in a dynamic, ever-changing, unstable system called Reality. The VUT equation may be academically appealing but in practice it is almost useless.

<Leslie> Ah ha! Now I see why you never mentioned it. So how do we design for resilience in practice? How do we get a handle on the behaviour of even the G/G/1 system over time?

<Bob> We use an Excel spreadsheet to simulate our G/G/1 system and we find a fit-for-purpose design using an empirical, experimental approach. It is actually quite straightforward and does not require any Queue Theory or VUT equations … just a bit of basic Excel know-how.

<Leslie> Phew!  That sounds more up my street. I would like to see an example.

<Bob> Welcome to the first exercise in ISP-2 (Flow).