
 A story was shared this week.
A story of hope for the hard-pressed NHS, its patients, its staff and its managers and its leaders.
A story that says “We can learn how to fix the NHS ourselves“.
And the story comes with evidence; hard, objective, scientific, statistically significant evidence.
The story starts almost exactly three years ago when a Clinical Commissioning Group (CCG) in England made a bold strategic decision to invest in improvement, or as they termed it “Achieving Clinical Excellence” (ACE).
They invited proposals from their local practices with the “carrot” of enough funding to allow GPs to carve-out protected time to do the work. And a handful of proposals were selected and financially supported.
This is the story of one of those proposals which came from three practices in Sutton who chose to work together on a common problem – the unplanned hospital admissions in their over 70’s.
Their objective was clear and measurable: “To reduce the cost of unplanned admissions in the 70+ age group by working with hospital to reduce length of stay.“
Did they achieve their objective?
Yes, they did. But there is more to this story than that. Much more.
One innovative step they took was to invest in learning how to diagnose why the current ‘system’ was costing what it was; then learning how to design an improvement; and then learning how to deliver that improvement.
They invested in developing their own improvement science skills first.
They did not assume they already knew how to do this and they engaged an experienced health care systems engineer (HCSE) to show them how to do it (i.e. not to do it for them).
Another innovative step was to create a blog to make it easier to share what they were learning with their colleagues; and to invite feedback and suggestions; and to provide a journal that captured the story as it unfolded.
And they measured stuff before they made any changes and afterwards so they could measure the impact, and so that they could assess the evidence scientifically.
And that was actually quite easy because the CCG was already measuring what they needed to know: admissions, length of stay, cost, and outcomes.
All they needed to learn was how to present and interpret that data in a meaningful way. And as part of their IS training, they learned how to use system behaviour charts, or SBCs.
By Jan 2015 they had learned enough of the HCSE techniques and tools to establish the diagnosis and start to making changes to the parts of the system that they could influence.
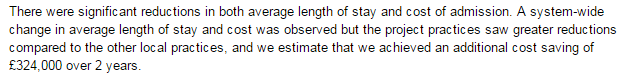
Two years later they subjected their before-and-after data to robust statistical analysis and they had a surprise. A big one!
![]()
Reducing hospital mortality was not a stated objective of their ACE project, and they only checked the mortality data to be sure that it had not changed.
But it had, and the “p=0.014” part of the statement above means that the probability that this 20.0% reduction in hospital mortality was due to random chance … is less than 1.4%. [This is well below the 5% threshold that we usually accept as “statistically significant” in a clinical trial.]
But …
This was not a randomised controlled trial. This was an intervention in a complicated, ever-changing system; so they needed to check that the hospital mortality for comparable patients who were not their patients had not changed as well.
And the statistical analysis of the hospital mortality for the ‘other’ practices for the same patient group, and the same period of time confirmed that there had been no statistically significant change in their hospital mortality.
So, it appears that what the Sutton ACE Team did to reduce length of stay (and cost) had also, unintentionally, reduced hospital mortality. A lot!
And this unexpected outcome raises a whole raft of questions …
If you would like to read their full story then you can do so … here.
It is a story of hunger for improvement, of humility to learn, of hard work and of hope for the future.