Creep-Crack-Crunch

The current crisis of confidence in the NHS has all the hallmarks of a classic system behaviour called creep-crack-crunch.

The first obvious crunch may feel like a sudden shock but it is usually not a complete surprise and it is actually one of a series of cracks that are leading up to a BIG CRUNCH. These cracks are an early warning sign of pressure building up in parts of the system and causing localised failures. These cracks weaken the whole system. The underlying cause is called creep.

SanFrancisco_PostEarthquake

Earthquakes are a perfect example of this phenomemon. Geological time scales are measured in thousands of years and we now know that the surface of the earth is a dynamic structure with vast contient-sized plates of solid rock floating on a liquid core of molten magma. Over millions of years the continents have moved huge distances and the world we see today on our satellite images is just a single frame in a multi-billion year geological video.  That is the geological creep bit. The cracks first appear at the edges of these tectonic plates where they smash into each other, grind past each other or are pulled apart from each other.  The geological hot-spots are marked out on our global map by lofty mountain ranges, fissured earthquake zones, and deep mid-ocean trenches. And we know that when a geological crunch arrives it happens in a blink of the geological eye.

The panorama above shows the devastation of San Francisco caused by the 1906 earthquake. San Francisco is built on the San Andreas Fault – the junction between the Pacific plate and the North American plate. The dramatic volcanic eruption in Iceland in 2010 came and went in a matter of weeks but the irreversible disruption it caused for global air traffic will be felt for years. The undersea earthquakes that caused the devastating tsunamis in 2006 and 2011 lasted only a few minutes; the deadly shock waves crossed an ocean in a matter of hours; and when they arrived the silent killer wiped out whole shoreside communities in seconds. Tens of thousands of lives were lost and the social after-shocks of that geological-crunch will be felt for decades.

These are natural disasters. We have little or no influence over them. Human-engineered disasters are a different matter – and they are just as deadly.

The NHS is an example. We are all painfully aware of the recent crisis of confidence triggered by the Francis Report. Many could see the cracks appearing and tried to blow their warning whistles but with little effect – they were silenced with legal gagging clauses and the opening cracks were papered over. It was only after the crunch that we finally acknowledged what we already knew and we started to search for the creep. Remorse and revenge does not bring back those who have been lost.  We need to focus on the future and not just point at the past.
UK_PopulationPyramid_2013Socio-economic systems evolve at a pace that is measured in years. So when a social crunch happens it is necessary to look back several decades for the tell-tale symptoms of creep and the early signs of cracks appearing.

Two objective measures of a socio-economic system are population and expenditure.

Population is people-in-progress; and national expenditure is the flow of the cash required to keep the people-in-progress watered, fed, clothed, housed, healthy and occupied.

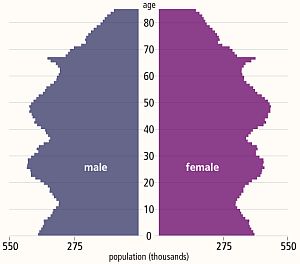
The diagram above is called a population pyramid and it shows the distribution by gender and age of the UK population in 2013. The wobbles tell a story. It does rather look like the profile of a bushy-eyebrowed, big-nosed, pointy-chinned old couple standing back-to-back and maybe there is a hidden message for us there?

The “eyebrow” between ages 67 and 62 is the increase in births that happened 62 to 67 years ago: betwee 1946 and 1951. The post WWII baby boom.  The “nose” of 42-52 year olds are the “children of the 60’s” which was a period of rapid economic growth and new optimism. The “upper lip” at 32-42 correlates with the 1970’s that was a period of stagnant growth,  high inflation, strikes, civil unrest and the dark threat of global thermonuclear war. This “stagflation” is now believed to have been triggered by political meddling in the Middle-East that led to the 1974 OPEC oil crisis and culminated in the “winter of discontent” in 1979.  The “chin” signals there was another population expansion in the 1980s when optimism returned (SALT-II was signed in 1979) and the economy was growing again. Then the “neck” contraction in the 1990’s after the 1987 Black Monday global stock market crash.  Perhaps the new optimism of the Third Millenium led to the “chest” expansion but the financial crisis that followed the sub-prime bubble to burst in 2008 has yet to show its impact on the population chart. This static chart only tells part of the story – the animated chart reveals a significant secondary expansion of the 20-30 year old age group over the last decade. This cannot have been caused by births and is evidence of immigration of a large number of young couples – probably from the expanding Europe Union.

If this “yo-yo” population pattern is repeated then the current economic downturn will be followed by a contraction at the birth end of the spectrum and possibly also net emigration. And that is a big worry because each population wave takes a 100 years to propagate through the system. The most economically productive population – the  20-60 year olds  – are the ones who pay the care bills for the rest. So having a population curve with lots of wobbles in it causes long term socio-economic instability.

Using this big-picture long-timescale perspective; evidence of an NHS safety and quality crunch; silenced voices of cracks being papered-over; let us look for the historical evidence of the creep.

Nowadays the data we need is literally at our fingertips – and there is a vast ocean of it to swim around in – and to drown in if we are not careful.  The Office of National Statistics (ONS) is a rich mine of UK socioeconomic data – it is the source of the histogram above.  The trick is to find the nuggets of knowledge in the haystack of facts and then to convert the tables of numbers into something that is a bit more digestible and meaningful. This is what Russ Ackoff descibes as the difference between Data and Information. The data-to-information conversion needs context.

Rule #1: Data without context is meaningless – and is at best worthless and at worse is dangerous.

boxes_connected_PA_150_wht_2762With respect to the NHS there is a Minotaur’s Labyrinth of data warehouses – it is fragmented but it is out there – in cyberspace. The Department of Health publishes some on public sites but it is a bit thin on context so it can be difficult to extract the meaning.

Relying on our memories to provide the necessary context is fraught with problems. Memories are subject to a whole range of distortions, deletions, denials and delusions.  The NHS has been in existence since 1948 and there are not many people who can personally remember the whole story with objective clarity.  Fortunately cyberspace again provides some of what we need and with a few minutes of surfing we can discover something like a website that chronicles the history of the NHS in decades from its creation in 1948 – http://www.nhshistory.net/ – created and maintained by one person and a goldmine of valuable context. The decade that is of particular interest is 1998-2007 – Chapter 6

With just some data and some context it is possible to pull together the outline of the bigger picture of the decade that led up to the Mid Staffordshire healthcare quality crunch.

We will look at this as a NHS system evolving over time within its broader UK context. Here is the time-series chart of the population of England – the source of the demand on the NHS.
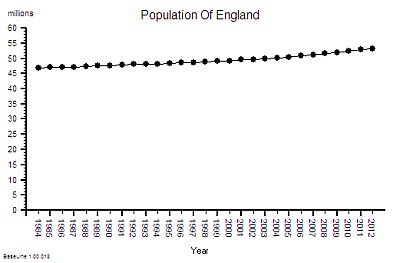
Population_of_England_1984-2010This shows a significant and steady increase in population – 12% overall between 1984 an 2012.

This aggregate hides a 9% increase in the under 65 population and 29% growth in the over 65 age group.

This is hard evidence of demographic creep – a ticking health and social care time bomb. And the curve is getting steeper. The pressure is building.

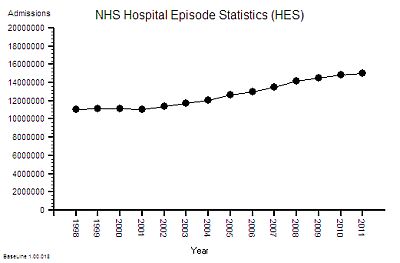
The next bit of the map we need is a measure of the flow through hospitals – the activity – and this data is available as the annual HES (Hospital Episodes Statistics) reports.  The full reports are hundreds of pages of fine detail but the headline summaries contain enough for our present purpose.

NHS_HES_Admissions_1997-2011

The time- series chart shows a steady increase in hospital admissions. Drilling into the summaries revealed that just over a third are emergency admissions and the rest are planned or maternity.

In the decade from 1998 to 2008 there was a 25% increase in hospital activity. This means more work for someone – but how much more and who for?

But does it imply more NHS beds?

Beds require wards, buildings and infrastructure – but it is the staff that deliver the health care. The bed is just a means of storage.  One measure of capacity and cost is the number of staffed beds available to be filled.  But this like measuring the number of spaces in a car park – it does not say much about flow – it is a just measure of maximum possible work in progress – the available space to hold the queue of patients who are somewhere between admission and discharge.

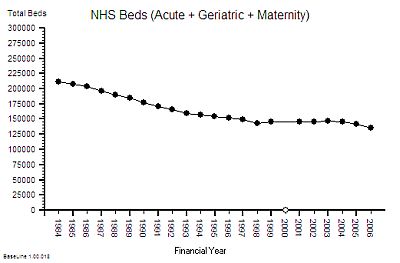
Here is the time series chart of the number of NHS beds from 1984 to 2006. The was a big fall in the number of beds in the decade after 1984 [Why was that?]

NHS_Beds_1984-2006

Between 1997 and 2007 there was about a 10% fall in the number of beds. The NHS patient warehouse was getting smaller.

But the activity – the flow – grew by 25% over the same time period: so the Laws Of Physics say that the flow must have been faster.

The average length of stay must have been falling.

This insight has another implication – fewer beds must mean smaller hospitals and lower costs – yes?  After all everyone seems to equate beds-to-cost; more-beds-cost-more less-beds-cost-less. It sounds reasonable. But higher flow means more demand and more workload so that would require more staff – and that means higher costs. So which is it? Less, the same or more cost?
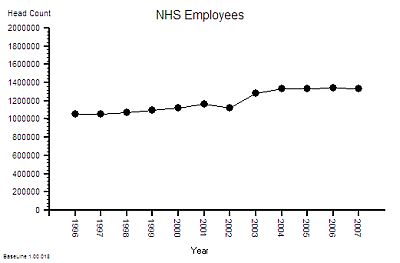
NHS_Employees_1996_2007The published data says that staff headcount  went up by 25% – which correlates with the increase in activity. That makes sense.

And it looks like it “jumped” up in 2003 so something must have triggered that. More cash pumped into the system perhaps? Was that the effect of the Wanless Report?

But what type of staff? Doctors? Nurses? Admin and Clerical? Managers?  The European Working Time Directive (EWTD) forced junior doctors hours down and prompted an expansion of consultants to take on the displaced service work. There was also a gradual move towards specialisation and multi-disciplinary teams. What impact would that have on cost? Higher most likely. The system is getting more complex.

Of course not all costs have the same impact on the system. About 4% of staff are classified as “management” and it is this group that are responsible for strategic and tactical planning. Managers plan the work – workers work the plan.  The cost and efficiency of the management component of the system is not as useful a metric as the effectiveness of its collective decision making. Unfortuately there does not appear to be any published data on management decision making qualty and effectiveness. So we cannot estimate cost-effectiveness. Perhaps that is because it is not as easy to measure effectiveness as it is to count admissions, discharges, head counts, costs and deaths. Some things that count cannot easily be counted. The 4% number is also meaningless. The human head represents about 4% of the bodyweight of an adult person – and we all know that it is not the size of our heads that is important it is the effectiveness of the decisions that it makes which really counts!  Effectiveness, efficiency and costs are not the same thing.

Back to the story. The number of beds went down by 10% and number of staff went up by 25% which means that the staff-per-bed ratio went up by nearly 40%.  Does this mean that each bed has become 25% more productive or 40% more productive or less productive? [What exactly do we mean by “productivity”?]

To answer that we need to know what the beds produced – the discharges from hospital and not just the total number, we need the “last discharges” that signal the end of an episode of hospital care.
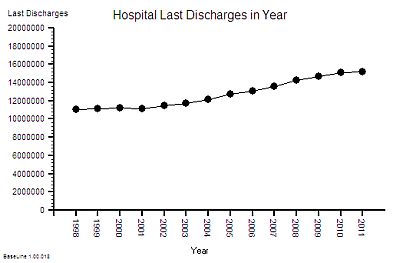
NHS_LastDischarges_1998-2011The time-series chart of last-discharges shows the same pattern as the admissions: as we would expect.

This output has two components – patients who leave alive and those who do not.

So what happened to the number of deaths per year over this period of time?

That data is also published annually in the Hospital Episode Statistics (HES) summaries.

This is what it shows ….
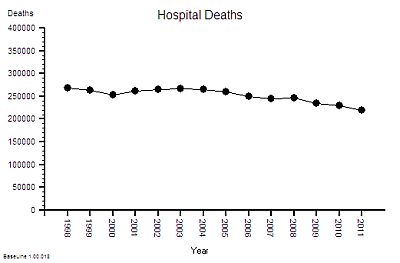
NHS_Absolute_Deaths_1998-2011The absolute hospital mortality is reducing over time – but not steadily. It went up and down between 2000 and 2005 – and has continued on a downward trend since then.

And to put this into context – the UK annual mortality is about 600,000 per year. That means that only about 40% of deaths happen in hospitals. UK annual mortality is falling and births are rising so the population is growing bigger and older.  [My head is now starting to ache trying to juggle all these numbers and pictures in it].

This is not the whole story though – if the absolute hospital activity is going up and the absolute hospital mortality is going down then this raw mortality number may not be telling the whole picture. To correct for those effects we need the ratio – the Hospital Mortality Ratio (HMR).
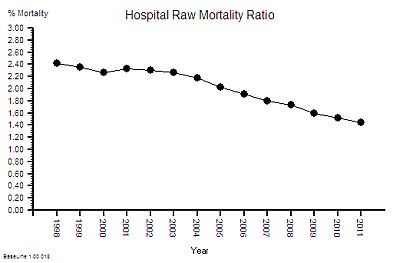
NHS_HospitalMortalityRatio_1998-2011This is the result of combining these two metrics – a 40% reduction in the hospital mortality ratio.

Does this mean that NHS hospitals are getting safer over time?

This observed behaviour can be caused by hospitals getting safer – it can also be caused by hospitals doing more low-risk work that creates a dilution effect. We would need to dig deeper to find out which. But that will distract us from telling the story.

Back to productivity.

The other part of the productivity equation is cost.

So what about NHS costs?  A bigger, older population, more activity, more staff, and better outcomes will all cost more taxpayer cash, surely! But how much more?  The activity and head count has gone up by 25% so has cost gone up by the same amount?
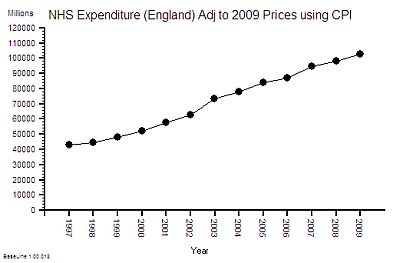
NHS_Annual_SpendThis is the time-series chart of the cost per year of the NHS and because buying power changes over time it has been adjusted using the Consumer Price Index using 2009 as the reference year – so the historical cost is roughly comparable with current prices.

The cost has gone up by 100% in one decade!  That is a lot more than 25%.

The published financial data for 2006-2010 shows that the proportion of NHS spending that goes to hospitals is about 50% and this has been relatively stable over that period – so it is reasonable to say that the increase in cash flowing to hospitals has been about 100% too.

So if the cost of hospitals is going up faster than the output then productivity is falling – and in this case it works out as a 37% drop in productivity (25% increase in activity for 100% increase in cost = 37% fall in productivity).

So the available data which anyone with a computer, an internet connection, and some curiosity can get; and with bit of spreadsheet noggin can turn into pictures shows that over the decade of growth that led up to the the Mid Staffs crunch we had:

1. A slightly bigger population; and a
2. significantly older population; and a
3. 25% increase in NHS hospital activity; and a
4. 10% fall in NHS beds; and a
5. 25% increase in NHS staff; which gives a
6. 40% increase in staff-per-bed ratio; an an
7. 8% reduction in absolute hospital mortality; which gives a
8. 40% reduction in relative hospital mortality; and a
9. 100% increase in NHS  hospital cost; which gives a
10. 37% fall drop in “hospital productivity”.

An experienced Improvement Scientist knows that a system that has been left to evolve by creep-crack-and-crunch can be re-designed to deliver higher quality and higher flow at lower total cost.

The safety creep at Mid-Staffs is now there for all to see. A crack has appeared in our confidence in the NHS – and raises a couple of crunch questions:

Where Has All The Extra Money Gone?

 How Will We Avoid The BIG CRUNCH?

The huge increase in NHS funding over the last decade was the recommendation of the Wanless Report but the impact of implementing the recommendations has never been fully explored. Healthcare is a service system that is designed to deliver two intangible products – health and care. So the major cost is staff-time – particularly the clinical staff.  A 25% increase in head count and a 100% increase in cost implies that the heads are getting more expensive.  Either a higher proportion of more expensive clinically trained and registered staff, or more pay for the existing staff or both.  The evidence shows that about 50% of NHS Staff are doctors and nurses and over the last decade there has been a bigger increase in the number of doctors than nurses. Added to that the Agenda for Change programme effectively increased the total wage bill and the new contracts for GPs and Consultants added more upward wage pressure.  This is cost creep and it adds up over time. The Kings Fund looked at the impact in 2006 and suggested that, in that year alone, 72% of the additional money was sucked up by bigger wage bills and other cost-pressures! The previous year they estimated 87% of the “new money” had disappeared hte same way. The extra cash is gushing though the cracks in the bottom of the fiscal bucket that had been clumsily papered-over. And these are recurring revenue costs so they add up over time into a future financial crunch.  The biggest one may be yet to come – the generous final-salary pensions that public-sector employees enjoy!

So it is even more important that the increasingly expensive clinical staff are not being forced to spend their time doing work that has no direct or indirect benefit to patients.

Trying to do a good job in a poorly designed system is both frustrating and demotivating – and the outcome can be a cynical attitude of “I only work here to pay the bills“. But as public sector wages go up and private sector pensions evaporate the cynics are stuck in a miserable job that they cannot afford to give up. And their negative behaviour poisons the whole pool. That is the long term cumulative cultural and financial cost of poor NHS process design. That is the outcome of not investing earlier in developing an Improvement Science capability.

The good news is that the time-series charts illustrate that the NHS is behaving like any other complex, adaptive, human-engineered value system. This means that the theory, techniques and tools of Improvement Science and value system design can be applied to answer these questions. It means that the root causes of the excessive costs can be diagnosed and selectively removed without compromising safety and quality. It means that the savings can be wisely re-invested to improve the resilience of some parts and to provide capacity in other parts to absorb the expected increases in demand that are coming down the population pipe.

This is Improvement Science. It is a learnable skill.

18/03/2013: Update

The question “Where Has The Money Gone?” has now been asked at the Public Accounts Committee


What Can I Do To Help?

stick_figures_moving_net_150_wht_8609The growing debate about the safety of our health care systems is gaining momentum.

This is not just a UK phenomenon.

The same question was being asked 10 years ago across the pond by many people – perhaps the most familiar name is Don Berwick.

The term Improvement Science has been buzzing around for a long time. This is a global – not just a local challenge.

Seeing the shameful reality in black-and-white [the Francis Report] is a nasty shock to everyone. There are no winners here. Our blissful ignorance is gone. Painful awareness has arrived.

The usual emotional reaction to being shoved from blissful ignorance into painful awareness is characteristic;  and it does not matter if it is discovering horse in your beef pie or hearing of 1200 avoidable deaths in a UK hospital.

Our emotional reaction is a predictable sequence that goes something like:

Shock => Denial => Anger =>Bargaining =>Depression =>Acceptance

=> Resolution.

It is the psychological healing process that is called the grief reaction and it is a normal part of the human psyche. We all do it. And we do it both individually and collectively. I remember well the global grief reactions that followed the sudden explosion of Challenger; the sudden death of Princess Diana; and the sudden collapse of the Twin Towers.

Fortunately such avoidable tragedies are uncommon.

The same chain-reaction happens to a lesser degree in any sudden change. We grieve the loss of our old way of thinking – we mourn the passing away our comfortable rhetoric that has been rudely and suddenly disproved by harsh reality. This is the Nerve Curve.  And learning to ride it safely is a critical-to-survival life skill.  Especially in turbulent times.

The UK population has suffered two psychological shocks in recent weeks – the discovery of horse in the beef pie and the fuller public disclosure of the story behind the 1000’s of avoidable deaths in one of our Trust hospitals. Both are now escalating and the finger of blame is pointing squarely at a common cause: the money-tail-wagging-the-safety-dog.

So what will happen next?  The Wall of Denial has been dynamited with hard evidence. We are now into the Collective Anger phase.

First there will be widespread righteous indignation and a strong desire to blame, to hunt down the evil ones, and to crucify the responsible and accountable. Partly as punishment, partly as a lesson to others, and partly to prevent them doing harm again.  Uncontrolled anger is dangerous especially when there is a lethal weapon to hand. The more controlled, action-oriented and future-focused will want to do something about it. Now! There will be rallies, and soap-boxes, and megaphones. The We-Told-You-So brigade will get shoved aside and trampled in the rush to do something – ANYTHING. Conferences will be hastily arranged and those most fearful for their reputations and jobs will cough up the cash and clear their diaries. They will be expected to be there. They will be. Desperately looking for answers. Anxiously seeking credible leaders. And the snake-oil salesmen will have a bonanza! The calmer, more reflective, phlegmatic, academic types will call for more money for more research so that we can fully analyse and fully understand the problem before we do anything.

And while the noisy bargaining for more cash keeps everyone busy the harm will continue to happen.

Eventually the message will sink in as the majority accept that there is no way to change the past; that we cannot cling to what is out-of-date thinking; and that all of our new-reality-avoiding tactics are fruitless. And we are forced to accept that there is no more cash. Now we are in danger of becoming helpless and hopeless, slipping into depression, and then into despair. We are at risk of giving up and letting ourselves wallow and drown in self-pity. This is a dangerous phase. Depression is understandable but it is avoidable because there is always something than can be done. We can always ask the elephant-in-the-room questions. Inside we usually know the answers.

We accept the new reality; we accept that we cannot change the past, we accept that we have some learning to do; we accept that we have to adjust; and we accept that all of us can do something.

Now we have reached the most important stage – resolution. This is the test of our resolve. Are we all-talk or can we convert talk-to-walk?

stick_figure_help_button_150_wht_9911We can all ask ourselves one question: “What can I do to help?”

I have asked myself that question and my first answer was “As a system designer I can help by looking at this challenge as a design assignment and describe what I see “.

Design starts with the intended outcome, the vision, the goal, the objective, the specification, the target.

The design goal is: Significant reduction in avoidable harm in the NHS, quickly, and at no extra cost.

[Please note that a design goal is a “what we get” not a “what we do”. It is a purpose and not just a process.]

Now we can invite, gather, dream-up, brain-storm any number of design options and then we can consider logically and rationally how well they might meet our design goal.

What are some of the design options on the table?

Design Option 1. Create a cadre of hospital inspectors.

Nope – that will take time and money and inspection alone does not guarantee better outcomes. We have enough evidence of that.

Design Option 2. Get lots more PhDs funded, do high quality academic research, write papers, publish them and hope the evidence is put into practice.

Nope – that will take time and money too and publication alone does not guarantee adoption of the lessons and delivery of better outcomes. We have enough evidence of that too. What is proven to be efficacious in a research trial is not necessarily effective, practical or affordable  in reality.  

Design Option 3. Put together conferences and courses to teach/train a new generation of competent healthcare improvement practitioners.

Maybe – it has the potential to deliver the outcome but it too will take time and money. We have been doing conferences and courses for decades – they are not very cost-effective. The Internet may have changed things though. 

Design Option 4. All of the above plus broadcast via the Internet the current pragmatic know-how of the basics of safe system design to everyone in the NHS so that they know what is possible and they know how to get started.

Promising – it has the greatest potential to deliver the required outcome, a broadcast will cost nothing and it can start working immediately.

OK – Option 4 it is – here we go …

The Basics of How To Design a Safe System

Definition 1: Safe means free of risk of harm.

Definition 2Harm is the result of hazards combining with risks.

There are two components to safe system design – the people stuff and the process stuff.

For example a busy main road is designed to facilitate the transport of stuff from A to B. It also represents a hazard – the potential for harm. If the vehicles bump into each other or other things then harm will result. So a lot of the design of the vehicles and the roads is about reducing the risk of bumps or mitigating the effects (e.g. seat-belts).

The risk is multi-factorial. If you drive at high speed, under the influence of recreational drugs, at night, on an icy road then the probability of having a bump is high.  If you step into a busy road without looking then the risk of getting bumped into is high too.

So the path to better safety is to eliminate as many hazards as possible and to reduce the risks as much as possible. And we have to do that without unintentionally creating more hazards, higher risks, excessive delays and higher costs.

So how is this done outside healthcare?

One tried-and-tested method for designing safer processes is called FMEA – Failure Modes and Effects Analysis.

Now that sounds really nerdy and it is.  It is an attention-to-detail exercise that will make your brain ache and your eyes bleed. But it works – so it is worthwhile learning the basic principles.

For the people part there is the whole body of Human Factors Research to access. This is also a bit nerdy for us hands-on oily-rag pragmatists so if you want something more practical immediately then have a go with The 4N Chart and the Niggle-o-Gram (which is a form of emotional FMEA). This short summary is also free to download, read, print, copy, share, discuss and use.

OK – I am off to design and build something else – an online course for teaching safety-by-design.

What are you going to do to help improve safety in the NHS?

The Writing on the Wall – Part II

Who_Is_To_BlameThe retrospectoscope is the favourite instrument of the forensic cynic – the expert in the after-the-event-and-I-told-you-so rhetoric. The rabble-rouser for the lynch-mob.

It feels better to retrospectively nail-to-a-cross the person who committed the Cardinal Error of Omission, and leave them there in emotional and financial pain as a visible lesson to everyone else.

This form of public feedback has been used for centuries.

It is called barbarism, and it has no place in a modern civilised society.


A more constructive question to ask is:

Could the evolving Mid-Staffordshire crisis have been detected earlier … and avoided?”

And this question exposes a tricky problem: it is much more difficult to predict the future than to explain the past.  And if it could have been detected and avoided earlier, then how is that done?  And if the how-is-known then is everyone else in the NHS using this know-how to detect and avoid their own evolving Mid-Staffs crisis?

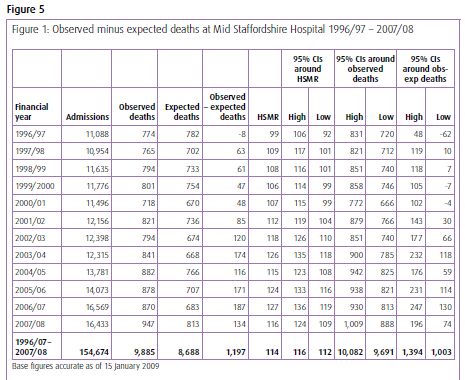
To illustrate how it is currently done let us use the actual Mid-Staffs data. It is conveniently available in Figure 1 embedded in Figure 5 on Page 360 in Appendix G of Volume 1 of the first Francis Report.  If you do not have it at your fingertips I have put a copy of it below.

MS_RawData

The message does not exactly leap off the page and smack us between the eyes does it? Even with the benefit of hindsight.  So what is the problem here?

The problem is one of ergonomics. Tables of numbers like this are very difficult for most people to interpret, so they create a risk that we ignore the data or that we just jump to the bottom line and miss the real message. And It is very easy to miss the message when we compare the results for the current period with the previous one – a very bad habit that is spread by accountants.

This was a slowly emerging crisis so we need a way of seeing it evolving and the better way to present this data is as a time-series chart.

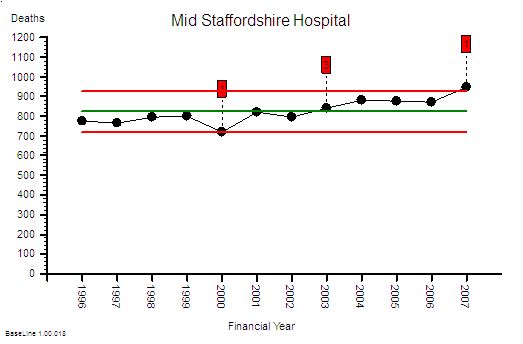
As we are most interested in safety and outcomes, then we would reasonably look at the outcome we do not want – i.e. mortality.  I think we will all agree that it is an easy enough one to measure.

MS_RawDeathsThis is the raw mortality data from the table above, plotted as a time-series chart.  The green line is the average and the red-lines are a measure of variation-over-time. We can all see that the raw mortality is increasing and the red flags say that this is a statistically significant increase. Oh dear!
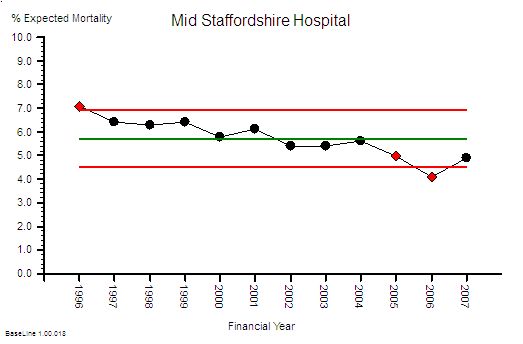
But hang on just a minute – using raw mortality data like this is invalid because we all know that the people are getting older, demand on our hospitals is rising, A&Es are busier, older people have more illnesses, and more of them will not survive their visit to our hospital. This rise in mortality may actually just be because we are doing more work.

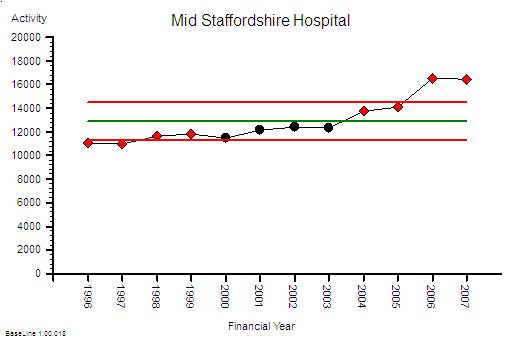
Good point! Let us plot the activity data and see if there has been an increase.

MS_Activity

Yes – indeed the activity has increased significantly too.

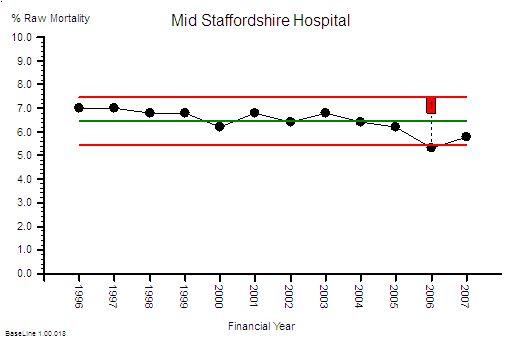
Told you so! And it looks like the activity has gone up more than the mortality. Does that mean we are actually doing a better job at keeping people alive? That sounds like a more positive message for the Board and the Annual Report. But how do we present that message? What about as a ratio of mortality to activity? That will make it easier to compare ourselves with other hospitals.

Good idea! Here is the Raw Mortality Ratio chart.

MS_RawMortality_RatioAh ha. See! The % mortality is falling significantly over time. Told you so.

Careful. There is an unstated assumption here. The assumption that the case mix is staying the same over time. This pattern could also be the impact of us doing a greater proportion of lower complexity and lower risk work.  So we need to correct this raw mortality data for case mix complexity – and we can do that by using data from all NHS hospitals to give us a frame of reference. Dr Foster can help us with that because it is quite a complicated statistical modelling process. What comes out of Dr Fosters black magic box is the Global Hospital Raw Mortality (GHRM) which is the expected number of deaths for our case mix if we were an ‘average’ NHS hospital.

MS_ExpectedMortality_Ratio

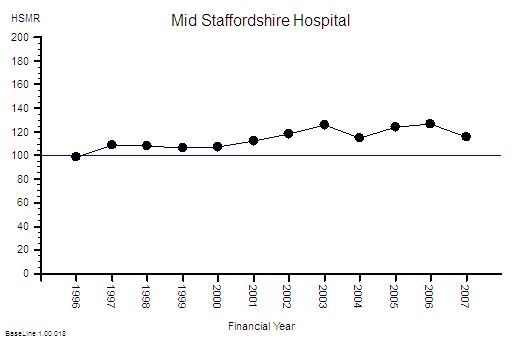
What this says is that the NHS-wide raw mortality risk appears to be falling over time (which may be for a wide variety of reasons but that is outside the scope of this conversation). So what we now need to do is compare this global raw mortality risk with our local raw mortality risk  … to give the Hospital Standardised Mortality Ratio.

MS_HSMRThis gives us the Mid Staffordshire Hospital HSMR chart.  The blue line at 100 is the reference average – and what this chart says is that Mid Staffordshire hospital had a consistently higher risk than the average case-mix adjusted mortality risk for the whole NHS. And it says that it got even worse after 2001 and that it stayed consistently 20% higher after 2003.

Ah! Oh dear! That is not such a positive message for the Board and the Annual Report. But how did we miss this evolving safety catastrophe?  We had the Dr Foster data from 2001

This is not a new problem – a similar thing happened in Vienna between 1820 and 1850 with maternal deaths caused by Childbed Fever. The problem was detected by Dr Ignaz Semmelweis who also discovered a simple, pragmatic solution to the problem: hand washing.  He blew the whistle but unfortunately those in power did not like the implication that they had been the cause of thousands of avoidable mother and baby deaths.  Semmelweis was vilified and ignored, and he did not publish his data until 1861. And even then the story was buried in tables of numbers.  Semmelweis went mad trying to convince the World that there was a problem.  Here is the full story.

Also, time-series charts were not invented until 1924 – and it was not in healthcare – it was in manufacturing. These tried-and-tested safety and quality improvement tools are only slowly diffusing into healthcare because the barriers to innovation appear somewhat impervious.

And the pores have been clogged even more by the social poison called “cynicide” – the emotional and political toxin exuded by cynics.

So how could we detect a developing crisis earlier – in time to avoid a catastrophe?

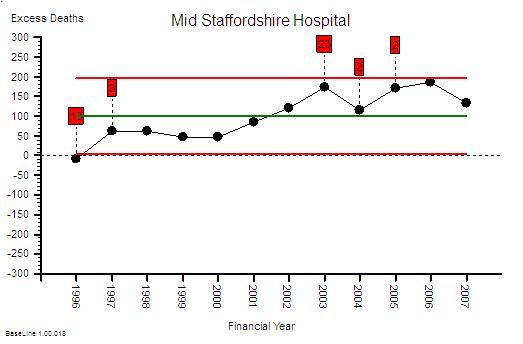
The first step is to estimate the excess-death-equivalent. Dr Foster does this for you.MS_ExcessDeathsHere is the data from the table plotted as a time-series chart that shows that the estimated-excess-death-equivalent per year. It has an average of 100 (that is two per week) and the average should be close to zero. More worryingly the number was increasing steadily over time up to 200 per year in 2006 – that is about four excess deaths per week – on average.  It is important to remember that HSMR is a risk ratio and mortality is a multi-factorial outcome. So the excess-death-equivalent estimate does not imply that a clear causal chain will be evident in specific deaths. That is a complete misunderstanding of the method.

I am sorry – you are losing me with the statistical jargon here. Can you explain in plain English what you mean?

OK. Let us use an example.

Suppose we set up a tombola at the village fete and we sell 50 tickets with the expectation that the winner bags all the money. Each ticket holder has the same 1 in 50 risk of winning the wad-of-wonga and a 49 in 50 risk of losing their small stake. At the appointed time we spin the barrel to mix up the ticket stubs then we blindly draw one ticket out. At that instant the 50 people with an equal risk changes to one winner and 49 losers. It is as if the grey fog of risk instantly condenses into a precise, black-and-white, yes-or-no, winner-or-loser, reality.

Translating this concept back into HSMR and Mid Staffs – the estimated 1200 deaths are the just the “condensed risk of harm equivalent”.  So, to then conduct a retrospective case note analysis of specific deaths looking for the specific cause would be equivalent to trying to retrospectively work out the reason the particular winning ticket in the tombola was picked out. It is a search that is doomed to fail. To then conclude from this fruitless search that HSMR is invalid, is only to compound the delusion further.  The actual problem here is ignorance and misunderstanding of the basic Laws of Physics and Probability, because our brains are not good at solving these sort of problems.

But Mid Staffs is a particularly severe example and  it only shows up after years of data has accumulated. How would a hospital that was not as bad as this know they had a risk problem and know sooner? Waiting for years to accumulate enough data to prove there was a avoidable problem in the past is not much help. 

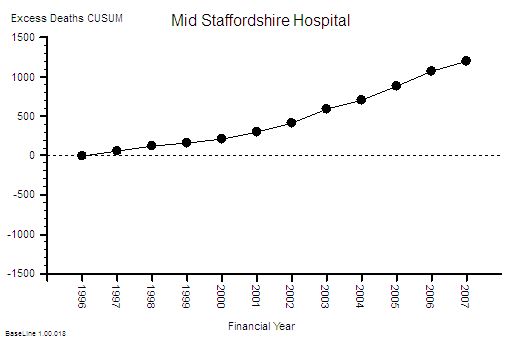
That is an excellent question. This type of time-series chart is not very sensitive to small changes when the data is noisy and sparse – such as when you plot the data on a month-by-month timescale and avoidable deaths are actually an uncommon outcome. Plotting the annual sum smooths out this variation and makes the trend easier to see, but it delays the diagnosis further. One way to increase the sensitivity is to plot the data as a cusum (cumulative sum) chart – which is conspicuous by its absence from the data table. It is the running total of the estimated excess deaths. Rather like the running total of swings in a game of golf.

MS_ExcessDeaths_CUSUMThis is the cusum chart of excess deaths and you will notice that it is not plotted with control limits. That is because it is invalid to use standard control limits for cumulative data.  The important feature of the cusum chart is the slope and the deviation from zero. What is usually done is an alert threshold is plotted on the cusum chart and if the measured cusum crosses this alert-line then the alarm bell should go off – and the search then focuses on the precursor events: the Near Misses, the Not Agains and the Niggles.

I see. You make it look easy when the data is presented as pictures. But aren’t we still missing the point? Isn’t this still after-the-avoidable-event analysis?

Yes! An avoidable death should be a Never-Event in a designed-to-be-safe healthcare system. It should never happen. There should be no coffins to count. To get to that stage we need to apply exactly the same approach to the Near-Misses, and then the Not-Agains, and eventually the Niggles.

You mean we have to use the SUI data and the IR1 data and the complaint data to do this – and also ask our staff and patients about their Niggles?

Yes. And it is not the number of complaints that is the most useful metric – it is the appearance of the cumulative sum of the complaint severity score. And we need a method for diagnosing and treating the cause of the Niggles too. We need to convert the feedback information into effective action.

Ah ha! Now I understand what the role of the Governance Department is: to apply the tools and techniques of Improvement Science proactively.  But our Governance Department have not been trained to do this!

Then that is one place to start – and their role needs to evolve from Inspectors and Supervisors to Demonstrators and Educators – ultimately everyone in the organisation needs to be a competent Healthcare Improvementologist.

OK – I now now what to do next. But wait a minute. This is going to cost a fortune!

This is just one small first step.  The next step is to redesign the processes so the errors do not happen in the first place. The cumulative cost saving from eliminating the repeated checking, correcting, box-ticking, documenting, investigating, compensating and insuring is much much more than the one-off investment in learning safe system design.

So the Finance Director should be a champion for safety and quality too.

Yup!

Brill. Thanks. And can I ask one more question? I do not want to appear to skeptical but how do we know we can trust that this risk-estimation system has been designed and implemented correctly? How do we know we are not being bamboozled by statisticians? It has happened before!

That is the best question yet.  It is important to remember that HSMR is counting deaths in hospital which means that it is not actually the risk of harm to the patient that is measured – it is the risk to the reputation of hospital! So the answer to your question is that you demonstrate your deep understanding of the rationle and method of risk-of-harm estimation by listing all the ways that such a system could be deliberately “gamed” to make the figures look better for the hospital. And then go out and look for hard evidence of all the “games” that you can invent. It is a sort of creative poacher-becomes-gamekeeper detective exercise.

OK – I sort of get what you mean. Can you give me some examples?

Yes. The HSMR method is based on deaths-in-hospital so discharging a patient from hospital before they die will make the figures look better. Suppose one hospital has more access to end-of-life care in the community than another: their HSMR figures would look better even though exactly the same number of people died. Another is that the HSMR method is weighted towards admissions classified as “emergencies” – so if a hospital admits more patients as “emergencies” who are not actually very sick and discharges them quickly then this will inflated their estimated deaths and make their actual mortality ratio look better – even though the risk-of-harm to patients has not changed.

OMG – so if we have pressure to meet 4 hour A&E targets and we get paid more for an emergency admission than an A&E attendance then admitting to an Assessmen Area and discharging within one day will actually reward the hospital financially, operationally and by apparently reducing their HSMR even though there has been no difference at all to the care that patients actually recieve?

Yes. It is an inevitable outcome of the current system design.

But that means that if I am gaming the system and my HSMR is not getting better then the risk-of-harm to patients is actually increasing and my HSMR system is giving me false reassurance that everything is OK.   Wow! I can see why some people might not want that realisation to be public knowledge. So what do we do?

Design the system so that the rewards are aligned with lower risk of harm to patients and improved outcomes.

Is that possible?

Yes. It is called a Win-Win-Win design.

How do we learn how to do that?

Improvement Science.

Footnote I:

The graphs tell a story but they may not create a useful sense of perspective. It has been said that there is a 1 in 300 chance that if you go to hospital you will not leave alive for avoidable causes. What! It cannot be as high as 1 in 300 surely?

OK – let us use the published Mid-Staffs data to test this hypothesis. Over 12 years there were about 150,000 admissions and an estimated 1,200 excess deaths (if all the risk were concentrated into the excess deaths which is not what actually happens). That means a 1 in 130 odds of an avoidable death for every admission! That is twice as bad as the estimated average.

The Mid Staffordshire statistics are bad enough; but the NHS-as-a-whole statistics are cumulatively worse because there are 100’s of other hospitals that are each generating not-as-obvious avoidable mortality. The data is very ‘noisy’ so it is difficult even for a statistical expert to separate the message from the morass.

And remember – that  the “expected” mortality is estimated from the average for the whole NHS – which means that if this average is higher than it could be then there is a statistical bias and we are being falsely reassured by being ‘not statistically significantly different’ from the pack.

And remember too – for every patient and family that suffers and avoidable death there are many more that have to live with the consequences of avoidable but non-fatal harm.  That is called avoidable morbidity.  This is what the risk really means – everyone has a higher risk of some degree of avoidable harm. Psychological and physical harm.

This challenge is not just about preventing another Mid Staffs – it is about preventing 1000’s of avoidable deaths and 100,000s of patients avoidably harmed every year in ‘average’ NHS trusts.

It is not a mass conspiracy of bad nurses, bad doctors, bad managers or bad policians that is the root cause.

It is poorly designed processes – and they are poorly designed because the nurses, doctors and managers have not learned how to design better ones.  And we do not know how because we were not trained to.  And that education gap was an accident – an unintended error of omission.  

Our urgently-improve-NHS-safety-challenge requires a system-wide safety-by-design educational and cultural transformation.

And that is possible because the knowledge of how to design, test and implement inherently safe processes exists. But it exists outside healthcare.

And that safety-by-design training is a worthwhile investment because safer-by-design processes cost less to run because they require less checking, less documenting, less correcting – and all the valuable nurse, doctor and manager time freed up by that can be reinvested in more care, better care and designing even better processes and systems.

Everyone Wins – except the cynics who have a choice: to eat humble pie or leave.

Footnote II:

In the debate that has followed the publication of the Francis Report a lot of scrutiny has been applied to the method by which an estimated excess mortality number is created and it is necessary to explore this in a bit more detail.

The HSMR is an estimate of relative risk – it does not say that a set of specific patients were the ones who came to harm and the rest were OK. So looking at individual deaths and looking for the specific causes is to completely misunderstand the method. So looking at the actual deaths individually and looking for identifiable cause-and-effect paths is an misuse of the message.  When very few if any are found to conclude that HSMR is flawed is an error of logic and exposes the ignorance of the analyst further.

HSMR is not perfect though – it has weaknesses.  It is a benchmarking process the”standard” of 100 is always moving because the collective goal posts are moving – the reference is always changing . HSMR is estimated using data submitted by hospitals themselves – the clinical coding data.  So the main weakness is that it is dependent on the quality of the clinicial coding – the errors of comission (wrong codes) and the errors of omission (missing codes). Garbage In Garbage Out.

Hospitals use clinically coded data for other reasons – payment. The way hospitals are now paid is based on the volume and complexity of that activity – Payment By Results (PbR) – using what are called Health Resource Groups (HRGs). This is a better and fairer design because hospitals with more complex (i.e. costly to manage) case loads get paid more per patient on average.  The HRG for each patient is determined by their clinical codes – including what are called the comorbidities – the other things that the patient has wrong with them. More comorbidites means more complex and more risky so more money and more risk of death – roughly speaking.  So when PbR came in it becamevery important to code fully in order to get paid “properly”.  The problem was that before PbR the coding errors went largely unnoticed – especially the comorbidity coding. And the errors were biassed – it is more likely to omit a code than to have an incorrect code. Errors of omission are harder to detect. This meant that by more complete coding (to attract more money) the estimated casemix complexity would have gone up compared with the historical reference. So as actual (not estimated) NHS mortality has gone down slightly then the HSMR yardstick becomes even more distorted.  Hospitals that did not keep up with the Coding Game would look worse even though  their actual risk and mortality may be unchanged.  This is the fundamental design flaw in all types of  benchmarking based on self-reported data.

The actual problem here is even more serious. PbR is actually a payment for activity – not a payment for outcomes. It is calculated from what it cost to run the average NHS hospital using a technique called Reference Costing which is the same method that manufacturing companies used to decide what price to charge for their products. It has another name – Absorption Costing.  The highest performers in the manufacturing world no longer use this out-of-date method. The implication of using Reference Costing and PbR in the NHS are profound and dangerous:

If NHS hospitals in general have poorly designed processes that create internal queues and require more bed days than actually necessary then the cost of that “waste” becomes built into the future PbR tariff. This means average length of stay (LOS) is financially rewarded. Above average LOS is financially penalised and below average LOS makes a profit.  There is no financial pressure to improve beyound average. This is called the Regression to the Mean effect.  Also LOS is not a measure of quality – so there is a to shorten length of stay for purely financial reasons – to generate a surplus to use to fund growth and capital investment.  That pressure is non-specific and indiscrimiate.  PbR is necessary but it is not sufficient – it requires an quality of outcome metric to complete it.    

So the PbR system is based on an out-of-date cost-allocation model and therefore leads to the very problems that are contributing to the MidStaffs crisis – financial pressure causing quality failures and increased risk of mortality.  MidStaffs may be a chance victim of a combination of factors coming together like a perfect storm – but those same factors are present throughout the NHS because they are built into the current design.

One solution is to move towards a more up-to-date financial model called stream costing. This uses the similar data to reference costing but it estimates the “ideal” cost of the “necessary” work to achieve the intended outcome. This stream cost becomes the focus for improvement – the streams where there is the biggest gap between the stream cost and the reference cost are the focus of the redesign activity. Very often the root cause is just poor operational policy design; sometimes it is quality and safety design problems. Both are solvable without investment in extra capacity. The result is a higher quality, quicker, lower-cost stream. Win-win-win. And in the short term that  is rewarded by a tariff income that exceeds cost and a lower HSMR.

Radically redesigning the financial model for healthcare is not a quick fix – and it requires a lot of other changes to happen first. So the sooner we start the sooner we will arrive. 

The Writing On The Wall – Part I

writing_on_the_wallThe writing is on the wall for the NHS.

It is called the Francis Report and there is a lot of it. Just the 290 recommendations runs to 30 pages. It would need a very big wall and very small writing to put it all up there for all to see.

So predictably the speed-readers have latched onto specific words – such as “Inspectors“.

Recommendation 137Inspection should remain the central method for monitoring compliance with fundamental standards.”

And it goes further by recommending “A specialist cadre of hospital inspectors should be established …”

A predictable wail of anguish rose from the ranks “Not more inspectors! The last lot did not do much good!”

The word “cadre” is not one that is used in common parlance so I looked it up:

Cadre: 1. a core group of people at the center of an organization, especially military; 2. a small group of highly trained people, often part of a political movement.

So it has a military, centralist, specialist, political flavour. No wonder there was a wail of anguish! Perhaps this “cadre of inspectors” has been unconsciously labelled with another name? Persecutors.

Of more interest is the “highly trained” phrase. Trained to do what? Trained by whom? Clearly none of the existing schools of NHS management who have allowed the fiasco to happen in the first place. So who – exactly? Are these inspectors intended to be protectors, persecutors, or educators?

And what would they inspect?

And how would they use the output of such an inspection?

Would the fear of the inspection and its possible unpleasant consequences be the stick to motivate compliance?

Is the language of the Francis Report going to create another brick wall of resistance from the rubble of the ruins of the reputation of the NHS?  Many self-appointed experts are already saying that implementing 290 recommendations is impossible.

They are incorrect.

The number of recommendations is a measure of the breadth and depth of the rot. So the critical-to-success factor is to implement them in a well-designed order. Get the first few in place and working and the rest will follow naturally.  Get the order wrong and the radical cure will kill the patient.

So where do we start?

Let us look at the inspection question again.  Why would we fear an external inspection? What are we resisting? There are three facets to this: first we do not know what is expected of us;  second we do not know if we can satisfy the expectation; and third we fear being persecuted for failing to achieve the impossible.

W Edwards Deming used a very effective demonstration of the dangers of well-intended but badly-implemented quality improvement by inspection: it was called the Red Bead Game.  The purpose of the game was to illustrate how to design an inspection system that actually helps to achieve the intended goal. Sustained improvement.

This is applied Improvement Science and I will illustrate how it is done with a real and current example.


I am assisting a department in a large NHS hospital to improve the quality of their service. I have been sent in as an external inspector.  The specific quality metric they have been tasked to improve is the turnaround time of the specialist work that they do. This is a flow metric because a patient cannot leave hospital until this work is complete – and more importantly it is a flow and quality metric because when the hospital is full then another patient, one who urgently needs to be admitted, will be waiting for the bed to be vacated. One in one out.

The department have been set a standard to meet, a target, a specification, a goal. It is very clear and it is easily measurable. They have to turnaround each job of work in less than 2 hours.  This is called a lead time specification and it is arbitrary.  But it is not unreasonable from the perspective of the patient waiting to leave and for the patient waiting to be admitted. Neither want to wait.

The department has a sophisticated IT system that measures their performance. They use it to record when each job starts and when each job is finished and from those two events the software calculates the lead time for each job in real-time. At the end of each day the IT system counts how many jobs were completed in less than 2 hours and compares this with how many were done in total and calculates a ratio which it presents as a percentage in the range of 0 and 100. This is called the process yield.  The department are dedicated and they work hard and they do all the work that arrives each day the same day – no matter how long it takes. And at the end of each day they have their score for that day. And it is almost never 100%.  Not never. Almost never. But it is not good enough and they are being blamed for it. In turn they blame others for making their job more difficult. It is a blame-game and it has been going on for years.

So how does an experienced Improvement Science-trained Inspector approach this sort of “wicked” problem?

First we need to get the writing on the wall – we need to see the reality – we need to “plot the dots” – we need to see what the performance is doing over time – we need to see the voice of the process. And that requires only their data, a pencil, some paper and for the chart to be put on the on the wall where everyone can see it.

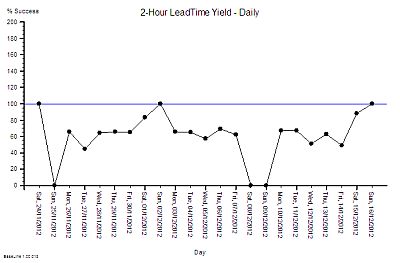
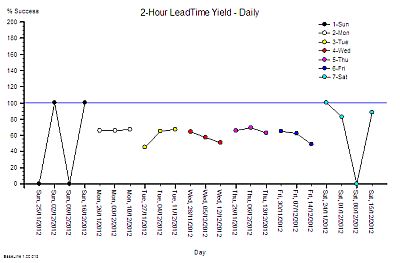
Chart_1This is what their daily % yield data for three consecutive weeks looked like as a time-series chart. The thin blue line is the 100% yield target.

The 100% target was only achieved on three days – and they were all Sundays. On the other Sunday it was zero (which may mean that there was no data to calculate a ratio from).

There is wide variation from one day to the next and it is the variation as well as the average that is of interest to an improvement scientist. What is the source of the variation it? If 100% yield can be achieved some days then what is different about those days?

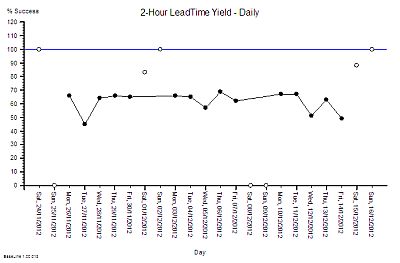
Chart_2

So our Improvement science-trained Inspector will now re-plot the data in a different way – as rational groups. This exposes the issue clearly. The variation on Weekends is very wide and the performance during the Weekdays is much less variable.  What this says is that the weekend system and the weekday system are different. This means that it is invalid to combine the data for both.

It also raises the question of why there is such high variation in yield only at weekends?  The chart cannot answer the question, so our IS-trained Inspector digs a bit deeper and discovers that the volume of work done at the weekend is low, the staffing of the department is different, and that the recording of the events is less reliable. In short – we cannot even trust the weekend data – so we have two reasons to justify excluding it from our chart and just focusing on what happens during the week.

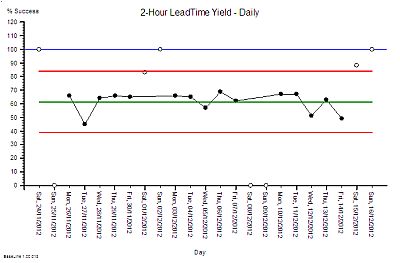
Chart_3We re-plot our chart, marking the excluded weekend data as not for analysis.

We can now see that the weekday performance of our system is visible, less variable, and the average is a long way from 100%.

The team are working hard and still only achieving mediocre performance. That must mean that they need something that is missing. Motivating maybe. More people maybe. More technology maybe.  But there is no more money for more people or technology and traditional JFDI motivation does not seem to have helped.

This looks like an impossible task!

Chart_4

So what does our Inspector do now? Mark their paper with a FAIL and put them on the To Be Sacked for Failing to Meet an Externally Imposed Standard heap?

Nope.

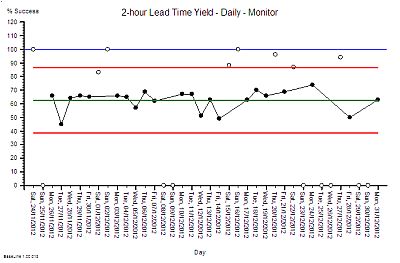
Our IS-trained Inspector calculates the limits of expected performance from the data  and plots these limits on the chart – the red lines.  The computation is not difficult – it can be done with a calculator and the appropriate formula. It does not need a sophisticated IT system.

What this chart now says is “The current design of this process is capable of delivering between 40% and 85% yield. To expect it do do better is unrealistic”.  The implication for action is “If we want 100% yield then the process needs to be re-designed.” Persecution will not work. Blame will not work. Hoping-for-the-best will not work. The process must be redesigned.

Our improvement scientist then takes off the Inspector’s hat and dons the Designer’s overalls and gets to work. There is a method to this and it is called 6M Design®.

Chart_5

First we need to have a way of knowing if any future design changes have a statistically significant impact – for better or for worse. To do this the chart is extended into the future and the red lines are projected forwards in time as the black lines called locked-limits.  The new data is compared with this projected baseline as it comes in.  The weekends and bank holidays are excluded because we know that they are a different system. On one day (20/12/2012) the yield was surprisingly high. Not 100% but more than the expected upper limit of 85%.

Chart_6The alerts us to investigate and we found that it was a ‘hospital bed crisis’ and an ‘all hands to the pumps’ distress call went out.

Extra capacity was pulled to the process and less urgent work was delayed until later.  It is the habitual reaction-to-a-crisis behaviour called “expediting” or “firefighting”.  So after the crisis had waned and the excitement diminished the performance returned to the expected range. A week later the chart signals us again and we investigate but this time the cause was different. It was an unusually quiet day and there was more than enough hands on the pumps.

Both of these days are atypically good and we have an explanation for each of them. This is called an assignable cause. So we are justified in excluding these points from our measure of the typical baseline capability of our process – the performance the current design can be expected to deliver.

An inexperienced manager might conclude from these lessons that what is needed is more capacity. That sounds and feels intuitively obvious and it is correct that adding more capacity may improve the yield – but that does not prove that lack of capacity is the primary cause.  There are many other causes of long lead times  just as there are many causes of headaches other than brain tumours! So before we can decide the best treatment for our under-performing design we need to establish the design diagnosis. And that is done by inspecting the process in detail. And we need to know what we are looking for; the errors of design commission and the errors of design omission. The design flaws.

Only a trained and experienced process designer can spot the flaws in a process design. Intuition will trick the untrained and inexperienced.


Once the design diagnosis is established then the redesign stage can commence. Design always works to a specification and in this case it was clear – to significantly improve the yield to over 90% at no cost.  In other words without needing more people, more skills, more equipment, more space, more anything. The design assignment was made trickier by the fact that the department claimed that it was impossible to achieve significant improvement without adding extra capacity. That is why the Inspector had been sent in. To evaluate that claim.

The design inspection revealed a complex adaptive system – not a linear, deterministic, production-line that manufactures widgets.  The department had to cope with wide variation in demand, wide variation in quality of request, wide variation in job complexity, and wide variation in urgency – all at the same time.  But that is the nature of healthcare and acute hospital work. That is the expected context.

The analysis of the current design revealed that it was not well suited for this requirement – and the low yield was entirely predictable. The analysis also revealed that the root cause of the low yield was not lack of either flow-capacity or space-capacity.

This insight led to the suggestion that it would be possible to improve yield without increasing cost. The department were polite but they did not believe it was possible. They had never seen it, so why should they be expected to just accept this on faith?

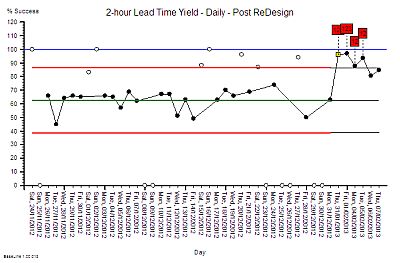
Chart_7So, the next step was to develop, test and demonstrate a new design and that was done in three stages. The final stage was the Reality Test – the actual process design was changed for just one day – and the yield measured and compared with the predicted improvement.

This was the validity test – the proof of the design pudding. And to visualise the impact we used the same technique as before – extending the baseline of our time-series chart, locking the limits, and comparing the “after” with the “before”.

The yellow point marks the day of the design test. The measured yield was well above the upper limit which suggested that the design change had made a significant improvement. A statistically significant improvement.  There was no more capacity than usual and the day was not unusually quiet. At the end of the day we held a team huddle.

Our first question was “How did the new design feel?” The consensus was “Calmer, smoother, fewer interruptions” and best of all “We finished on time – there was no frantic catch up at the end of the day and no one had to stay late to complete the days work!”

The next question was “Do we want to continue tomorrow with this new design or revert back to the old one?” The answer was clear “Keep going with the new design. It feels better.”

The same chart was used to show what happened over the next few days – excluding the weekends as before. The improvement was sustained – it did not revert to the original because the process design had been changed. Same work, same capacity, different process – higher yield. The red flags on the charts mark the statistically significant evidence of change and the cluster of red flags is very strong statistical evidence that the improvement is not due to chance.

The next phase of the 6M Design® method is to continue to monitor the new process to establish the new baseline of expectation. That will require at least twelve data points and it is in progress. But we have enough evidence of a significant improvement. This means that we have no credible justification to return to the old design, and it also implies that it is no longer valid to compare the new data against the old projected limits. Our chart tells us that we need to split the data into before-and-after and to calculate new averages and limits for each segment separately. We have changed the voice of the process by changing the design.

Chart_8And when we split the data at the point-of-change then the red flags disappear – which means that our new design is stable. And it has a new capability – a better one. We have moved closer to our goal of 100% yield. It is still early days and we do not really have enough data to calculate the new capability.

What we can say is that we have improved average quality yield from 63% to about 90% at no cost using a sequence of process diagnose, design, deliver.  Study-Plan-Do.

And we have hard evidence that disproves the impossibility hypothesis.


And that was the goal of the first design change – it was not to achieve 100% yield in one jump. Our design simulation had predicted an improvement to about 90%.  And there are other design changes to follow that need this stable foundation to build on.  The order of implementation is critical – and each change needs time to bed in before the next change is made. That is the nature of the challenge of improving a complex adaptive system.

The cost to the department was zero but the benefit was huge.  The bigger benefit to the organisation was felt elsewhere – the ‘customers’ saw a higher quality, quicker process – and there will be a financial benefit for the whole system. It will be difficult to measure with our current financial monitoring systems but it will be real and it will be there – lurking in the data.

The improvement required a trained and experienced Inspector/Designer/Educator to start the wheel of change turning. There are not many of these in the NHS – but the good news is that the first level of this training is now available.

What this means for the post-Francis Report II NHS is that those who want to can choose to leap over the wall of resistance that is being erected by the massing legions of noisy cynics. It means we can all become our own inspectors. It means we can all become our own improvers. It means we can all learn to redesign our systems so that they deliver higher safety, better quality, more quickly and at no extra one-off or recurring cost.  We all can have nothing to fear from the Specialist Cadre of Hospital Inspectors.

The writing is on the wall.


15/02/2013 – Two weeks in and still going strong. The yield has improved from 63% to 92% and is stable. Improvement-by-design works.

10/03/2013 – Six weeks in and a good time to test if the improvement has been sustained.

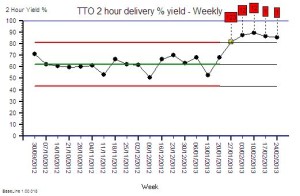
TTO_Yield_WeeklyThe chart is the weekly performance plotted for 17 weeks before the change and for 5 weeks after. The advantage of weekly aggregated data is that it removes the weekend/weekday 7-day cycle and reduces the effect of day-to-day variation.

The improvement is obvious, significant and has been sustained. This is the objective improvement. More important is the subjective improvement.

Here is what Chris M (departmental operational manager) wrote in an email this week (quoted with permission):

Hi Simon

It is I who need to thank you for explaining to me how to turn our pharmacy performance around and ultimately improve the day to day work for the pharmacy team (and the trust staff). This will increase job satisfaction and make pharmacy a worthwhile career again instead of working in constant pressure with a lack of achievement that had made the team feel rather disheartened and depressed. I feel we can now move onwards and upwards so thanks for the confidence boost.

Best wishes and many thanks

Chris

This is what Improvement Science is all about!

Robert Francis QC

press_on_screen_anim_150_wht_7028Today is an important day.

The Robert Francis QC Report and recommendations from the Mid-Staffordshire Hospital Crisis has been published – and it is a sobering read.  The emotions that just the executive summary evoked in me were sadness, shame and anger.  Sadness for the patients, relatives, and staff who have been irreversibly damaged; shame that the clinical professionals turned a blind-eye; and anger that the root cause has still not been exposed to public scrutiny.

Click here to get a copy of the RFQC Report Executive Summary.

Click here to see the video of RFQC describing his findings. 

The root cause is ignorance at all levels of the NHS.  Not stupidity. Not malevolence. Just ignorance.

Ignorance of what is possible and ignorance of how to achieve it.

RFQC rightly focusses his recommendations on putting patients at the centre of healthcare and on making those paid to deliver care accountable for the outcomes.  Disappointingly, the report is notably thin on the financial dimension other than saying that financial targets took priority over safety and quality.  He is correct. They did. But the report does not say that this is unnecessary – it just says “in future put safety before finance” and in so doing he does not challenge the belief that we are playing a zero-sum-game. The  assumotion that higher-quality-always-costs-more.

This assumption is wrong and can easily be disproved.

A system that has been designed to deliver safety-and-quality-on-time-first-time-and-every-time costs less. And it costs less because the cost of errors, checking, rework, queues, investigation, compensation, inspectors, correctors, fixers, chasers, and all the other expensive-high-level-hot-air-generation-machinery that overburdens the NHS and that RFQC has pointed squarely at is unnecessary.  He says “simplify” which is a step in the right direction. The goal is to render it irrelevent.

The ignorance is ignorance of how to design a healthcare system that works right-first-time. The fact that the Francis Report even exists and is pointing its uncomfortable fingers-of-evidence at every level of the NHS from ward to government is tangible proof of this collective ignorance of system design.

And the good news is that this collective ignorance is also unnecessary … because the knowledge of how to design safe-and-affordable systems already exists. We just have to learn how. I call it 6M Design® – but  the label is irrelevent – the knowledge exists and the evidence that it works exists.

So here are some of the RFQC recommendations viewed though a 6M Design® lens:       

1.131 Compliance with the fundamental standards should be policed by reference to developing the CQC’s outcomes into a specification of indicators and metrics by which it intends to monitor compliance. These indicators should, where possible, be produced by the National Institute for Health and Clinical Excellence (NICE) in the form of evidence-based procedures and practice which provide a practical means of compliance and of measuring compliance with fundamental standards.

This is the safety-and-quality outcome specification for a healthcare system design – the required outcome presented as a relevent metric in time-series format and qualified by context.  Only a stable outcome can be compared with a reference standard to assess the system capability. An unstable outcome metric requires inquiry to understand the root cause and an appropriate action to restore stability. A stable but incapable outcome performance requires redesign to achieve both stability and capability. And if  the terms used above are unfamiliar then that is further evidence of system-design-ignorance.   
 
1.132 The procedures and metrics produced by NICE should include evidence-based tools for establishing the staffing needs of each service. These measures need to be readily understood and accepted by the public and healthcare professionals.

This is the capacity-and-cost specification of any healthcare system design – the financial envelope within which the system must operate. The system capacity design works backwards from this constraint in the manner of “We have this much resource – what design of our system is capable of delivering the required safety and quality outcome with this capacity?”  The essence of this challenge is to identify the components of poor (i.e. wasteful) design in the existing systems and remove or replace them with less wasteful designs that achieve the same or better quality outcomes. This is not impossible but it does require system diagnostic and design capability. If the NHS had enough of those skills then the Francis Report would not exist.

1.133 Adoption of these practices, or at least their equivalent, is likely to help ensure patients’ safety. Where NICE is unable to produce relevant procedures, metrics or guidance, assistance could be sought and commissioned from the Royal Colleges or other third-party organisations, as felt appropriate by the CQC, in establishing these procedures and practices to assist compliance with the fundamental standards.

How to implement evidence-based research in the messy real world is the Elephant in the Room. It is possible but it requires techniques and tools that fall outside the traditional research and audit framework – or rather that sit between research and audit. This is where Improvement Science sits. The fact that the Report only mentions evidence-based practice and audit implies that the NHS is still ignorant of this gap and what fills it – and so it appears is RFQC.   

1.136 Information needs to be used effectively by regulators and other stakeholders in the system wherever possible by use of shared databases. Regulators should ensure that they use the valuable information contained in complaints and many other sources. The CQC’s quality risk profile is a valuable tool, but it is not a substitute for active regulatory oversight by inspectors, and is not intended to be.

Databases store data. Sharing databases will share data. Data is not information. Information requires data and the context for that data.  Furthermore having been informed does not imply either knowledge or understanding. So in addition to sharing information, the capability to convert information-into-decision is also required. And the decisions we want are called “wise decisions” which are those that result in actions and inactions that lead inevitably to the intended outcome.  The knowledge of how to do this exists but the NHS seems ignorant of it. So the challenge is one of education not of yet more investigation.

1.137 Inspection should remain the central method for monitoring compliance with fundamental standards. A specialist cadre of hospital inspectors should be established, and consideration needs to be given to collaborative inspections with other agencies and a greater exploitation of peer review techniques.

This is audit. This is the sixth stage of a 6M Design® – the Maintain step.  Inspectors need to know what they are looking for, the errors of commission and the errors of omission;  and to know what those errors imply and what to do to identify and correct the root cause of these errors when discovered. The first cadre of inspectors will need to be fully trained in healthcare systems design and healthcare systems improvement – in short – they need to be Healthcare Improvementologists. And they too will need to be subject to the same framework of accreditation, and accountability as those who work in the system they are inspecting.  This will be one of the greatest of the challenges. The fact that the Francis report exists implies that we do not have such a cadre. Who will train, accredit and inspect the inspectors? Who has proven themselves competent in reality (not rhetorically)?

1.163 Responsibility for driving improvement in the quality of service should therefore rest with the commissioners through their commissioning arrangements. Commissioners should promote improvement by requiring compliance with enhanced standards that demand more of the provider than the fundamental standards.

This means that commissioners will need to understand what improvement requires and to include that expectation in their commissioning contracts. This challenge is even geater that the creation of a “cadre of inspectors”. What is required is a “generation of competent commissioners” who are also experienced and who have demonstrated competence in healthcare system design. The Commissioners-of-the-Future will need to be experienced healthcare improvementologists.

The NHS is sick – very sick. The medicine it needs to restore its health and vitality does exist – and it will not taste very nice – but to withold an effective treatment for an serious illness on that basis is clinical negligence.

It is time for the NHS to look in the mirror and take the strong medicine. The effect is quick – it will start to feel better almost immediately. 

To deliver safety and quality and quickly and affordably is possible – and if you do not believe that then you will need to muster the humility to ask to have the how demonstrated.

6MDesign


Kicking the Habit

no_smoking_400_wht_6805It is not easy to kick a habit. We all know that. And for some reason the ‘bad’ habits are harder to kick than the ‘good’ ones. So what is bad about a ‘bad habit’ and why is it harder to give up? Surely if it was really bad it would be easier to give up?

Improvement is all about giving up old ‘bad’ habits and replacing them with new ‘good’ habits – ones that will sustain the improvement. But there is an invisible barrier that resists us changing any habit – good or bad. And it is that barrier to habit-breaking that we need to understand to succeed. Luck is not a reliable ally.

What does that habit-breaking barrier look like?

The problem is that it is invisible – or rather it is emotional – or to be precise it is chemical.

Our emotions are the output of a fantastically complex chemical system – our brains. And influencing the chemical balance of our brains can have a profound effect on our emotions.  That is how anti-depressants work – they very slightly adjust the chemical balance of every part of our brains. The cumulative effect is that we feel happier.  Nicotine has a similar effect.

And we can achieve the same effect without resorting to drugs or fags – and we can do that by consciously practising some new mental habits until they become ingrained and unconscious. We literally overwrite the old mental habit.

So how do we do this?

First we need to make the mental barrier visible – and then we can focus our attention on eroding it. To do that we need to remove the psychological filter that we all use to exclude our emotions. It is rather like taking off our psychological sunglasses.

When we do that the invisible barrier jumps into view: illuminated by the glare of three negative emotions.  Sadness, fear, and anxiety.  So whenever we feel any of these we know there is a barrier to improvement hiding  the emotional smoke. This is the first stage: tune in to our emotions.

The next step is counter-intuitive. Instead of running away from the negative feeling we consciously flip into a different way of thinking.  We actively engage with our negative feelings – and in a very specific way. We engage in a detached, unemotional, logical, rational, analytical  ‘What caused that negative feeling?’ way.

We then focus on the causes of the negative emotions. And when we have the root causes of our Niggles we design around them, under them, and over them.  We literally design them out of our heads.

The effect is like magic.

And this week I witnessed a real example of this principle in action.

figure_pressing_power_button_150_wht_10080One team I am working with experienced the Power of Improvementology. They saw the effect with their own eyes.  There were no computers in the way, no delays, no distortion and no deletion of data to cloud the issue. They saw the performance of their process jump dramatically – from a success rate of 60% to 96%!  And not just the first day, the second day too.  “Surprised and delighted” sums up their reaction.

So how did we achieve this miracle?

We just looked at the process through a different lens – one not clouded and misshapen by old assumptions and blackened by ignorance of what is possible.  We used the 6M Design® lens – and with the clarity of insight it brings the barriers to improvement became obvious. And they were dissolved. In seconds.

Success then flowed as the Dam of Disbelief crumbled and was washed away.

figure_check_mark_celebrate_anim_150_wht_3617The chaos has gone. The interruptions have gone. The expediting has gone. The firefighting has gone. The complaining has gone.  These chronic Niggles have have been replaced by the Nuggets of calm efficiency, new hope and visible excitement.

And we know that others have noticed the knock-on effect because we got an email from our senior executive that said simply “No one has moaned about TTOs for two days … something has changed.”    

That is Improvementology-in-Action.