 Phil and Pete are having a coffee and a chat. They both work in the NHS and have been friends for years.
They have different jobs. Phil is a commissioner and an accountant by training, Pete is a consultant and a doctor by training.
They are discussing a challenge that affects them both on a daily basis: unscheduled care.
Both Phil and Pete want to see significant and sustained improvements and how to achieve them is often the focus of their coffee chats.
<Phil> We are agreed that we both want improvement, both from my perspective as a commissioner and from your perspective as a clinician. And we agree that what we want to see improvements in patient safety, waiting, outcomes, experience for both patients and staff, and use of our limited NHS resources.
<Pete> Yes. Our common purpose, the “what” and “why”, has never been an issue. Where we seem to get stuck is the “how”. We have both tried many things but, despite our good intentions, it feels like things are getting worse!
<Phil> I agree. It may be that what we have implemented has had a positive impact and we would have been even worse off if we had done nothing. But I do not know. We clearly have much to learn and, while I believe we are making progress, we do not appear to be learning fast enough. And I think this knowledge gap exposes another “how” issue: After we have intervened, how do we know that we have (a) improved, (b) not changed or (c) worsened?
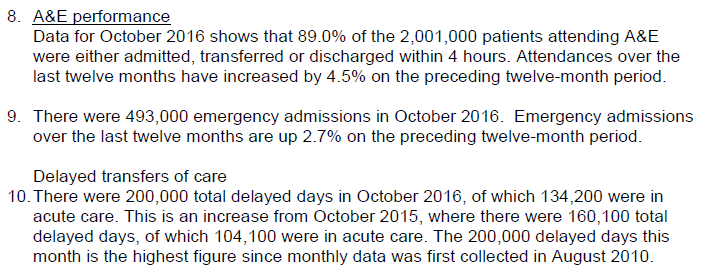
<Pete> That is a very good question. And all that I have to offer as an answer is to share what we do in medicine when we ask a similar question: “How do I know that treatment A is better than treatment B?” It is the essence of medical research; the quest to find better treatments that deliver better outcomes and at lower cost. The similarities are strong.
<Phil> OK. How do you do that? How do you know that “Treatment A is better than Treatment B” in a way that anyone will trust the answer?
<Pete> We use a science that is actually very recent on the scientific timeline; it was only firmly established in the first half of the 20th century. One reason for that is that it is rather a counter-intuitive science and for that reason it requires using tools that have been designed and demonstrated to work but which most of us do not really understand how they work. They are a bit like magic black boxes.
<Phil> H’mm. Please forgive me for sounding skeptical but that sounds like a big opportunity for making mistakes! If there are lots of these “magic black box” tools then how do you decide which one to use and how do you know you have used it correctly?
<Pete> Those are good questions! Very often we don’t know and in our collective confusion we generate a lot of unproductive discussion. This is why we are often forced to accept the advice of experts but, I confess, very often we don’t understand what they are saying either! They seem like the medieval Magi.
<Phil> H’mm. So these experts are like ‘magicians’ – they claim to understand the inner workings of the black magic boxes but are unable, or unwilling, to explain in a language that a ‘muggle’ would understand?
<Pete> Very well put. That is just how it feels.
<Phil> So can you explain what you do understand about this magical process? That would be a start.
<Pete> OK, I will do my best. The first thing we learn in medical research is that we need to be clear about what it is we are looking to improve, and we need to be able to measure it objectively and accurately.
<Phil> That makes sense. Let us say we want to improve the patient’s subjective quality of the A&E experience and objectively we want to reduce the time they spend in A&E. We measure how long they wait.
<Pete> The next thing is that we need to decide how much improvement we need. What would be worthwhile? So in the example you have offered we know that reducing the average time patients spend in A&E by just 30 minutes would have a significant effect on the quality of the patient and staff experience, and as a by-product it would also dramatically improve the 4-hour target performance.
<Phil> OK. From the commissioning perspective there are lots of things we can do, such as commissioning alternative paths for specific groups of patients; in effect diverting some of the unscheduled demand away from A&E to a more appropriate service provider. But these are the sorts of thing we have been experimenting with for years, and it brings us back to the question: How do we know that any change we implement has had the impact we intended? The system seems, well, complicated.
<Pete> In medical research we are very aware that the system we are changing is very complicated and that we do not have the power of omniscience. We cannot know everything. Realistically, all we can do is to focus on objective outcomes and collect small samples of the data ocean and use those in an attempt to draw conclusions can trust. We have to design our experiment with care!
<Phil> That makes sense. Surely we just need to measure the stuff that will tell us if our impact matches our intent. That sounds easy enough. What’s the problem?
<Pete> The problem we encounter is that when we measure “stuff” we observe patient-to-patient variation, and that is before we have made any changes. Any impact that we may have is obscured by this “noise”.
<Phil> Ah, I see. So if the our intervention generates a small impact then it will be more difficult to see amidst this background noise. Like trying to see fine detail in a fuzzy picture.
<Pete> Yes, exactly like that. And it raises the issue of “errors”. In medical research we talk about two different types of error; we make the first type of error when our actual impact is zero but we conclude from our data that we have made a difference; and we make the second type of error when we have made an impact but we conclude from our data that we have not.
<Phil> OK. So does that imply that the more “noise” we observe in our measure for-improvement before we make the change, the more likely we are to make one or other error?
<Pete> Precisely! So before we do the experiment we need to design it so that we reduce the probability of making both of these errors to an acceptably low level. So that we can be assured that any conclusion we draw can be trusted.
<Phil> OK. So how exactly do you do that?
<Pete> We know that whenever there is “noise” and whenever we use samples then there will always be some risk of making one or other of the two types of error. So we need to set a threshold for both. We have to state clearly how much confidence we need in our conclusion. For example, we often use the convention that we are willing to accept a 1 in 20 chance of making the Type I error.
<Phil> Let me check if I have heard you correctly. Suppose that, in reality, our change has no impact and we have set the risk threshold for a Type 1 error at 1 in 20, and suppose we repeat the same experiment 100 times – are you saying that we should expect about five of our experiments to show data that says our change has had the intended impact when in reality it has not?
<Pete> Yes. That is exactly it.
<Phil> OK. But in practice we cannot repeat the experiment 100 times, so we just have to accept the 1 in 20 chance that we will make a Type 1 error, and we won’t know we have made it if we do. That feels a bit chancy. So why don’t we just set the threshold to 1 in 100 or 1 in 1000?
<Pete> We could, but doing that has a consequence. If we reduce the risk of making a Type I error by setting our threshold lower, then we will increase the risk of making a Type II error.
<Phil> Ah! I see. The old swings-and-roundabouts problem. By the way, do these two errors have different names that would make it easier to remember and to explain?
<Pete> Yes. The Type I error is called a False Positive. It is like concluding that a patient has a specific diagnosis when in reality they do not.
<Phil> And the Type II error is called a False Negative?
<Pete> Yes. And we want to avoid both of them, and to do that we have to specify a separate risk threshold for each error. The convention is to call the threshold for the false positive the alpha level, and the threshold for the false negative the beta level.
<Phil> OK. So now we have three things we need to be clear on before we can do our experiment: the size of the change that we need, the risk of the false positive that we are willing to accept, and the risk of a false negative that we are willing to accept. Is that all we need?
<Pete> In medical research we learn that we need six pieces of the experimental design jigsaw before we can proceed. We only have three pieces so far.
<Phil> What are the other three pieces then?
<Pete> We need to know the average value of the metric we are intending to improve, because that is our baseline from which improvement is measured. Improvements are often framed as a percentage improvement over the baseline. And we need to know the spread of the data around that average, the “noise” that we referred to earlier.
<Phil> Ah, yes! I forgot about the noise. But that is only five pieces of the jigsaw. What is the last piece?
<Pete> The size of the sample.
<Phil> Eh? Can’t we just go with whatever data we can realistically get?
<Pete> Sadly, no. The size of the sample is how we control the risk of a false negative error. The more data we have the lower the risk. This is referred to as the power of the experimental design.
<Phil> OK. That feels familiar. I know that the more experience I have of something the better my judgement gets. Is this the same thing?
<Pete> Yes. Exactly the same thing.
<Phil> OK. So let me see if I have got this. To know if the impact of the intervention matches our intention we need to design our experiment carefully. We need all six pieces of the experimental design jigsaw and they must all fall inside our circle of control. We can measure the baseline average and spread; we can specify the impact we will accept as useful; we can specify the risks we are prepared to accept of making the false positive and false negative errors; and we can collect the required amount of data after we have made the intervention so that we can trust our conclusion.
<Pete> Perfect! That is how we are taught to design research studies so that we can trust our results, and so that others can trust them too.
<Phil> So how do we decide how big the post-implementation data sample needs to be? I can see we need to collect enough data to avoid a false negative but we have to be pragmatic too. There would appear to be little value in collecting more data than we need. It would cost more and could delay knowing the answer to our question.
<Pete> That is precisely the trap than many inexperienced medical researchers fall into. They set their sample size according to what is achievable and affordable, and then they hope for the best!
<Phil> Well, we do the same. We analyse the data we have and we hope for the best. In the magical metaphor we are asking our data analysts to pull a white rabbit out of the hat. It sounds rather irrational and unpredictable when described like that! Have medical researchers learned a way to avoid this trap?
<Pete> Yes, it is a tool called a power calculator.
<Phil> Ooooo … a power tool … I like the sound of that … that would be a cool tool to have in our commissioning bag of tricks. It would be like a magic wand. Do you have such a thing?
<Pete> Yes.
<Phil> And do you understand how the power tool magic works well enough to explain to a “muggle”?
<Pete> Not really. To do that means learning some rather unfamiliar language and some rather counter-intuitive concepts.
<Phil> Is that the magical stuff I hear lurks between the covers of a medical statistics textbook?
<Pete> Yes. Scary looking mathematical symbols and unfathomable spells!
<Phil> Oh dear! Is there another way for to gain a working understanding of this magic? Something a bit more pragmatic? A path that a ‘statistical muggle’ might be able to follow?
<Pete> Yes. It is called a simulator.
<Phil> You mean like a flight simulator that pilots use to learn how to control a jumbo jet before ever taking a real one out for a trip?
<Pete> Exactly like that.
<Phil> Do you have one?
<Pete> Yes. It was how I learned about this “stuff” … pragmatically.
<Phil> Can you show me?
<Pete> Of course. But to do that we will need a bit more time, another coffee, and maybe a couple of those tasty looking Danish pastries.
<Phil> A wise investment I’d say. I’ll get the the coffee and pastries, if you fire up the engines of the simulator.