The Victim Vortex

[Beep Beep] Bob tapped the “Answer” button on his smartphone – it was Lesley calling in for their regular ISP coaching session.

<Bob>Hi Lesley. How are you today? And which tunnel in the ISP Learning Labyrinth shall we explore today?

<Lesley>Hi Bob. I am OK thank you. Can we invest some time in the Engagement Maze?

<Bob>OK. Do you have a specific example?

<Lesley>Sort of. This week I had a conversation with our Chief Executive about the potential of Improvement Science and the reply I got was “I am convinced by what you say but it is your colleagues who need to engage. If you have not succeeded in convincing them then how can I?” I was surprised by that response and slightly niggled because it had an uncomfortable nugget of truth in it.

<Bob>That sounds like the wisdom of a leader who understands that the “power” to make things happen does not sit wholly in the lap of those charged with accountability.

<Lesley> I agree.  And at the same time everything that the “Top Team” suggest gets shot down in flames by a small and very vocal group of my more skeptical colleagues.

<Bob>Ah ha!  It sounds like the Victim Vortex is causing trouble here.

<Lesley>The Victim Vortex?

<Bob>Yes.  Let me give you an example.  One of the common initiators of the Victim Vortex is the data flow part of a complex system design.  The Sixth Flow.  So can I ask you: “How are new information systems developed in your organization?

<Lesley>Wow!  You hit the nail on the head first time!  Just this week there has been another firestorm of angry emails triggered by yet another silver-bullet IT system being foisted on us!

<Bob>Interesting use of language Lesley.  You sound quite “niggled”.

<Lesley>I am.  Not by the constant “drizzle of IT magic” – that is irritating enough – but more by the vehemently cynical reaction of my peers.

<Bob>OK.  This sounds like good enough example of the Victim Vortex.  What do you expect the outcome will be?

<Lesley>Well, if past experience is a predictor for future performance – an expensive failure, more frustration and a deeper well of cynicism.

<Bob>Frustrating for whom?

<Lesley>Everyone.  The IT department as well.  It feels like we are all being sucked into a lose-lose-lose black hole of depression and despair!

<Bob>A very good description of the Victim Vortex.

<Lesley>So the Victim Vortex is an example of the Drama Triangle acting on an organizational level?

tornada_150_wht_10155<Bob>Yes. Visualize a cultural tornado.  The energy that drives it is the emotional  currency spent in playing the OK – Not OK Games.  It is a self-fueling system, a stable design, very destructive and very resistant to change.

<Lesley>That metaphor works really well for me!

<Bob>A similar one is a whirlpool – a water vortex.  If you were out swimming and were caught up in a whirlpool what are your exit strategy options?

<Lesley>An interesting question.  I have never had that experience and would not want it – it sounds rather hazardous.  Let me think.  If I do nothing I will just get swept around in the chaos and I am at risk of  getting bashed, bruised and then sucked under.

<Bob>Yes – you would probably spend all your time and energy just treading water and dodging the flotsam and jetsam that has been sucked into the Vortex.  That is what most people do.  It is called the Hamster Wheel effect.

<Lesley>So another option is to actively swim towards the middle of the Vortex – the end would at least be quick! But that is giving up and adopting the Hopelessness attitude of burned out Victim.  That would be the equivalent of taking voluntary redundancy or early retirement.  It is not my style!

<Bob>Yes.  It does not solve the problem either.  The Vortex is always hoovering up new Victims.  It is insatiable.

<Lesley> And another option would be to swim with the flow to avoid being “got” from behind.  That would be seem sensible and is possible; and at least I would feel better for doing something. I might even escape if I swim fast enough!

<Bob>That is indeed what some try.  The movers and shakers.  The pace setters.  The optimists.  The extrovert leaders.  The problem is that it makes the Vortex spin even faster.  It actually makes the Vortex bigger,  more chaotic and more dangerous than before.

<Lesley>Yes – I can see that.  So my other option is to swim against the flow in an attempt to slow the Vortex down.  Would that work?

<Bob>If everyone did that at the same time it might but that is unlikely to happen spontaneously.  If you could achieve that degree of action alignment you would not have a Victim Vortex in the first place.  Trying to do it alone is ineffective, you tire very quickly, the other Victims bash into you, you slow them down, and then you all get sucked down the Plughole of Despair.

<Lesley>And I suppose a small group of like-minded champions who try to swim-against the flow might last longer if they stick together but even then eventually they would get bashed up and broken up too.  I have seen that happen.  And that is probably where our team are heading at the moment.  I am out of options.  Is it impossible to escape the Victim Vortex?

<Bob>There is one more direction you can swim.

<Lesley>Um?  You mean across the flow heading directly away from the center?

<Bob>Exactly.  Consider that option.

<Lesley>Well, it would still be hard work and I would still be going around with the Vortex and I would still need to watch out for flotsam but every stroke I make would take me further from the center.  The chaos would get gradually less and eventually I would be in clear water and out of danger.  I could escape the Victim Vortex!

<Bob>Yes. And what would happen if others saw you do that and did the same?

<Lesley>The Victim Vortex would dissipate!

<Bob>Yes.  So that is your best strategy.  It is a win-win-win strategy too. You can lead others out of the Victim Vortex.

<Lesley>Wow!  That is so cool!  So how would I apply that metaphor to the Information System niggle?

<Bob>I will leave you to ponder on that.  Think about it as a design assignment.  The design of the system that generates IT solutions that are fit-for-purpose.

<Lesley> Somehow I knew you were going to say that!  I have my squared-paper and sharpened pencil at the ready.  Yes – an improvement-by-design assignment.  Thank you once again Bob.  This ISP course is the business!

Celebrating Achievement

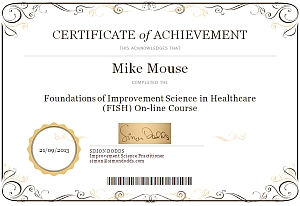
CertificateOne of the best things about improvement is the delight that we feel when someone else acknowledges it.

Particularly someone whose opinion we respect.

We feel a warm glow of pride when they notice the difference and take the time to say “Well done!”

We need this affirmative feedback to fuel our improvement engine.

And we need to learn how to give ourselves affirmative feedback because usually there is a LOT of improvement work to do behind the scenes before any externally visible improvement appears.

It is like an iceberg – most of it is hidden from view.

And improvement is tough. We have to wade through Bureaucracy Treacle that is laced with Cynicide and policed by Skeptics.  We know this.

So we need to learn to celebrate the milestones we achieve and to keep reminding ourselves of what we have already done.  Even if no one else notices or cares.

Like the certificates, cups, and medals that we earned at school – still proudly displayed on our mantlepieces and shelves decades later. They are important. Especially to us.

So it is always a joy to celebrate the achievement of others and to say “Well Done” for reaching a significant milestone on the path of learning Improvement Science.

And that has been my great pleasure this week – to prepare and send the Certificates of Achievement to those who have recently completed the FISH course.

The best part of all has been to hear how many times the word “treasured” is used in the “Thank You” replies.

We display our Certificates with pride – not so much that others can see – more to remind ourselves every day to Celebrate Achievement.


Fear and Fuel

stick_figure_open_cupboard_150_wht_8038Improvement implies change.

Change requires motivation.

And there are two flavours of motivation juice – Fear and Fuel

Fear is the emotion that comes from anticipated loss in the future.  Loss means some form of damage. Physical, psychological or social harm.  We fear loss of peer-esteem and we fear loss of self-esteem … almost more than we fear physical harm.

Our fear of anticipated loss may be based on reality. Our experience of actual loss in the past.  We remember the emotional pain and we learn from past pain to fear future loss.

Our fear of anticipated loss may also be fueled by rhetoric.  The doom-mongering of the Shroud-Wavers, the Nay-Sayers, the Skeptics and the Cynics.


And there are examples where the rhetorical fear is deliberately generated to drive the fear-of-reality to “the solution” – which of course we have to pay dearly for. This is Machiavellian mass manipulation for commercial gain.

“Fear of germs, fear of fatness, fear of the invisible enemies outside and inside”.

Generating and ameliorating fear is big business. It is a Burn-and-Scrape design.

What we are seeing here is the Drama Triangle operating on a massive scale. The Persecutors create the fear, the Victims run away and the Persecutors then switch role to Rescuers and offer to sell the terrified-and-now-compliant Victims “the  solution” to their fear.  The Victims do not learn.  That is not the purpose – because that would end the Game and derail the Gravy Train.


So fear is not an effective way to motivate for sustained improvement,  and we have ample evidence to support that statement!  It might get us started, but it won’t keep us going.

The Burn-and-Scrape design that we see everywhere is a fear-driven-design.

Any improvements are transitory and usually only achieved at the emotional expense of a passionate idealist. When they get too tired to push any more the toast gets burnt again because the toaster is perfectly designed to burn toast.  Not intentionally designed to burn the toast but perfectly designed to nevertheless.

The use of Delusional Ratios and Arbitrary Targets (DRATs) is a fear-based-design-strategy. It ensures the Fear Game and Gravy Train continue.

And fear has a frightening cost. The cost of checking-and-correcting. The cost of the defensive-bureaucracy that may catch errors before too much local harm results but which itself creates unmeasurable global harm in a different way – by hoovering up the priceless human resource of life-time – like an emotional black hole.

The cost of errors. The cost of queues. The list of fear-based-design costs is long.

A fear-based-design for delivering improvement is a poor design.


So we need a better design.


And a better one is based on a positive-attractive-emotional force pulling us forwards into the future. The anticipation of gains for all. A win-win-win design.

Win-win-win design starts with the Common Purpose: the outcomes that everyone wants; and the outcomes that no-one wants.  We need both.  This balance creates alignment of effort on getting the NiceIfs (the wants) while avoiding the NoNos (the do not wants).

Then we ask the simple question: “What is preventing us having our win-win-win outcome now?

The blockers are the parts of our current design that we need to change: our errors of omission and our errors of commission.  Our gaps and our gaffes.

And to change them we need to be clear what they are; where they are and how they came to be there … and that requires a diagnostic skill that is one of our errors of omission. We have never learned how to diagnose our process design flaws.

Another common blocker is that we believe that a win-win-win outcome is impossible. This is a learned belief. And it is a self-fulfilling prophesy.

We may also believe that all swans are white because we have never seen a black swan – even though we know, in principle, that a black swan could be possible.

Rhetoric and Reality are not the same thing.  Feeling it could be possible and knowing that it actually is possible are different emotions. We need real evidence to challenge our life-limiting rhetoric.

Weary and wary skeptics crave real evidence not rhetorical exhortation.

So when that evidence is presented – and the Impossibility Hypothesis is disproved – then an emotional shock is inevitable.  We are now on the emotional roller-coaster called the Nerve Curve.  And the deeper our skepticism the bigger the shock.


After the shock we characteristically do one of three things:

1. We discount the evidence and go into denial.  We refuse to challenge our own rhetoric. Blissful ignorance is attractive.  The gap between intent and impact is scary.

2. We go quiet because we are now stuck in the the painful awareness of the transition zone between the past and the future. The feelings associated with the transition are anxiety and depression. We don’t want to go back and we don’t know how to go forwards.

3. We sit up, we take notice, we listen harder, we rub our chins, our minds race as we become more and more excited. The feelings associated with the stage of resolution are curiosity, excitement and hope.

It is actually a sequence and it is completely normal.


And those who reach Stage 3 of the Nerve Curve say things like “We have food for thought;  we feel inspired; our passion is re-ignited; we now have a beacon of hope for the future.

That is the flavour of motivation-juice that is needed to fuel the improvement-by-design engine and to deliver win-win-win designs that are both surprising and self-sustaining.

And what actually changes our belief of what is possible is when we learn to do it for ourselves. For real.

That is Improvement Science in action. It is a pragmatic science.

DRAT!

[Bing Bong]  The sound bite heralded Leslie joining the regular Improvement Science mentoring session with Bob.  They were now using web-technology to run virtual meetings because it allows a richer conversation and saves a lot of time. It is a big improvement.

<Bob> Hi Lesley, how are you today?

<Leslie> OK thank you Bob.  I have a thorny issue to ask you about today. It has been niggling me even since we started to share the experience we are gaining from our current improvement-by-design project.

<Bob> OK. That sounds interesting. Can you paint the picture for me?

<Leslie> Better than that – I can show you the picture, I will share my screen with you.

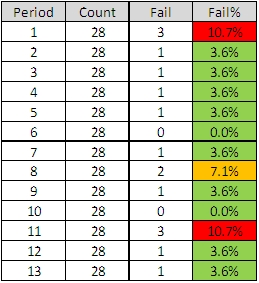
DRAT_01 <Bob> OK. I can see that RAG table. Can you give me a bit more context?

<Leslie> Yes. This is how our performance management team have been asked to produce their 4-weekly reports for the monthly performance committee meetings.

<Bob> OK. I assume the “Period” means sequential four week periods … so what is Count, Fail and Fail%?

<Leslie> Count is the number of discharges in that 4 week period, Fail is the number whose length of stay is longer than the target, and Fail% is the ratio of Fail/Count for each 4 week period.

<Bob> It looks odd that the counts are all 28.  Is there some form of admission slot carve-out policy?

<Leslie> Yes. There is one admission slot per day for this particular stream – that has been worked out from the average historical activity.

<Bob> Ah! And the Red, Amber, Green indicates what?

<Leslie> That is depends where the Fail% falls in a set of predefined target ranges; less than 5% is green, 5-10% is Amber and more than 10% is red.

<Bob> OK. So what is the niggle?

<Leslie>Each month when we are in the green we get no feedback – a deafening silence. Each month we are in amber we get a warning email.  Each month we are in the red we have to “go and explain ourselves” and provide a “back-on-track” plan.

<Bob> Let me guess – this feedback design is not helping much.

<Leslie> It is worse than that – it creates a perpetual sense of fear. The risk of breaching the target is distorting people’s priorities and their behaviour.

<Bob> Do you have any evidence of that?

<Leslie> Yes – but it is anecdotal.  There is a daily operational meeting and the highest priority topic is “Which patients are closest to the target length of stay and therefore need to have their  discharge expedited?“.

<Bob> Ah yes.  The “target tail wagging the quality dog” problem. So what is your question?

<Leslie> How do we focus on the cause of the problem rather than the symptoms?  We want to be rid of the “fear of the stick”.

<Bob> OK. What you have hear is a very common system design flaw. It is called a DRAT.

<Leslie> DRAT?

<Bob> “Delusional Ratio and Arbitrary Target”.

<Leslie> Ha! That sounds spot on!  “DRAT” is what we say every time we miss the target!

<Bob> Indeed.  So first plot this yield data as a time series chart.

<Leslie> Here we go.

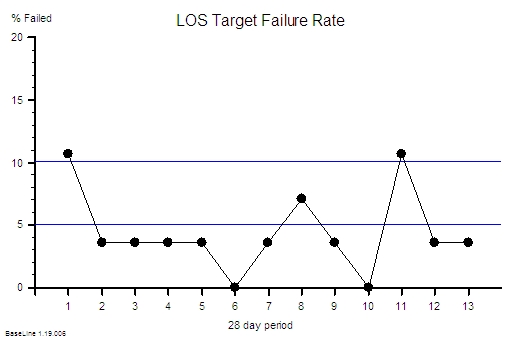
DRAT_02<Bob>Good. I see you have added the cut-off thresholds for the RAG chart. These 5% and 10% thresholds are arbitrary and the data shows your current system is unable to meet them. Your design looks incapable.

<Leslie>Yes – and it also shows that the % expressed to one decimal place is meaningless because there are limited possibilities for the value.

<Bob> Yes. These are two reasons that this is a Delusional Ratio; there are quite a few more.

DRAT_03<Leslie> OK  and if I plot this as an Individuals charts I can see that this variation is not exceptional.

<Bob> Careful Leslie. It can be dangerous to do this: an Individuals chart of aggregate yield becomes quite insensitive with aggregated counts of relatively rare events, a small number of levels that go down to zero, and a limited number of points.  The SPC zealots are compounding the problem and plotting this data as a C-chart or a P-chart makes no difference.

This is all the effect of the common practice of applying  an arbitrary performance target then counting the failures and using that as means of control.

It is poor feedback loop design – but a depressingly common one.

<Leslie> So what do we do? What is a better design?

<Bob> First ask what the purpose of the feedback is?

<Leslie> To reduce the number of beds and save money by forcing down the length of stay so that the bed-day load is reduced and so we can do the same activity with fewer beds and at the same time avoid cancellations.

<Bob> OK. That sounds reasonable from the perspective of a tax-payer and a patient. It would also be a more productive design.

<Leslie> I agree but it seems to be having the opposite effect.  We are focusing on avoiding breaches so much that other patients get delayed who could have gone home sooner and we end up with more patients to expedite. It is like a vicious circle.  And every time we fail we get whacked with the RAG stick again. It is very demoralizing and it generates a lot of resentment and conflict. That is not good for anyone – least of all the patients.

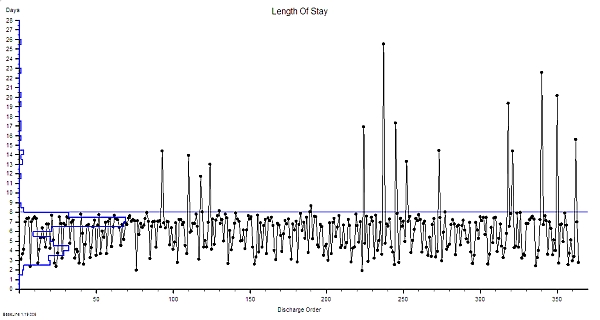
<Bob>Yes.  That is the usual effect of a DRAT design. Remember that senior managers have not been trained in process improvement-by-design either so blaming them is also counter-productive.  We need to go back to the raw data. Can you plot actual LOS by patient in order of discharge as a run chart.

DRAT_04

<Bob> OK – is the maximum LOS target 8 days?

<Leslie> Yes – and this shows  we are meeting it most of the time.  But it is only with a huge amount of effort.

<Bob> Do you know where 8 days came from?

<Leslie> I think it was the historical average divided by 85% – someone read in a book somewhere that 85%  average occupancy was optimum and put 2 and 2 together.

<Bob> Oh dear! The “85% Occupancy is Best” myth combined with the “Flaw of Averages” trap. Never mind – let me explain the reasons why it is invalid to do this.

<Leslie> Yes please!

<Bob> First plot the data as a run chart and  as a histogram – do not plot the natural process limits yet as you have done. We need to do some validity checks first.

DRAT_05

<Leslie> Here you go.

<Bob> What do you see?

<Leslie> The histogram  has more than one peak – and there is a big one sitting just under the target.

<Bob>Yes. This is called the “Horned Gaussian” and is the characteristic pattern of an arbitrary lead-time target that is distorting the behaviour of the system.  Just as you have described subjectively. There is a smaller peak with a mode of 4 days and are a few very long length of stay outliers.  This multi-modal pattern means that the mean and standard deviation of this data are meaningless numbers as are any numbers derived from them. It is like having a bag of mixed fruit and then setting a maximum allowable size for an unspecified piece of fruit. Meaningless.

<Leslie> And the cases causing the breaches are completely different and could never realistically achieve that target! So we are effectively being randomly beaten with a stick. That is certainly how it feels.

<Bob> They are certainly different but you cannot yet assume that their longer LOS is inevitable. This chart just says – “go and have a look at these specific cases for a possible cause for the difference“.

<Leslie> OK … so if they are from a different system and I exclude them from the analysis what happens?

<Bob> It will not change reality.  The current design of  this process may not be capable of delivering an 8 day upper limit for the LOS.  Imposing  a DRAT does not help – it actually makes the design worse! As you can see. Only removing the DRAT will remove the distortion and reveal the underlying process behaviour.

<Leslie> So what do we do? There is no way that will happen in the current chaos!

<Bob> Apply the 6M Design® method. Map, Measure and Model it. Understand how it is behaving as it is then design out all the causes of longer LOS and that way deliver with a shorter and less variable LOS. Your chart shows that your process is stable.  That means you have enough flow capacity – so look at the policies. Draw on all your FISH training. That way you achieve your common purpose, and the big nasty stick goes away, and everyone feels better. And in the process you will demonstrate that there is a better feedback design than DRATs and RAGs. A win-win-win design.

<Leslie> OK. That makes complete sense. Thanks Bob!  But what you have described is not part of the FISH course.

<Bob> You are right. It is part of the ISP training that comes after FISH. Improvement Science Practitioner.

<Leslie> I think we will need to get a few more people trained in the theory, techniques and tools of Improvement Science.

<Bob> That would appear to be the case. They will need a real example to see what is possible.

<Leslie> OK. I am on the case!