 A couple of weeks ago an important event happened. A Masterclass in Demand and Capacity for NHS service managers was run by an internationally renown and very experienced practitioner of Improvement Science.
The purpose was to assist the service managers to develop their capability for designing quality, flow and cost improvement using tried and tested operations management (OM) theory, techniques and tools.
It was assumed that as experienced NHS service managers that they already knew the basic principles of OM and the foundation concepts, terminology, techniques and tools.
It was advertised as a Masterclass and designed accordingly.
On the day it was discovered that none of the twenty delegates had heard of two fundamental OM concepts: Little’s Law and Takt Time.
These relate to how processes are designed-to-flow. It was a Demand and Capacity Master Class; not a safety, quality or cost one. The focus was flow.
And it became clear that none of the twenty delegates were aware before the day that there is a well-known and robust science to designing systems to flow.
So learning this fact came as a bit of a shock.
The implications of this observation are profound and worrying:
“if a significant % of senior NHS operational managers are unaware of the foundations of operations management then the NHS may have problem it was not aware of …“
because …
“if transformational change of the NHS into a stable system that is fit-for-purpose (now and into the future) requires the ability to design processes and systems that deliver both high effectiveness and high efficiency ...”
then …
“it raises the question of whether the current generation of NHS managers are fit-for-this-future-purpose“.
No wonder that discovering a Science of Improvement actually exists came as a bit of a shock!
And saying “Yes, but clinicians do not know this science either!” is a defensive reaction and not a constructive response. They may not but they do not call themselves “operational managers”.
[PS. If you are reading this and are employed by the NHS and do not know what Little’s Law and Takt Time are then it would be worth doing that first. Wikipedia is a good place to start].
And now we have another question:
“Given there are thousands of operational managers in the NHS; what does one sample of 20 managers tell us about the whole population?”
Now that is a good question.
It is also a question of statistics. More specifically quite advanced statistics.
And most people who work in the NHS have not studied statistics to that level. So now we have another do-not-know-how problem.
But it is still an important question that we need to understand the answer to – so we need to learn how and that means taking this learning path one step at a time using what we do know, rather than what we do not.
Step 1:
What do we know? We have one sample of 20 NHS service managers. We know something about our sample because our unintended experiment has measured it: that none of them had heard of Little’s Law or Takt Time. That is 0/20 or 0%.
This is called a “sample statistic“.
What we want to know is “What does this information tell us about the proportion of the whole population of all NHS managers who do have this foundation OM knowledge?”
This proportion of interest is called the unknown “population parameter“.
And we need to estimate this population parameter from our sample statistic because it is impractical to measure a population parameter directly: That would require every NHS manager completing an independent and accurate assessment of their basic OM knowledge. Which seems unlikely to happen.
The good news is that we can get an estimate of a population parameter from measurements made from small samples of that population. That is one purpose of statistics.
Step 2:
But we need to check some assumptions before we attempt this statistical estimation trick.
Q1: How representative is our small sample of the whole population?
If we chose the delegates for the masterclass by putting the names of all NHS managers in a hat and drawing twenty names out at random, as in a tombola or lottery, than we have what is called a “random sample” and we can trust our estimate of the wanted population parameter. This is called “random sampling”.
That was not the case here. Our sample was self-selecting. We were not conducting a research study. This was the real world … so there is a chance of “bias”. Our sample may not be representative and we cannot say what the most likely bias is.
It is possible that the managers who selected themselves were the ones struggling most and therefore more likely than average to have a gap in their foundation OM knowledge. It is also possible that the managers who selected themselves are the most capable in their generation and are very well aware that there is something else that they need to know.
We may have a biased sample and we need to proceed with some caution.
Step 3:
So given the fact that none of our possibly biased sample of mangers were aware of the Foundation OM Knowledge then it is possible that no NHS service managers know this core knowledge. In other words the actual population parameter is 0%. It is also possible that the managers in our sample were the only ones in the NHS who do not know this. So, in theory, the sought-for population parameter could be anywhere between 0% and very nearly 100%. Does that mean it is impossible to estimate the true value?
It is not impossible. In fact we can get an estimate that we can be very confident is accurate. Here is how it is done.
Statistical estimates of population parameters are always presented as ranges with a lower and an upper limit called a “confidence interval” because the sample is not the population. And even if we have an unbiased random sample we can never be 100% confident of our estimate. The only way to be 100% confident is to measure the whole population. And that is not practical.
So, we know the theoretical limits from consideration of the extreme cases … but what happens when we are more real-world-reasonable and say – “let us assume our sample is actually a representative sample, albeit not a randomly selected one“. How does that affect the range of our estimate of the elusive number – the proportion of NHS service managers who know basic operation management theory?
Step 4:
To answer that we need to consider two further questions:
Q2. What is the effect of the size of the sample? What if only 5 managers had come and none of them knew; what if had been 50 or 500 and none of them knew?
Q3. What if we repeated the experiment more times? With the same or different sample sizes? What could we learn from that?
Our intuition tells us that the larger the sample size and the more often we do the experiment then the more confident we will be of the result. In other words narrower the range of the confidence interval around our sample statistic.
Our intuition is correct because if our sample was 100% of the population we could be 100% confident.
So given we have not yet found an NHS service manager who has the OM Knowledge then we cannot exclude 0%. Our challenge narrows to finding a reasonable estimate of the upper limit of our confidence interval.
Step 5
Before we move on let us review where we have got to already and our purpose for starting this conversation: We want enough NHS service managers who are knowledgeable enough of design-for-flow methods to catalyse a transition to a fit-for-purpose and self-sustaining NHS.
One path to this purpose is to have a large enough pool of service managers who do understand this Science well enough to act as advocates and to spread both the know-of and the know-how. This is called the “tipping point“.
There is strong evidence that when about 20% of a population knows about something that is useful for the whole population – then that knowledge will start to spread through the grapevine. Deeper understanding will follow. Wiser decisions will emerge. More effective actions will be taken. The system will start to self-transform.
And in the Brave New World of social media this message may spread further and faster than in the past. This is good.
So if the NHS needs 20% of its operational managers aware of the Foundations of Operations Management then what value is our morsel of data from one sample of 20 managers who, by chance, were all unaware of the Knowledge. How can we use that data to say how close to the magic 20% tipping point we are?
Step 6:
To do that we need to ask the question in a slightly different way.
Q4. What is the chance of an NHS manager NOT knowing?
We assume that they either know or do not know; so if 20% know then 80% do not.
This is just like saying: if the chance of rolling a “six” is 1-in-6 then the chance of rolling a “not-a-six” is 5-in-6.
Next we ask:
Q5. What is the likelihood that we, just by chance, selected a group of managers where none of them know – and there are 20 in the group?
This is rather like asking: what is the likelihood of rolling twenty “not-a-sixes” in a row?
Our intuition says “an unlikely thing to happen!”
And again our intuition is sort of correct. How unlikely though? Our intuition is a bit vague on that.
If the actual proportion of NHS managers who have the OM Knowledge is about the same chance of rolling a six (about 16%) then we sense that the likelihood of getting a random sample of 20 where not one knows is small. But how small? Exactly?
We sense that 20% is too a high an estimate of a reasonable upper limit. But how much too high?
The answer to these questions is not intuitively obvious.
We need to work it out logically and rationally. And to work this out we need to ask:
Q6. As the % of Managers-who-Know is reduced from 20% towards 0% – what is the effect on the chance of randomly selecting 20 all of whom are not in the Know? We need to be able to see a picture of that relationship in our minds.
The good news is that we can work that out with a bit of O-level maths. And all NHS service managers, nurses and doctors have done O-level maths. It is a mandatory requirement.
The chance of rolling a “not-a-six” is 5/6 on one throw – about 83%;
and the chance of rolling only “not-a-sixes” in two throws is 5/6 x 5/6 = 25/36 – about 69%
and the chance of rolling only “not-a-sixes” in three throws is 5/6 x 5/6 x 5/6 – about 58%… and so on.
[This is called the “chain rule” and it requires that the throws are independent of each other – i.e. a random, unbiased sample]
If we do this 20 times we find that the chance of rolling no sixes at all in 20 throws is about 2.6% – unlikely but far from impossible.
We need to introduce a bit of O-level algebra now.
Let us call the proportion of NHS service managers who understand basic OM, our unknown population parameter something like “p”.
So if p is the chance of a “six” then (1-p) is a chance of a “not-a-six”.
Then the chance of no sixes in one throw is (1-p)
and no sixes after 2 throws is (1-p)(1-p) = (1-p)^2 (where ^ means raise to the power)
and no sixes after three throws is (1-p)(1-p)(1-p) = (1-p)^3 and so on.
So the likelihood of “no sixes in n throws” is (1-p)^n
Let us call this “t”
So the equation we need to solve to estimate the upper limit of our estimate of “p” is
t=(1-p)^20
Where “t” is a measure of how likely we are to choose 20 managers all of whom do not know – just by chance. And we want that to be a small number. We want to feel confident that our estimate is reasonable and not just a quirk of chance.
So what threshold do we set for “t” that we feel is “reasonable”? 1 in a million? 1 in 1000? 1 in 100? 1 in10?
By convention we use 1 in 20 (t=0.05) – but that is arbitrary. If we are more risk-averse we might choose 1:100 or 1:1000. It depends on the context.
Let us be reasonable – let is say we want to be 95% confident our our estimated upper limit for “p” – which means we are calculating the 95% confidence interval. This means that will accept a 1:20 risk of our calculated confidence interval for “p” being wrong: a 19:1 odds that the true value of “p” falls outside our calculated range. Pretty good odds! We will be reasonable and we will set the likelihood threshold for being “wrong” at 5%.
So now we need to solve:
0.05= (1-p)^20
And we want a picture of this relationship in our minds so let us draw a graph of t for a range of values of p.
We know the value of p must be between 0 and 1.0 so we have all we need and we can generate this graph easily using Excel. And every senior NHS operational manager knows how to use Excel. It is a requirement. Isn’t it?
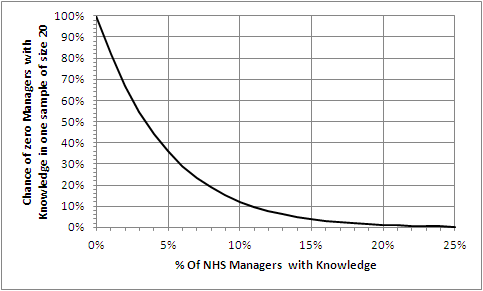
The Excel-generated chart shows the relationship between p (horizontal axis) and t (vertical axis) using our equation:
t=(1-p)^20.
Step 7
Let us first do a “sanity check” on what we have drawn. Let us “check the extreme values”.
If 0% of managers know then a sample of 20 will always reveal none – i.e. the leftmost point of the chart. Check!
If 100% of managers know then a sample of 20 will never reveal none – i.e. way off to the right. Check!
What is clear from the chart is that the relationship between p and t is not a straight line; it is non-linear. That explains why we find it difficult to estimate intuitively. Our brains are not very good at doing non-linear analysis. Not very good at all.
So we need a tool to help us. Our Excel graph. We read down the vertical “t” axis from 100% to the 5% point, then trace across to the right until we hit the line we have drawn, then read down to the corresponding value for “p”. It says about 14%.
So that is the upper limit of our 95% confidence interval of the estimate of the true proportion of NHS service managers who know the Foundations of Operations Management. The lower limit is 0%.
And we cannot say better than somewhere between 0%-14% with the data we have and the assumptions we have made.
To get a more precise estimate, a narrower 95% confidence interval, we need to gather some more data.
[Another way we can use our chart is to ask “If the actual % of Managers who know is x% the what is the chance that no one of our sample of 20 will know?” Solving this manually means marking the x% point on the horizontal axis then tracing a line vertically up until it crosses the drawn line then tracing a horizontal line to the left until it crosses the vertical axis and reading off the likelihood.]
So if in reality 5% of all managers do Know then the chance of no one knowing in an unbiased sample of 20 is about 35% – really quite likely.
Now we are getting a feel for the likely reality. Much more useful than just dry numbers!
But we are 95% sure that 86% of NHS managers do NOT know the basic language of flow-improvement-science.
And what this chart also tells us is that we can be VERY confident that the true value of p is less than 2o% – the proportion we believe we need to get to transformation tipping point.
Now we need to repeat the experiment experiment and draw a new graph to get a more accurate estimate of just how much less – but stepping back from the statistical nuances – the message is already clear that we do have a Black Curtain problem.
A Black Curtain of Ignorance problem.
Many will now proclaim angrily “This cannot be true! It is just statistical smoke and mirrors. Surely our managers do know this by a different name – how could they not! It is unthinkable to suggest the majority of NHS manages are ignorant of the basic science of what they are employed to do!“
If that were the case though then we would already have an NHS that is fit-for-purpose. That is not what reality is telling us.
And it quickly become apparent at the master class that our sample of 20 did not know-this-by-a-different-name.
The good news is that this knowledge gap could hiding the opportunity we are all looking for – a door to a path that leads to a radical yet achievable transformation of the NHS into a system that is fit-for-purpose. Now and into the future.
A system that delivers safe, high quality care for those who need it, in full, when they need it and at a cost the country can afford. Now and for the foreseeable future.
And the really good news is that this IS knowledge gap may be and extensive deep but it is not wide … the Foundations are is easy to learn, and to start applying immediately. The basics can be learned in less than a week – the more advanced skills take a bit longer. And this is not untested academic theory – it is proven pragmatic real-world problem solving know-how. It has been known for over 50 years outside healthcare.
Our goal is not acquisition of theoretical knowledge – is is a deep enough understanding to make wise enough decisions to achieve good enough outcomes. For everyone. Starting tomorrow.
And that is the design purpose of FISH. To provide those who want to learn a quick and easy way to do so.
Stop Press: Further feedback from the masterclass is that some of the managers are grasping the nettle, drawing back their own black curtains, opening the door that was always there behind it, and taking a peek through into a magical garden of opportunity. One that was always there but was hidden from view.
 The most useful tool that a busy operational manager can have is a reliable and responsive early warning system (EWS).
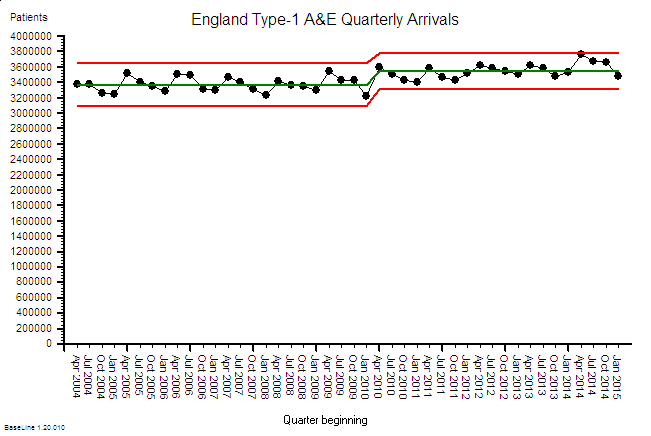
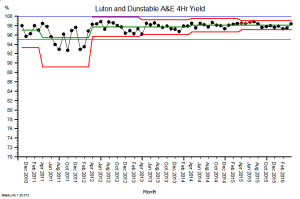 Here is an example. It is the SPC chart of the monthly A&E 4-hour target yield performance of an acute NHS Trust. The blue lines are the ‘required’ range (95% to 100%), the green line is the average and the red lines are a measure of variation over time. What this charts says is: “This hospital’s A&E 4-hour target yield performance is currently acceptable, has been so since April 2012, and is improving over time.”












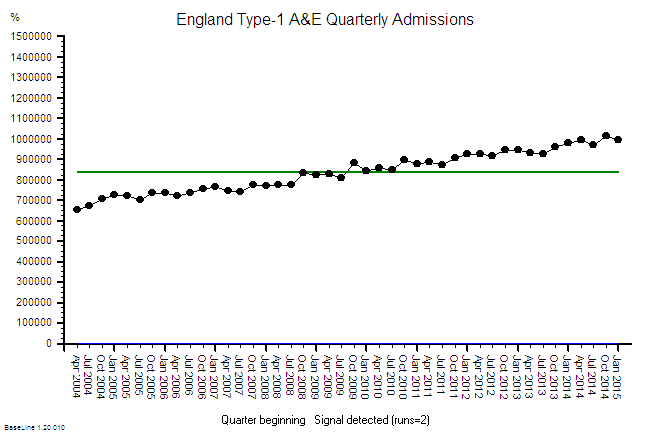
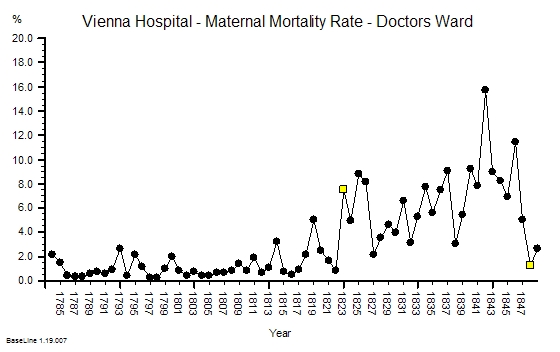
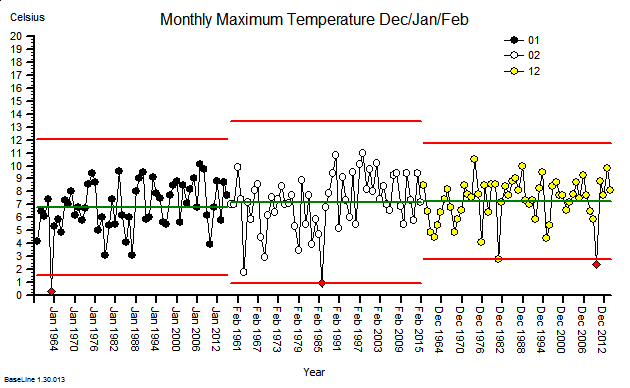 These were indeed almost identical so I lumped them together as a ‘winter’ group and compared the earlier half with the later half using another BaseLine© feature called segmentation.