
 [Drrring Drrring] The phone heralded the start of the weekly ISP mentoring session.
<Bob> Hi Leslie, how are you today?
<Leslie> Hi Bob. To be honest I am not good. I am drowning. Drowning in data!
<Bob> Oh dear! I am sorry to hear that. Can I help? What led up to this?
<Leslie> Well, it was sort of triggered by our last chat and after you opened my eyes to the fact that we habitually throw most of our valuable information away by thresholding, aggregating and normalising. Then we wonder why we make poor decisions … and then we get frustrated because nothing seems to improve.
<Bob> OK. What happened next?
<Leslie> I phoned our Performance Team and asked for some raw data. Three months worth.
<Bob> And what was their reaction?
<Leslie> They said “OK, here you go!” and sent me a twenty megabyte Excel spreadsheet that clogged my email inbox! I did manage to unclog it eventually by deleting loads of old junk. But I could swear that I heard the whole office laughing as they hung up the phone! Maybe I am paranoid?
<Bob> OK. And what happened next?
<Leslie> I started drowning! The mega-file had a row of data for every patient that has attended A&E for the last three months as I had requested, but there were dozens of columns! Trying to slice-and-dice it was a nightmare! My computer was smoking and each step took ages for it to complete. In the end I gave up in frustration. I now have a lot more respect for the Performance Team I can tell you! They do this for a living?
<Bob> OK. It sounds like you are ready for a Stab At the Vitals.
<Leslie> What? That sounds rather piratical! Are you making fun of my slicing-and-dicing metaphor?
<Bob> No indeed. I am deadly serious! Before we leap into the data ocean we need to be able to swim; and we also need a raft that will keep us afloat; and we need a sail to power our raft; and we need a way to navigate our raft to our desired destination.
<Leslie> OK. I like the nautical metaphor but how does it help?
<Bob> Let me translate. Learning to use system behaviour charts is equivalent to learning the skill of swimming. We have to do that first and practice until we are competent and confident. Let us call our raft “ISP” – you are already aboard. The sail you also have already – your Excel software. The navigation aid is what I refer to as Vitals. So we need to have a “stab at the vitals”.
<Leslie> Do you mean we use a combination of time-series charts, ISP and Excel to create a navigation aid that helps avoid the Depths of Data and the Rocks of DRAT?
<Bob> Exactly.
<Leslie> Can you demonstrate with an example?
<Bob> Sure. Send me some of your data … just the arrival and departure events for one day – a typical one.
<Leslie> OK … give me a minute! … It is on its way. How long will it take for you to analyse it?
<Bob> About 2 seconds. OK, here is your email … um … copy … paste … copy … reply
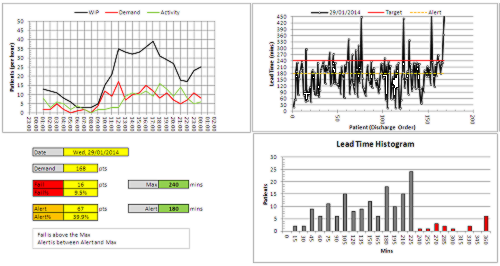 <Leslie> What the ****? That was quick! Let me see what this is … the top left chart is the demand, activity and work-in-progress for each hour; the top right chart is the lead time by patient plotted in discharge order; the table bottom left includes the 4 hour breach rate. Those I do recognise. What is the chart on the bottom right?
<Bob> It is a histogram of the lead times … and it shows a problem. Can you see the spike at 225 to 240 minutes?
<Leslie> Is that the fabled Horned Gaussian?
<Bob> Yes. That is the sign that the 4-hour performance target is distorting the behaviour of the system. And this is yet another reason why the Breach Rate is a dangerous management metric. The adaptive reaction it triggers amplifies the variation and fuels the chaos.
<Leslie> Wow! And you did all that in Excel using my data in two seconds? That must need a whole host of clever macros and code!
<Bob> “Yes” it was done in Excel and “No” it does not need any macros or code. It is all done using simple formulae.
<Leslie> That is fantastic! Can you send me a copy of your Excel file?
<Bob> Nope.
<Leslie>Whaaaat? Why not? Is this some sort of evil piratical game?
<Bob> Nope. You are going to learn how to do this yourself – you are going to build your own Vitals Chart Generator – because that is the only way to really understand how it works.
<Leslie> Phew! You had me going for a second there! Bring it on! What do I do next?
<Bob> I will send you the step-by-step instructions of how to build, test and use a Vitals Chart Generator.
<Leslie> Thanks Bob. I cannot wait to get started! Weigh anchor and set the sails! Ha’ harrrr me hearties.