
 [Drrrrrrring]
<Leslie> Hi Bob, I hope I am not interrupting you. Do you have five minutes?
<Bob> Hi Leslie. I have just finished what I was working on and a chat would be a very welcome break. Fire away.
<Leslie> I really just wanted to say how much I enjoyed the workshop this week, and so did all the delegates. They have been emailing me to say how much they learned and thanking me for organising it.
<Bob> Thank you Leslie. I really enjoyed it too … and I learned lots … I always do.
<Leslie> As you know I have been doing the ISP programme for some time, and I have come to believe that you could not surprise me any more … but you did! I never thought that we could make such a dramatic improvement in waiting times. The queue just melted away and I still cannot really believe it. Was it a trick?
<Bob> Ahhhh, the siren-call of the battle-hardened sceptic! It was no trick. What you all saw was real enough. There were no computers, statistics or smoke-and-mirrors used … just squared paper and a few coloured pens. You saw it with your own eyes; you drew the charts; you made the diagnosis; and you re-designed the policy. All I did was provide the context and a few nudges.
<Leslie> I know, and that is why I think seeing the before and after data would help me. The process felt so much better, but I know I will need to show the hard evidence to convince others, and to convince myself as well, to be brutally honest. I have the before data … do you have the after data?
<Bob> I do. And I was just plotting it as BaseLine charts to send to you. So you have pre-empted me. Here you are.
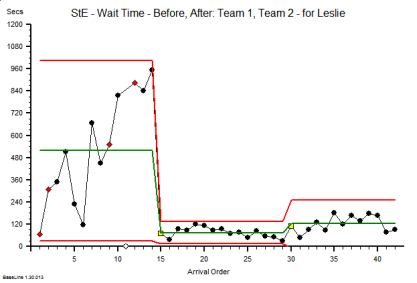
This is the waiting time run chart for the one stop clinic improvement exercise that you all did. The leftmost segment is the before, and the rightmost are the after … your two ‘new’ designs.
As you say, the queue and the waiting has melted away despite doing exactly the same work with exactly the same resources. Surprising and counter-intuitive but there is the evidence.
<Leslie> Wow! That fits exactly with how it felt. Quick and calm! But I seem to remember that the waiting room was empty, particularly in the case of the design that Team 1 created. How come the waiting is not closer to zero on the chart?
<Bob> You are correct. This is not just the time in the waiting room, it also includes the time needed to move between the rooms and the changeover time within the rooms. It is what I call the ‘tween-time.
<Leslie> OK, that makes sense now. And what also jumps out of the picture for me is the proof that we converted an unstable process into a stable one. The chaos was calmed. So what is the root cause of the difference between the two ‘after’ designs?
<Bob> The middle one, the slightly better of the two, is the one where all patients followed the newly designed process. The rightmost one was where we deliberately threw a spanner in the works by assuming an unpredictable case mix.
<Leslie> Which made very little difference! The new design was still much, much better than before.
<Bob> Yes. What you are seeing here is the footprint of resilient design. Do you believe it is possible now?
<Leslie> You bet I do!