

The blog last week seems to have caused a bit of a stir … so this week we will continue on the same theme.
I’m Dr Bob and I am a hospital doctor: I help to improve the health of poorly hospitals.
And I do that using the Science of Improvement – which is the same as all sciences, there is a method to it.
Over the next few weeks I will outline, in broad terms, how this is done in practice.
And I will use the example of a hospital presenting with pain in their A&E department. We will call it St.Elsewhere’s ® Hospital … a fictional name for a real patient.
It is a while since I learned science at school … so I thought a bit of a self-refresher would be in order … just to check that nothing fundamental has changed.
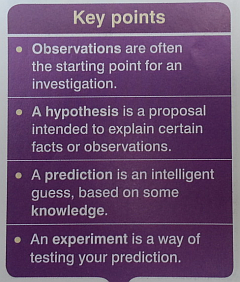
This is what I found on page 2 of a current GCSE chemistry textbook.
Note carefully that the process starts with observations; hypotheses come after that; then predictions and finally designing experiments to test them.
The scientific process starts with study.
Which is reassuring because when helping a poorly patient or a poorly hospital that is exactly where we start.
So, first we need to know the symptoms; only then can we start to suggest some hypotheses for what might be causing those symptoms – a differential diagnosis; and then we look for more specific and objective symptoms and signs of those hypothetical causes.
<Dr Bob> What is the presenting symptom?
<StE> “Pain in the A&E Department … or more specifically the pain is being felt by the Executive Department who attribute the source to the A&E Department. Their pain is that of 4-hour target failure.“
<Dr Bob> Are there any other associated symptoms?
<StE> “Yes, a whole constellation. Complaints from patients and relatives; low staff morale, high staff turnover, high staff sickness, difficulty recruiting new staff, and escalating locum and agency costs. The list is endless.”
<Dr Bob> How long have these symptoms been present?
<StE> “As long as we can remember.”
<Dr Bob> Are the symptoms staying the same, getting worse or getting better?
<StE> “Getting worse. It is worse in the winter and each winter is worse than the last.”
<Dr Bob> And what have you tried to relieve the pain?
<StE> “We have tried everything and anything – business process re-engineering, balanced scorecards, Lean, Six Sigma, True North, Blue Oceans, Golden Hours, Perfect Weeks, Quality Champions, performance management, pleading, podcasts, huddles, cuddles, sticks, carrots, blogs and even begging. You name it we’ve tried it! The current recommended treatment is to create a swarm of specialist short-stay assessment units – medical, surgical, trauma, elderly, frail elderly just to name a few.”
<Dr Bob> And how effective have these been?
<StE> “Well some seemed to have limited and temporary success but nothing very spectacular or sustained … and the complexity and cost of our processes just seem to go up and up with each new initiative. It is no surprise that everyone is change weary and cynical.”
The pattern of symptoms is that of a chronic (longstanding) illness that has seasonal variation, which is getting worse over time and the usual remedies are not working.
And it is obvious that we do not have a clear diagnosis; or know if our unclear diagnosis is incorrect; or know if we are actually dealing with an incurable disease.
So first we need to focus on establishing the diagnosis.
And Dr Bob is already drawing up a list of likely candidates … with carveoutosis at the top.
<Dr Bob> Do you have any data on the 4-hour target pain? Do you measure it?
<StE> “We are awash with data! I can send the quarterly breach performance data for the last ten years!”
<Dr Bob> Excellent, that will be useful as it should confirm that this is a chronic and worsening problem but it does not help establish a diagnosis. What we need is more recent, daily data. Just the last six months should be enough. Do you have that?
<StE> “Yes, that is how we calculate the quarterly average that we are performance managed on. Here is the spreadsheet. We are ‘required’ to have fewer than 5% 4-hour breaches on average. Or else.”
This is where Dr Bob needs some diagnostic tools. He needs to see the pain scores presented as picture … so he can see the pattern over time … because it is a very effective way to generate plausible causal hypotheses.
Dr Bob can do this on paper, or with an Excel spreadsheet, or use a tool specifically designed for the job. He selects his trusted visualisation tool : BaseLine©.

<Dr Bob> This is your A&E pain data plotted as a time-series chart. At first glance it looks very chaotic … that is shown by the wide and flat histogram. Is that how it feels?
<StE> “That is exactly how it feels … earlier in the year it was unremitting pain and now we have a constant background ache with sharp, severe, unpredictable stabbing pains on top. I’m not sure what is worse!
<Dr Bob> We will need to dig a bit deeper to find the root cause of this chronic pain … we need to identify the diagnosis or diagnoses … and your daily pain data should offer us some clues.
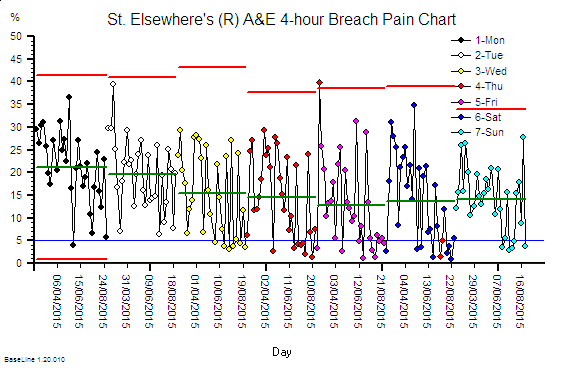 So I have plotted your data in a different way … grouping by day of the week … and this shows there is a weekly pattern to your pain. It looks worse on Mondays and least bad on Fridays. Is that your experience?
<StE> “Yes, the beginning of the week is definitely worse … because it is like a perfect storm … more people referred by their GPs on Mondays and the hospital is already full with the weekend backlog of delayed discharges so there are rarely beds to admit new patients into until late in the day. So they wait in A&E.
Dr Bob’s differential diagnosis is firming up … he still suspects acute-on-chronic carveoutosis as the primary cause but he now has identified an additional complication … Forrester’s Syndrome.
And Dr Bob suspects an unmentioned problem … that the patient has been traumatised by a blunt datamower!
So that is the evidence we will look for next … here