 It was the appointed time for Bob and Leslie’s regular coaching session as part of the improvement science practitioner programme.
<Leslie> Hi Bob, I am feeling rather despondent today so please excuse me in advance if you hear a lot of “Yes, but …” language.
<Bob> I am sorry to hear that Leslie. Do you want to talk about it?
<Leslie> Yes, please. The trigger for my gloom was being sent on a mandatory training workshop.
<Bob> OK. Training to do what?
<Leslie> Outpatient demand and capacity planning!
<Bob> But you know how to do that already, so what is the reason you were “sent”?
<Leslie> Well, I am no longer sure I know how to it. That is why I am feeling so blue. I went more out of curiosity and I came away utterly confused and with my confidence shattered.
<Bob> Oh dear! We had better start at the beginning. What was the purpose of the workshop?
<Leslie> To train everyone in how to use an Outpatient Demand and Capacity planning model, an Excel one that we were told to download along with the User Guide. I think it is part of a national push to improve waiting times for outpatients.
<Bob> OK. On the surface that sounds reasonable. You have designed and built your own Excel flow-models already; so where did the trouble start?
<Leslie> I will attempt to explain. This was a paragraph in the instructions. I felt OK with this because my Improvement Science training has given me a very good understanding of basic demand and capacity theory.
 <Bob> OK. I am guessing that other delegates may have felt less comfortable with this. Was that the case?
<Leslie> The training workshops are targeted at Operational Managers and the ones I spoke to actually felt that they had a good grasp of the basics.
<Bob> OK. That is encouraging, but a warning bell is ringing for me. So where did the trouble start?
<Leslie> Well, before going to the workshop I decided to read the User Guide so that I had some idea of how this magic tool worked. This is where I started to wobble – this paragraph specifically …
<Bob> H’mm. What did you make of that?
<Leslie> It was complete gibberish to me and I felt like an idiot for not understanding it. I went to the workshop in a bit of a panic and hoped that all would become clear. It didn’t.
<Bob> Did the User Guide explain what ‘percentile’ means in this context, ideally with some visual charts to assist?
<Leslie> No and the use of ‘th’ and ‘%’ was really confusing too. After that I sort of went into a mental fog and none of the workshop made much sense. It was all about practising using the tool without any understanding of how it worked. Like a black magic box.
<Bob> OK. I can see why you were confused, and do not worry, you are not an idiot. It looks like the author of the User Guide has unwittingly used some very confusing and ambiguous terminology here. So can you talk me through what you have to do to use this magic box?
<Leslie> First we have to enter some of our historical data; the number of new referrals per week for a year; and the referral and appointment dates for all patients for the most recent three months.
<Bob> OK. That sounds very reasonable. A run chart of historical demand and the raw event data for a Vitals Chart® is where I would start the measurement phase too – so long as the data creates a valid 3 month reporting window.
<Leslie> Yes, I though so too … but that is not how the black box model seems to work. The weekly demand is used to draw an SPC chart, but the event data seems to disappear into the innards of the black box, and recommendations pop out of it.
<Bob> Ah ha! And let me guess the relationship between the term ‘percentile’ and the SPC chart of weekly new demand was not explained?
<Leslie> Spot on. What does percentile mean?
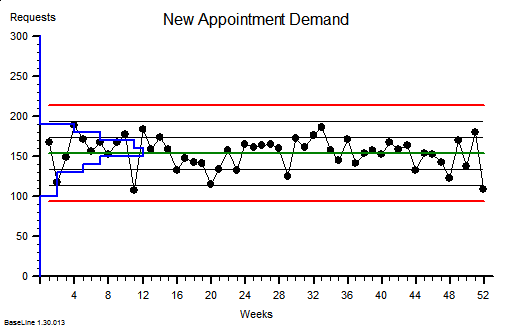
<Bob> It is statistics jargon. Remember that we have talked about the distribution of the data around the average on a BaseLine chart; and how we use the histogram feature of BaseLine to show it visually. Like this example.
 <Leslie> Yes. I recognise that. This chart shows a stable system of demand with an average of around 150 new referrals per week and the variation distributed above and below the average in a symmetrical pattern, falling off to zero around the upper and lower process limits. I believe that you said that over 99% will fall within the limits.
<Bob> Good. The blue histogram on this chart is called a probability distribution function, to use the terminology of a statistician.
<Leslie> OK.
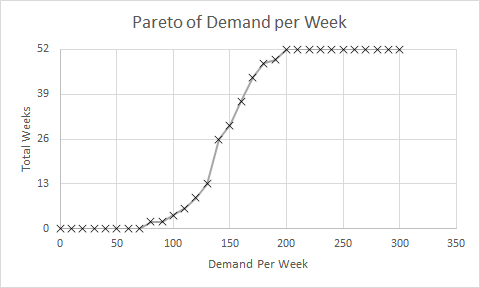
<Bob> So, what would happen if we created a Pareto chart of demand using the number of patients per week as the categories and ignoring the time aspect? We are allowed to do that if the behaviour is stable, as this chart suggests.
<Leslie> Give me a minute, I will need to do a rough sketch. Does this look right?
<Bob> Perfect! So if you now convert the Y-axis to a percentage scale so that 52 weeks is 100% then where does the average weekly demand of about 150 fall? Read up from the X-axis to the line then across to the Y-axis.
<Leslie> At about 26 weeks or 50% of 52 weeks. Ah ha! So that is what a percentile means! The 50th percentile is the average, the zeroth percentile is around the lower process limit and the 100th percentile is around the upper process limit!
<Bob> In this case the 50th percentile is the average, it is not always the case though. So where is the 85th percentile line?
<Leslie> Um, 52 times 0.85 is 44.2 which, reading across from the Y-axis then down to the X-axis gives a weekly demand of about 170 per week. That is about the same as the average plus one sigma according to the run chart.
<Bob> Excellent. The Pareto chart that you have drawn is called a cumulative probability distribution function … and that is usually what percentiles refer to. Comparative Statisticians love these but often omit to explain their rationale to non-statisticians!
<Leslie> Phew! So, now I can see that the 65th percentile is just above average demand, and 85th percentile is above that. But in the confusing paragraph how does that relate to the phrase “65% and 85% of the time”?
<Bob> It doesn’t. That is the really, really confusing part of that paragraph. I am not surprised that you looped out at that point!
<Leslie> OK. Let us leave that for another conversation. If I ignore that bit then does the rest of it make sense?
<Bob> Not yet alas. We need to dig a bit deeper. What would you say are the implications of this message?
<Leslie> Well. I know that if our flow-capacity is less than our average demand then we will guarantee to create an unstable queue and chaos. That is the Flaw of Averages trap.
<Bob> OK. The creator of this tool seems to know that.
<Leslie> And my outpatient manager colleagues are always complaining that they do not have enough slots to book into, so I conclude that our current flow-capacity is just above the 50th percentile.
<Bob> A reasonable hypothesis.
<Leslie> So to calm the chaos the message is saying I will need to increase my flow capacity up to the 85th percentile of demand which is from about 150 slots per week to 170 slots per week. An increase of 7% which implies a 7% increase in costs.
<Bob> Good. I am pleased that you did not fall into the intuitive trap that a increase from the 50th to the 85th percentile implies a 35/50 or 70% increase! Your estimate of 7% is a reasonable one.
<Leslie> Well it may be theoretically reasonable but it is not practically possible. We are exhorted to reduce costs by at least that amount.
<Bob> So we have a finance versus governance bun-fight with the operational managers caught in the middle: FOG. That is not the end of the litany of woes … is there anything about Did Not Attends in the model?
<Leslie> Yes indeed! We are required to enter the percentage of DNAs and what we do with them. Do we discharge them or re-book them.
<Bob> OK. Pragmatic reality is always much more interesting than academic rhetoric and this aspect of the real system rather complicates things, at least for a comparative statistician. This is where the smoke and mirrors will appear and they will be hidden inside the black magic box. To solve this conundrum we need to understand the relationship between demand, capacity, variation and yield … and it is rather counter-intuitive. So, how would you approach this problem?
<Leslie> I would use the 6M Design® framework and I would start with a map and not with a model; least of all a magic black box one that I did not design, build and verify myself.
<Bob> And how do you know that will work any better?
<Leslie> Because at the One Day ISP Workshop I saw it work with my own eyes. The queues, waits and chaos just evaporated. And it cost nothing. We already had more than enough “capacity”.
<Bob> Indeed you did. So shall we do this one as an ISP-2 project?
<Leslie> An excellent suggestion. I already feel my confidence flowing back and I am looking forward to this new challenge. Thank you again Bob.


