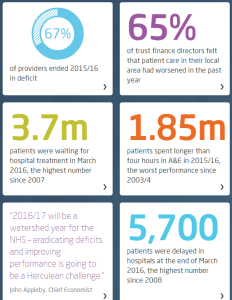
 This week the King’s Fund published their Quality Monitoring Report for the NHS, and it makes depressing reading.
These highlights are a snapshot.
The website has some excellent interactive time-series charts that transform the deluge of data the NHS pumps out into pictures that tell a shameful story.
On almost all reported dimensions, things are getting worse and getting worse faster.
Which I do not believe is the intention.
But it is clearly the impact of the last 20 years of health and social care policy.
What is more worrying is the data that is notably absent from the King’s Fund QMR.
The first omission is outcome: How well did the NHS deliver on its intended purpose? It is stated at the top of the NHS England web site …
And lets us be very clear here: dying, waiting, complaining, and over-spending are not measures of what we want: health and quality success metrics. They are a measures of what we do not want; they are failure metrics.
The fanatical focus on failure is part of the hyper-competitive, risk-averse medical mindset:
primum non nocere (first do no harm),
and as a patient I am reassured to hear that but is no harm all I can expect?
What about:
tunc mederi (then do some healing)
And where is the data on dying in the Kings Fund QMR?
It seems to be notably absent.
And I would say that is a quality issue because it is something that patients are anxious about. And that may be because they are given so much ‘open information’ about what might go wrong, not what should go right.
And you might think that sharp, objective data on dying would be easy to collect and to share. After all, it is not conveniently fuzzy and subjective like satisfaction.
It is indeed mandatory to collect hospital mortality data, but sharing it seems to be a bit more of a problem.
The fear-of-failure fanaticism extends there too. In the wake of humiliating, historical, catastrophic failures like Mid Staffs, all hospitals are monitored, measured and compared. And the negative deviants are named, shamed and blamed … in the hope that improvement might follow.
And to do the bench-marking we need to compare apples with apples; not peaches with lemons. So we need to process the raw data to make it fair to compare; to ensure that factors known to be associated with higher risk of death are taken into account. Factors like age, urgency, co-morbidity and primary diagnosis. Factors that are outside the circle-of-control of the hospitals themselves.
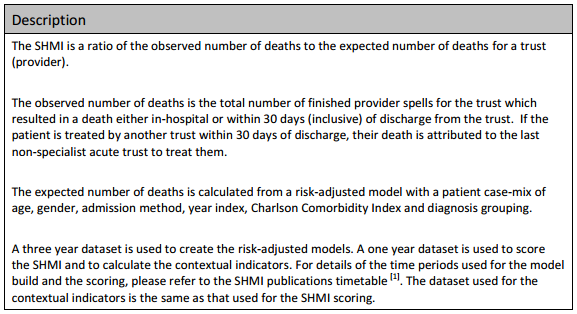
And there is an army of academics, statisticians, data processors, and analysts out there to help. The fruit of their hard work and dedication is called SHMI … the Summary Hospital Mortality Index.
Now, the most interesting paragraph is the third one which outlines what raw data is fed in to building the risk-adjusted model. The first four are objective, the last two are more subjective, especially the diagnosis grouping one.
The importance of this distinction comes down to human nature: if a hospital is failing on its SHMI then it has two options:
(a) to improve its policies and processes to improve outcomes, or
(b) to manipulate the diagnosis group data to reduce the SHMI score.
And the latter is much easier to do, it is called up-coding, and basically it involves camping at the pessimistic end of the diagnostic spectrum. And we are very comfortable with doing that in health care. We favour the Black Hat.
And when our patients do better than our pessimistically-biased prediction, then our SHMI score improves and we look better on the NHS funnel plot.
We do not have to do anything at all about actually improving the outcomes of the service we provide, which is handy because we cannot do that. We do not measure it!
And what might be notably absent from the data fed in to the SHMI risk-model? Data that is objective and easy to measure. Data such as length of stay (LOS) for example?
Is there a statistical reason that LOS is omitted? Not really. Any relevant metric is a contender for pumping into a risk-adjustment model. And we all know that the sicker we are, the longer we stay in hospital, and the less likely we are to come out unharmed (or at all). And avoidable errors create delays and complications that imply more risk, more work and longer length of stay. Irrespective of the illness we arrived with.
So why has LOS been omitted from SHMI?
The reason may be more political than statistical.
We know that the risk of death increases with infirmity and age.
We know that if we put frail elderly patients into a hospital bed for a few days then they will decondition and become more frail, require more time in hospital, are more likely to need a transfer of care to somewhere other than home, are more susceptible to harm, and more likely to die.
So why is LOS not in the risk-of-death SHMI model?
And it is not in the King’s Fund QR report either.
Nor is the amount of cash being pumped in to keep the HMS NHS afloat each month.
All notably absent!


