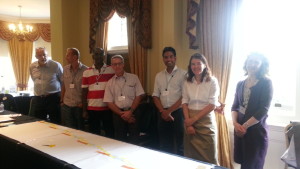
 This is a snapshot of an experiment in progress. The question being asked is “Can consultant surgeons be trained to be system flow designers in one day?”
On the left are Kate Silvester and Phil Debenham … their doctor/trainers.
On the right are some brave volunteer consultant surgeons.
It is a tense moment. The focused concentration is palpable. It is a tough design assignment … a chronically chaotic one-stop outpatient clinic. They know it well.
They have the raw, unprocessed, data and they are deep into diagnosis mode. On the other side of the room is another team of consultant surgeon volunteers who are struggling with the same challenge. Competition is in the air. Reputations are on the line. The game is on.
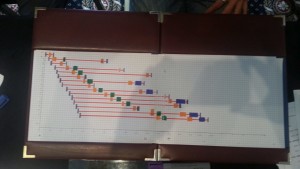
 They are racing to generate this … a process template chart … that illustrates the conversion of raw event data into something visible and meaningful. A Gantt chart.
Their tools are basic – coloured pens and squared paper – just as Henry L. Gantt used in 1916 – a hundred years ago.
Hidden in this Gantt chart is the diagnosis, the open door to the path to improving this clinic design. It is as plain as the nose on your face … if you know what to look for. They don’t. Well, … not yet.
Skip forwards to later in the experiment. Both teams have solved the ‘impossible’ problem. They have diagnosed the system design flaw that was causing the queues, chaos and waiting … and they have designed and verified a solution. With no more than squared paper and coloured pens. Henry G would be delighted.
And they are justifiably proud of their achievement because, when they tested their design in the real world, it showed that the queues and chaos had “evaporated”. And it cost … nothing.
At the start of the experiment they were unaware of what was possible. At the end of the experiment they knew how to do it. In one day.
The question: ‘”Can consultant surgeons be trained to be system flow designers in one day?”
The answer: “Yes”

