 Many organisations proclaim that their vision, goal, objective and mission is to achieve excellence but then proceed to deliver mediocre performance.
Why is this?
It is certainly not from lack of purpose, passion or people.
So, the flaw must lie somewhere in the process.
The clue lies in how we measure performance … and to see the collective mindset behind the design of the performance measurement system we just need to examine the key performance indicators or KPIs.
Do they measure failure or success?
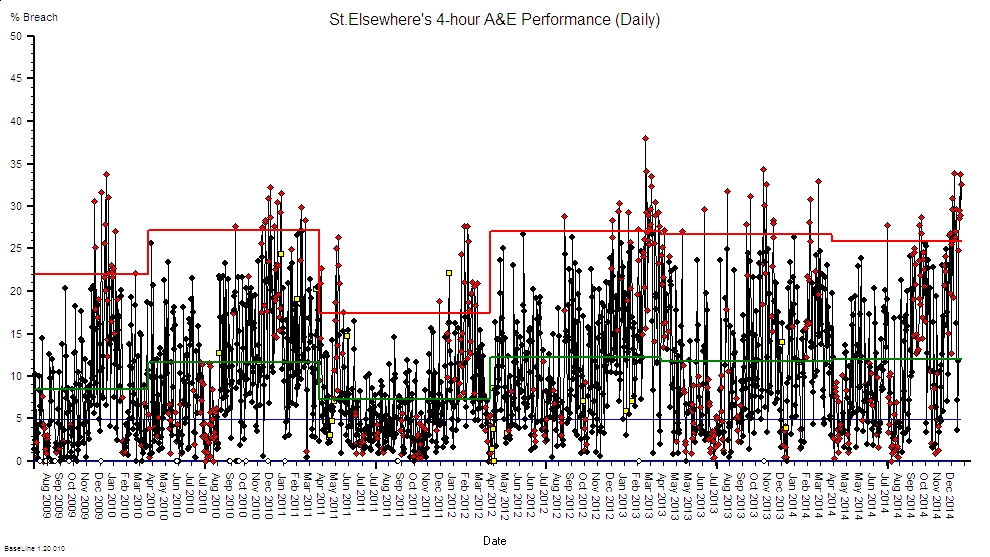
Let us look at some from the NHS …. hospital mortality, hospital acquired infections, never events, 4-hour A&E breaches, cancer wait breaches, 18 week breaches, and so on.
In every case the metric reported is a failure metric. Not a success metric.
And the focus of action is all about getting away from failure.
Damage mitigation, damage limitation and damage compensation.
So, we have the answer to our question: our performance metrics prove we know we are doing a good job when we are not failing.
But are we?
When we are not failing we are not doing a bad job … is that the same as doing a good job?
Q: Does excellent = not excrement?
A: No. There is something between the extremes of excrement and excellent.
And the succeed-or-fail dichotomy is a distorting simplification created by applying an arbitrary threshold to a continuous measure of performance.
So, how, specifically, have we designed our current system to avoid failure?
Usually by imposing an arbitrary target connected to a punitive reaction to failure. Performance management by fear.
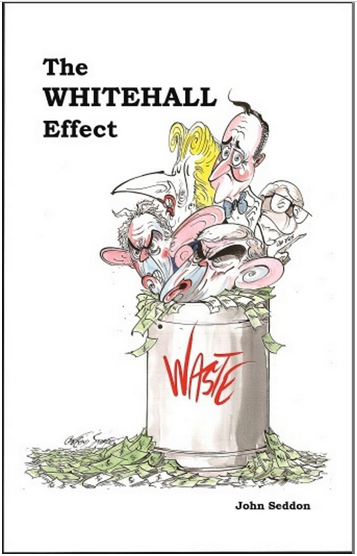
This tactic generates an expected and predictable punishment-avoidance and back-covering behaviour which is manifest as a lot of repeated checking and correcting of the inevitable errors that we find. A lot of extra work that requires extra time and that requires extra money.
So, while an arbitrary-target-driven-check-and-correct design may avoid failing on safety, the additional cost may cause us to then fail on financial viability.
Out of the frying pan and into the fire.
No wonder Governance and Finance come into conflict!
And if we do manage to pull off an uneasy compromise … then what level of quality are we achieving?
Studies show that if take a random sample of 100 people from the pool of ‘disappointed by their experience’ and we ask if they are prepared to complain then only 5% will do so.
So, if we use complaints as our improvement feedback loop and we react to that and make changes that eliminate these complaints then what do we get? Excellence?
Nope.
We get what we designed … just good enough to avoid the 5% of complaints but not the 95% of disappointment.
We get mediocrity.
And what do we do then?
We start measuring ‘customer satisfaction’ … which is actually asking the question ‘did your experience meet your expectation?’
And if we find that satisfaction scores are disappointingly low then how do we improve them?
We have two choices: improve the experience or reduce the expectation.
But as we are very busy doing the necessary checking-and-correcting then our path of least resistance to greater satisfaction is … to lower expectations.
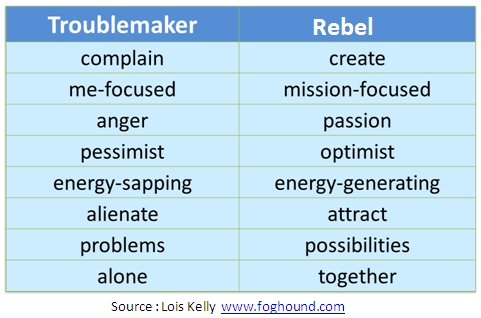
And we do that by donning the black hat of the pessimist and we lay out the the risks and dangers.
And by doing that we generate anxiety and fear. Which was not the intended outcome.
Our mission statement proclaims ‘trusted to achieve excellence’ rather than ‘designed to deliver mediocrity’.
But mediocrity is what the evidence says we are delivering. Just good enough to avoid a smack.
And if we are honest with ourselves then we are forced to conclude that:
A design that uses failure metrics as the primary feedback loop can achieve no better than mediocrity.
So, if we choose to achieve excellence then we need a better feedback design.
We need a design that uses success metrics as the primary feedback loop and we use failure metrics only in safety critical contexts.
And the ideal people to specify the success metrics are those who feel the benefit directly and immediately … the patients who receive care and the staff who give it.
Ask a patient what they want and they do not say “To be treated in less than 18 weeks”. In fact I have yet to meet a patient who has even heard of the 18-week target!
A patient will say ‘I want to know what is wrong, what can be done, when it can be done, who will do it, what do I need to do, and what can I expect to be the outcome’.
Do we measure any of that?
Do we measure accuracy of diagnosis? Do we measure use of best evidenced practice? Do we know the possible delivery time (not the actual)? Do we inform patients of what they can expect to happen? Do we know what they can expect to happen? Do we measure the experience and outcome for every patient? Good and not so good? Do we feed that information back continuously and learn from it?
Nope.
So …. if we choose and commit to delivering excellence then we will need to start measuring-4-success and feeding what we see back to those who deliver the care.
Warts and all.
We want to know when we are doing a good job, and we need to know where to focus further improvement effort.
And if we abdicate that commitment and choose to deliver mediocrity-by-default then we are the engineers of our own chaos and despair.
We have the choice.
We are the agents of our own destiny.