
 The title of this alter piece by Lorenzo Lotto is Magnum Chaos. It was painted in the first half of the 16th Century.
Chaos was the Greek name for the primeval state of existence from which everything that has order was created. Similar concepts exist in all ancient mythologies.
The sudden appearance of order from chaos is the subject of much debate and current astronomical science refers to it as the Big Bang … which is the sense that this 500 year old image captures. Except that it appears to have happened bout 13.5 thousand million years ago.
So it is surprising to learn that the Science of Chaos did not really get going until about 50 years ago – shortly after the digital computer was developed.
The timing is no co-incidence. The theoretical roots of chaos had been known for much longer – since Isaac Newton formulated the concept of gravity. About 200 years ago it became the “Three-Body Problem”. The motion of the Earth, Moon and Sun is a three-body gravitational problem.
And in 1887, mathematicians Ernst Bruns and Henri Poincaré showed that there is no general analytical solution for the three-body problem given by algebraic expressions and integrals. The motion of three bodies is generally non-repeating, except in special cases. No simple equation describes it.
The implication of this is that the only way to solve this sort of problem is by grunt-work, empirically, with thousands of millions of small calculations. And in 1887 the technology was not available to do this.
So when the high-speed transistorised digital computer appeared in the 1960’s it became possible to revisit this old niggle … and the nature of chaos became much better understood. The modern legacy of this pioneering work is the surprising accuracy that we can now predict the weather – at least over the short term – using powerful digital computers running chaotic system simulation models. Weather is a chaotic flow system.
So given the knowledge that exists about the nature of flow in naturally chaotic systems … it is surprising that not much of this understanding has diffused into the design of man-made systems; such as healthcare.
It has probably not escaped most people’s attention that the NHS is suffering yet another “winter crisis” … despite the fact that the NHS budget has doubled over the last 15 years.
If we can predict the weather, but not control it, then why cannot we avoid the annual NHS crisis – which is a much simpler system that we can influence?
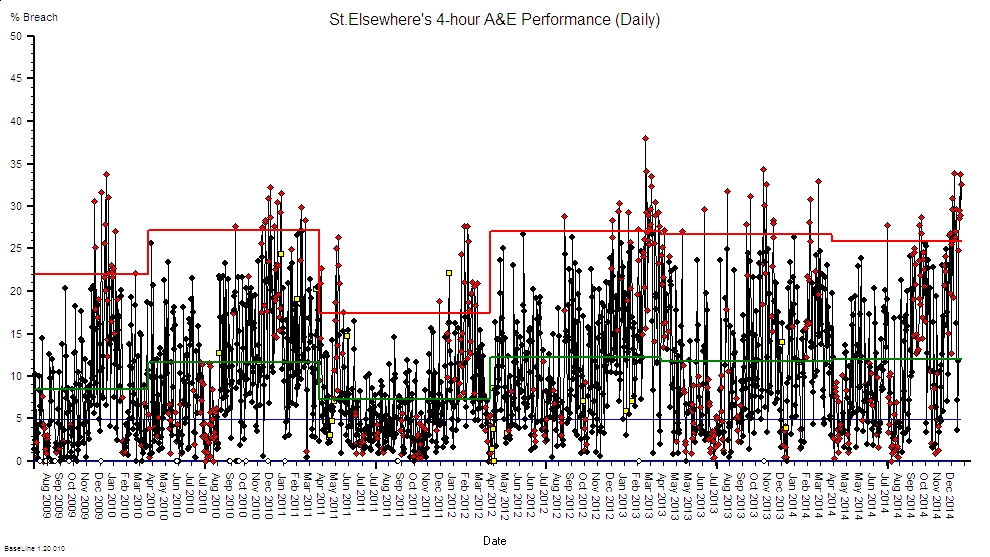
The chart above shows the actual behaviour of a healthcare system – a medium sized hospital that we shall call St.Elsewhere’s®. It could be called St.Anywhere’s. The performance metric that is being plotted over time is the % of patients who arrive each day in the A&E department and who are there for more than 4 hours. The infamous 4-hour A&E target. The time-span on the horizontal axis is just over 5 years – and the data has been segmented by financial year.
The behaviour of this system over time is not random. It is chaotic.
There are repeating but non-identical cyclical patterns in the data … for example the first half of the year (April to September) is “better” than the second half. And this cyclical pattern appears to be changing as time passes.
The thin blue line is the arbitrary ‘target’. And it does require a statistical expert to conclude that this system has never come close to achieving the ‘target’. The system design is not capable of achieving it … so beating the system with a stick is not going to help. It amounts to the Basil Fawlty tactic of beating the broken-down car with a tree branch!
The system needs to be re-designed in order to achieve the requirement of consistently less than a 5% failure rate on the 4-hour A&E target. Exhortation is ineffective.
And this is not a local problem … it is a systemic one … BBC News
To re-design a system to achieve improved performance we first need to understand why the current design is not demonstrating the behaviour we want. Guessing is not design. It is guess-work. Generating a hypothesis is not design. It is guess-work too.
Design requires understanding.
A common misunderstanding is that the primary cause of deteriorating A&E performance is increasing demand. Reality does not support this rhetoric.
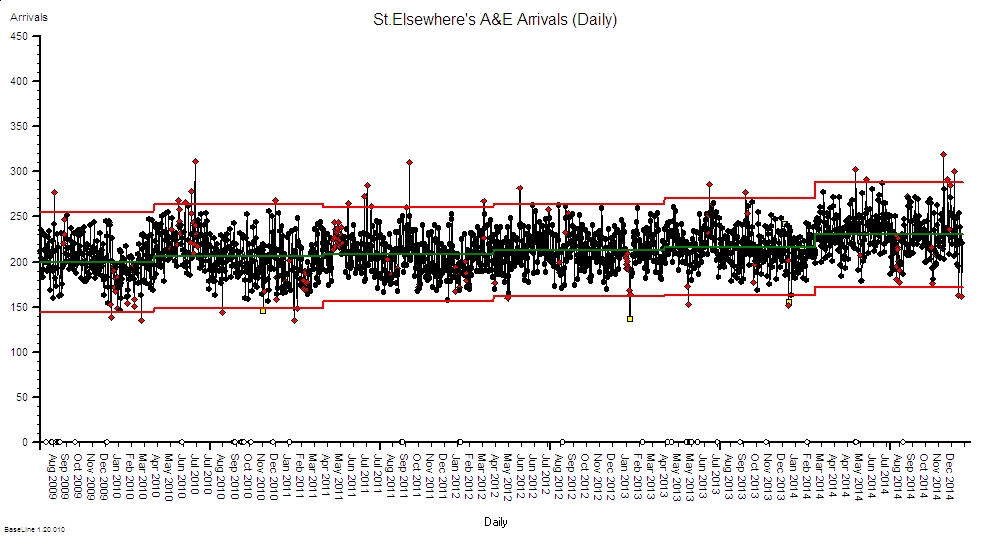 This system behaviour chart (SBC) shows the A&E daily demand for the same period segmented by financial year. Over time there has indeed been an increase in the average demand, but that association does not prove causality. If increasing demand caused performance failure we would expect to see matching cyclical patterns on both charts. But it is rather obvious that there is little relation between the two charts – the periods of highest demand do not correlate with the periods of highest failure. If anything there is a negative correlation – there is actually less demand in the second half of the financial year compared with the first.
So there must be more to it than just the average A&E demand. Could there be a chicken-and-egg problem here? Higher breach rates leading to lower demand? Word gets round about a poor quality service! What about the weather? What about the effect of day-length? What about holidays? What about annual budgets?
What is uncomfortably obvious is that the chaotic behaviour has been going on for a long time. That is because it is an inherent part of the design. We created it because we designed the NHS.
One surprising lesson that Chaos Theory teaches us is that chaos is predictable. A system can be designed to behave chaotically … and rather easily too. It does not required a complicated design – a mechanically simple system can behave chaotically – a hinged pendulum for example.
So if we can deliberately design a system to behave chaotically then surely we can understand what design features are critical to delivering chaos and what are not. And with that insight might we then examine the design of man-made systems that we do not want to behave chaotically … such as our healthcare system?
And when we do that we discover something rather uncomfortable – that our healthcare system has been nearly perfectly designed to generate chaotic behaviour. That may not have been the intention but it is the outcome.
So how did we get ourselves into this mess … and how do we get ourselves out of it?
To understand chaotic flow behaviour we need to consider two effects: the first is called a destabilising effect, the other is a stabilising effect.
The golden rule of chaos is that if the destabilising effect dominates then we get bumpy behaviour, if the stabilizing effect dominates then we get smooth flow.
So to eliminate the chaos all we need to do is to adjust the balance of these two effects … increase the stabilisers and reduce the destabilisers.
And because of the counter-intuitive nature of non-linear flow systems, only a small change in this balance can have a big effect: it can flip us from stable to chaotic, and it can also flip us back.
The trick is knowing how to tweak the design to create the flip. Tweak at the wrong place or wrong time and nothing improves … as our chart above illustrates.
We need chaotic-flow-diagnostic and anti-chaotic-flow-design capability … and that is clearly lacking … because if it were present we would not be having this conversation.
And that capability exists … it is called Improvement Science. We just need to learn it.