Improvement-by-Design is not the same as Improvement-by-Desire.
Improvement-by-Design has a clear destination and a design that we know can get us there because we have tested it before we implement it.
Improvement-by-Desire has a vague direction and no design – we do not know if the path we choose will take us in the direction we desire to go. We cannot see the twists and turns, the unknown decisions, the forks, the loops, and the dead-ends. We expect to discover those along the way. It is an exercise in hope.
So where pessimists and skeptics dominate the debate then Improvement-by-Design is a safer strategy.
Just over seven weeks ago I started an Improvement-by-Design project – a personal one. The destination was clear: to get my BMI (body mass index) into a “healthy” range by reducing weight by about 5 kg. The design was clear too – to reduce energy input rather than increase energy output. It is a tried-and-tested method – “avoid burning the toast”. The physical and physiological model predicted that the goal was achievable in 6 to 8 weeks.
So what has happened?
To answer that question requires two time-series charts. The input chart of calories ingested and the output chart of weight. This is Step 5 of the 6M Design® sequence.
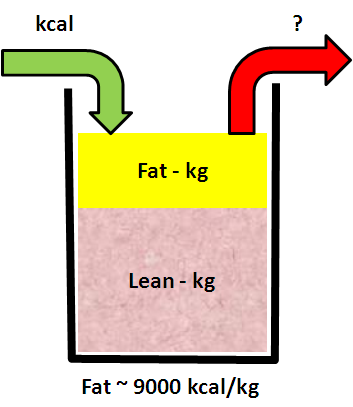 Remember that there was another parameter in this personal Energy-Weight system: the daily energy expended.
But that is very difficult to measure accurately – so I could not do that.
What I could do was to estimate the actual energy expended from the model of the system using the measured effect of the change. But that is straying into the Department of Improvement Science Nerds. Let us stay in the real world a bit longer.
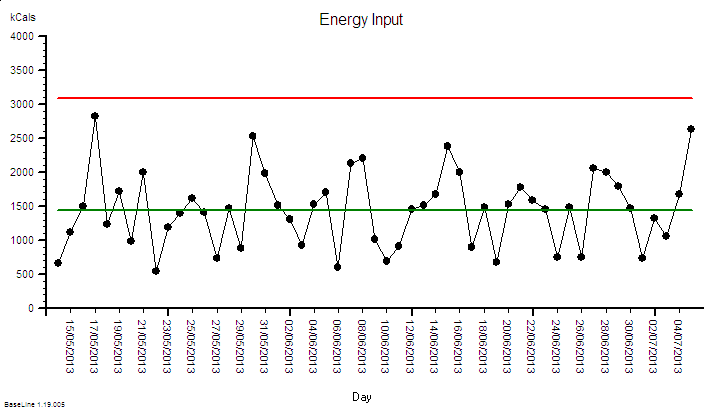
Here is the energy input chart …
It shows an average calorie intake of 1500 kcal – the estimated required value to achieve the weight loss given the assumptions of the physiological model. It also shows a wide day-to-day variation. It does not show any signal flags (red dots) so an inexperienced Improvementologist might conclude that this just random noise.
It is not. The data is not homogeneous. There is a signal in the system – a deliberate design change – and without that context it is impossible to correctly interpret the chart.
Remember Rule #1: Data without context is meaningless.
The deliberate process design change was to reduce calorie intake for just two days per week by omitting unnecessary Hi-Cal treats – like those nice-but-naughty Chocolate Hobnobs. But which two days varied – so there is no obvious repeating pattern in the chart. And the intake on all days varied – there were a few meals out and some BBQ action.
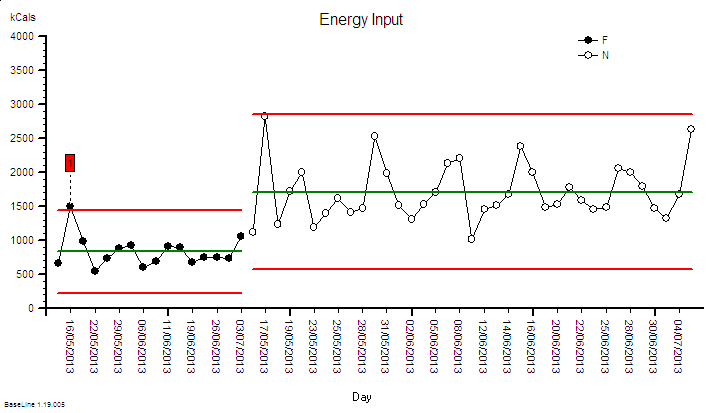
To separate out these two parts of the voice-of-the-process we need to rationally group the data into the Lo-cal days (F) and the OK-cal days (N).
The grouped BaseLine© chart tells a different story. The two groups clearly have a different average and both have a lower variation-over-time than the meaningless mixed-up chart.
And we can now see a flag – on the second F day. That is a prompt for an “investigation” which revealed: will-power failure. Thursday evening beer and peanuts! The counter measure was to avoid Lo-cal on a Thursday!
What we are seeing here is the fifth step of 6M Design® exercise – the Monitor step.
And as well as monitoring the factor we are changing – the cause; we also monitor the factor we want to influence – the effect.
The effect here is weight. And our design includes a way of monitoring that – the daily weighing.
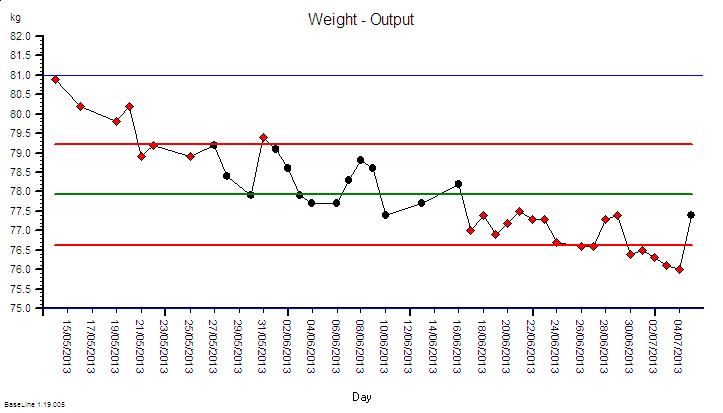 The output metric BaseLine© chart – weight – shows a very different pattern. It is described as “unstable” because there are clusters of flags (red dots) – some at the start and some at the end. The direction of the instability is “falling” – which is the intended outcome.
So we have robust, statistically valid evidence that our modified design is working.
The weight is falling so the energy going in must be less than the energy being put out. I am burning off the excess lard and without doing any extra exercise. The physics of the system mandate that this is the only explanation. And that was my design specification.
So that is good. Our design is working – but is it working as we designed? Does observation match prediction? This is Improvement-by-Design.
Remember that we had to estimate the other parameter to our model – the average daily energy output – and we guessed a value of 2400 kcal per day using generic published data. Now I can refine the model using my specific measured change in weight – and I can work backwards to calculate the third parameter. And when I did that the number came out at 2300 kcal per day. Not a huge difference – the equivalent of one yummy Chocolate Hobnob a day – but the effect is cumulative. Over the 53 days of the 6M Design® project so far that would be a 5300 kcal difference – about 0.6kg of useless blubber.
So now I have refined my personal energy-weight model using the new data and I can update my prediction and create a new chart – a Deviation from Aim chart.
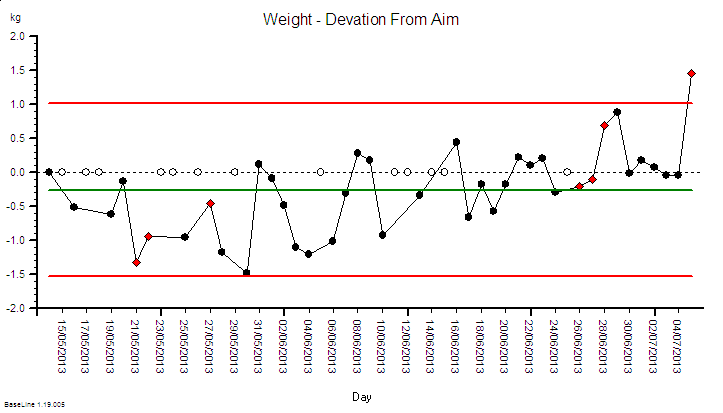
This is the chart I need to watch to see if I am on the predicted track – and it too is unstable -and not a good direction. It shows that the deviation-from-aim is increasing over time and this is because my original guesstimate of an unmeasurable model parameter was too high.
This means that my current design will not get me to where I want to be, when I what to be there. This tells me I need to tweak my design. And I have a list of options.
1) I could adjust the target average calories per day down from 1500 to 1400 and cut out a few more calories; or
2) I could just keep doing what I am doing and accept that it will take me longer to get to the destination; or
3) I could do a bit of extra exercise to burn the extra 100 kcals a day off, or
4) I could do a bit of any or all three.
And because I am comparing experience with expectation using a DFA chart I will know very quickly if the design tweak is delivering.
And because some nice weather has finally arrived so the BBQ will be busy I have chosen to take longer to get there. I will enjoy the weather, have a few beers and some burgers. And that is OK. It is a perfectly reasonable design option – it is a rational and justifiable choice.
And I need to set my next destination – a weight if about 72 kg according to the BMI chart – and with my calibrated Energy-Weight model I will know exactly how to achieve that weight and how long it will take me. And I also know how to maintain it – by increasing my calorie intake. More beer and peanuts – maybe – or the occasional Chocolate Hobnob even. Hurrah! Win-win-win!
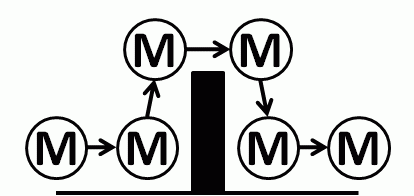 This real-life example illustrates 6M Design® in action and demonstrates that it is a generic framework.
The energy-weight model in this case is a very simple one that can be worked out on the back of a beer mat (which is what I did).
It is called a linear model because the relationship between calories-in and weight-out is approximately a straight line.
Most real-world systems are not like this. Inputs are not linearly related to outputs. They are called non-linear systems: and that makes a BIG difference.
A very common error is to impose a “linear model” on a “non-linear system” and it is a recipe for disappointment and disaster. We do that when we commit the Flaw of Averages error. We do it when we plot linear regression lines through time-series data. We do it when we extrapolate beyond the limits of our evidence. We do it when we equate time with money.
The danger of this error is that our linear model leads us to make unwise decisions and we actually make the problem worse – not better. We then give up in frustration and label the problem as “impossible” or “wicked” or get sucked into to various forms of Snake Oil Sorcery.
The safer approach is to assume the system is non-linear and just let the voice of the system talk to us through our BaseLine© charts. The challenge for us is to learn to understand what the system is saying.
That is why the time-series charts are called System Behaviour Charts and that is why they are an essential component of Improvement-by-Design.
However – there is a step that must happen before this – and that is to get the Foundations in place. The foundation of knowledge on which we can build our new learning. That gap must be filled first.
And anyone who wants to invest in learning the foundations of improvement science can now do so at their own convenience and at their own pace because it is on-line …. and it is here.

