
 It does not seem to take much to bring a real system to an almost standstill. Six inches of snow falling between 10 AM and 2 PM in a Friday in January seems to be enough!
It was not so much the amount of snow – it was the timing. The decision to close many schools was not made until after the pupils had arrived – and it created a logistical nightmare for parents.
Many people suddenly needed to get home before they expected which created an early rush hour and gridlocked the road system.
The same number of people travelled the same distance in the same way as they would normally – it just took them a lot longer. And the queues created more problems as people tried to find work-arounds to bypass the traffic jams.
How many thousands of hours of life-time was wasted sitting in near-stationary queues of cars? How many millions of poundsworth of productivity was lost? How much will the catchup cost?
And yet while we grumble we shrug our shoulders and say “It is just one of those things. We cannot control the weather. We just have to grin and bear it.”
Actually we do not have to. And we do not need a weather machine to control the weather. Mother Nature is what it is.
Exactly the same behaviour happens in many systems – and our conclusion is the same. We assume the chaos and queues are inevitable.
They are not.
They are symptoms of the system design – and specifically they are the inevitable outcomes of the time-design.
But it is tricky to visualise the time-design of a system. We can see the manifestations of the poor time-design, the queues and chaos, but we do not so easily perceive the causes. So the poor time-design persists. We are not completely useless though; there are lots of obvious things we can do. We can devise ingenious ways to manage the queues; we can build warehouses to hold the queues; we can track the jobs in the queues using sophisticated and expensive information technology; we can identify the hot spots; we can recruit and deploy expediters, problem-solvers and fire-fighters to facilitate the flow through the hottest of them; and we can pump capacity and money into defences, drains and dramatics. And our efforts seem to work so we congratulate ourselves and conclude that these actions are the only ones that work. And we keep clamouring for more and more resources. More capacity, MORE capacity, MORE CAPACITY.
Until we run out of money!
And then we have to stop asking for more. And then we start rationing. And then we start cost-cutting. And then the chaos and queues get worse.
And all the time we are not aware that our initial assumptions were wrong.
The chaos and queues are not inevitable. They are a sign of the time-design of our system. So we do have other options. We can improve the time-design of our system. We do not need to change the safety-design; nor the quality-design; nor the money-design. Just improving the time-design will be enough. For now.
So the $64,000,000 question is “How?”
Before we explore that we need to demonstrate What is possible. How big is the prize?
The class of system design problem that cause particular angst are called mixed-priority mixed-complexity crossed-stream designs. We encounter dozens of them in our daily life and we are not aware of it. One of particular interest to many is called a hospital. The mixed-priority dimension is the need to manage some patients as emergencies, some as urgent and some as routine. The mixed-complexity dimension is that some patients are easy and some are complex. The crossed-stream dimension is the aggregation of specialised resources into departments. Expensive equipment and specific expertise. We then attempt to push patients with different priorites long different paths through these different departments . And it is a management nightmare!
 Our usual and “obvious” response to this challenge is called a carve-out design. And that means we chop up our available resource capacity into chunks. And we do that in two ways: chunks of time and chunks of space. We try to simplify the problem by dissecting it into bits that we can understand. We separate the emergency departments from the planned-care facilities. We separate outpatients from inpatients. We separate medicine from surgery – and we then intellectually dissect our patients into organ systems: brains, lungs, hearts, guts, bones, skin, and so on – and we create separate departments for each one. Neurology, Respiratory, Cardiology, Gastroenterology, Orthopaedics, Dermatology to list just a few. And then we become locked into the carve-out design silos like prisoners in cages of our own making.
And so it is within the departments that are sub-systems of the bigger system. Simplification, dissection and separation. Ad absurdam.
The major drawback with our carve-up design strategy is that it actually makes the system more complicated. The number of necessary links between the separate parts grows exponentially. And each link can hold a small queue of waiting tasks – just as each side road can hold a queue of waiting cars. The collective complexity is incomprehensible. The cumulative queue is enormous. The opportunity for confusion and error grows exponentially. Safety and quality fall and cost rises. Carve-out is an inferior time-design.
But our goal is correct: we do need to simplify the system so that means simplifying the time-design.
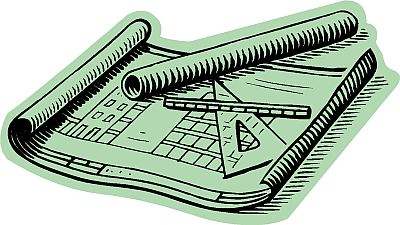
To illustrate the potential of this ‘simplify the time-design’ approach we need a real example.
One way to do this is to create a real system with lots of carve-out time-design built into it and then we can observe how it behaves – in reality. A carefully designed Table Top Game is one way to do this – one where the players have defined Roles and by following the Rules they collectively create a real system that we can map, measure and modify. With our Table Top Team trained and ready to go we then pump realistic tasks into our realistic system and measure how long they take in reality to appear out of the other side. And we then use the real data to plot some real time-series charts. Not theoretical general ones – real specific ones. And then we use the actual charts to diagnose the actual causes of the actual queues and actual chaos.
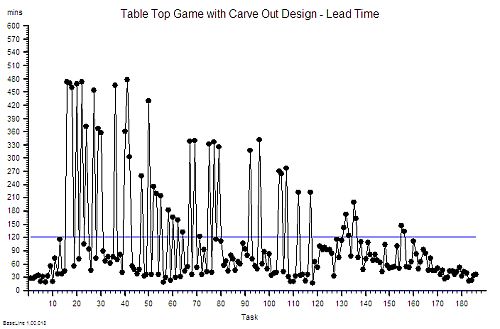 This is the time-series chart of a real Time-Design Game that has been designed using an actual hospital department and real observation data. Which department it was is not of importance because it could have been one of many. Carve-out is everywhere.
During one run of the Game the Team processed 186 tasks and the chart shows how long each task took from arriving to leaving (the game was designed to do the work in seconds when in the real department it took minutes – and this was done so that one working day could be condensed from 8 hours into 8 minutes!)
There was a mix of priority: some tasks were more urgent than others. There was a mix of complexity: some tasks required more steps that others. The paths crossed at separate steps where different people did defined work using different skills and special equipment. There were handoffs between all of the steps on all of the streams. There were lots of links. There were many queues. There were ample opportunities for confusion and errors.
But the design of the real process was such that the work was delivered to a high quality – there were very few output errors. The yield was very high. The design was effective. The resources required to achieve this quality were represented by the hours of people-time availability – the capacity. The cost. And the work was stressful, chaotic, pressured, and important – so it got done. Everyone was busy. Everyone pulled together. They helped each other out. They were not idle. They were a good team. The design was efficient.
The thin blue line on the time-series chart is the “time target” set by the Organisation. But the effective and efficient system design only achieved it 77% of the time. So the “obvious” solution was to clamour for more people and for more space and for more equipment so that the work can be done more quickly to deliver more jobs on-time. Unfortunately the Rules of the Time-Design Game do not allow this more-money option. There is no more money.
To succeed at the Time-Design Game the team must find a way to improve their delivery time performance with the capacity they have and also to deliver the same quality. But this is impossible! If it were possible then the solution would be obvious and they would be doing it already. No one can succeed on the Time-Design Game.
Wrong. It is possible. And the assumption that the solution is obvious is incorrect. The solution is not obvious – at least to the untrained eye.
To the trained eye the time-series chart shows the characteristic signals of a carve-out time-design. The high task-to-task variation is highly suggestive as is the pattern of some of the earlier arrivals having a longer lead time. An experienced system designer can diagnose a carve-out time-design from a set of time-series charts of a process just as a doctor can diagnose the disease from the vital signs chart for a patient. And when the diagnosis is confirmed with a verification test then the time-Redesign phase can start.
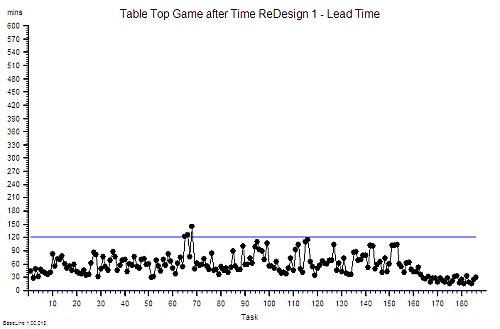 This chart shows what happened after the time-design of the system was changed – after some of the carve-out design was modified. The Y-axis scale is the same as before – and the delivery time improvement is dramatic. The Time-ReDesigned system is now delivering 98% achievement of the “on time target”.
The important thing to be aware of is that exactly the same work was done, using exactly the same steps, and exactly the same resources. No one had to be retrained, released or recruited. The quality was not impaired. And the cost was actually less because less overtime was needed to mop up the spillover of work at the end of the day.
And the Time-ReDesigned system feels better to work in. It is not chaotic; flow is much smoother; and it is busy yet relaxed and even fun. The same activity is achieved by the same people doing the same work in the same sequence. Only the Time-Design has changed. A change that delivered a win for the workers!
What was the impact of this cost-saving improvement on the customers of this service? They can now be 98% confident that they will get their task completed correctly in less than 120 minutes. Before the Time-Redesign the 98% confidence limit was 470 minutes! So this is a win for the customers too!
And the Time-ReDesigned system is less expensive so it is a win for whoever is paying.
Same safety and quality, quicker with less variation, and at lower cost. Win-Win-Win.
And the usual reaction to playing the Time-ReDesign Game is incredulous disbelief. Some describe it as a “light bulb” moment when they see how the diagnosis of the carve-out time-design is made and and how the Time-ReDesign is done. They say “If I had not seen it with my own eyes I would not have believed it.” And they say “The solutions are simple but not obvious!” And they say “I wish I had learned this years ago!” And thay apologise for being so skeptical before.
And there are those who are too complacent, too careful or too cynical to play the Time-ReDesign Game (which is about 80% of people actually) – and who deny themselves the opportunity of a win-win-win outcome. And that is their choice. They can continue to grin and bear it – for a while longer.
And for the 20% who want to learn how to do Time ReDesign for real in their actual systems there is now a Ray Of Hope.
And the Ray of Hope is illuminating a signpost on which is written “This Way to Improvementology“.