The Surprising Science of Motivation

Intended improvement requires focussed change which requires systemic design which requires collaborative action which requires motivation. So where does the motivation come from? Money? or Meaning?  This animated talk by Dan Pink from RSA is so much more effective than a feeble blog!

Design work is the antithesis of the repetitive, mechanical, uninspiring, mundane, day-to-day work that we do for money. Design work is always unique, always challenging, and always fun – and hard – and many people do it in their own time for nothing. The whole Open Source Software movement is testament to that.

But why should the designers have all the fun? The question misses the point – we are all designers and we can can all become better designers. We can mix up the designing and the delivering. And when we do that it gets even better because we get the fun of the design bit and the reward of the delivery bit too.

So how can we justify staying as we are when we can see how much fun is feasible?

Are-Eee-Ess-Pee-Eee-See-Tee

The phrase that sums up the attitude and behaviour of an effective Improvement Scientist is respectful challenge. The challenge part is the easier to appreciate because to improve we have to change something which implies that we have to challenge the current reality in some way. The respect part is a bit tricker.

One dictionary definition is: Respect gives a positive feeling of esteem for a person or entity. The opposite of respect is contempt.

This definition gets us started because it points to what happens inside our heads – feeling respected is a good feeling; feeling disrespected is a bad one. Improvement only happens and is sustained when it is strongly associated with good feelings. That is how our the caveman wetware between our ears works. So respect is a fundamental component of improvement.

The animation illustrates several aspects of respect. One is the handshake. It is one of those rituals that on the surface seems illogical and superfluous but it has deep social and psychological importance. I once read that it comes from the time when men carried swords and the hand shake signifies “I am not holding my sword“. The handshake is an expression of extending mutual trust using a clear visual signal – it is a mark of mutual respect.  The other aspect is signified by the neckties. Again an illogical and superfluous garment except that it too broadcasts a signal – the message “I have prepared for this meeting by taking care to be clean and tidy because it is important“. This too has great social significance – in the past the biggest killer was not swords but something much smaller and more dangerous. Germs. People knew that disease and dirt were associated and that meant a dirty person was a dangerous one. Cleaning up was much more difficult in the days before piped water, baths, showers, washing machines and soap – so to put effort into getting clean and tidy was a mark of great respect. It still is.

So if we want to challenge and influence improvement then we must establish respect first. And that means we have to behave in a respectful manner. And that means we have to think in a respectful way. And that means we have to consciously not behave in an unintended disrespectful manner. Our learned rituals, such as a smile, a handshake and a hello, help us to do that automatically. Unfortunately it is more often what we do not do that is the most disrespectful behaviour.  And we all fall into these traps.

Unintended outcomes that result from what we do not do are called Errors of Omission (EOO) – and they are tricky to spot because there is no tangible evidence of them. The evidence of the error is intangible – a bad feeling.

For example, not acknowledging someone is an EOO. This is very obvious in social situations and it presses one of our Three Fears buttons – the Fear of Rejection.  It is very easy to broadcast to whole roomful of people that you do not respect someone just by obviously ignoring them.  And the higher up the social pecking order you are the greater the impact: for two reasons. First because followers unconsciously copy the behaviour of the leader; and second because it broadcasts the message that disrespectful behaviour is OK.

Contempt is toxic to a collaborative culture and blocks significant, sustained improvement.

In the modern world we have so many more ways that we can communicate and therefore many more opportunities for communication EOOs. The most fertile ground for EOOs is probably email.  It is so much easier to be disrespectful to a lot of people in a short period of time by email than just about any other medium. Just failing to acknowledge an email question or request is enough.  Failing to put in the email-equivalent of a handshake of Dear <yourname> …. message …. Regards <myname>  is similar.

Omitting to communicate last minute changes in a plan is an effective way to upset people too!

And perhaps the most effective is firing a grapeshot email in the hope that one will hit the intended target. These two examples highlight a different form of disrespect: discounting someone else’s time – or more specifically their lifetime.

When we waste our time we waste a bit of our life – and we deny ourselves the opportunity to invest that finite and precious lifetime doing something more enjoyable. Time is not money. Money can be saved for later – time cannot. When we waste an hour of our lives we waste it forever.  If we do that to ourselves we are showing lack of self-respect and that is our choice – when we do it to others we create a pervasive and toxic cultural swamp.

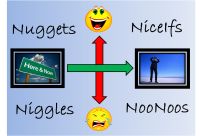
One of the first steps in the process of improvement is to engage and listen and one tool for this is The 4N Chart® – which is an emotional mapping technique. Niggles are the Negative Emotions in the Present together with their Be-Causes. The three commonest niggles that people consistently report are car parking, emails and meetings.  All three involve lifetime wasting activities. The cumulative effect is frustration and erosion of trust which drives further disrespectful behaviour. The end result is a viscous self-sustaining toxic cycle of habitual disrespect.

An effective tactic here is first to hold up the mirror and reflect back what is happening … that is respectful challenge.

The next step is to improving the processes that are linked to car parking, emails and meetings so that they are more effective and more efficient. And that means actively designing them to be more productive – by actively designing out the lifetime wasting parts.

The Pragmatist and the Three Fears

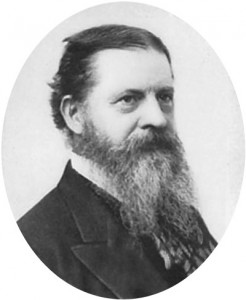
The term Pragmatist is a modern one – it was coined by Charles Sanders Pierce (1839-1914) – a 19th century American polymath and iconoclast. In plain speak he was a tree-shaker and a dogma-breaker; someone who regarded rules created by people as an opportunity for innovation rather than a source of frustration.

A tree-shaker reframes the Three Fears that block change and improvement; the Fear of Ambiguity; the Fear of Ridicule and the Fear of Failure. A tree-shaker re-channels their emotional energy from fear into innovation and exploration. They feel the fear but they do it anyway. But how do they do it?

To understand this we first need to explore how we learn to collectively suppress change by submitting to peer-fear.

In the 1960’s there was an experiment done with Rhesus monkeys that sheds light on a possible mechanism: the monkeys appeared to learn from each other by observing the emotional responses of other monkeys to threats. The story of the Five Monkeys and the Banana Experiment first appeared in a management textbook in 1996  but there is no evidence that this particular experiment was ever performed. With this in mind here is a version of the story:

Five naive monkeys were offered a banana but it required climbing a ladder to get it.  Monkeys like bananas and are good at climbing. The ladder was novel. And every time any of the monkeys started to climb the ladder all the monkeys were sprayed with cold water. Monkeys do not like cold water. It was a classic conditioning experiment and after just a few iterations the monkeys stopped trying to climb the ladder to get the banana. They had learned to fear the ladder and their natural desire for the banana was suppressed by their new fear: a learned association between climbing the ladder and the unpleasant icy shower. Next the psychologists replaced one of the monkeys with a new naive monkey – who immediately started to climb the ladder to get the banana. What happened next is interesting. The other four monkeys pulled the new monkey back. They did not want to get another cold shower. After a while the new monkey learned because his fear of social rejection was greater than his desire for the banana. He stopped trying to get the banana. This cycle was repeated four more times until all the original monkeys had been replaced. None of the five remaining monkeys had any personal experience of the cold shower – but the ladder-avoiding behaviour remained and was enforced by the group, even though the original reason for shunning the ladder was unknown.

Here is the quoted reference to the experiment on which the story is based.

Stephenson, G. R. (1967). Cultural acquisition of a specific learned response among rhesus monkeys. In: Starek, D., Schneider, R., and Kuhn, H. J. (eds.), Progress in Primatology, Stuttgart: Fischer, pp. 279-288.

So it would appear that a very special type of monkey would be needed to break a culturally enforced behavioural norm. One that is curious, creative and courageous, and one that does not fear ridicule or failure. One that is immune to peer-fear.

We could extrapolate from this story and reflect on how peer pressure might impede change and improvement in the workplace.  When well-intended, innocent, creativity and innovation are met with the emotional ice-bath of dire warnings, criticism, ridicule and cynicism then the unconfident innovator may eventually give up trying and start to believe that improvement is impossible.  The Hans Christian Anderson’s short tale of the Emporer’s New Clothes is a well known example – the one innocent child says what all the experienced adults have learned to deny. A culture of peer-fear can become self-sustaining and this change-avoiding-culture appears to be a common state of affairs in many organisations; in particular ones of an academic and bureaucratic leaning.

At the other end of the change spectrum from Bureaucracy sits Chaos. It is also resisted but the behaviour is fuelled by a different fear – the Fear of Ambiguity. We prefer the known and the predictable. We follow ingrained habits. We prevaricate even when our rationality says we should change.  We dislike the feeling of ambiguity and uncertainty because it leaves us with a sense of foreboding and dread. Change is strongly associated with confusion and we appear hard-wired to avoid it. Except that we are not. This is learned behaviour and we learned it when we were very young. As adults we reinforce it; as adults we replicate it; and as adults impose it on others – including our next generation. The generation that will inherit our world and who will look after us when we are old and frail. We will reap what we sow. But if we learned it and teach it then are we able to unlearn it and unteach it?

Enter the Pragmatists. They have learned to harness the Three Fears. Or rather they have unlearned their association of Fear with Change. Sometimes this unlearning came from a crisis – they were forced to change by external factors. Doing nothing was not an option. Sometimes their unlearning came from inspiration – they saw someone else demonstrate that other options were possible and beneficial. Sometimes their insight came by surprise – an unexpected change of perspective exposed the hidden opportunity. An eureka moment.

Whatever the route the Pragmatist discovers a new tool: a tool labelled “Heuristics”.  A heuristic is a “rule of thumb” – an empirically derived good-enough-for-now guideline. Heuristics include some uncertainty, some ambiguity and some risk. Just enough uncertainty and ambiguity to build a flexible conceptual framework that is strong enough, resilient enough and modifiable enough to facilitate learning and improvement. And with it a pinch of risk to spice the sauce – because we all like a bit of risk.

The Improvement Scientist is a Pragmatist and a Practitioner of Heuristics – both of which can be learned.

Iconoclasts and Iconoblasts

The human body is an amazing self-repairing system. It does this by being able to detect damage and to repair just the damaged part while still continuing to function. One visible example of this is how it repairs a broken bone. The skeleton is the hard, jointed framework that protects and supports the soft bits. Some of the soft bits, the muscles, both stablise and move this framework of bones. Together they form the musculoskeletal system that gives us the power to move ourselves.  So when, by accident, we break a bone how do we repair the damage?  The secret is in the microscopic structure of the bone. Bone is not like concrete, solid and inert, it is a living tissue. Two of the microsopic cells that live in the bone are the osteoclasts and the osteoblasts (osteo- is Greek for “bone”; -clast is Greek for “break” and -blast is Greek for “germ” in the sense of something that grows).  Osteoclasts dissolve the old bone and osteoblasts deposit new bone – so when they work together they can create bone, remodel bone, and repair bone. It is humbling when we consider that millions of microscopic cells are able to coordinate this continuous, dynamic, adaptive, reparative behaviour with no central command-and-control system, no decision makers, no designers, no blue-prints, no project managers. How is this biological miracle achieved? We are not sure – but we know that there must be a process.

Organisations are systems that face a similar challenge. They have relatively rigid operational and cultural structures of roles, responsibilities, lines of accountability, rules, regulations, values, beliefs, attitudes and behaviours.  These formal and informal structures are the conceptual “bones” of the organisation – the structure that enables the organisation to function.  Organisations also need to grow and to develop – which means that their virtual bones need to be remodelled continuously. Occasionally organisations have accidents – and their bones break – and sometimes the breaks are deliberate: it is called “re-structuring”.

There are people within organisations that have the same role as the osteoblast in the body. These people are called iconoclasts and what they do is dissolve dogma. They break up the rigid rules and regulations that create the corporate equivalent of concrete – but they are selective. Iconoclasts are sensitive to stress and to strain and they only dissolve the cultural concrete where it is getting in the way of improvement. That is where dogma is blocking innovation.  Iconoclasts question the status quo, and at the same time explain how it is causing a problem, offer alternatives, and predict the benefits of the innovation. Iconoclasts are not skeptics or cynics – they prepare the ground for change – they are facilitators.

There is a second group people who we could call the iconoblasts. They are the ones who create the new rules, the new designs, the new recipes, the new processes, the new operating standards – and they work alongside the iconoclasts to ensure the structure remains strong and stable as it evolves. The iconoblasts are called Improvement Scientists.

Improvement Scientists are like builders – they use the raw materials of ideas, experience, knowledge, understanding, creativity and enthusiasm and assemble them into new organisational structures.  In doing so they fully accept that one day these structures will in turn be dismantled and rebuilt. That is the way of improvement.  The dogma is relative and temporary rather than absolute and permanent. And the faster the structures can be disassembled and reassembled the more agile the organisation becomes and the more able it is to survive change.

So how are the iconoclasts and iconoblasts coordinated? Can they also work effectively and efficiently without a command-and-control system? If millions if microscopic cells in our bones can achieve it then maybe the individuals within organisations can do it too. We just need to understand what makes an iconoclast and an iconoblast and effective partnership and an essential part of an organisation.

The Skeptics, The Cynics and The Sphere of Influence

All intentional improvement implies change. Change requires deliberate action – thinking about change is not enough. Action implies control of physical objects and, despite what we might like to believe, the only things that are under our personal control are our beliefs, our attitudes, our behaviours and our actions. Everything else can only be changed through some form of indirect influence.

Our Circle of Control appears to extends only to our skin – beyond that is our Sphere of Influence – and beyond that is our Region of Concern.

Very few of us live a solitary existence as a hermit. The usual context for improvement is social and therefore to achieve improvement outside ourselves we need to influence the beliefs, attitudes, behaviours and actions of others. And we can only do that through our own behaviour and actions. We cannot do telepathy or mind-control.  And remember, we are being influenced by others – it is a two-way street.

So when we receive a push-back to our attempted change-for-the-better action, we have failed to influence in a positive sense and the intended improvement cannot happen.  Those who oppose our innovation usually belong to one of two tribes – the Skeptics and the Cynics – and they have much in common.  They both operate from a position of doubt and a belief that they are being deliberately deceived. They distrust, discount, question, analyse, critique and they challenge. They do not blindly believe our rhetoric.

This is not new. These two tribes are thousands of years old – the Ancient Greeks knew them well and gave them the names Skeptics and Cynics. They were the Lords of the Dark Ages but they survived the Renaissance and the first skeptical hypothesis in modern Western philosophy is attributed to Rene Descartes who wrote “I will suppose … that some evil demon of the utmost power and cunning has employed all his energies to deceive me.”

The two tribes present the Innovator and Improvement Scientist with a dilemma. Before action there is only rhetoric, only an idea, only a belief that better is possible. There is no evidence of improvement yet – so no reality to support the rhetoric. And if the action requires the engagement or permission of either of the two tribes then the change will not happen because it is impossible to influence their belief and behaviour without evidence. We have crashed into the wall of resistance – and the harder we push the harder they push back.  So let us conserve our energy, step back from the wall, reflect for a moment and ask “Does the wall surround us completely – or are there gaps?”

Could we find a region of the Sphere of Influence that has few or no Skeptics and Cynics? Is there a place where they do not like to live because the cultural climate is not to their taste? We have an option – we can explore the Sphere of Influence.

At one pole we discover a land called Apathy. It is a barren place where nothing changes; it is devoid of ideas and innovation; it is passionless, monotonous, stable, predictable, safe and boring.  The Skeptics and Cynics do not like it there because there is none of their favourite food – Innovator Passion – which is where they derive their energy and their sport.

At the other pole we discover a land called Assertion – and we discover that the Skeptics and Cynics do not like it there either but for a different reason. In Assertion there is abundant passion and innovation, but also experimentation and reflection and the ideas are fewer but come packaged with a tough shell of hard evidence. This makes them much less palatable to the Skeptics because  they have to chew hard for little gain. The Cynics shun the place.

At the end of our journey we have learned that the two tribes prefer to live in the temperate zone between Apathy and Assertion where there is an abundant supply of innocent, passionate, innovators with new ideas and no evidence. The Skeptics and Cynics frustrate the inexperienced Innovators who become inflamed with passion which is what the two tribes feed on, and when finally exhausted the Innovators fall easy prey to the Cynics – who convert and enslave them. It is a veritable feeding frenzy – and the ultimate casuality is improvement.

So what is the difference between the Skeptics and the Cynics?

Despite their behaviour the Skeptics do care – they are careful. They are the guardians of stability and their opinion is respected because they help to keep the Sphere safe. They are willing to be convinced – but they want explanation and evidence. Rhetoric is not enough.

The Cynics follow a different creed. Their name derives from the Greek for dog and it is not a term of endearment. They have lost their dreams. They blame others for it and their goal is vengeance. They are remorseless, and shameless. They shun social norms and reasonable behaviour and they are not respected by others. They do not care. They are indifferent.

So the wise Improvement Scientist needs to be able to distinguish the Skeptics from the Cynics – and to learn to value the strengths of the Skeptics and to avoid the Cynics. The deal they negotiate with the Skeptics is: “In return for a steady supply of ideas and enthusiasm we ask only for an explanation of the rejections”. It is a fair trade. The careful and considered feedback of the Skeptics is valuable to the Improvement Scientist because it helps to sharpen the idea and harden the shell of evidence. Once the Innovator, Improvement Scientist and the Skeptic have finished their work any ideas that have survived the digestive process are worthy of investment.  It is a a win-win-win arrangement – everyone gets what they want.

The Cynics scavenge the scraps. And that is OK – it is their choice.


Productivity Improvement Science

Very often there is a requirement to improve the productivity of a process and operational managers are usually measured and rewarded for how well they do that. Their primary focus is neither safety nor quality – it is productivity – because that is their job.

For-profit organisations see improved productivity as a path to increased profit. Not-for-profit organisations see improved productivity as a path to being able to grow through re-investment of savings.  The goal may be different but the path is the same – productivity improvement.

First we need to define what we mean by productivity: it is the ratio of a system output to a system input. There are many input and output metrics to choose from and a convenient one to use is the ratio of revenue to expenses for a defined period of time.  Any change that increases this ratio represents an improvement in productivity on this purely financial dimension and we know that this financial data is measured. We just need to look at the bank statement.

There are two ways to approach productivity improvement: by considering the forces that help productivity and the forces that hinder it. This force-field metaphor was described by the psychologist Kurt Lewin (1890-1947) and has been developed and applied extensively and successfully in many organisations and many scenarios in the context of change management.

Improvement results from either strengthening helpers or weakening hinderers or both – and experience shows that it is often quicker and easier to focus attention on the hinderers because that leads to both more improvement and to less stress in the system. Usually it is just a matter of alignment. Two strong forces in opposition results in high stress and low motion; but in alignment creates low stress and high acceleration.

So what hinders productivity?

Well, anything that reduces or delays workflow will reduce or delay revenue and therefore hinder productivity. Anything that increases resource requirement will increase cost and therefore hinder productivity. So looking for something that causes both and either removing or realigning it will have a Win-Win impact on productivity!

A common factor that reduces and delays workflow is the design of the process – in particular a design that has a lot of sequential steps performed by different people in different departments. The handoffs between the steps are a rich source of time-traps and bottlenecks and these both delay and limit the flow.  A common factor that increases resource requirement is making mistakes because errors generate extra work – to detect and to correct.  And there is a link between fragmentation and errors: in a multi-step process there are more opportunities for errors – particularly at the handoffs between steps.

So the most useful way to improve the productivity of a process is to simplify it by combining several, small, separate steps into single large ones.

A good example of this can be found in healthcare – and specifically in the outpatient department.

Traditionally visits to outpatients are defined as “new” – which implies the first visit for a particular problem – and “review” which implies the second and subsequent visits.  The first phase is the diagnostic work and this often requires special tests or investigations to be performed (such as blood tests, imaging, etc) which are usually done by different departments using specialised equipment and skills. The design of departmental work schedules requires a patient to visit on a separate occasion to a different department for each test. Each of these separate visits incurs a delay and a risk of a number of errors – the commonest of which is a failure to attend for the test on the appointed day and time. Such did-not-attend or DNA rates are surprisingly high – and values of 10% are typical in the NHS.

The cumulative productivity hindering effect of this multi-visit diagnostic process design is large.  Suppose there are three steps: New-Test-Review and each step has a 10% DNA rate and a 4 week wait. The quickest that a patient could complete the process is 12 weeks and the chance of getting through right first time (the yield) is about 90% x 90% x 90% = 73% which implies that 27% extra resource is needed to correct the failures.  Most attempts to improve productivity focus on forcing down the DNA rate – usually with limited success. A more effective approach is to redesign process by combining the three New-Test-Review steps into one visit.  Exactly the same resources are needed to do the work as before but now the minimum time would be 4 weeks, the right-first-time yield would increase to 90% and the extra resources required to manage the two handoffs, the two queues, and the two sources of DNAs would be unnecessary.  The result is a significant improvement in productivity at no cost.  It is also an improvement in the quality of the patient experience but that is a unintended bonus.

So if the solution is that obvious and that beneficial then why are we not doing this everywhere? The answer is that we do in some areas – in particular where quality and urgency is important such as fast-track one-stop clinics for suspected cancer. However – we are not doing it as widely as we could and one reason for that is a hidden hinderer: the way that the productivity is estimated in the business case and measured in the the day-to-day business.

Typically process productivity is estimated using the calculated unit price of the product or service. The unit price is arrived at by adding up the unit costs of the steps and adding an allocation of the overhead costs (how overhead is allocated is subject to a lot of heated debate by accountants!). The unit price is then multiplied by expected activity to get expected revenue and divided by the total cost (or budget) to get the productivity measure.  This approach is widely taught and used and is certainly better than guessing but it has a number of drawbacks. Firstly, it does not take into account the effects of the handoffs and the queues between the steps and secondly it drives step-optimisation behaviour. A departmental operational manager who is responsible and accountable for one step in the process will focus their attention on driving down costs and pushing up utilisation of their step because that is what they are performance managed on. This in itself is not wrong – but it can become counter-productive when it is done in isolation and independently of the other steps in the process.  Unfortunately our traditional management accounting methods do not prevent this unintentional productivity hindering behaviour – and very often they actually promote it – literally!

This insight is not new – it has been recognised by some for a long time – so we might ask ourselves why this is still the case? This is a very good question that opens another “can of worms” which for the sake of brevity will be deferred to a later conversation.

So, when applying Improvement Science in the domain of financial productivity improvement then the design of both the process and of the productivity modelling-and-monitoring method may need addressing at the same time.  Unfortunately this does not seem to be common knowledge and this insight may explain why productivity improvements do not happen more often – especially in publically funded not-for-profit service organisations such as the NHS.

Pruning the Niggle Tree

Sometimes our daily existence feels like a perpetual struggle between two opposing forces: the positive force of innovation, learning, progress and success; and the opposing force of cynicism, complacency, stagnation and failure.  Often the balance-of-opposing-forces is so close that even small differences of opinion can derail us – especially if they are persistent. And we want to stay on course to improvement.

Niggles are the irritating things that happen every day. Day after day. Niggles are persistent. So when we are in our “ying-yang” equilibrium and “balanced on the edge” then just one extra niggle can push us off our emotional tight-rope. And we know it. The final straw!

So to keep ourselves on track to success we need to “nail” niggles.  But which ones? There seem to be so many! Where do we start?

If we recorded just one day and from that we listed all the positive things that happened on green PostIt® notes and all the negatives things on red ones – then we would be left with a random-looking pile of red and green notes. Good days would have more green, and bad days would have more red – and all days would have both. And that is just the way it is. Yes? But are they actually random? Is there a deeper connection?

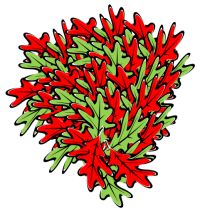
Experience teaches us that when we Investigate-a-Niggle we find it is connected to other niggles. The “cannot find a parking place” niggle is because of the “car park is full” niggle which also causes the “someone arrived late for my important meeting” niggle. The red leaf is attached to a red twig which in turn sprouts other red leaves. The red leaves connect to other red leaves; not to green ones.

If we tug on a green leaf – a Nugget – we find that it too is connected to other nuggets. The “congratulations on a job well done” nugget is connected to the the “feedback is important” nugget from which sprouts the “opportunities for learning” nugget. Our green leaf is attached, indirectly, to many other green leaves; not to red ones.

It seems that our red leaves (niggles) and our green leaves (nuggets) are connected – but not directly to each other. It is as if we have two separate but tightly intertwined plants competing with each other for space and light. So if we want a tree that is more green than red and if we want to progress steadily in the direction of sustained improvement – then we need to prune the niggle tree (red leaves) and leave the nugget tree (green leaves) unscathed.

The problem is that if we just cut off one or two red leaves new ones sprout quickly from the red twigs to replace them. We quickly learn that this apprach is futile. We suspect that if we were able to cut all the red leaves off at once then the niggle tree might shrivel and die – but that looks impossible. We need to be creative and we need to search deeper. With the  knowledge that the red-leaves are part of one tree and we can remove multiple red leaves in one snip by working our way back from the leaves, up the red twigs and to the red branches. If we prune far enough back then we can expect a large number of interconnected red leaves to wither and fall off – leaving the healthy green leaves more space and more light to grow on that part of the tree.

Improvement Science is about pruning the Niggle tree to make space for the Nugget tree to grow. It is about creating an environment for the Green shoots of innovation to sprout.  Most resistance comes from those who feed on the Red leaves – the Cynics – and if we remove enough red branches then they will go hungry. And now the Cynics have a choice: learn to taste and appreciate the Green leaves or “find another tree”.

We want a Greener tree- with fewer poisonous Red leaves on it.

All Aboard for the Ride of Our Lives!

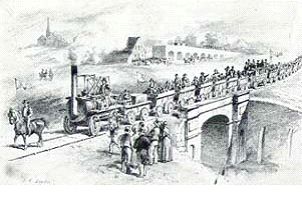
In 1825 the world changed when the Age of Rail was born with the opening of the Darlington-to-Stockton line and the demonstration that a self-powered mobile steam engine could pull more trucks of coal than a team of horses.

This launched the industrial revolution into a new phase by improving the capability to transport heavy loads over long distances more conveniently, reliably, quickly, and cheaply than could canals or roads.

Within 25 years the country was criss-crossed by thousands of miles of railway track and thousands more miles were rapidly spreading across the world. We take it for granted now but this almost overnight success was the result of over 100 years of painful innovation and improvement. Iron rail tracks had been in use for a long time – particularly in quarries and ports. Newcomen’s atmospheric steam engine had been pumping water out of mines since 1712; James Watt and Matthew Boulton had patented their improved separate condenser static steam engine in 1775; and Richard Trevethick had built a self-propelled high pressure steam engine called “Puffing Devil” in 1801. So why did it take so long for the idea to take off? The answer was quite simple – it needed the lure of big profits to attract the entrepreneurs who had the necessary influence and cash to make it happen at scale and pace.  The replacement of windmills and watermills by static steam engines had already allowed factories to be built anywhere – rather than limiting them to the tops of windy hills and the sides of fast flowing rivers. But it was not until the industrial revolution had achieved sufficient momentum that road and canal transport became a serious constraint to further growth of industry, wealth and the British Empire.

But not everyone was happy with the impact that mechanisation brought – the Luddites were the skilled craftsmen who opposed the use of mechanised looms that could be operated by lower-skilled and therefore cheaper labour.  They were crushed in 1812 by political forces more powerful than they were – and the term “luddite” is now used for anyone who blindly opposes change from a position self-protection.

Only 140 years later it was all over for the birthplace of the Rail Age – the steam locomotive was relegated to the museums when Dr Richard Beeching , the efficiency-focussed Technical Director of ICI, published his reports that led to the cost-improvement-programme (CIP) that reorganised the railways and led to the loss of 70,000 jobs, hundreds of small “unprofitable” stations and 1000’s of miles of track.  And the reason for the collapse of the railways was that roads had leap-frogged both canals and railways because the “internal combustion engine” proved a smaller, lighter, more powerful, cheaper and more flexible alternative to steam or horses.

It is of historical interest that Henry Ford developed the production line to mass produce automobiles at a price that a factory worker could afford – and Toyoda invented a self-stopping mechanised loom that improved productivity dramatically by preventing damaged cloth being produced if a thread broke by accident. The historical links come together because Toyoda sold the patents to his self-stopping loom to fund the creation of the Toyota Motor Company which used Henry Ford’s production-line design and integrated the Toyoda self-monitoring, stopping and continuous improvement philosophy.

It was not until twenty years after British Rail was created that Japan emerged as an industrial superpower by demonstrating that it had learned how to improve both quality and reduce cost much more effectively than the “complacent” Europe and America. The tables were turned and this time it was the West that had to learn – and quickly.  Unfortunately not quickly enough. Other developing countries seized the opportunity that mass mechanisation, customisation and a large, low-expectation, low-cost workforce offered. They now produce manufactured goods at prices that European and American companies cannot compete with. Made in Britain has become Made in China.

The lesson of history has been repeated many times – innovations are like seeds that germinate but do not disseminate until the context is just right – then they grow, flower, seed and spread – and are themselves eventually relegated to museums by the innovations that they spawned.

Improvement Science has been in existence for a long time in various forms, and it is now finding more favourable soil to grow as traditional reactive and incremental improvement methods run out of steam when confronted with complex system problems. Wicked problems such as a world population that is growing larger and older at the same time as our reserves of non-renewable natural resources are dwindling.

The promise that Improvement Science offers is the ability to avoid the boom-to-bust economic roller-coaster that devastates communities twice – on the rise and again on the fall. Improvement Science offers an approach that allows sensible and sustainable changes to be planned, implemented and then progressively improved.

So what do we want to do? Watch from the sidelines and hope, or leap aboard and help?

And remember what happened to the Luddites!

Negotiate, Negotiate, Negotiate.

One of the most important skills that an Improvement Scientist needs is the ability to negotiate.  We are all familiar with one form of negotiaton which is called distributive negotiation which is where the parties carve up the pie in a low trust compromise. That is not the form we need – what we need is called integrative negotiation. The goal of integrative negotiation is to join several parts into a greater whole and it implies a higher level of trust and a greater degree of collaboration.

Organisations of more than about 90 people are usually split into departments – and for good reasons. The complex organisation requires specialist aptitudes, skills, and know-how and it is easier to group people together who share the specialist skills needed to deliver that service to the organisation – such as financial services in the accounts department.  The problem is that this division also creates barriers and as the organisation increases in size these barriers have a cumulative effect that can severely limit the capability of the organisation.  The mantra that is often associated with this problem is “communication, communication, communication” … which is too non-specific and therefore usually ineffective.

The products and services that an organisation is designed to deliver are rarely the output of one department – so the parts need to align and to integrate to create an effective and efficient delivery system. This requires more than just communication – it requires integrative negotiation – and it is not a natural skill or one that is easy to develop. It requires investment of effort and time.

To facilitate the process we need to provide three things: a common goal, a common language and a common ground.  The common goal is what all parts of the system are aligned to; the common language is how the dialog is communicated; and the common ground is our launch pad.

Integrative negotiation starts with finding the common ground – the areas of agreement. Very often these are taken for granted because we are psychologically tuned to notice differences rather than similarities. We have to make the “assumed” and “obvious” explicit before we turn our attention on our differences.

Integrative negoation proceeds with defining the common niggles and nice-ifs that could be resolved by a single change; the win-win-win opportunities.

Integrative negotiation concludes with identifying changes that are wholly within the circle of influence of the parties involved – the changes that they have the power to make individually and collectively.

After negotiation comes decision and after decision comes action and that is when improvement happens.

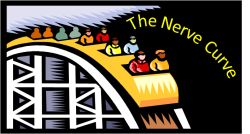
The Nerve Curve

The Nerve Curve is the emotional roller-coaster ride that everyone who engages in Improvement needs to become confident to step onto.

Just like a theme park ride it has ups and downs, twists and turns, surprises and challenges, an element of danger and a splash of excitement.  If it did not have all of those components then it would not be fun and there would not be queues of people wanting to ride, again and again.  And the reason that theme parks are so successful is because their rides have been very carefully designed – to be challenging, exciting, fun and safe – all at the same time.

So, when we challenge others to step aboard our Improvement Nerve Curve then we need to ensure that our ride is safe – and to do that we need to understand where the emotional dangers lurk, to actively point them out and then avoid them.

A big danger hides right at the start.  To get aboard the Nerve Curve we have to ask questions that expose the Elephant-in-the-Room issues.  Everyone knows they are there – but no one wants to talk about them.   The biggest one is called Distrust – which is wrapped up in all sorts of different ways and inside the nut is the  Kernel of Cynicism.  The inexperienced improvement facilitator may blunder straight into this trap just by using one small word … the word “Why”?  Arrrrrgh!  Kaboom!  Splat!  Game Over.

The “Why” question is like throwing a match into a barrel of emotional gunpowder – because it is interpreted as “What is your purpose?” and in a low-trust climate no one will want to reveal what their real purpose or intention is.  They have learned from experience to keep their cards close to their chest – it is safer to keep agendas hidden.

A much safer question is “What?”  What are the facts?  What are the effects? What are the causes? What works well? What does not? What do we want? What don’t we want? What are the constraints? What are our change options? What would each deliver? What are everyone’s views?  What is our decision?  What is our first action? What is the deadline?

Sticking to the “What” question helps to avoid everyone diving for the Political Panic Button and pulling the Emotional Emergency Brake before we have even got started.

The first part of the ride is the “Awful Reality Slope” that swoops us down into “Painful Awareness Canyon” which is the emotional low-point of the ride.  This is where the elephants-in-the-room roam for all to see and where passengers realise that, once the issues are in plain view, there is no way back.

The next danger is at the far end of the Canyon and is called the Black Chasm of Ignorance and the roller-coaster track goes right to the edge of it.  Arrrgh – we are going over the edge of the cliff – quick grab the Wilful Blindness Goggles and Denial Bag from under the seat, apply the Blunder Onwards Blind Fold and the Hope-for-the-Best Smoke Hood.

So, before our carriage reaches the Black Chasm we need to switch on the headlights to reveal the Bridge of How:  The structure and sequence that spans the chasm and that is copiously illuminated with stories from those who have gone before.  The first part is steep though and the climb is hard work.  Our carriage clanks and groans and it seems to take forever but at the top we are rewarded by a New Perspective and the exhilarating ride down into the Plateau of Understanding where we stop to reflect and to celebrate our success.

Here we disembark and discover the Forest of Opportunity which conceals many more Nerve Curves going off in all directions – rides that we can board when we feel ready for a new challenge.  There is danger lurking here too though – hidden in the Forest is Complacency Swamp – which looks innocent except that the Bridge of How is hidden from view.   Here we can get lured by the pungent perfume of Power and the addictive aroma of Arrogance and we can become too comfortable in the Zone.   As we snooze in the Hammock of Calm from we do not notice that the world around us is changing.  In reality we are slipping backwards into Blissful Ignorance and we do not notice – until we suddenly find ourselves in an unfamiliar Canyon of Painful Awareness.  Ouch!

Being forewarned is our best defense.  So, while we are encouraged to explore the Forest of Opportunity,  we learn that we must also return regularly to the Plateau of Understanding to don the Habit of Humility.  We must  regularly refresh ourselves from the Fountain of New Knowledge by showing others what we have learned and learning from them in return.  And when we start to crave more excitement we can board another Nerve Curve to a new Plateau of Understanding.

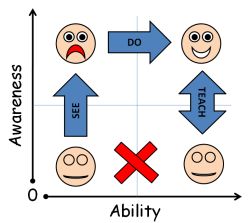
The Safety Harness of our Improvement journey is called See-Do-Teach and the most important part is Teach.  Our educators need to have more than just a knowledge of how-to-do, they also need to have enough understanding to be able to explore the why-to -do. The Quest for Purpose.

To convince others to get onboard the Nerve Curve we must be able to explain why the Issues still exist and why the current methods are not sufficient.  Those who have been on the ride are the only ones who are credible because they understand.  They have learned by doing.

And that understanding grows with practice and it grows more quickly when we take on the challenge of learning how to explore purpose and explain why.  This is Nerve Curve II.

All aboard for the greatest ride of all.

Knowledge and Understanding

Knowledge is not the same as Understanding.

We all know that the sun rises in the East and sets in the West; most of us know that the oceans have a twice-a-day tidal cycle and some of us know that these tides also have a monthly cycle that is associated with the phase of the moon. We know all of this just from taking notice; remembering what we see; and being able to recognise the patterns. We use this knowledge to make reliable predictions of the future times and heights of the tides; and we can do all of this without any understanding of how tides are caused.

Our lack of understanding means that we can only describe what has happened. We cannot explain how it happened. We cannot extract meaning – the why it happened.

People have observed and described the movements of the sun, sea, moon, and stars for millennia and a few could even predict them with surprising accuracy – but it was not until the 17th century that we began to understand what caused the tides. Isaac Newton developed enough of an understanding to explain how it worked and he did it using a new concept called gravity and a new tool called calculus.  He then used this understanding to explain a lot of other unexplained things and suddenly the Universe started to make a lot more sense to everyone. Nowadays we teach this knowledge at school and we take it for granted. We assume it is obvious and it is not. We are no smarter now that people in the 17th Century – we just have a deeper understanding (of physics).

Understanding enables things that have not been observed or described to be predicted and explained. Understanding is necessary if we want to make rational and reliable decisions that will lead to changes for the better in a changing world.

So, how can we test if we only know what to do or if we actually understand what to do?

If we understand then we can demonstrate the application of our knowledge by solving old and new problems effectively and we can explain how we do it.  If we do not understand then we may still be able to apply our knowledge to old problems but we do not solve new problems effectively or efficiently and we are not able to explain why.

But we do not want the risk of making a mistake in order to test if we have and understanding-gap so how can we find out? What we look for is the tell-tale sign of an excess of knowledge and a dearth of understanding – and it has a name – it is called “bureaucracy”.

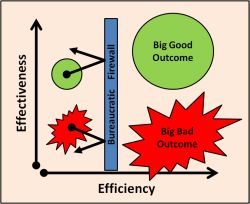
Suppose we have a system where the decisions-makers do not make effective decisions when faced with new challenges – which means that their decisions lead to unintended adverse outcomes. It does not take very long for the system to know that the decision process is ineffective – so to protect itself the system reacts by creating bureaucracy – a sort of organisational damage-limitation circle of sand-bags that limit the negative consequences of the poor decisions. A bureaucratic firewall so to speak.

Unfortunately, while bureaucracy is effective it is non-specific, it uses up resources and it slows everything down. Bureaucracy is inefficiency. What we get as a result is a system that costs more and appears to do less and that is resistant to any change – not just poor decisions – it slows down good ones too.

The bureaucratic barrier is important though; doing less bad stuff is actually a reasonable survival strategy – until the cost of the bureaucracy threatens the systems viability. Then it becomes a liability.

So what happens when a last-saloon-in-town “efficiency” drive is started in desperation and the “bureaucratic red tape” is slashed? The poor decisions that the red tape was ensnaring are free to spread virally and when implemented they create a big-bang unintended adverse consequence! The safety and quality performance of the system drops sharply and that triggers the reflex “we-told-you-so” and rapid re-introduction of the red-tape, plus some extra to prevent it happening again.  The system learns from its experience and concludes that “higher quality always costs more” and “don’t trust our decision-makers” and “the only way to avoid a bad decision is not to make/or/implement any decisions” and to “the safest way to maintain quality is to add extra checks and increased the price”. The system then remembers this new knowledge for future reference; the bureaucratic concrete sets hard; and the whole cycle repeats itself. Ad infinitum.

So, with this clearer insight into the value of bureaucracy and its root cause we can now design an alternative system: to develop knowledge into understanding and by that route to improve our capability to make better decisions that lead to predictable, reliable, demonstrable and explainable benefits for everyone. When we do that the non-specific bureaucracy is seen to impede progress so it makes sense to dismantle the bits that block improvement – and keep the bits that block poor decisions and that maintain performance. We now get improved quality and lower costs at the same time, quickly, predictably and without taking big risks, and we can reinvest what we have saved in making making further improvements and developing more knowledge, a deeper understanding and wiser decisions. Ad infinitum.

The primary focus of Improvement Science is to expand understanding – our ability to decide what to do, and what not to; where and where not to; and when and when not to – and to be able to explain and to demonstrate the “how” and to some extent the “why”.

One proven method is to See, then to Do, and then to Teach. And when we try that we discover to our surprise that the person whose understanding increases the most is the teacher!  Which is good because the deeper the teachers understanding the more flaxible, adaptable and open to new learning they become.  Education and bureaucracy are poor partners.

Cause and Effect

Breaking News: Scientists have discovered that people with yellow teeth are more likely to die of lung cancer. Patient-groups and dentists are now calling for tooth-whitening to be made freely available to everyone.”

Does anything about this statement strike you as illogical? Surely it is obvious. Having yellow teeth does not cause lung cancer – smoking causes both yellow teeth and lung cancer!  Providing a tax-funded tooth-whitening service will be futile – banning smoking is the way to reduce deaths from lung cancer!

What is wrong here? Do we have a problem with mad scientists, misuse of statistics or manipulative journalists? Or all three?

Unfortunately, while we may believe that smoking causes both yellow teeth and lung cancer it is surprisingly difficult to prove it – even when sane scientists use the correct statistics and their results are accurately reported by trustworthy journalists.  It is not easy to prove causality.  So we just assume it.

We all do this many times every day – we infer causality from our experience of interacting with the real world – and it is our innate ability to do that which allows us to say that the opening statement does not feel right.  And we do this effortlessly and unconsciously.

We then use our inferred-causality for three purposes. Firstly, we use it to explain how past actions led to the present situation. The chain of cause-and-effect. Secondly, we use it to create options in the present – our choices of actions. Thirdly, we use it to predict the outcome of our chosen action – we set our expectation and then compare the outcome with our prediction. If outcome is better than we expected then we feel good, if it is worse then we feel bad.

What we are doing naturally and effortlessly is called “causal modelling”. And it is an impressive skill. It is the skill needed to solve problems by designing ways around them.

Unfortunately – the ability to build and use a causal model does not guarantee that our model is a valid, complete or accurate representation of reality. Our model may be imperfect and we may not be aware of it.  This raises two questions: “How could two people end up with different causal models when they are experiencing the same reality?” and “How do we prove if either is correct and if so, which it is?”

The issue here is that no two people can perceive reality exactly the same way – we each have an unique perspective – and it is an inevitable source of variation.

We also tend to assume that what-we-perceive-is-the-truth so if someone expresses a different view of reality then we habitually jump to the conclusion that they are “wrong” and we are “right”.  This unconscious assumption of our own rightness extends to our causal models as well. If someone else believes a different explanation of how we got to where we are, what our choices are and what effect we might expect from a particular action then there is almost endless opportunity for disagreement!

Fortunately our different perceptions agree enough to create common ground which allows us to co-exist reasonably amicably.  But, then we take the common ground for granted, it slips from our awareness, and we then magnify the molehills of disagreement into mountains of discontent.  It is the way our caveman wetware works. It is part of the human condition.

So, if our goal is improvement, then we need to consider a more effective approach: which is to assume that all our causal models are approximate and that they are all works-in-progress. This implies that each of us has two challenges: first to develop a valid causal model by testing it against reality through experimentation; and second to assist the collective development of a common causal model by sharing our individual understanding through explanation and demonstration.

The problem we then encounter is that statistical analysis of historical data cannot answer questions of causality – it is necessary but it is not sufficient – and because it is insufficient it does not make common-sense.  For example, there may well be a statistically significant association between “yellow teeth” and “lung cancer” and “premature death” but knowing those facts is not enough to help us create a valid cause-and-effect model that we then use to make wiser choices of more effective actions that cause us to live longer.

Learning how to make wiser choices that lead to better outcomes is what Improvement Science is all about – and we need more than statistics – we need to learn how to collectively create, test and employ causal models.

And that has another name – is called common sense.

Resistance to Change

Many people who are passionate about improvement become frustrated when they encounter resistance-to-change.

It does not matter what sort of improvement is desired – safety, delivery, quality, costs, revenue, productivity or all of them.

The natural and intuitive reaction to meeting resistance is to push harder – and our experience of the physical world has taught us that if we apply enough pressure at the right place then resistance will be overcome and we will move forward.

Unfortunately we sometimes discover that we are pushing against an immovable object and even our maximum effort is futile – so we give up and label it as “impossible”.

Much of Improvement Science appears counter-intuitive at first sight and the challenge of resistance is no different.  The counter-intuitive response to feeling resistance is to pull back, and that is exactly what works better. But why does it work better? Isn’t that just giving up and giving in? How can that be better?

To explain the rationale it is necessary to examine the nature of resistance more closely.

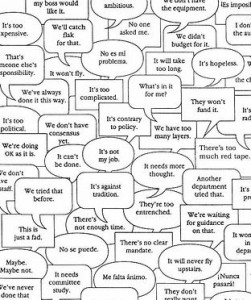
Resistance to change is an emotional reaction to an unconsciously perceived threat that is translated into a conscious decision, action and justification: the response. The range of verbal responses is large, as illustrated in the caption, and the range of non-verbal responses is just as large.  Attempting to deflect or defuse all of them is impractical, ineffective and leads to a feeling of frustration and futility.

This negative emotional reaction we call resistance is non-specific because that is how our emotions work – and it is triggered as much by the way the change is presented as by what the change is.

Many change “experts” recommend  the better method of “driving” change is selling-versus-telling and recommend learning psycho-manipulation techniques to achieve it – close-the-deal sales training for example. Unfortunately this strategy can create a psychological “arms race” which can escalate just as quickly and lead to the same outcome: an  emotional battle and psychological casualties. This outcome is often given the generic label of “stress”.

An alternative approach is to regard resistance behaviour as multi-factorial and one model separates the non-specific resistance response into separate categories: Why DoDon’t Do – Can’t Do – Won’t Do.

The Why Do response is valuable feedback because is says “we do not understand the purpose of the proposed change” and it is not unusual for proposals to be purposeless. This is sometimes called “meddling”.  This is fear of the unknown.

The Don’t Do  is valuable feedback that is saying “there is a risk with this proposed change – an unintended negative consequence that may be greater than the intended positive outcome“.  Often it is very hard to explain this NoNo reaction because it is the output of an unconscious thought process that operates out of awareness. It just doesn’t feel good. And some people are better at spotting the risks – they prefer to wear the Black Hat – they are called skeptics.  This is fear of failure.

The Can’t Do is also valuable feedback that is saying “we get the purpose and we can see the problem and the benefit of a change – we just cannot see the path that links the two because it is blocked by something.” This reaction is often triggered by an unconscious recognition that some form of collaborative working will be required but the cultural context is low on respect and trust. It can also just be a manifestation of a knowledge, skill or experience gap – the “I don’t know how to do” gap. Some people habitually adopt the Victim role – most are genuine and do not know how.

The Won’t Do response is also valuable feedback that is saying “we can see the purpose, the problem, the benefit, and the path but we won’t do it because we don’t trust you“. This reaction is common in a low-trust culture where manipulation, bullying and game playing is the observed and expected behaviour. The role being adopted here is the Persecutor role – and the psychological discount is caring for others. Persecutors lack empathy.

The common theme here is that all resistance-to-change responses represent valuable feedback and explains why the better reaction to resistance is to stop talking and start listening because to make progress will require using the feedback to diagnose what components or resistance are present. This is necessary because each category requires a different approach.

For example Why Do requires making the both problem and the purpose explicit; Don’t Do requires exploring the fear and bringing to awareness what is fuelling it; Can’t Do requires searching for the skill gaps and filling them; and Won’t Do requires identifying the trust-eroding beliefs, attitudes and behaviours and making it safe to talk about them.

Resistance-to-change is generalised as a threat when in reality it represents an opportunity to learn and to improve – which is what Improvement Science is all about.

Building a Big Picture from the Small Bits

We are all a small piece of a complex system that extends well beyond the boundaries of our individual experience.

We all know this.

We also know that seeing the big picture is very helpful because it gives us context, meaning and leads to better decisions more effective actions.

We feel better when we know where we fit into the Big Picture – and we feel miserable when we do not.

And when our system is not working as well as we would like then we need to improve it; and to do that we need to understand how it works so that we only change what we need to.

To do that we need to see the Big Picture and to understand it.


So how do we build the Big Picture from the Small Bits?

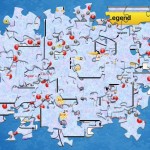
Solving a jigsaw puzzle is a good metaphor for the collective challenge we face. Each of us holds a piece which we know very well because it is what we see, hear, touch, smell and taste every day. But how do we assemble the pieces so that we can all clearly see and appreciate the whole rather than dimly perceive a dysfunctional heap of bits?
One strategy is to look for tell-tale features that indicate where a piece might fit – irrespective of the unique picture on it. Such as the four corners.

We also use this method to group pieces that belong on the sides – but this is not enough  to tell us which side and where on which side each piece fits.

So far all we have are some groups of bits – rough parts of the whole – but no clear view of the picture. To see that we need to look at the detail – the uniqueness of each piece.


Our next strategy is to look at the shapes of the edges to find the pieces that are complementary – that leave no gaps when fitted together. These are our potential neighbours. Sometimes there is only one bit that fits, sometimes there are many that fit well enough.


Our third strategy is to look at the patterns on the potential neighbours and to check for continuity because the picture should flow across the boundary – and a mismatch means we have made an error.
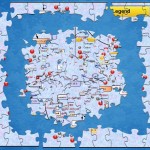
 What we have now is the edges of the picture and a heap of bits that go somewhere in the middle.

By connecting the edge-pieces we can see that there are gaps and this is an important insight.

It is not until we have a framework that spans the whole picture that the gaps become obvious.

But we do not know yet if our missing pieces are in the heap or not – we will not know that until we have solved the jigsaw puzzle.


Throughout the problem-dissolving process we are using three levels of content:
Data that we gain through our senses, in this case our visual system;
Information which is the result of using context to classify the data – shape and colour for example; and
Knowlege which we derive from past experience to help us make decisions – “That is a top-left corner so it goes there; that is an edge so it goes in that group; that edge matches that one so they might be neighbours and I will try fitting them together; the picture does not flow so they cannot be neighbours and I must separate them”.

The important point is that we do not need to Understand the picture to do this – we can just use “dumb” pattern-matching techniques, simple logic and brute force to decide which bits go together and which do not. A computer could do it – and we or the computer can solve the puzzle and still not recognise what we are looking at, understand what it means, or be able to make a wise decision.


To do that we need to search for meaning – and that usually means looking for and recognising symbols that are labels for concepts and using the picture to reveal how they relate to each other.

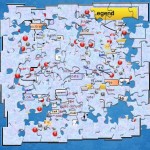
As we fit the neighbours together we see words and phrases that we may recognise – “Legend” and “cycle” for example (click the picture to enlarge)  – and we can use these labels to start to build a conceptual framework, and from that we create an expectation. Just as we did with the corners and edges.

The word “cycle” implies a circle, which is often drawn as a curved line, so we can use this expectation to look for pieces of a circle and lay them out – just as we did with the edges.

We may not recognise all the symbols – “citric acid” for example – and that finding means that there is new knowledge hidden in the picture. By the end we may understand what those new symbols mean from the context that the Big Picture creates.

By searching for meaning we are doing more than mechanically completing a task – we are learning, expanding our knowledge and deepening our understanding.

But to do this we need to separate the heap of bits so they do not obscure each other and so we can see each clearly. When it is a mess the new learning and deeper understanding will elude us.
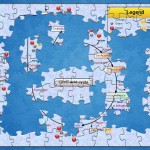
We have now found some pieces with lines on that look like parts of a circle, so we can arrange them into an approximate sequence – and when we do that we are delighted to find that the pieces fit together, the pictures flow from one to the other, and there is a sense of order and structure starting to emerge from within the picture itself.

Until now the only structure we saw was the artificial and meaningless boundary.  We now see a new and unfamiliar phrase “citric acid cycle” – what is that? Our curiosity is building.
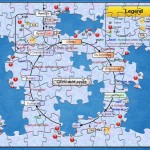
As we progress we find repeated symbols that we now recognise but do not understand – red and gray circles linked together. In the top right under the word “Legend” we see the same symbols together with some we do recognise – “hydrogen, carbon and oxygen”.

Ah ha! Now we can translate the unfamiliar symbols into familiar concepts, and now we suspect that this is something to do with chemistry. But what?
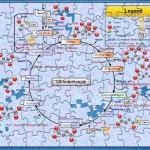
We are nearly there.  Almost all the pieces are in place and we have identified where the last few fit.

Now we can see that all the pieces are from the same jigsaw, there are none missing and there are no damaged, distorted, or duplicated pieces. The Big Picture looks complete.

We can see that the lines between the pieces are not part of the picture – they are artificial boundaries created when the picture was broken into parts – and useful only for helping us to re-assemble the big picture.

Now they are getting in the way – they are distracting us from seeing the picture as clearly as we could – so we can dispense with them – they have served their purpose.

We can also see that the pieces appear to be arranged in columns and rows – and we could view our picture as a set of interlocked vertical stripes or as a set of interlocked horizontal strips – but that this is an artificial structure created by our artificial boundaries. The picture we are seeing transcends our artificial linear decomposition.
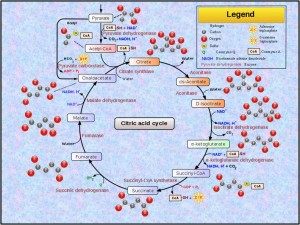
We erase all the artificial boundaries and the full picture emerges.

Now we can see that we have a chemical system where a series of reactions are linked in a cycle – and we can see something called pyruvate coming in top left and we recognise the symbols water and CO2 and we conclude that this might be part of the complex biochemical system that is called cellular respiration – the process by which the food that we eat and the oxygen we breathe is converted into energy and the CO2 that we breathe out.

Wow!

And we can see that this is just part of a bigger map – the edges were also artificial and arbitrary! But where does the oxygen fit? And which bit is the energy? And what is the link between the carbohydrate that we eat and this new thing called pyruvate?

Our bigger picture and deeper understanding has generated a lot of new questions, there is so much more to explore, to learn and to understand!!


Let us stop and reflect. What have we learned?

We have learned that our piece was not just one of a random heap of unconnected jigsaw bits; we have learned where our piece fits into a Bigger Picture; we have learned how our piece is an essential part of that picture; we have learned that there is a design in the picture and we have learned how we are part of that design.

And when we all know and we all understand the whole design and how it works then we all have a much better chance of being able to improve it in a rational, sensible, explainable and actionable way.

Building the System Picture from the disorganised heap of Step Parts is one of the key skills of an Improvement Science Practitioner.

And the more practice we get, the quicker we recognise what we are looking at – because there are a relatively few effective system designs.

This is insight is important because most of the unsolved problems are system problems – and the sooner we can diagnose the system design flaws that are the root causes of the system problems, then the sooner we can propose, test and implement solutions and experience the expected improvements.

That is a Win-Win-Win strategy.

That is systems engineering in a nutshell.

The Bucket Brigade Fire Fighting Service

Fire-fighting is a behaviour that has a long history, and before Fireman Sam arrived on the scene we had the Bucket Brigade.  This was a people-intensive process designed to deliver water from the nearest pump, pond or river with as little risk, delay and effort as possible. The principle of a bucket-brigade is that a chain of people forms between the pump and the fire and they pass buckets in two directions – full ones from the pump to the fire and empty ones from the fire back to the pump.

A bucket brigade is useful metaphor for many processes and an Improvement Science Practitioner (ISP) can learn a lot from exploring its behaviour.

First of all the number of steps in the process or stream is fixed because it is determined by the distance between the pump and the fire. The time it takes for a Bucket Passer to pass a bucket to the next person is predictable  too and it is this cycle-time that determines the rate at which a bucket will move along the line. The fixed step-number and fixed cycle-time implies that the time it takes for a bucket to pass from one end of the line to the other is fixed too. It does not matter if the bucket is empty, half empty or full – the delivery time per bucket is consistent from bucket to bucket. The outflow however is not fixed – it is determined by how full each bucket is when it reaches the end of the line: empty buckets means zero flow, full buckets means maximum flow.

This implies that the process is behaving like a time-trap because the delivery time and the delivery volume (i.e. flow) are independent. Having bigger buckets or fuller buckets makes no difference to the time it takes to traverse the line but it does influence the outflow.

Most systems have many processes that are structured just like a bucket brigade: each step in the process contributes to completing the task before handing the part-completed task on to the next step.

The four dimensions of improvement are Safety, Flow, Quality and Productivity and we can see that, if we are not dropping buckets, then the safety, flow and quality are fixed by the design of the process. So what can we do to improve productivity?

Well, it is evident that the time it takes to do the hand-off adds to the cycle-time of each step. So along comes the Fire Service Finance Department who sees time-as-money and they work out that the unit cost of each step of the process could be reduced by accumulating the jobs at each stage and then handing them off as a batch – because the time-is-money and the cost of the hand-off can now be shared across several buckets. They conclude that the unit cost for the steps will come down and productivity will go up – simple maths and intuitively obvious in theory – but does it actually work in reality?

Q1: Does it reduce the number of Bucket Passers? No. We need just as many as we did before. What we are doing is replacing the smaller buckets with bigger ones – and that will require capital investment.  So when our Finance Department use the lower unit cost as justification then the bigger, more expensive buckets start to look like a good financial option – on paper. But looking at the wage bills we can see that they are the same as before so this raises a question: have the bigger buckets increased the flow or reduced the delivery time? We will need a tangible, positive and measurable  improvement in productivity to justify our capital investment.

To summarise: we have the same number of Bucket Passers working at the same cycle time so there is no improvement in how long it takes for the water to reach the fire from the pump! The delivery time is unchanged. And using bigger buckets implies that the pump needs to be able to work faster to fill them in one cycle of the process – but to minimise cost when we created the Fire Service we bought a pump with just enough average flow capacity and it cannot be made to increase its flow. So, equipped with a bigger bucket the first Bucket Passer has to wait longer for their bigger bucket to be filled before passing it on down the line.  This implies a longer cycle-time for the first step, and therefore also for every step in the chain. So the delivery-time will actually get longer and the flow will stay the same – on average. All we have appear to have achieved is a higher cost and longer delivery time – which is precisely the opposite of what we intended. Productivity has actually fallen!

In a state of  near-panic the Fire Service Finance Department decide to measure the utilisation of the Bucket Passers and discover that it has fallen which must mean that they have become lazy! So a Push Policy is imposed to make them work faster – the Service cannot afford financial inducements – and threats cost nothing. The result is that in their haste to avoid penalties the bigger, fuller, heavier buckets get fumbled and some of the precious water is lost – so less reaches the fire.  The yield of the process falls and now we have a more expensive, longer delivery time, lower flow process. Productivity has fallen even further and now the Bucket Passers and Accountants are at war. How much worse can it get?

Where did we go wrong?

We made an error of omission. We omitted to learn the basics of process design before attempting to improve the productivity of our time-trap dominated process!  Our error of omission led us to confuse the step, stage, stream and system and we incorrectly used stage metrics (unit cost and utilisation) in an attempt to improve system performance (productivity). The outcome was the exact opposite of what we intended; a line of unhappy Bucket Passers; a frustrated Finance Department and an angry Customer whose house burned down because our Fire Service did not deliver enough water on time. Lose-Lose-Lose.

Q1: Is it possible to improve the productivity of a time-trap design?

Q1: Yes, it is.

Q2: How do we avoid making the same error?

A2: Follow the FISH .

Targets, Tyrannies and Traps.

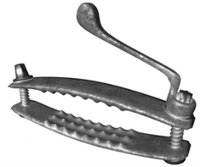
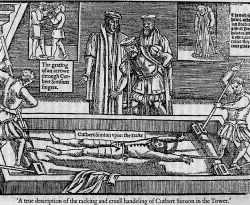
If we are required to place a sensitive part of our anatomy into a device that is designed to apply significant and sustained pressure, then the person controlling the handle would have our complete attention!

Our sole objective would be to avoid the crushing and relentless pain and this would most definitely bias our behaviour.

We might say or do things that ordinarily we would not – just to escape from the pain.

The requirement to meet well-intentioned but poorly-designed performance targets can create the organisational equivalent of a medieval thumbscrew; and the distorting effect on behaviour is the same.  Some people even seem to derive pleasure from turning the screw!

But what if we do not know how to achieve the performance target? We might then act to deflect the pain onto others – we might become tyrants too – and we might start to apply our own thumbscrews further along the chain of command.  Those unfortunate enough to be at the end of the pecking order have nowhere to hide – and that is a deeply distressing place to be – helpless and hopeless.

Fortunately there is a way out of the corporate torture chamber: It is to learn how to design systems to deliver the required performance specification – and learning how to do this is much easier than many believe.

For example, most assume without question that big queues and long waits are always caused by inefficient use of available capacity – because that is what their monitoring systems report. So out come thumbscrews heralded by the chanted mantra “increase utilisation, increase utilisation”.  Unfortunately, this belief is only partially correct: low utilisation of available capacity can and does lead to big queues and long waits but there is a much more prevalent and insidious cause of long waits that has nothing to do with capacity or utilisation. These little beasties are are called time-traps.

The essential feature of a time trap is that it is independent of both flow and time – it adds the same amount of delay irrespective of whether the flow is low or high and irrespective of when the work arrives. In contrast waits caused by insufficient capacity are flow and time dependent – the higher the flow the longer the wait – and the effect is cumulative over time.

Many confuse the time-trap with its close relative the batch – but they are not the same thing at all – and most confuse both of these with capacity-constraints which are a completely different delay generating beast altogether.

The distinction is critical because the treatments for time-traps, batches and capacity-constraints are different – and if we get the diagnosis wrong then we will make the wrong decision, choose the wrong action, and our system will get sicker, or at least no better. The corporate pain will continue and possibly get worse – leading to even more bad behaviour and more desperate a self-destructive strategies.

So when we want to reduce lead times by reducing waiting-in-queues then the first thing we need to do is to search for the time-traps, and to do that we need to be able to recognise their characteristic footprint on our time-series charts; the vital signs of our system.

We need to learn how to create and interpret the charts – and to do that quickly we need guidance from someone who can explain what to look for and how to interpret the picture.

If we lack insight and humility and choose not to learn then we are choosing to stay in the target-tyranny-trap and our pain will continue.

The Power of the Positive Deviants

It is neither reasonable nor sensible to expect anyone to be a font of all knowledge.

And gurus with their group-think are useful but potentially dangerous when they suppress competitive paradigms.

So where does an Improvement Scientist seek reliable and trustworthy inspiration?

Guessing is a poor guide; gut-instinct can seriously mislead; and mind-altering substances are illegal, unreliable or both!

So who are the sources of tested ideas and where do we find them?

They are called Positive Deviants and they are everywhere.


But, the phrase positive deviant does not feel quite right does it? The word “deviant” has a strong negative emotional association. We are socially programmed from birth to treat deviations from the norm with distrust and for good reason. Social animals view conformity and similarity as security – it is our herd instinct. Anyone who looks or behaves too far from the norm is perceived as odd and therefore a potential threat and discounted or shunned.

So why consider deviants at all? Well, because anyone who behaves significantly differently from the majority is a potential source of new insight – so long as we know how to separate the positive deviants from the negative ones.

Negative deviants display behaviours that we could all benefit from by actively discouraging!  The NoNo or thou-shalt-not behaviours that are usually embodied in Law.  Killing, stealing, lying, speeding, dropping litter – that sort of thing. The anti-social trust-eroding conflict-generating behaviour that poisons the pond that we all swim in.

Positive deviants display behaviours that we could all benefit from actively encouraging! The NiceIf behaviours. But we are habitually focussed more on self-protection than self-development and we generalise from specifics. So we treat all deviants the same – we are wary of them. And by so doing we miss many valuable opportunities to learn and to improve.


How then do we identify the Positive Deviants?

The first step is to decide the dimension we want to improve and choose a suitable metric to measure it.

The second step is to measure the metric for everyone and do it over time – not just at a point in time. Single point-in-time measurements (snapshots) are almost useless – we can be tricked by the noise in the system into poor decisions.

The third step is to plot our measure-for-improvement as a time-series chart and look at it.  Are there points at the positive end of the scale that deviate significantly from the average? If so – where and who do they come from? Is there a pattern? Is there anything we might use as a predictor of positive deviance?

Now we separate the data into groups guided by our proposed predictors and compare the groups. Do the Positive Deviants now stick out like a sore thumb? Did our predictors separate the wheat from the chaff?

If so we next go and investigate.  We need to compare and contrast the Positive Deviants with the Norms. We need to compare and contrast both their context and their content. We need to know what is similar and what is different. There is something that is causing the sustained deviation and we need to search until we find it – and then we need know how and why it is happening.

We need to separate associations from causations … we need to understand the chains of events that lead to the better outcomes.

Only then will a new Door to Opportunity magically appear in our Black Wall of Ignorance – a door that leads to a proven path of improvement. A path that has been trodden before by a Positive Deviant – or by a whole tribe of them.

And only we ourselves can choose to open the door and explore the path – we cannot be pushed through by someone else.

When our system is designed to identify and celebrate the Positive Deviants then the negative deviants will be identified too! And that helps too because they will light the path to more NoNos that we can all learn to avoid.

For more about positive deviance from Wikipedia click here

For a case study on positive deviance click here

NB: The terms NiceIfs  and NoNos are two of the N’s on The 4N Chart® – the other two are Nuggets and Niggles.

Seeing Is Believing or Is It?

Do we believe what we see or do we see what we believe?  It sounds like a chicken-and-egg question – so what is the answer? One, the other or both?

Before we explore further we need to be clear about what we mean by the concept “see”.  I objectively see with my real eyes but I subjectively see with my mind’s eye. So to use the word see for both is likely to result in confusion and conflict and to side-step this we will use the word perceive for seeing-with-our-minds-eye.   

When we are sure of our belief then we perceive what we believe. This may sound incorrect but psychologists know better – they have studied sensation and perception in great depth and they have proved that we are all susceptible to “perceptual bias”. What we believe we will see distorts what we actually perceive – and we do it unconsciously. Our expectation acts like a bit of ancient stained glass that obscures and distorts some things and paints in a false picture of the rest.  And that is just during the perception process: when we recall what we perceived we can add a whole extra layer of distortion and can can actually modify our original memory! If we do that often enough we can become 100% sure we saw something that never actually happened. This is why eye-witness accounts are notoriously inaccurate! 

But we do not do this all of the time.  Sometimes we are open-minded, we have no expectation of what we will see or we actually expect to be surprised by what we will see. We like the feeling of anticipation and excitement – of not knowing what will happen next.   That is the psychological basis of entertainment, of exploration, of discovery, of learning, and of improvement science.

An experienced improvement facilitator knows this – and knows how to create a context where deeply held beliefs can be explored with sensitivity and respect; how to celebrate what works and how and why it does; how to challenge what does not; and how to create novel experiences; foster creativity and release new ideas that enhance what is already known, understood and believed.

Through this exploration process our perception broadens, sharpens and becomes more attuned with reality. We achieve both greater clarity and deeper understanding – and it is these that enable us to make wiser decisions and commit to more effective action.

Sometimes we have an opportunity to see for real what we would like to believe is possible – and that can be the pivotal event that releases our passion and generates our commitment to act. It is called the Black Swan effect because seeing just one black swan dispels our belief that all swans are white.

A practical manifestation of this principle is in the rational design of effective team communication – and one of the most effective I have seen is the Communication Cell – a standardised layout of visual information that is easy-to-see and that creates an undistorted perception of reality.  I first saw it many years ago as a trainee pilot when we used it as the focus for briefings and debriefings; I saw it again a few years ago at Unipart where it is used for daily communication; and I have seen it again this week in the NHS where it is being used as part of a service improvement programme.

So if you do not believe then come and see for yourself.

March Madness

Whether we like it or not we are driven by a triumvirate of celestial clocks. Our daily cycle is the result of the rotation of the Earth; the ebb and flow of the tides is caused by the interaction of the orbiting Moon and the spinning Earth; and the annual sequence of seasons is the outcome of the tilted Earth circling the Sun.  The other planets, stars and galaxies appear not to have much physical influence – despite what astrologists would have us believe. 

Hares are said to behave oddly in the month of March – as popularised by Lewis Carroll in Alice’s Adentures in Wonderland – but there is another form of March Madness that affects people – one that is not celestial and seasonal in origin – its cause is fiscal and financial. The madness that accompanies the end of the tax year.

This fiscal cycle is man-made and is arbitrary – it could just as well be any other month and does indeed differ from country to country – and the reason it is April 6th in the UK is because it is based on the ecclesiastical year which starts on March 25th but was shifted to April 6th when 11 days were lost on the adoption of the Gregorian calendar in 1752.  The driver of the fiscal cycle is taxation and the embodiment in Law of the requirement to present standard annual financial statements for the purpose of personal taxation.

The problem is that this system was designed for a time when the bean-counting bureaucracy was people-pen-paper based and to perform this onerous task more often than annually would have been counter-productive.  That is the upside. The downside is that an annual fiscal cycle shackled to a single date creates a feast-and-famine cash flow effect. The public coffers would have a shark-fin shaped wonga-in-progress chart!  And preparing for the end of the financial year creates multi-faceted March madness: annual cash hoarding leads to delayed investment decisions and underspent budgets being disposed of carelessly; short term tax minimisation strategies distort long term investment decisions and financial targets take precident over quality and delivery goals. Success or failure hinges on the the financial equivalent of threading the eye of a long needle with a bargepole. The annual fiscal policy distorts the behaviour of system and benefits nobody. 

It would be a better design for everyone if fiscal feedback was continuous – especially as the pace of change is quickening to the point that an annual financial planning cycle is painfully long . The good news is that there are elements of fiscal load levelling aleady: companies can choose a date for their annual returns; sales tax is charged continuosuly and collected quarterly; income tax is collected monthly or weekly. But with the ubiquitous digital computer the cost of the bureaucracy is now so low that the annual fiscal fiasco is technically unnecessary and it has become more of a liability than an asset.

What would be the advantages of scrapping it? Individuals could change their tax review date and interval to one that better suits them and this would spread the bureaucratic burden on the inland revenue over the year; the country would have a smoother tax revenue flow and less ]need to  borrow to fund public expenses; and publically funded organisations could budget on a trimester or even monthly basis and become more responsive to financial fluxes and changes in the system. It could be better for everyone – but it would require radical redesign. We are not equipped to do that – we would need to understand the principles of improvement science that relate to elimination of variation.

And what about the other annual cycle that plagues the population – the Education Niggle? This is the one that requires everyone with children of school age to be forced to take family holidays at the same time: Easter, Summer and Christmas – creating another batch-and-queue feast-and-famine cycle. This fiasco originated in the early 1800’s when educational reformers believed that continuous schooling was unhealthy and institutionalised when the Forster Elementary Education Act of 1870 provided partially state funded schools – especially for the poor – to provide a sufficient supply of educated workers for the burgeoning Industrial Revolution. Once the expectation of a long summer vacation was established it has been difficult to change.  More recent evidence shows that the loss of learning momentum has a detrimental effect on children not to mention the logistical problems created if both parents are working. Children are born all year round and have wide variation in their abilities and rate of learning and to impose an arbitrary educational cycle is clearly more for the convenience of the schools and teachers than aligned to the needs of children, their families or society.  As our required skills become more generic and knowledge focussed the need for effective and efficient continuous education has never been greater. Digital communication technology is revolutionising this whole sector and individually-tailored, integrated, life-long  learning and continuous assessment is now both feasible and more affordable.

And then there is healthcare!  Where do we start?

It is time to challenge and change our out-of-date no-longer-fit-for-purpose bureaucratic establishment designs – so there will be no shortage of opportunties or work for every competent and capable Improvement Scientist!

Never Events and Nailing Niggles

Some events should NEVER happen – such as removing the wrong kidney; or injecting an anti-cancer drug designed for a vein into the spine; or sailing a cruise ship over a charted underwater reef; or driving a bus full of sleeping school children into a concrete wall.
But  these catastrophic irreversible and tragic Never Events do keep happening – rarely perhaps – but persistently. At the Never-Event investigation the Finger-of-Blame goes looking for the incompetent culprit while the innocent victims call for compensation.

And after the smoke has cleared and the pain of loss has dimmed another Never-Again-Event happens – and then another, and then another. Rarely perhaps – but not never.

Never Events are so awful and emotionally charged that we remember them and we come to believe that they are not rare and from that misperception we develop a constant nagging feeling of fear for the future. It is our fear that erodes our trust which leads to the paralysis that prevents us from acting.  In the globally tragic event of 9/11 several thousand innocents victims died while the world watched in horror.  More innocent victims than that die needlessly every day in high-tech hospitals from avoidable errors – but that statistic is never shared.

The metaphor that is often used is the Swiss Cheese – the sort on cartoons with lots of holes in it. The cheese represents a quality check – a barrier that catches and corrects mistakes before they cause irreversible damage. But the cheesy check-list is not perfect; it has holes in it.  Mistakes slip through.

So multiple layers of cheesy checks are added in the hope that the holes in the earlier slices will be covered by the cheese in the later ones – and our experience shows that this multi-check design does reduce the number of mistakes that get through. But not completely. And when, by rare chance, holes in each slice line up then the error penetrates all the way through and a Never Event becomes a Actual Catastrophe.  So, the typical recommendation from the after-the-never-event investigation is to add another layer of cheese to the stack – another check on the list on top of all the others.

But the cheese is not durable: it deteriorates over time with the incessant barrage of work and the pressure of increasing demand. The holes get bigger, the cheese gets thinner, and new holes appear. The inevitable outcome is the opening up of unpredictable, new paths through the cheese to a Never Event; more Never Events; more after-the-never-event investigation; and more slices of increasingly expensive and complex cheese added to the tottering, rotting heap.

A drawback of the Swiss Cheese metaphor is that it gives the impression that the slices are static and each cheesy check has a consistent position and persistent set of flaws in it. In reality this is not the case – the system behaves as if the slices and the holes are moving about: variation is jiggling , jostling and wobbling the whole cheesy edifice.

This wobble does not increase the risk of a Never Event  but it prevents the subsequent after-the-event investigation from discovering the specific conjunction of holes that caused it. The Finger of Blame cannot find a culprit and the cause is labelled a “system failure” or an unlucky individual is implicated and named-shamed-blamed and sacrificed to the Gods of Chance on the Alter of Hope! More often new slices of KneeJerk Cheese are added in the desperate hope of improvement – and creating an even greater burden of back-covering bureaucracy than before – and paradoxically increasing the number of holes!

Improvement Science offers a more rational, logical, effective and efficient approach to dissolving this messy, inefficient and ineffective safety design.

First it recognises that to prevent a Never Event then no errors should reach the last layer of cheese checking – the last opportunity to block the error trajectory. An error that penetrates that far is a Near Miss and these will happen more often than Never Events so they are the key to understanding and dissolving the problem.

Every Near Miss that is detected should be reported and investigated immediately – because that is the best time to identify the hole in the previous slice – before it wobbles out of sight. The goal of the investigation is understanding not accountability. Failure to report a near miss; failure to investigate it; failure to learn from it; failure to act on it; and failure to monitor the effect of the action are all errors of omission (EOOs) and they are the worst of management crimes.

The question to ask is “What error happened immediately before the Near Miss?”  This event is called a Not Again. Focussing attention on this Not Again and understanding what, where, when, who and how it happened is the path to preventing the Near Miss and the Never Event.  Why is not the question to ask – especially when trust is low and cynicism and fear are high – the question to ask is “how”.

The first action after Naming the Not Again is to design a counter-measure for it – to plug the hole – NOT to add another slice of Check-and Correct cheese! The second necessary action is to treat that Not Again as a Near-Miss and to monitor it so when it happens again the cause can be identified. These common, every day, repeating causes of Not Agains are called Niggles; the hundreds of minor irritations that we just accept as inevitable. This is where the real work happens – identifying the most common Niggle and focussing all attention on nailing it! Forever.  Niggle naming and nailing is everyone’s responsibility – it is part of business-as-usual – and if leaders do not demonstrate the behaviour and set the expectation then followers will not do it.

So what effect would we expect?

To answer that question we need a better metaphor than our static stack of Swiss cheese slices: we need something more dynamic – something like a motorway!

Suppose you were to set out walking across a busy motorway with your eyes shut and your fingers in your ears – hoping to get to the other side without being run over. What is the chance that you will make it across safely?  It depends on how busy the traffic is and how fast you walk – but say you have a 50:50 chance of getting across one lane safely (which is the same chance as tossing a fair coin and getting a head) – what is the chance that you will get across all six lanes safely? The answer is the same chance as tossing six heads in a row: a 1-in-2 chance of surviving the first lane (50%), a 1 in 4 chance of getting across two lanes (25%), a 1 in 8 chance of making it across three (12.5%) …. to a 1 in 64 chance of getting across all six (1.6%). Said another way that is a 63 out of 64 chance of being run over somewhere which is a 98.4% chance of failure – near certain death! Hardly a Never Event.

What happens to our risk of being run over if the traffic in just one lane is stopped and that lane is now 100% safe to cross? Well you might think that it depends on which lane it is but it doesn’t – the risk of failure is now 31/32 or 96.8% irrespective of which lane it is – so not much improvement apparently!  We have doubled the chance of success though!

Is there a better improvement strategy?

What if we work collectively to just reduce the flow of Niggles in all the lanes at the same time – and suppose we are all able to reduce the risk of a Niggle in our lane-of-influence from 1-in-2 to 1-in-6. How we do it is up to us. To illustrate the benefit we replace our coin with a six-sided die (no pun intended) and we only “die” if we throw a 1.  What happens to our pedestrian’s probability of survival? The chance of surviving the first lane is now 5/6 (83.3%), and both first and second 5/6 x 5/6 = 25/36 (69%.4) and so on to all six lanes which is 5/6 x 5/6 x 5/6 x 5/6 x 5/6 x 5/6 = 15625/46656 = 33.3% which is a lot better than our previous 1.6%!  And what if we keep plugging the holes in our bits of the cheese and we increase our individual lane success rate to 95% – our pedestrians probability of survival is now 73.5%. The chance of a catastrophic event becomes less and less.

The arithmetic may be a bit scary but the message is clear: to prevent the Never Events we must reduce the Near Misses and to to do that we investigate every Near Miss and expose the Not Agains and then use them to Name and Nail all the Niggles.  And we have complete control over the causes of our commonest Niggles because we create them.

This strategy will improve the safety of our system. It has another positive benefit – it will free up our Near Miss investigation team to do something else: it frees them to assist in the re-design the system so that Not Agains cannot happen at all – they become Never Events too – and the earlier in the path that safety-design happens the better – because it renders the other layers of check-and-correct cheesocracy irrelevant.

Just imagine what would happen in a real system if we did that …

And now try to justify not doing it …

And now consider what an individual, team and organisation would need to learn to do this …

It is called Improvement Science.

And learning the Foundations of Improvement Science in Healthcare (FISH) is one place to start.

fish

The Journal of Improvement Science

Improvement Science encompasses research, improvement and audit and includes both subjective and objective dimensions.  An essential part of collective improvement is sharing our questions and learning with others.

From the perspective of the learner it is necessary to be able to trust that what is shared is valid and from the perspective of the questioner it is necessary to be able to challenge with respect.

Sharing new knowledge is not the only purpose of publication: for academic organisations it is also a measure of performance so there is a academic peer pressure to publish both quantity and quality – an academic’s career progression depends on it.

This pressure has created a whole industry of its own – the academic journal – and to ensure quality is maintained it has created the scholastic peer review process.  The  intention is to filter submitted papers and to only publish those that are deemed worthy – those that are believed by the experts to be of most value and of highest quality.

There are several criteria that editors instruct their volunteer “independent reviewers” to apply such as originality, relevance, study design, data presentation and balanced discussion.  This process was designed over a hundred years ago and it has stood the test of time – but – it was designed specifically for research and before the invention of the Internet, of social media and the emergence of Improvement Science.

So fast-forward to the present and to a world where improvement is now seen to  be complementary to research and audit; where time-series statistics is viewed as a valid and complementary data analysis method; and where we are all able to globally share information with each other and learn from each other in seconds through the medium of modern electronic communication.

Given these changes is the traditional academic peer review journal system still fit for purpose?

One way to approach this question is from the perspective of the customers of the system – the people who read the published papers and the people who write them.  What niggles do they have that might point to opportunities for improvement?

Well, as a reader:

My first niggle is to have to pay a large fee to download an electronic copy of a published paper before I can read it. All I can see is the abstract which does not tell me what I really want to know – I want to see the details of the method and the data not just the authors edited highlights and conclusions.

My second niggle is the long lead time between the work being done and the paper being published – often measured in years!  This implies that the published news is old news  useful for reference maybe but useless for stimulating conversation and innovation.

My third niggle is what is not published.  The well-designed and well-conducted studies that have negative outcomes; lessons that offer as much opportunity for learning as the positive ones.  This is not all – many studies are never done or never published because the outcome might be perceived to adversely affect a commercial or “political” interest.

My fourth niggle is the almost complete insistence on the use of empirical data and comparative statistics – data from simulation studies being treated as “low-grade” and the use of time-series statistics as “invalid”.  Sometimes simulations and uncontrolled experiments are the only feasible way to answer real-world questions and there is more to improvement than a RCT (randomised controlled trial).

From the perspective of an author of papers I have some additional niggles – the secrecy that surrounds the review process (you are not allowed to know who has reviewed the paper); the lack of constructive feedback that could help an inexperienced author to improve their studies and submissions; and the insistence on assignment of copyright to the publisher – as an author you have to give up ownership of your creative output.

That all said there are many more nuggets to the peer review process than niggles and to a very large extent what is published can be trusted – which cannot be said for the more popular media of news, newspapers, blogs, tweets, and the continuous cacophony of partially informed prejudice, opinion and gossip that goes for “information”.

So, how do we keep the peer-reviewed baby and lose the publication-process bath water? How do we keep the nuggets and dump the niggles?

What about a Journal of Improvement Science along the lines of:

1. Fully electronic, online and free to download – no printed material.
2. Community of sponsors – who publically volunteer to support and assist authors.
3. Continuously updated ranking system – where readers vote for the most useful papers.
4. Authors can revise previously published papers – using feedback from peers and readers.
5. Authors retain the copyright – they can copy and distribute their own papers as much as they like.
6. Expected use of both time-series and comparative statistics where appropriate.
7. Short publication lead times – typically days.
8. All outcomes are publishable – warts and all.
9. Published authors are eligible to be sponsors for future submissions.
10. No commercial sponsorship or advertising.

STOP PRESS: JOIS is now launched: Click here to enter.

Resetting Our Systems

 Our bodies are amazing self-monitoring and self-maintaining systems – and we take them completely for granted!

The fact that it is all automatic is good news for us because it frees us up to concentrate on other things – BUT – it has a sinister side too.  Our automatic monitor-and-maintain design does not imply what is maintained is healthy – the system is just designed to keep itself stable.

Take our blood pressure as an example. We all have two monitor-and-maintain systems that work together – one that stablises short-term changes in blood pressure (such as when you recline, stand, run, fight, and flee) and the other that stablises long-term changes. The image above is a very simplified version of the long-term regulation system!

Around one quarter of all adults are classified as having high blood pressure – which means that it is consistently higher than is healthy – and billions of £ are spent every year on drugs to reduce blood pressure in millions of people.  Why is this an issue? How does it happen? What lessons are there for the student of Improvement Science?

High blood pressure (or hypertension) is dangerous – and the higher it is the more dangerous it is. It is called the silent killer and the reason is that it is called silent is because there are no symptoms. The reason it called a killer is because over time it causes irreversible damage to vital organs – the heart, kidneys and arteries in the brain.

The vast majority of hypertensives have what is called essential hypertension – which means that there is no obvious single cause.  It is believed that this is the result of their system gradually becoming reset so that it actively maintains the high blood pressure.  This is just like gradually increasing the setting on the thermostat in our house – say by just 0.01 degree per week – not much and not even measurable – but over time the cumulative effect would have a big impact on our heating bills!

So, what resets our long-term blood pressure regulation system? It is believed that the main culprit is stress because when we feel stressed our bodies react in the short-term by pushing our blood pressure up – it is called the fright-fight-flight response. If the stress is repeated time and time again our pressure-o-stat becomes gradually reset and the high blood pressure is then maintained, even when we do not feel stressed. And we do not notice – until something catastrophic happens! And that is too late.

The same effect happens in organisations except that the pressure is emotional and is created by the stress of continually fighting to meet performance targets. The result is a gradual resetting of our expectations and behaviours and the organisation develops emotional hypertension which leads to irreversible damage to the organisations culture. This emotional creep goes largely unnoticed until a catastrophic event happens – and if severe enough the organisation will be crippled and may not survive. The Mid Staffs Hospital patient safety catastrophe is a real and recent example of cultural creep in a healthcare organisation driven by incessant target-driven behaviour. It is a stark lesson to us all. 

So what is the solution?

The first step is to realise that we cannot just rely on hope, ignore the risk and wait for the early warning  symptoms – by that time the damage may be irreversible; or the catastrophe may get us without warning. We have to actively look for the signs of the creeping cultural change – and we have to do that over a long period of time because it is gradual. So, if we have just be jolted out of denial by a too-close-for-comfort expereince then we need to adopt a different strategy and use an external absolute reference – an emotionally and culturally healthy organisation.

The second step is to adopt a method that will tell us reliably if there is a significant shift in our emotional pressure and a method that is sensitive eneough to alert  us before it goes outside a safe range – because we want to intervene as early as possible and only when necessary. Masterly inactivity and cat-like observation according to one wise medical mentor.  

The third step is to actively remove as many of the stressors as possible – and for an organisation this means replacing DRATs (Delusional Ratios and Arbitrary Targets) with well-designed specification limits; and replacing reactive fire-fighting with proactive feedback. This is the role of the leaders.

The fourth step is to actively reduce the emotional pressure but to do it gradually because the whole system needs to adjust. Dropping the emotional pressure too quickly is as dangerous as discounting its importance.

The key to all of this is the appropriate use of data and time-series analysis because the smaller long-term shifts are hidden in the large short-term variation. This is where many get stuck because they are not aware that there two different sorts of statistics. The  correct sort for monitoring systems is called time-series statistics and it not the same as the statistics that we learn at school and university. That is called comparative statistics. This is a shame really because time-series statistics is much more applicable to every day life problems such as managing our blood pressure, our weight, our finances, and the cultural health of our organisations.

Fortunately time-series statistics is easier to learn and use than school statistics so to get started on resetting your personal and organisational emot-o-stat please help yourself to the complimentary guide by clicking here.

Renewal

Old habits die hard” so the saying goes – but not all habits are bad. Most are good.

And in our quest for improvement sometimes we have to challenge a good habit and replace it with an even better one. And doing that is tough – much tougher than challenging a bad habit.

Sometimes the challenge to our comfort zone comes from Reality. We suddenly lose something very dear to us that has become such an integral and important part of our lives that when it is taken away we feel the acute pain of loss. We are left with an open emotional wound and we have to give ourselves time and space to recover and to heal.

With the clarity of hindsight we can see that we knew all along what would happen – we just did not know when it would happen – and we were in a state of hope-for-the-best-for-now. After all, why suffer the perpetual pain of worry when the outcome is inevitable? Well, it may be inevitable but it does not mean it needs to be imminent! So a healthy dose of anxiety is OK. Complacency is the precursor to a catastrophe and most of our catastrophes are preventable. Keeping busy doing what we have always done is not an effective strategy for warding off a preventable catastrophe.

A more effective strategy is to worry just enough to keep our complacency level low and to keep us alert to threats because in averting these we are forced to challenge ourselves and in doing that we discover hidden opportunities.

The outcome is renewal.

Sometimes though we have to learn the lessons of life the hard way.

Tilt-Nudge-Poke

Improvement requires change and change requires learning – so knowing how to guide learning is an essential skill for an improvement scientist.

There is a common belief that we learn by watching and listening – and therefore that we can teach by showing and talking. This belief is incorrect. We all learn by doing something different and comparing what we perceived with what we predicted. So what prompts us to do something different?  The answer is we are nudged.

We learn and change over time as a result of a series of small nudges – the effects of which add up. We can simulate this behaviour easily.

Find a tray and a piece of kitchen paper and draw two circles on the paper. Put the paper on the tray and then put a heap of granulated sugar on the leftmost circle. It will stay where it is placed. Hold the tray horizontal and nudge the tray repeatedly by tapping on its edge with a finger. The heap of sugar will spread out in all directions – and only a small proportion goes to wards the second circle – the intended direction of improvement.

Now repeat the simulation but this time tilt the tray slightly in the direction of improvement so that the heap stays put – and then nudge the tray. The heap of sugar will spread out and more will move in the direction of the second circle – the improvement goal.  The nudging is necessary but it is not sufficient – a tilt in the intended direction of improvement is also necessary but not sufficient. Actual improvement requires both.

Life provides a continuous series of random nudges – so in reality all that is needed to improve is to set the direction of tilt – which implies making it easier to move in the direction of improvement than away from it. Setting the direction of tilt is one facet of leadership – and it requires aligning the reward with the improvement. Very often this is not done and improvement becomes an uphill struggle that is unsustainable and unmaintainable.

Even when the reward is aligned with the improvement we cannot guarantee success – there is another factor.

Now repeat the sugar flow simulation and this time create a physical barrier between the heap and the goal – such as a row of sugar cubes or a fold in the kitchen paper. Create a barrier that the tilting and nudging is not strong enough to move. Now the sugar flow will be blocked by the barrier and our temptation is to increase the tilt and apply bigger nudges – but this increase-the-pressure-by-pushing-harder strategy has a risk because when the barrier eventially breaks the backlog of sugar lurches forward in an uncontrolled surge. Uncontrolled impprovement is not what we want.

So the second role of the improvement scientist is to help to remove the barriers – and this requires a more focussed action than a tilt or a nudge. It requires a poke.

Pokes are uncomfortable for the poker and for the pokee – and the skill to master the art of the positive poke. Negative pokes are surprising, emotionally painful and result in an angry reaction which damages the pokee. Positive pokes are surprising, emotionally uncomfortable and result in an excited proaction which develops the pokee.

So now poke the barrier where it crosses the line that joins the two circles so that it is reduced or removed at that point – and then tilt and nudge as before. The backlog of sugar will funnel through the gap in the barrier in a well-focussed stream in the direction of improvement. The barrier actually helps to direct the the flow so a precise poke is necessary.

The effective improvement scientist needs to know how to tilt, when to nudge and where to poke.


Homeostasis

Improvement Science is not just about removing the barriers that block improvement and building barriers to prevent deterioration – it is also about maintaining acceptable, stable and predictable performance.

In fact most of the time this is what we need our systems to do so that we can focus our attention on the areas for improvement rather than running around keeping all the plates spinning.  Improving the ability of a system to maintain itself is a worthwhile and necessary objective.

Long term stability cannot be achieved by assuming a stable context and creating a rigid solution because the World is always changing. Long term stability is achieved by creating resilient solutions that can adjust their behaviour, within limits, to their ever-changing context.

This self-adjusting behaviour of a system is called homeostasis.

The foundation for the concept of homeostasis was first proposed by Claude Bernard (1813-1878) who unlike most of his contemporaries, believed that all living creatures were bound by the same physical laws as inanimate matter.  In his words: “La fixité du milieu intérieur est la condition d’une vie libre et indépendante” (“The constancy of the internal environment is the condition for a free and independent life”).

The term homeostasis is attributed to Walter Bradford Cannon (1871 – 1945) who was a professor of physiology at Harvard medical school and who popularized his theories in a book called The Wisdom of the Body (1932). Cannon described four principles of homeostasis:

  1. Constancy in an open system requires mechanisms that act to maintain this constancy.
  2. Steady-state conditions require that any tendency toward change automatically meets with factors that resist change.
  3. The regulating system that determines the homeostatic state consists of a number of cooperating mechanisms acting simultaneously or successively.
  4. Homeostasis does not occur by chance, but is the result of organised self-government.

Homeostasis is therefore an emergent behaviour of a system and is the result of organised, cooperating, automatic mechanisms. We know this by another name – feedback control – which is passing data from one part of a system to guide the actions of another part. Any system that does not have homeostatic feedback loops as part of its design will be inherently unstable – especially in a changing environment.  And unstable means untrustworthy.

Take driving for example. Our vehicle and its trusting passengers want to get to their desired destination on time and in one piece. To achieve this we will need to keep our vehicle within the boundaries of the road – the white lines – in order to avoid “disappointment”.

As their trusted driver our feedback loop consists of a view of the road ahead via the front windscreen; our vision connected through a working nervous system to the muscles in ours arms and legs; to the steering wheel, accelerator and brakes; then to the engine, transmission, wheels and tyres and finally to the road underneath the wheels. It is quite a complicated multi-step feedback system – but an effective one. The road can change direction and unpredictable things can happen and we can adapt, adjust and remain in control.  An inferior feedback design would be to use only the rear-view mirror and to steer by looking at the whites lines emerging from behind us. This design is just as complicated but it is much less effective and much less safe because it is entirely reactive.  We get no early warning of what we are approaching.  So, any system that uses the output performance as the feedback loop to the input decision step is like driving with just a rear view mirror.  Complex, expensive, unstable, ineffective and unsafe.     

As the number of steps in a process increases the more important the design of  the feedback stabilisation becomes – as does the number of ways we can get it wrong:  Wrong feedback signal, or from the wrong place, or to the wrong place, or at the wrong time, or with the wrong interpretation – any of which result in the wrong decision, the wrong action and the wrong outcome. Getting it right means getting all of it right all of the time – not just some of it right some of the time. We can’t leave it to chance – we have to design it to work.

Let us consider a real example. The NHS 18-week performance requirement.

The stream map shows a simple system with two parallel streams: A and B that each has two steps 1 and 2. A typical example would be generic referral of patients for investigations and treatment to one of a number of consultants who offer that service. The two streams do the same thing so the first step of the system is to decide which way to direct new tasks – to Step A1 or to Step B1. The whole system is required to deliver completed tasks in less than 18 weeks (18/52) – irrespective of which stream we direct work into.   What feedback data do we use to decide where to direct the next referral?

The do nothing option is to just allocate work without using any feedback. We might do that randomly, alternately or by some other means that are independent of the system.  This is called a push design and is equivalent to driving with your eyes shut but relying on hope and luck for a favourable outcome. We will know when we have got it wrong – but it is too late then – we have crashed the system! 

A more plausible option is to use the waiting time for the first step as the feedback signal – streaming work to the first step with the shortest waiting time. This makes sense because the time waiting for the first step is part of the lead time for the whole stream so minimising this first wait feels reasonable – and it is – BUT only in one situation: when the first steps are the constraint steps in both streams [the constraint step is one one that defines the maximum stream flow].  If this condition is not met then we heading for trouble and the map above illustrates why. In this case Stream A is just failing the 18-week performance target but because the waiting time for Step A1 is the shorter we would continue to load more work onto the failing  stream – and literally push it over the edge. In contrast Stream B is not failing and because the waiting time for Step B1 is the longer it is not being overloaded – it may even be underloaded.  So this “plausible” feedback design can actually make the system less stable. Oops!

In our transport metaphor – this is like driving too fast at night or in fog – only being able to see what is immediately ahead – and then braking and swerving to get around corners when they “suddenly” appear and running off the road unintentionally! Dangerous and expensive.

With this new insight we might now reasonably suggest using the actual output performance to decide which way to direct new work – but this is back to driving by watching the rear-view mirror!  So what is the answer?

The solution is to design the system to use the most appropriate feedback signal to guide the streaming decision. That feedback signal needs to be forward looking, responsive and to lead to stable and equitable performance of the whole system – and it may orginate from inside the system. The diagram above holds the hint: the predicted waiting time for the second step would be a better choice.  Please note that I said the predicted waiting time – which is estimated when the task leaves Step 1 and joins the back of the queue between Step 1 and Step 2. It is not the actual time the most recent task came off the queue: that is rear-view mirror gazing again.

When driving we look as far ahead as we can, for what we are heading towards, and we combine that feedback with our present speed to predict how much time we have before we need to slow down, when to turn, in which direction, by how much, and for how long. With effective feedback we can behave proactively, avoid surprises, and eliminate sudden braking and swerving! Our passengers will have a more comfortable ride and are more likely to survive the journey! And the better we can do all that the faster we can travel in both comfort and safety – even on an unfamiliar road.  It may be less exciting but excitement is not our objective. On time delivery is our goal.

Excitement comes from anticipating improvement – maintaining what we have already improved is rewarding.  We need both to sustain us and to free us to focus on the improvement work! 


The Safety Line in the Quality Sand

Improvement Science is about getting better – and it is also about not getting worse.

These are not the same thing. Getting better requires dismantling barriers that block improvement. Not getting worse requires building barriers to block deterioration.

When things get tough and people start to panic it is common to see corners being cut and short-term quick fixes taking priority over long-term common sense.  The best defense against this self-defeating behaviour is the courage and discipline to say “This is our safety line in the quality sand and we do not cross it“.  This is not dogma it is discipline. Dogma is blind acceptance; discipline is applied wisdom.

Leaders show their mettle when times are difficult not when times are easy.  A leader who abandons their espoused principles when under pressure is a liability to themselves and to their teams and organisations.

The barrier that prevents descent into chaos is not the leader – it is the principle that there is a minimum level of acceptable quality – the line that will not be crossed. So when a decision needs to be made between safety and money the choice is not open to debate. Safety comes first.  

Only those who believe that higher quality always costs more will argue for compromise. So when the going gets tough those who question the Safety Line in the Quality Sand are the ones to challenge by respectfully reminding them of their own principles.

This challenge will require courage because they may be the ones in the seats of power.  But when leaders compromise their own principles they have sacrificed their credibility and have abdicated their power.

Is Our System Constipated?

There are some very common system ailments that we do not talk about in public – they are not socially acceptable topics of conversation.

We all know they exist because we all suffer from them at sometime or other – and some more than others.

Our problem is “how do we solve sometheng that no one wants to own up to and talk about?”  Grin-and-bear it? Trial-and-error? Or seek competent, confidential, professional assistance?

One such ailment is chronic system constipation. Yes – I said it!

The usual symptoms are recurrent, severe pains in the middle management area associated with ominous rumblings, intermittent eruptions of unpleasant hot “air” and accompanied by infrequent, unpredictable and often inconsequential output.

The signs are also characterstic: bloated budgets, capital distention and a strained and pained appearance of the executive visage.

The commonest findings on further investigation are accumulation of work in progress inside the organisation that is caused by functional bottlenecks, accumulation of undigestable red-tape, and process paralysis.  These findings confirm the diagnosis.

The more desperate organisations may seek help from corporate quacks who confidently prescribe untested yet expensive remedies such as mangement purges and corporate restructure.  These harsh treatments only serve to impoverish the patient and exacerbate the problem. They are also sometimes fatal. 

The patient who avoids or survives the quacks may seek competent help – and reluctantly submit themselves to a more intimate examination of their orifices.  This proceeds in a back-office to front-of-house order looking for accumulations of work-in-progress (WIP) and their associated causes.  The usual finding is apathetic and demoralised staff burned out by over-complicated, error-prone processes and pushing against turgid bureaucracy. 

The first stage of treatment is to relieve the obstruction that is closest to the discharge orifice first.

Often the intimate examination itself is sufficient to stimulate spontaneous ejection of the offending obstruction; sometimes a corporate-level enema is required to facilitate the process.  Either way the relief is immediate, dramatic and welcomel and is usually followed by vigorous expulsion of the remaining offensive material and restoration of both regular flow and disspiation of the gaseous bloating.

The timid or inexperienced corporoproctologist may be tempted to try exogenous stimulants instead – an inspiring podcast or an executive awayday perhaps.  This well-interntioned palliative treatment may distract attention and sooth the discomfort but the effect is short-lived and the symptoms soon return; often with a vengeance.

The more courageous and experienced Improvement Science practitioner knows that “if you don’t put your finger in it you will put your foot in it” and they come prepared with the organisational equivalent of rubber gloves and lubricating gel: flip charts and hot coffee.

So to avoid the squirming discomfort of the probing questions it is better to seek enematic advice well before this stage. And you may not be surprised to hear that it is all common-sense:

  • Avoid all high-bureaucracy diets.
  • Steer clear of  high-technology quick-fixes.
  • Stimulate the flow of creativity with regular service improvement exercises.
  • Monitor continuously for corporate complacency.
  • Treat early and vigorously with a high-challenge dialog.

But we know all this – don’t we? It is just common sense. 

Eureka!

This exclamation is most famously attributed to the ancient Greek scholar Archimedes who reportedly proclaimed “Eureka!” when he stepped into a bath and noticed that the water level rose.

Archimedies realised that the volume of water displaced must be equal to the volume of the part of his body he had submerged but this was not why he was allegedly so delighted: he had been trying to solve a problem posed by Hiero of Syracuse who needed to know the purity of gold in an irregular shaped votive crown.

Hiero suspected that his goldsmith was diluting the pure gold with silver and Archimedes  knew that the density of pure gold was different from a gold-silver alloy. His bathtime revalation told him that he could now measure the volume of the crown and with the weight he could calculate the density – without damaging the crown.

The story may or may not be true, but the message is important – new understanding often  appears in a “flash of insight” when a conscious experience unblocks an unconscious conflict. Reality provides the nudge.

Improvement means change, change means learning, and learning means new understanding.  So facilitating improvement boils down to us a series of reality nudges that change our understanding step-by-step.

The problem is that reality is messy and complicated and noisy. There are reality nudges coming at us from all directions and all the time – and to avoid being overwhelmed we filter most of them out – the ones we do not understand.  This unconscious habit of discounting the unknown creates the state of blissful ignorance but has the downside of preventing us from learning and therefore preventing us from improving.

Occasionally a REALLY BIG REALITY NUDGE comes along and we are forced to take notice – this is called a smack – and it is painful and has the downside of creating an angry backlash.

The famous scientist Louis Pasteur is reported to have said “Chance favours the prepared mind” which means that when conditions are right (the prepared mind) a small, random nudge (chance) can trigger a Eureka effect.  What he is saying is that to rely on chance to improve we must prepare the context first.

The way of doing this is called structured reality – deliberately creating a context so the reality nudge has maximum effect.  So to learn and improve and at the same time avoid painful smacks we need to structure the reality so that small nudges are effective – and that is done using carefully designed reality immersion experiences.

The effect is remarkable – it is called the Eureka effect – and it is a repeatable and predictable phenomenon.

This is how the skills of Improvement Science are spread. Facilitators do not do it by delivering a lecture; or by distributing the theory in papers and books; or by demonstrating their results as case studies; or by dictating the actions of others.  Instead they create the context for learning and, if reality does not oblige, at just the right time and place they apply the nudge and …. Eureka!

The critical-to-success factor is creating the context – and that requires an effective design – it cannot be left to chance. 

The Hierarchy of Constraints

Improvements need to be sustained – but not forever.

They should be worthwhile on their own and also provide a foundation for future improvement.

Improvement flows and it does so down the path of least resistance. Improvement will not flow up the path of most resistance. And resistance to flow is called a constraint.

 Many things flow: water, energy, money, data, ideas, knowledge, influence – the list is endless – so the list of possible constraints is also endless.  But not all constraints are the same: a constraint that limits the flow of water – a dam for instance – does not limit the flow of ideas.

The flows and their constraints can be arranged on a contiuum with one end labelled “Physics” and the other end labelled “Paradigms”.  Physical flows are constrained by the Laws of the Universe which are absolute and stable. Philosophical flows are constrained by beliefs which are arbitrary and mutable.

This spectrum is often viewed as a hierarchy – with Paradigms at the top and Physics at the bottom – and between these limits there is a contiuum of constraints.  The Paradigm is completely abstract and intangible and is made actual through Policy, guided by Politics, and enforced by Police.  The root of all these words is “poli” which means “many” and implies the collective of people. So, a Policy is an arbitrary constraint that limits what is and what is not allowed. It is the social white line that indicates what behaviours the collective expect from the individual.  A Policy is implemented as a Process.

What actually happens is constrained by the Physics. Irrespective of the Paradigm, Policy and Process – if the Laws of Physics say something is impossible then it does not happen. It is impossible to squeeze, store or reverse time. It is impossible to do something that requires 30 mins of time in 5 minutes; it is impossible to store time to use later; it is impossible to rewind time go back to a previous point in time.

From the perspective of reality our hierarchy of constraints is upside down – Physics dictates what is possible irrespective of what the Paradigm indicates is believable.  What is believable may not be possible; and what is possible may not be believed.

Improvement Science is the art of the possible – of what the Laws of Physics do not forbid – a wide vista of opportunity.  It is now that our Paradigm acts as the constraint – and Improvement Science is the ability to challenge our Paradigm.  Only then can we create the Policy and the Process that will deliver actual, valuable and sustainable improvement.

Some parts of our Paradigm are necessary to provide explanation and meaning. Other parts are not needed – they are our “belief baggage” – the assumptions that we have picked up along the way; the mumbo-jumbo that obscures the true message. When we focus on the mumbo-jumbo we miss the message and we open the door to cynicism and distrust.

Our challenge is to separate the two – the wheat from the chaff; the diamond from the dross and the pearl-of-wisdom hidden in the ocean-of-data.  What do we actively include? What do we actively exclude? What do we actively remove? What do we actively improve?  We need to monitor all four parts of our Paradigm and that task is what The 4N Chart® was designed to help us do.

Click here get The 4N Chart template and here to get The 4N Chart instructions.

Steps, Streams, Silos and Swamps.

The late Steve Jobs created a world class company called Apple – which is now the largest and most successful technology company – eclipsing Microsoft.  The secret of the success of Apple is laid out in Steve Jobs biography – and can be stated in one word. Design.

Apple designs, develops and delivers great products and services  – ones that people want to own and to use.  That makes them cool. What is even more impressive is that Steve Jobs has done this in more than once and has reinvented more than one market: Apple Computers and the graphical personal computer;  Pixar and animated films; and Apple again with digital music, electronic publishing; and mobile phones.

The common themes are digital technology and end-to-end seamless integrated design of chips, devices, software, services and shops. Full vertical integration rather like Henry Ford’s verically integrated iron-ore to finished cars production line.  The Steve Jobs design paradigm is simplicity. It is much more difficult to design simplicity than to evolve complexity and his reputation was formidable. He was a uncompromising perfectionist who sacrificed feelings on the alter of design perfection. His view of the world was binary – it was either great or crap – meaning it was either moving towards perfection or away from it.

What Steve Jobs created was a design stream out of which must-have products and services flowed – and he did it by seeing all the steps as part of one system and aligned with one purpose.  He did not allow physical or psychological silos to form and he did this by challenging anything and everything.  Many could not work in this environment and left, many others thrived and delivered far beyond what they believed they could do.

Other companies were swamps. Toxic emotional waste swamps of silos, politics and turf wars.  Apple computers itself when through a phase when Steve Jobs was “ejected” and without its spiritual leader the company slipped downhill. He was enticed back and Apple was reborn and went on to create the iMac, iPod, iTunes, iPhone, iPad and now iCloud. Revolutioning the world of digital commnication.

The image above is a satellite view of a delta – a complex network of interconnected streams created by a river making its way to the sea through a swamp.  The structure of the delta is constantly changing and evolving so it is easy to get lost it in, to get caught in a dead-end, or stuck in the mud. Only travel by small boat is possible and that is often both ineffective and inefficient.

Many organistions are improvement science swamps. The stream of innovative ideas gets fragmented by the myriad of everchanging channels; caught in political dead-ends; and stuck in the mud of bureaucracy.  Only small, skillfully steered ideas will trickle  through – but this trickle is not enough to keep the swamp from silting up. Eventually the resistance to change reaches a critical level and the improvement stream is forced to change course – diverting the flow of change away from the swamp – and marooning the stick-in-the-muds to slowly sink and expire in the bureaucratic gloop that they spawned.

Steve Jobs’ legacy to us is a lesson. To create a system that continues to deliver and delight we need to start by learning how to design the steps, then to design the streams of steps to link seamlessly, and finally to design the system of streams to synergise as sophisticated simplicity.

Improvement cannot be left to chance in the blind hope that excellence will evolve spontaneously. Evolution is both ineffective and inefficient and is more likely to lead to dissipated and extravagant complexity than aligned and elegant simplicity.

Improvement is a science that sits at the cross-roads of humanity and technology.

Life on the Fence

Long, long ago in a land far, far away there were two kings who ruled neighbouring kingdoms.

King Bore liked things to be completely predictable and risk free. His subjects were happy with his Laws, there was no fear, and nothing ever changed. Everyday was as it had always been for as long as anyone could remember.

King Ran was the opposite – he liked things to be unpredictable and risky. His subjects were happy with his Laws, there was always excitement, and nothing ever stayed the same. Everyday was never the same as anyone could remember.

The kingdoms were named after the two rulers – Boredom and Random.

A fence marked the boundary between their domains – and despite their different cultures, most of the citizens lived near the Fence and spent much of their time sitting on it and debating what lay on either side. Their debates lasted for generations.

The Boredoms argued for doing everything the same as before; while the Randoms argued for doing everything different.

The fence was not fixed – it was continually being removed and rebuilt. Sometimes the Randoms brought news of exciting new discoveries and shared it during their Fence debates. Those who were convinced by the evidence would vote to incorporate the new knowledge and move the fence towards the Random reward. At other times the Randoms shared news of catastrophes and the Fence Sitters would voted to move the fence away from the Random Risk. Everyone could choose to live where the balance of stability and instability felt most comfortable for them. Everyone was happy.

One day a Great and Unexpected Storm arrived and devastated both kingdoms.

When the storm has passed the surviors emerged from their shelters and surveyed the damage.  Most of Boredom had been blown or washed away because its inhabitants were unable to react to the unexpected threat. Random was always changing anyway so the storm appeared to have little effect but there were many who had also been blown or washed away.

The survivors were those who had sheltered closest to the Fence – but the Fence had been smashed – so the survivors rebuilt the Fence – and continued to live as before – debating the next move – not knowing when the next storm might arrive – but feeling more confident that at least some of them would survive.

After each Storm the populations of Boredom and Random were reduced – those who preferred to live furthest from the Fence were less likely to survive – and after each storm the Kingdom of Random gained ground. The survivors were those most able to balance conservative with creative.

Between the Storms new discoveries became incorporated and ossified as dogma and the Kingdom of Boredom gained ground as the balance shifted – until a Storm would once again smash the complacency and force a rebuilding.

It appeared that the key to survival was to learn how to both sit on the Fence and to keep a foot on both sides and to be ready to jump one way or the other to shelter from the Storm.

Backs Against The Wall

It is surprising how often we do nothing until we have run out of options to prevaricate and only when our backs are against the wall do we act positively, decisively and effectively.  What is the reason we did not act earlier? Did we not see the way forward? Were there to many options to choose from? Or was the most effective option the least comfortable?  We have a bad habit of putting off decisions and actions until the last minute of the eleventh hour. Perhaps we just hope that the problem will go away without us having to get out of our comfort zones.

In reality few escape the back-to-the-wall scenario: most are caught, killed and eaten.  Turkeys unwittingly voting for Christmas by doing nothing.

 It is a better survival strategy to avoid the backs-to-the-wall scenario. 

So, what are the symptoms of the earlier prevarication stage? What behaviours do we exhibit? And what can we do? 

One is blindness/deafness – otherwise known as denial. We see the message but we do not acknowledge it because to do so means we have signalled that we are aware of it. Painfully aware perhaps.

One is bending/dodging – otherwise known as distortion. We see the problem and we are forced to acknowledge it because someone up the tree makes it our problem and monitors our performance. They set a target and attach some form of motivator to it – either a carrot or a stick – it matters not.  It is surprising how creative people can be when caught between a rock and a hard place!

One is burying/deceiving – otherwise known as deletion.  We delete the bad news completely so the performance looks better than it really is and thereby try to evade the persecutor by not attracting attention.  This is our last option because we know if we are found out then we will be for the chop.

Our final option, when our backs are against the wall and the spot light is on us – is to face the problem and solve it – and surprise ourselves that we can, and in fact always could have done.

So to avoid the back-to-the-wall experience it is necessary to be alert to the early symptoms. The deafening silence that follows someone prepared to talk about the problem; the frantic activity required to bend the rules and distort the system; and the furtive looks of those who are deliberately hiding the awful reality.  If any of these symptoms are detected we need to add the magic ingredients – confidence and competence. The confidence to raise the issues and the competence to dissolve their root causes.

Confidence follows from competence; and competence follows from practice; and practice follows from know how; and know how follows from learning; and learning follows from asking.

Ask to See One – Do Some – Teach Many.

Leading from the Middle

Cuthbert Simpson is reputed to be the first person to be “stretched” during the reign of Mary I – pulled in more than one direction at the same time while trying, in vain, to satisfy the simultaneous demands of his three interrogators.

Being a middle manager in a large organisation feels rather like this – pulled in many directions trying to satisfy the insatiable appetites for improvement of Governance (quality), Operations (delivery) and Finance (productivity).

The critical-to-survival skill for the over-stretched middle manager is the ability to influence others – or rather three complementary influencing styles.

One dimension is vertical and strategic-tactical and requires using the organisational strategy to influence operational tactics; and to use front line feedback to influence future strategic decisions. This influencing dimension requires two complementary styles of behaviour: followership and leadership.  

One dimension is horizontal and operational and requires influencing peer-middle-managers in other departpments. This requires yet a different style of leadership: collaboration.

The successful middle manager is able to switch influencing style as effortlessly as changing gear when driving. Select the wrong style at the wrong time and there is an unpleasant grating of teeth and possibly a painful career-grinding-to-a-halt experience.

So what do these three styles have to do with Improvement Science?

Taking the last point first.  Middle managers are the lynch-pin on which whole system improvement depends.  Whole system improvement is impossible without their commitment – just as a car without a working gearbox is just a heap of near useless junk.  Whole system improvement needs middle managers who are skilled in the three styles of behaviour.

The most important style is collaboration – the ability to influence peers – because that is the key to the other two.  Let us consider a small socioeconomic system that we all have experience of – the family. How difficult is it to manage children when the parent-figures do not get on with each other and who broadcast confusingly mixed messages? Almost impossible. The children learn quickly to play one off against the other and sit back and enjoy the spectacle.  And as a child how difficult it is to manage the parent-figures when you are always fighting and arguing with your siblings and peers and competing with each other for attention? Almost impossible again. Children are much more effective in getting what they want when they learn how to work together.

The same is true in organisations. When influencing from-middle-to-strategic it is more effective to influence your peers and then work together to make the collective case; and when influencing from-middle-to-tactical it is more effective to influence your peers and then work together to set a clear and unambiguous expectations.

The key survival skill is the ability to influence your peers effectively and that means respect for their opinion, their knowledge, their skill and their time – and setting the same expectation of them. Collaboration requires trust; and trust requires respect; and respect is earned by example.

PS. It also helps a lot to be able to answer the question “Can you show us how?”

The Frozen Planet

This is a picture of one of the vast Antarctic ice shelves breaking up and fracturing into huge icebergs that then float northwards and melt. This happens every Antarctic summer as the frozen surface of the sea thaws. It refreezes in the winter and completes a natural cycle that is driven by the rotation of the Earth around the Sun.  Clever as we see ourselves we have no influence at the solar scale. The Earth has been circling the Sun for 4.5 billion years so what is the issue?

The issue is that the ice shelves are getting smaller each year.

When they refreeze in winter they do not freeze as far; and when they thaw in the summer the melting edge creeps ever closer to the dry and barren land. This has immediate, direct and dire implications for the life that finds its food in the well-stocked acquatic larder under the ice.  It has delayed, indirect, yet equally dire implications for life that does not live there – and that includes us. 

As each iceberg melts the liberated water has to go somewhere – into the sea – so the average sea level rises a fraction. If enough volume of polar ice melts then the sea level may rise enough to flood low-lying land and displace the people who make their living there. Is there enough ice in the melting shelf to do this? No. That isn’t the problem. The problem is that the ice shelf does something else – it acts as a “plug” that holds back the vast ice sheet that covers the Antarctic continent. And there is a lot of it – about 5 million square miles with an average depth of 1 mile; that is about 5 million cubic miles of  water-in-progress (WIP). The surface area of our oceans is around 140 million square miles – so if  all the Antarctic ice slid down the hill into the sea, broke off as icebergs, floated north and melted then the sea level would rise by 5/140 ths of a mile which is 63 yards or 188 feet.  Oh dear! A large proportion of our most densely populated areas lie below that new sea level.

But let us not not worry about that too much – it won’t happen in the next ten or twenty years. The idealistic-optimist-academics can always hope that Science will come to the rescue and provide innovative solutions that will avert the disaster. That is what we pay our scientists to do after all. The realistic-pessimist-pragmatists have a Plan B: we will just up sticks and move as the waters rise slowly higher. We could do with some new beach side real estate opportunities anyway!  We just need to plot the 60 yard contour line and stake our claim on it early! What is all the fuss about?

It is not only the rising level of water that we need to worry about – it is something else – something that is much less tangible. We need to worry about the rising level of expectation.  And we need to worry because it happens over a much short time scale and by a much greater degree.

On the global scale we have short lives and even shorter memories.  We see what others have and we want the same: we want e-quality and we want it now. In the affluent countries we expect universal health, education and welfare almost as a right – in the less afflunet these are all luxuries. Those we assign the power to make it happen, our elected politicians, have the same expectations – so they get what they want. As we race to grow our economies, anyone who cannot keep up is labelled as a loser.  Flat economic growth is perceived as a warning sign; and a shrinking economy is treated as a failure. The growth-at-any-cost merchants fuel the national fear with emotionally charged words such as “recession”, “depression” and “disaster”.  We are brainwashed to believe that the only way to meet rising expectation is to grow bigger BUT we are doing it by squandering our future needs to satisfy our immediate wants. We are borrowing our future wealth and spending it now – with no coherent plan for settling the loan.  We are living in hope and in denial. Greece, Italy and Ireland are tangible examples. 

This is not sustainable: there is economic chaos that threatens to drown Europe in a rising tide of national structural debt, doubt, confusion and legally enforced austerity measures. It takes a brave person to stand up and say – this is not sustainable.

If feels as though we are at a crossroads and we appear to  have only three choices:

1. Discount the issue; huddle to gether for security on our melting iceberg and hope that someone or something comes to our rescue;

2. Panic and adopt the every-man-for-himself approach, leap into the sea and swim off in all directions in the hope that some of use find unknown dry land before we drown;

3. Learn to preserve what we have and to search for new paradigms that are sustainable into the future. Learn to grow better rather than bigger and learn to meet rising expectation within the limits of the finite global resources. Learn how to improve.

Option 3 gets my vote!

NIGYYSOB

This is the image of an infamous headline printed on May 4th 1982 in a well known UK newspaper.  It refers to the sinking of the General Belgrano in the Falklands war.

It is the clarion call of revenge – the payback for past grievances.

The full title is NIGYYSOB which stands for Now I Gotcha You Son Ofa B**** and is the name of one of Eric Berne’s Games that People Play.  In this case it is a Level 4 Game – played out on the global stage by the armed forces of the protagonists and resulting in both destruction and death.


The NIGYYSOB game is played out much more frequently at Level 1 – in the everyday interactions between people – people who believe that revenge has a sweet taste.

The reason this is important to the world of Improvement Science is because sometimes a well-intentioned improvement can get unintentionally entangled in a game of NIGYYSOB.

Here is how the drama unfolds.

Someone complains frequently about something that is not working, a Niggle, that they believe that they are powerless to solve. Their complaints are either ignored, discounted or not acted upon because the person with the assumed authority to resolve it cannot do so because they do not know how and will not admit that.  This stalemate can fester for a long time and can build up a Reservoir of Resentment. The Niggle persists and keeps irritating the emotional wound which remains an open cultural sore.  It is not unusual for a well-intentioned third party to intervene to resolve the standoff but as they too are unable to resolve the underlying problem – and all that results is either meddling or diktat which can actually make the problem worse.

The outcome is a festering three-way stalemate with a history of failed expectations and a deepening Well of Cynicism.

Then someone with an understanding of Improvement Science appears on the scene – and the stage is set for a new chapter of the drama because they risk of being “hooked” into The Game.  The newcomer knows how to resolve the problem and, with the grudging consent of the three protagonists, as if by magic, the Niggle is dissolved.  Wow!   The walls of the Well of Cynicism are breached by the new reality and the three protagonists suddenly realise that they may need to radically re-evaluate their worldviews.  That was not expected!

What can happen next is an emotional backlash – rather like a tight elastic band being released at one end. Twang! Snap! Ouch!


We all have a the same psychological reaction to a sudden and surprising change in our reality – be it for the better or for the worse. It takes time to adjust to a new worldview and that transition phase is both fragile and unstable; so there is a risk of going off course.

Experience teaches us that it does not take much to knock the tentative improvement over.


The application of Improvement Science will generate transitions that need to be anticipated and proactively managed because if this is not done then there is a risk that the emotional backlash will upset the whole improvement apple-cart.

What appears to occur is: after reality shows that the improvement has worked then the realisation dawns that the festering problem was always solvable, and the chronic emotional pain was avoidable. This comes as a psychological shock that can trigger a reflex emotional response called anger: the emotion that signals the unconscious perception of sudden loss of the old, familiar, worldview. The anger is often directed externally and at the perceived obstruction that blocked the improvement; the person who “should” have known what to do; often the “boss”.  This backlash, the emotional payoff, carries the implied message of “You are not OK because you hold the power, and you could not solve this, and you were too arrogant to ask for help and now I have proved you wrong and that I was right all the time!”  Sweet-tasting revenge?

Unfortunately not. The problem is that this emotional backlash damages the fragile, emerging, respectful relationship and can effectively scupper any future tentative inclinations to improve. The chronic emotional pain returns even worse than before; the Well of Cynicism deepens; and the walls are strengthened and become less porous.

The improvement is not maintained and it dies of neglect.


The reality of the situation was that none of the three protagonists actually knew what to do – hence the stalemate – and the only way out of that situation is for them all to recognise and accept the reality of their collective ignorance – and then to learn together.

Managing the improvement transition is something that an experienced facilitator needs to understand. If there is a them-and-us cultural context; a frustrated standoff; a high pressure store of accumulated bad feeling; and a deep well of cynicism then that emotional abscess needs to diagnosed, incised and drained before any attempt at sustained improvement can be made.

If we apply direct pressure on an emotional abscess then it is likely to rupture and squirt you with cynicide; or worse still force the emotional toxin back into the organisation and poison the whole system. (Email is a common path-of-low-resistance for emotional toxic waste!).

One solution is to appreciate that the toxic emotional pressure needs to be released in a safe and controlled way before the healing process can start.  Most of the pain goes away as soon as the abscess is lanced – the rest dissipates as the healing process engages.

One model that is helpful in proactively managing this dynamic is the Elizabeth Kubler-Ross model of grief which describes the five stages: denial, anger, bargaining, depression, and acceptance.  Grief is the normal emotional reaction to a sudden change in reality – such as the loss of a loved one – and the same psychological process operates for all emotionally significant changes.  The facilitator just needs to provide a game-free and constructive way to manage the anger by reinvesting the passion into the next cycle of improvement.  A more recent framework for this is the Lewis-Parker model which has seven stages:

  1. Immobilisation – Shock. Overwhelmed mismatch: expectations vs reality.
  2. Denial of Change – Temporary retreat. False competence.
  3. Incompetence – Awareness and frustration.
  4. Acceptance of Reality – ‘Letting go’.
  5. Testing – New ways to deal with new reality.
  6. Search for Meaning – Internalisation and seeking to understand.
  7. Integration – Incorporation of meanings within behaviours.

An effective tool for getting the emotional rollercoaster moving is The 4N Chart® – it allows the emotional pressure and pain to be released in a safe way. The complementary tool for diagnosing and treating the cultural abscess is called AFPS (Argument Free Problem Solving) which is a version of Edward De Bono’s Six Thinking Hats®.

The two are part of the improvement-by-design framework called 6M Design® which in turn is a rational, learnable, applicable and teachable manifestation of Improvement Science.


Pushmepullyu

The pushmepullyu is a fictional animal immortalised in the 1960’s film Dr Dolittle featuring Rex Harrison who learned from a parrot how to talk to animals.  The pushmepullyu was a rare, mysterious animal that was never captured and displayed in zoos. It had a sharp-horned head at both ends and while one head slept the other stayed awake so it was impossible to sneak up on and capture.

The spirit of the pushmepullyu lives on in Improvement Science as Push-Pull and remains equally mysterious and difficult to understand and explain. It is confusing terminology. So what does Push-Pull acually mean?

To decode the terminology we need to first understand a critical metric of any process – the constraint cycle time (CCT) – and to do that we need to define what the terms constraint and cycle time mean.

Consider a process that comprises a series of steps that must be completed in sequence.  If we put one task through the process we can measure how long each step takes to complete its contribution to the whole task.  This is the touch time of the step and if the resource is immediately available to start the next task this is also the cycle time of the step.

If we now start two tasks at the same time then we will observe when an upstream step has a longer cycle time than the next step downstream because it will shadow the downstream step. In contrast, if the upstream step has a shorter cycle time than the next step down stream then it will expose the downstream step. The differences in the cycle times of the steps will determine the behaviour of the process.

Confused? Probably.  The description above is correct BUT hard to understand because we learn better from reality than from rhetoric; and we find pictures work better than words.  Pragmatic comes before academic; reality before theory.  We need a realistic example to learn from.

Suppose we have a process that we are told has three steps in sequence, and when one task is put through it takes 30 mins to complete.  This is called the lead time and is an important process output metric. We now know it is possible to complete the work in 30 mins so we can set this as our lead time expectation.  

Suppose we plot a chart of lead times in the order that the tasks start and record the start time and lead time for each one – and we get a chart that looks like this. It is called a lead time run chart.  The first six tasks complete in 30 mins as expected – then it all goes pear-shaped. But why?  The run chart does not tell  us the reason – it just alerts us to dig deeper. 

The clue is in the run chart but we need to know what to look for.  We do not know how to do that yet so we need to ask for some more data.

We are given this run chart – which is a count of the number of tasks being worked on recorded at 5 minute intervals. It is the work in progress run chart.

We know that we have a three step process and three separate resources – one for each step. So we know that that if there is a WIP of less than 3 we must have idle resources; and if there is a WIP of more than 3 we must have queues of tasks waiting.

We can see that the WIP run chart looks a bit like the lead time run chart.  But it still does not tell us what is causing the unstable behaviour.

In fact we do already have all the data we need to work it out but it is not intuitively obvious how to do it. We feel we need to dig deeper.

 We decide to go and see for ourselves and to observe exactly what happens to each of the twelve tasks and each of the three resources. We use these observations to draw a Gantt chart.

Now we can see what is happening.

We can see that the cycle time of Step 1 (green) is 10 mins; the cycle time for Step 2 (amber) is 15 mins; and the cycle time for Step 3 (blue) is 5 mins.


This explains why the minimum lead time was 30 mins: 10+15+5 = 30 mins. OK – that makes sense now.

Red means tasks waiting and we can see that a lead time longer than 30 mins is associated with waiting – which means one or more queues.  We can see that there are two queues – the first between Step 1 and Step 2 which starts to form at Task G and then grows; and the second before Step 1 which first appears for Task J  and then grows. So what changes at Task G and Task J?

Looking at the chart we can see that the slope of the left hand edge is changing – it is getting steeper – which means tasks are arriving faster and faster. We look at the interval between the start times and it confirms our suspicion. This data was the clue in the original lead time run chart. 

Looking more closely at the differences between the start times we can see that the first three arrive at one every 20 mins; the next three at one every 15 mins; the next three at one every 10 mins and the last three at one every 5 mins.

Ah ha!

Tasks are being pushed  into the process at an increasing rate that is independent of the rate at which the process can work.     

When we compare the rate of arrival with the cycle time of each step in a process we find that one step will be most exposed – it is called the constraint step and it is the step that controls the flow in the whole process. The constraint cycle time is therefore the critical metric that determines the maximum flow in the whole process – irrespective of how many steps it has or where the constraint step is situated.

If we push tasks into the process slower than the constraint cycle time then all the steps in the process will be able to keep up and no queues will form – but all the resources will be under-utilised. Tasks A to C;

If we push tasks into the process faster than the cycle time of any step then queues will grow upstream of these multiple constraint steps – and those queues will grow bigger, take up space and take up time, and will progressively clog up the resources upstream of the constraints while starving those downstream of work. Tasks G to L.

The optimum is when the work arrives at the same rate as the cycle time of the constraint – this is called pull and it means that the constraint is as the pacemaker and used to pull the work into the process. Tasks D to F.

With this new understanding we can see that the correct rate to load this process is one task every 15 mins – the cycle time of Step 2.

We can use a Gantt chart to predict what would happen.

The waiting is eliminated, the lead time is stable and meeting our expectation, and when task B arrives thw WIP is 2 and stays stable.

In this example we can see that there is now spare capacity at the end for another task – we could increase our productivity; and we can see that we need less space to store the queue which also improves our productivity.  Everyone wins. This is called pull scheduling.  Pull is a more productive design than push. 

To improve process productivity it is necessary to measure the sequence and cycle time of every step in the process.  Without that information it is impossible to understand and rationally improve our process.     

BUT in reality we have to deal with variation – in everything – so imagine how hard it is to predict how a multi-step process will behave when work is being pumped into it at a variable rate and resources come and go! No wonder so many processes feel unpredictable, chaotic, unstable, out-of-control and impossible to both understand and predict!

This feeling is an illusion because by learning and using the tools and techniques of Improvement Science it is possible to design and predict-within-limits how these complex systems will behave.  Improvement Science can unravel this Gordian knot!  And it is not intuitively obvious. If it were we would be doing it.

FISH

Several years ago I read an inspirational book called Fish! which recounts the tale of a manager who is given the task of “sorting out” the worst department in her organisation – a department that everyone hated to deal with and that everyone hated to work in. The nickname was The Toxic Energy Dump.

The story retells how, by chance, she stumbled across help in the unlikeliest of places – the Pike Place fish market in Seattle.  There she learned four principles that transformed her department and her worklife:

1. Work Made Fun Gets Done
2. Make Someone’s Day
3. Be Fully Present
4. Choose Your Attitude

 The take home lesson from Fish! is that we make our work miserable by the way we behave towards each other.   So if we are unhappy at work and we do nothing about our behaviour then our misery will continue.

This means we can choose to make work enjoyable – and it is the responsibility of leaders at all levels to create the context for this to happen.  Miserable staff = poor leadership.  And leadership starts with the leader.  

  • Effective leadership is inspiring others to achieve through example.
  • Leadership does not work without trust. 
  • Play is more than an activity – it is creative energy – and requires a culture of trust not a culture of fear. 
  • To make someone’s day all you need to so is show them how much you appreciate them. 
  • The attitude and behaviour of a leader has a powerful effect on those that they lead.
  • Effective leaders know what they stand for and ask others to hold them to account.

FISH has another meaning – it stands for Foundations of Improvement Science for Health – and it is the core set of skills needed to create a SELF – a Safe Environment for Learning and Fun.  The necessary context for culture change. It is more than that though – FISH also includes the skills to design more productive processes – releasing valuable lifetime and energy to invest in creative fun.  

Fish are immersed in their environment – and so are people. We learn by immersion in reality. Rhetoric – be it thinking, talking or writing – is a much less effective teacher.

So all we have to do is co-create a context for improvement and then immerse ourselves in it. The improvement that results is an inevitable consequence of th design. We design our system for improvement and it improves itself.

To learn more about Foundations of Improvement Science for Health (FISH)  click: here 

Single Sell System

In the pursuit of improvement it must be remembered that the system must remain viable: better but dead is not the intended outcome.  Viability of socioeconomic systems implies that money is flowing to where it is needed, when it is needed and in the amounts that are needed.

Money is like energy – it only does worthwhile work when it is moving: so the design of more effective money-streams is a critical part of socioeconomic system improvement.

But this is not easy or obvious because the devil is in the detail and complexity grows quicklyand obscures the picture. This lack of clear picture creates the temptation to clean, analyse, simplify and conceptualise and very often leads to analysis-paralysis and then over-simplification.

There is a useful metaphor for this challenge.

Biological systems use energy rather than money and the process of improvement has a different name – it is called evolution. Each of us is an evolution experiment. The viability requirement is the same though – the success of the experiment is measured by our viability. Do our genes and memes survive after we have gone?

It is only in recent times that the mechanism of this biological system has become better understood. It was not until the 19th Century that we realised that complex organisms were made of reproducing cells; and later that there were rules that governed how inherited characteristics passed from generation to generation; and that the vehicle of transmission was a chemical code molecule called DNA that is present in every copy of every cell capable of reproduction.

We learned that our chemical blueprint is stored in the nucleus of every cell (the dark spots in the picture of cells) and this led to the concept that the nucleus worked like a “brain” that issues chemical orders to the cell in the form of a very similar molecule called RNA.  This cellular command-and-control model is unfortunately more a projection of the rhetoric of society than the reality of the situation. The nucleus is not a “brain” – it is a gonad. The “brain” of a cell is the surface membrane – the sensitive interface between outside and inside; where the “sensor” molecules in the outer cell membrane connect to “effector” molecules on the inside.  Cells think with their skin – and their behaviour is guided by their  internal content and external context. Nature and nurture working as a system.

Cells have evolved to collaborate. Rogue cells that become “mentally” unstable and that break away, start to divide, and spread in an uncollaborative and selfish fashion threaten the viability of the whole: they are called malignant. The threat of malignant behaviour to long term viability is so great that we have evolved sophisticated mechanisms to detect and correct malignant behaviour. The fact that cancer is still a problem is because our malignancy defense mechanisms are not 100% effective. 

This realisation of the importance of the cell has led to a focus of medical research on understand how individual cells “sense”, “think”, “act” and “communicate” and has led to great leaps in our understanding of how multi-celled systems called animals and plants work; how they can go awry; and what can be done to prevent and correct these cellular niggles.  We are even learning how to “fix” bits of the the chemical blueprint to correct our chemical software glitches. We are no where near being able to design a cell from scratch though. We simply do not understand enough about how it works.

In comparison, the “single-sell” in an economic system could be considered to be a step in a process – the point where the stream and the silo meet – where expenses are converted to revenue for example.  I will wantonly bend the rules of grammar and use the word “sell” to distinguish it visually from “cell”. So before trying to understand the complex emergent behaviour of a multi-selled economic system we first need to understand better one sell works. How does work flow and time flow and money flow combined at the single sell?

When we do so we learn that the “economic mechanism” of a single sell can be described completely because it is a manfestation of the Laws of Physics – just as the mechanism of the weather can be describe using a small number of equations that combine to describe the flow, pressure, density, temperature etc of the atmospheric gases.  Our simplest single-selled economic system is described by a set of equations – there are about twenty of them in fact.

So, trying to work out in our heads how even a single sell in an economic system will behave amounts to mentally managing twenty simultanous equations – which is a bit of a problem because we’re not very good at that mental maths trick. The best we can do is to learn the patterns in the interdependent behaviour of the outputs of the equations; to recognise what they imply; and then how to use that understanding to craft wiser decisions.

No wonder the design of a viable socioeconomic multi-selled system seems to be eluding even the brightest economic minds at the moment!  It is a complicated system which exhibits complex behaviour.  Is there a better approach?  Our vastly more complex biological counterparts called “organisms” seem to have discovered one. So what can we learn from them?

One lesson might be that is is a good design to detect and correct malignant behaviour early; the unilateral, selfish, uncollaborative behaviour that multiplies, spreads, and becomes painful, incurable then lethal.

First we need to raise awareness and recognition of it … only then can we challenge and contain its toxic legacy.   

Systemory

How do we remember the vast amount of information that we seem to be capable of?

Our brains are comprised of billions of cells most of which are actually inactive and just there to support the active brain cells – the neurons.

Suppose that the active brain cell part is 50% and our brain has a volume of about 1.2 litres or 1,200 cu.cm or 1,200,000 cu.mm. We know from looking down a microscope that each neuron is about 20/1,000 mm x 20/1,000 mm  x 20/1,000 mm which gives a volume of 8/1,000,000 cu.mm or 125,000 neurons for every cu.mm. The population of a medium sized town in a grain of salt!  This is a concept we can just about grasp. And with these two facts we estimate that there are in the order of 140,000,000,000 neurons in a human brain – 140 billion – about 20 times the population of the whole World. Wow!

But even that huge number is less than the size of the memory on the hard disc of the computer I am writing this blog on – which has 200 gigabytes which is 1,600 gigabits which is 1,600 billion bits. Ten times as many memory cells as there are neurons in a human brain. 

But our brains are not just for storing data – they do all the data processing too – it is an integrated processor-and-memory design completely unlike the separate processor-or-memory design of a digital computer.  Each of our brains is remarkable in its capability, adaptability, and agility – its ability to cope with change – its ability to learn and to change its behaviour while still working.  So how does our biological memory work?

Well not like a digital computer where the zeros and ones, the binary digits (bits) are stored in regular structure of memory cells – a static structural memory – a data prison.  Our biological memory works in a completely different way – it is a temporal memory – it is time dependent. Our memories are not “recalled” like getting a book out of an indexed slot on a numbered in a massive library; are memories are replayed like a recording or rebuilt from a recipe. Time is the critical factor and this concept of temporal memory is a feature of all systems.

And that is not all – the temporal memory is not a library of video tapes – it is the simultaneous collective action of many parts of the system that create the illusion of the temporal memory – we have a parallel-distributed-temporal-memory. More like a video hologram. And it means we cannot point to the “memory” part of our brains – it is distributed throughout the system – and this means that the connections between the parts are as critical a part of the design and the parts themselves. It is a tricky concept to grasp and none of the billions of digital computers that co-inhabit this planet operate this way. They are feeble and fragile in comparison. An inferior design.

The terms distributed-temporal or systemic-memory are a bit cumbersome though so we need a new label – let us call it a systemory.  The properties of a systemory are remarkable – for example it still works when a bit of the systemory is removed.  When a bit of your brain is removed you don’t “forget” a bit of your name or lose the left ear on the mental picture of your friends face – as would happen with a computer.  A systemory is resilient to damage which is a necessary design-for-survival. It also implies that we can build our systemory with imperfect parts and incomplete connections. In a digital computer this would not work: the localised-static or silo-memory has to be perfect because if a single bit gets flipped or a single wire gets fractured it can render the whole computer inoperative useless junk.

Another design-for-survival property of a systemory is that it still works even when it is being changed – it is continuously adaptable and updateable.  Not so a computer – to change the operating system the computer has to be stopped, the old program overwritten by the new one, then the new one started. In fact computers are designed to prevent programs modifying themselves – because it a sure recipe for a critical system failure – the dreaded blue screen!

So if we map our systemory concept across from person to population and we replace neurons with people then we get an inkling of how a society can have a collective memory, a collective intelligence, a collective consciousness even – a social systemory. We might call that property the culture.  We can also see that the relationships that link the people are as critical as the people themselves and that both can be imperfect yet we get stable and reliable behaviour. We can also see that influencing the relationships between people has as much effect on the system behaviour as how the people themselves perform – because the properties of the systemory are emergent. Culture is an output not an input.

So in the World – the development of global communication systems means that all 7 billion people in the global social systemory can, in principle, connect to each other and can collectively learn and change faster and faster as the technology to connect more widely and more quickly develops. The rate of culture change is no longer governed by physical constraints such as geographic location, orand temporal constraints such as how long a letter takes to be delivered.

Perhaps the most challenging implication is that a systemory does not have a “point of control” – there is no librarian who acts as a gatekeeper to the data bank, no guard on the data prison.  The concept of “control” in a systemory is different – it is global not local – and it is influence not control.  The rapid development of mobile communication technology and social networking gives ample evidence – we would now rather communicate with a familar on the other side of the world than with a stranger standing next to us in the lunch queue. We have become tweeting and texting daemons.  Our emotional relationships are more important than our geographical ones. And if enough people can connect to each other they can act in a collective, coordinated, adaptive and agile way that no command-and-control system can either command or control. The recent events in the Middle East are ample evidence of the emergent effectiveness of a social systemory.

Our insight exposes a weakness of a social systemory – it is possible to adversely affect the whole by introducing a behavioural toxin that acts at the social connection level – on the relationships between people. The behavioural toxin needs only to have a weak and apparently harmless effect but when disseminated globally the cumulative effect creates cultural dysfunction.  It is rather like the effect of alcohol and other recreational chemical substances on the brain – it cause a temporary systemory dysfunction – but one that in an over-stressed psychological system paradoxically results in pleasure; or rather stress release. Hence the self-reinforcing nature of the addiction.  

Effective leaders are intuitively aware that just their behaviour can be a tonic or a toxin for the whole system: organisations are the the same emotional boat as their leader.

Effective leaders use their behaviour to steer the systemory of the organisation along a path of improvement and their behaviour is the output of their personal systemory.

Leaders have to be the change that they want their organisations to achieve.

Inspiration and Perspiration in SpaceTime

 An important difference between Leaders and Managers is their perception of SpaceTime. 

Leaders observe from a greater strategic distance so they have a wider horizon and they see more pattern and less detail. They see the forest rather than the trees.  Managers observe from a closer tactical vantage so they have a narrower horizon and see less context but they see more detail. Both maps are needed – broad brush and fine detail – but the map need to match the task and the person: sometimes the detail is critical; sometimes the detail is confusing.  

The same is the case for both Space and Time. Strategic space is global – tactical space is local. Strategic time is proactive – tactical time is reactive. Leaders Inspire and Plan the Work – Managers Perspire and Work the Plan.

It is interesting to observe what can happen when the same tool is applied in a strategic and in a tactical context. An  example is the RAG (Red Amber Green) method for reporting status.  The principle is that the colour indicates what to do: Green = Relax;  Amber = Alert; Red = React. 

Sounds easy enough so what is the problem?

The RAG method is designed to indicate our current status but status of what?  Our current position or our current course? Our course is given by a series of positions recorded over time on a chart – as a picture – and we use that to help us navigate – to plan an effective and efficient course to our intended destination.  Unexpected things can happen though – we can get swept and blown off course and we may come across an unexpected or unpredictable obstacles on our intended course. So we need to be able to navigate our way to our original destination by a new route. So imagine what could happen if we were only able to compare our current position with our target position and we only work to stay on target. We would be unable to adapt to a dynamically changing or unpredictable strategic context – we would be unwise to go off position because we would get lost.

So if we do not want to lose our way then we must ensure we know what our RAG is telling us – our position or our course. 


The Three Faces of Improvement Science

There is always more than one way to look at something and each perspective is complementary to the others.

Improvement Science has three faces: the first is the Process Face; the second is the People face and the third is the System face – and is represented in the logo with a different colour for each face.

The process face is the easiest to start with because it is logical, objective and absolute.  It describes the process; the what, where, when and how. It is the combination of the hardware and the software; the structure and the function – and it is constrained by the Laws of Physics.

The people face is emotional, subjective and relative.  It describes the people and their perceptions and their purposes. Each person interacts both with the process and with each other and their individual beliefs and behaviours drive the web of relationships. This is the world of psychology and politics.

The system face is neither logical nor emotional – it has characteristics that are easy to describe but difficult to define. Characteritics such a self-organisation; emergent behaviour; and complexity.  Our brains do not appear to be able to comprehend systems as easily and intuitively and we might like to believe. This is one reason why systems often feel counter-intuitive, unpredictable and mysterious. We discover that we are unable to make intuitive decisions that result in whole system improvement  because our intuition tricks us.

Gaining confidence and capability in the practical application of Improvement Science requires starting from our zone of relative strength – our conscious, logical, rational, explanable, teachable, learnable, objective dependency on the physical world. From this solid foundation we can explore our zone of self-control – our internal unconscious, psychological and emotional world; and from there to our zone of relative weakness –  the systemic world of multiple interdependencies that, over time, determine our individual and collective fate.

The good news is that the knowledge and skills we need to handle the rational physical process face are easy and quick to learn.  It can be done with only a short period of focussed, learning-by-doing.  With that foundation in place we can then explore the more difficult areas of people and systems.


The Devil and the Detail

There are two directions from which we can approach an improvement challenge. From the bottom up – starting with the real details and distilling the principle later; and from the top down – starting with the conceptual principle and doing the detail later.  Neither is better than the other – both are needed.

As individuals we have an innate preference for real detail or conceptual principle – and our preference is manifest by the way we think, talk and behave – it is part of our personality.  It is useful to have insight into our own personality and to recognise that when other people approach a problem in a different way then we may experience a difference of opinion, a conflict of styles, and possibly arguments.  

One very well established model of personality type was proposed by Carl Gustav Jung who was a psychologist and who approached the subject from the perspective of understanding psychological “illness”.  Jung’s “Psychological Types” was used as the foundation of the life-work of Isabel Briggs Myers who was not a psychologist and who was looking from the direction of understanding psychological “normality”. In her book Gifts Differing – Understanding Personality Type (ISBN 978-0891-060741) she demonstrates using empirical data that there is not one normal or ideal type that we are all deviate from – rather that there is a set of stable types that each represents a “different gift”. By this she means that different personality types are suited to different tasks and when the type resonantes with the task it results in high-performance and is seen an asset or “strength” and when it does not it results in low performance and is seen as a liability or “weakness”.

One of the multiple dimensions of the Jungian and Myers-Briggs personality type model is the Sensor – iNtuitor dimension the S-N dimension. This dimension represents where we hold our reference model that provides us with data – data that we convert to information – and informationa the we use to derive decisions and actions.

A person who is naturally inclined to the Sensor end of the S-N dimension prefers to use Reality and Actuality as their reference – and they access it via their senses – sight, sound, touch, smell and taste. They are often detail and data focussed; they trust their senses and their conscious awareness; and they are more comfortable with routine and structure.  

A person who is naturally inclined to the iNtuitor end of the S-N dimension prefers to use Rhetoric and Possibility as their reference and their internal conceptual model that they access via their intuition. They are often principle and concept focussed and discount what their senses tell them in favour their intuition. Intuitors feel uncomfortable with routine and structure which they see as barriers to improvement.  

So when a Sensor and an iNtuitor are working together to solve a problem they are approaching it from two different directions and even when they have a common purpose, common values and a common objective it is very likely that conflict will occur if they are unaware of their different gifts

Gaining this awareness is a key to success because the synergy of the two approaches is greater than either working alone – the sum is greater than the parts – but only if there is awareness and mutual respect for the different gifts.  If there is no awareness and low mutual respect then the sum will be less than the parts and the problem will not be dissolvable.

In her research, Isabel Briggs Myers found that about 60% of high school students have a preference for S and 40% have a preference for N – but when the “academic high flyers”  were surveyed the ratio was S=17%  and N=83% – and there was no difference between males and females.  When she looked at the S-N distribution in different training courses she discovered that there were a higher proportion of S-types in Administrators (59%), Police (80%), and Finance (72%) and a higher proportion of N-types in Liberal Arts (59%), Engineering (65%), Science (83%), Fine Arts (91%), Occupational Therapy (66%), Art Education (87%), Counselor Education (85%), and Law (59%).  Her observation suggested that individuals select subjects based on their “different gifts” and this throws an interesting light on why traditional professions may come into conflict and perhaps why large organisations tend to form departments of “like-minded individuals”.  Departments with names like Finance, Operations and Governance  – or FOG.

This insight also offers an explanation for the conflict between “strategists” who tend to be N-types and who naturally gravitate to the “manager” part of an organisation and the “tacticians” who tend to be S-types and who naturally gravitate to the “worker” part of the same organisation.

It  has also been shown that conventional “intelligence tests” favour the N-types over the S-types and suggests why highly intelligent academics my perform very poorly when asked to apply their concepts and principles in the real world. Effective action requires pragmatists – but academics tend to congregate in academic instituitions – often disrespectfully labelled by pragmatists as “Ivory Towers”.      

Unfortunately this innate tendency to seek-like-types is counter-productive because it re-inforces the differences, exacerbates the communication barriers,  and leads to “tribal” and “disrespectful” and “trust eroding” behaviour, and to the “organisational silos” that are often evident.

Complex real-world problems cannot be solved this way because they require the synergy of the gifts – each part playing to its strength when the time is right.

The first step to know-how is self-awareness.

If you would like to know your Jungian/MBTI® type you can do so by getting the app: HERE

Flap-Flop-Flip

The world seems to is getting itself into a real flap at the moment.

The global economy is showing signs of faltering – the perfect dream of eternal financial growth seems to be showing cracks and is increasingly looking tarnished.

The doom mongers are surprisingly quiet – perhaps because they do not have any new ideas either.


It feels like the system is heading for a big flop and that is not a great feeling.

Last week I posed the Argument-Free-Problem-Solving challenge – and some were curious enough to have a go. It seems that the challenge needs more explanation of how it works to create enough engagement to climb the skepticism barrier.

At the heart of the AFPS method is The 4N Chart® – a simple, effective and efficient way to get a balanced perspective of the emotional contours of the change terrain.  The improvement process boils down to recognising, celebrating, and maintaining the Nuggets, flipping the Niggles into NoNos and reinvesting the currencies that are released into converting NiceIfs into more Nuggets.

The trick is the flip.


To perform a flip we have to make our assumptions explicit – which means we have to use external reality to challenge our internal rhetoric.  We need real data – presented in an easily digestible format – as a picture – and in context which converts the data into information that we can then ingest and use to grow our knowledge and broaden our understanding.

To convert knowledge into understanding we must ask a question: “Is our assumption a generalisation from a specific experience?

For example – it is generally assumed that high utilisation is associated with high productivity – and we want high productivity so we push for high utilisation.  And if we look at reality we can easily find evidence to support our assumption.  If I have under-utilised fixed-cost resources and I push more work into the process, I see an increase the flow in the stream, and an increase in utilisation, and an increase in revenue, and no increase in cost – higher outcome: higher productivity.

But if we look more carefully we can also find examples that seem to disprove our assumption. I have under-utilised resources and I push more work into the process, and the flow increases initially then falls dramatically, the revenue falls, productivity falls and when I look at all my resources they are still fully utilised.  The system has become gridlocked – and when I investigate is discover that the resource I need to unlock the flow is tied up somewhere else in the process with more urgent work. My system does not have an anti-deadlock design.

Our rhetoric of generalisation has been challenged by the reality of specifics – and it only takes one example.  One black swan will disprove the generalisation that “all swans are white”.

We now know we need to flip the “general assumption” into “specific evidence” – changing the words “all”, “always”, “none” and “never” into “some” and “sometimes”.

In our example we flip our assumption into “sometimes utilisation and productivity go up together, and sometimes they do not”. This flip reveals a new hidden door in the invisible wall that limits the breadth of our understanding and that unconsciously hinders our progress.

To open that door we must learn how to tell one specific from another and opening that door will lead to a path of discovery, more knowledge, broader understanding, deeper wisdom, better decisions, more effective actions and sustained improvement.

Flap-Flop-Flip.


This week has seen the loss of one of the greatest Improvement Scientists – Steve Jobs – creator of Apple – who put the essence of Improvement Science into words more eloquently than anyone in his 2005 address at Stanford University.

“Your time is limited, so don’t waste it living someone else’s life. Don’t be trapped by dogma – which is living with the results of other people’s thinking. Don’t let the noise of other’s opinions drown out your own inner voice. And most important, have the courage to follow your heart and intuition. They somehow already know what you truly want to become. Everything else is secondary.” Steve Jobs (1955-2011).

And with a lifetime of experience of leading an organisation that epitomises quality by design Steve Jobs had the most credibility of any person on the planet when it comes to management of improvement.

Argument-Free-Problem-Solving

I used to be puzzled when I reflected on the observation that we seem to be able to solve problems as individuals much more quickly and with greater certainty than we could as groups.

I used to believe that having many different perspectives of a problem would be an asset – but in reality it seems to be more of a liability.

Now when I receive an invitation to a meeting to discuss an issue of urgent importance my little heart sinks as I recall the endless hours of my limited life-time wasted in worthless, unproductive discussion.

But, not to be one to wallow in despair I have been busy applying the principles of Improvement Science to this ubiquitous and persistent niggle.  And I have discovered something called Argument Free Problem Solving (AFPS) – or rather that is my name for it because it does what it says on the tin – it solves problems without arguments.

The trick was to treat problem-solving as a process; to understand how we solve problems as individuals; what are the worthwhile bits; and how we scupper the process when we add-in more than one person; and then how to design-to-align the  problem-solving workflow so that it …. flows. So that it is effective and efficient.

The result is AFPS and I’ve been testing it out. Wow! Does it work or what!

I have also discovered that we do not need to create an artificial set of Rules or a Special Jargon – we can  apply the recipe to any situation in a very natural and unobtrusive way.  Just this week I have seen it work like magic several times: once in defusing what was looking like a big bust up looming; once t0 resolve a small niggle that had been magnified into a huge monster and a big battle – the smoke of which was obscuring the real win-win-win opportunity; and once in a collaborative process improvement exercise that demonstrated a 2000% improvement in system productivity – yes – two thousand percent!

So AFPS  has been added to the  Improvement Science treasure chest and (because I like to tease and have fun) I have hidden the key in cyberspace at coordinates  http://www.saasoft.com/moodle

Mwah ha ha ha – me hearties! 

Cutting The Cost Cake

We are in now in cost cake cutting times! We are being forced by financial reality to tighten the fiscal belt until our eyeballs water – and then more so.

The cost cake is a mixture of three ingredients – the worthwhile, the necessary, and the rest – the stuff that is worthless and not wanted – the worthless stuff, the unhealthy stuff, the waste.  But it costs just as much per morsel as the rest. And there is a problem – all three ingredients are mixed up together and our weighing scales can not say how much of each is in there – it just tells us the total weight and cost.

If we are forced to cut the cost of the cake we have to cut all three. Our cake gets smaller – not better – which means that we all go a bit hungrier. Or as is more likely – the hand that weilds the knife will cut themselves a full slice and someone else will starve.

Would it not be better if we could separate out the ingredients and see them for what the are – worthy (green), necessary (yellow) and the worthless waste (red) – and then use the knife to slice off the waste?  Then we could mix up what is left and share out a smaller but healthier meal.  We might even re-invest our savings in buying more of the better ingredients and bake ourselves a healthier cake. We would have a choice. 

If we translate this culinary metaphor into the real world then we will see the need for a way of separating and counting the cost of time spent on worthy, necessary and worthless work. If we can do that then we can remove just the worthless stuff and either reduce the cost or  reinvest the resource in something more worthwhile.

The problem we find when we try to do this is that our financial accounting systems do not work this way.

The closed door to a healthier future is staring us in the face – it is barn-door obvious – we just need to design our accounting methods so that they can do what we need them to do.

What are we waiting for?  Let us work together to find a way to open that closed door. It is in all of our interests! 


The Cost of Distrust

Previously we have explored “costs” associated with processes and systems – costs that could be avoided through the effective application of Improvement Science. The Cost of Errors. The Cost of Queues. The Cost of Variation.

These costs are large, additive and cumulative and yet they pale into insignificance when compared with the most potent source of cost. The Cost of Distrust.

The picture is of Sue Sheridan and the link below is to a video of Sue telling her story of betrayed trust: in a health care system.  She describes the tragic consequences of trust-eroding health care system behaviour.  Sue is not bitter though – she remains hopeful that her story will bring everyone to the table of Safety Improvement

View the Video

The symptoms of distrust are easy to find. They are written on the faces of the people; broadcast in the way they behave with each other; heard in what they say; and felt in how they say it. The clues are also in what they do not do and what they do not say. What is missing is as important as what is present.

There are also tangible signs of distrust too – checklists, application-for-permission forms, authorisation protocols, exception logs, risk registers, investigation reports, guidelines, policies, directives, contracts and all the other machinery of the Bureaucracy of Distrust. 

The intangible symptoms of distrust and the tangible signs of distrust both have an impact on the flow of work. The untrustworthy behaviour creates dissatisfaction, demotivation and conflict; the bureaucracy creates handoffs, delays and queues.  All  are potent sources of more errors, delays and waste.

The Cost of Distrust is is counted on all three dimensions – emotional, temporal and financial.

It may appear impossible to assign a finanical cost of distrust because of the complex interactions between the three dimensions in a real system; so one way to approach it is to estimate the cost of a high-trust system.  A system in which the trustworthy behaviour is explicit and trust eroding behaviour is promptly and respectfully challenged.

Picture such a system and consider these questions:

  • How would it feel to work in a high-trust  system where you know that trust-eroding-behaviour will be challenged with respect?
  • How would it feel to be the customer of a high-trust system?
               
  • What would be the cost of a system that did not need the Bureaucracy of Distrust to deliver safety and quality?

Trust eroding behaviours are not reduced by decree, threat, exhortation, name-shame-blame, or pleading because all these behaviours are based on the assumption of distrust and say “I do not trust you to do this without my external motivation”. These attitudes behaviours give away the “I am OK but You are Not OK” belief.

Trust eroding behaviours are most effectively reduced by a collective charter which is when a group of people state what behaviours they do not expect and individually commit to avoiding and challenging. The charter is the tangible sign of the peer support that empowers everyone to challenge with respect because they have collective authority to do so. Authority that is made explicit through the collective charter: “We the undersigned commit to respectfully challenge the following trust eroding behaviours …”.

It requires confidence and competence to open a conversation about distrust with someone else and that confidence comes from insight, instruction and practice. The easiest person to practice with is ourselves – it takes courage to do and it is worth the investment – which is asking and answering two questions:

Q1: What behaviours would erode my trust in someone else?

Make a list and rank on order with the most trust-eroding at the top. 

Q2: Do I ever exhibit any of the behaviours I have just listed?

Choose just one  from your list that you feel you can commit to – and make a promose to yourself – every time you demonstrate the behaviour make a mental note of:

  • When it happened?
  • Where it happened?
  • Who was present?
  • What just happened?
  • How did you feel?

You do not need to actively challange your motives,  or to actively change your behaviour – you just need to connect up your own emotional feedback loop.  The change will happen as if by magic!

Doing Our Way to New Thinking.

Most of our thinking happens out of awareness – it is unconscious. Most of the data that pours in through our senses never reaches awareness either – but that does not mean it does not have an impact on what we remember, how we feel and what we decide and do in the future. It does.

Improvement Science is the knowledge of how to achieve sustained change for the better; and doing that requires an ability to unlearn unconscious knowledge that blocks our path to improvement – and to unlearn selectively.

So how can we do that if it is unconscious? Well, there are  at least two ways:

1. Bring the unconscious knowledge to the surface so it can be examined, sorted, kept or discarded. This is done through the social process of debate and discussion. It does work though it can be a slow and difficult process.

2. Do the unlearning at the unconscious level – and we can do that by using reality rather than rhetoric. The easiest way to connect ourselves to reality is to go out there and try doing things.

When we deliberately do things  we are learning unconsciously because most of our sensory data never reaches awareness.  When we are just thinking the unconscious is relatively unaffected: talking and thinking are the same conscious process. Discussion and dialog operate at the conscious level but differ in style – discussion is more competitive; dialog is more collaborative. 

The door to the unconscious is controlled by emotions – and it appears that learning happens more effectively and more efficiently in certain emotional states. Some emotional states can impair learning; such as depression, frustration and anxiety. Strong emotional states associated with dramatic experiences can result in profound but unselective learning – the emotionally vivid memories that are often associated with unpleasant events.  Sometimes the conscious memory is so emotionally charged and unpleasant that it is suppressed – but the unconscious memory is not so easily erased – so it continues to influence but out of awareness. The same is true for pleasant emotional experiences – they can create profound learning experiences – and the conscious memory may be called an inspirational or “eureka” moment – a sudden emotional shift for the better. And it too is unselective and difficult to erase.

An emotionally safe environment for doing new things and having fun at the same time comes close to the ideal context for learning. In such an enviroment we learn without effort. It does not feel like work – yet we know we have done work because we feel tired afterwards.  And if we were to record the way that we behave and talk before the doing; and again afterwards then we will measure a change even though we may not notice the change ourselves. Other people may notice before we do – particularly if the change is significant – or if they only interact with us occasionally.

It is for this reason that keeping a personal journal is an effective way to capture the change in ourselves over time.  

The Jungian model of personality types states that there are three dimensions to personality (Isabel Briggs Myers added a fourth later to create the MBTI®).

One dimension describes where we prefer to go for input data – sensors (S) use external reality as their reference – intuitors (N) use their internal rhetoric.

Another dimension is how we make decisions –  thinkers (T) prefer a conscious, logical, rational, sequential decision process while feelers (F) favour an unconscious, emotional, “irrational”, parallel approach.

The third dimension is where we direct the output of our decisions – extraverts (E) direct it outwards into the public outside world while intraverts (I) direct it inwards to their private inner world.

Irrespective of our individual preferences, experience suggests that an effective learning sequence starts with our experience of reality (S) and depending how emotionally loaded it is (F) we may then internalise the message as a general intuitive concept (N) or a specific logical construct (T).

The implication of this is that to learn effectively and efficiently we need to be able to access all four modes of thinking and to do that we might design our teaching methods to resonate with this natural learning sequence, focussing on creating surprisingly positive reality based emotional experiences first. And we must be mindful that if we skip steps or create too many emotionally negative experiences we we may unintentionally impair the effectiveness of the learning process.

A carefully designed practical exercise that takes just a few minutes to complete can be a much more effective and efficient way to teach a profound principle than to read libraries of books or to listen to hours of rhetoric.  Indeed some of the most dramatic shifts in our understanding of the Universe have been facilitated by easily repeatable experiments.

Intuition and emotions can trick us – so Doing Our Way to New Thinking may be a better improvement strategy.

Three Blind Men and an Elephant

The Blind Men and the Elephant Story   – adapted from the poem by John Godfrey Saxe.

 “Three blind men were discussing exactly what they believed an elephant to be, since each had heard how strange the creature was, yet none had ever seen one before. So the blind men agreed to find an elephant and discover what the animal was really like. It did not take the blind men long to find an elephant at a nearby market. The first blind man approached the animal and felt the elephant’s firm flat side. “It seems to me that an elephant is just like a wall,” he said to his friends. The second blind man reached out and touched one of the elephant’s tusks. “No, this is round and smooth and sharp – an elephant is like a spear.” Intrigued, the third blind man stepped up to the elephant and touched its trunk. “Well, I can’t agree with either of you; I feel a squirming writhing thing – surely an elephant is just like a snake.” All three blind men continued to argue, based on their own individual experiences, as to what they thought an elephant was like. It was an argument that they were never able to resolve. Each of them was concerned only with their own experience. None of them could see the full picture, and none could appreciate any of the other points of view. Each man saw the elephant as something quite different, and while each blind man was correct they could not agree.”

The Elephant in this parable is the NHS and the three blind men are Governance, Operations and Finance. Each is blind because he does not see reality clearly – his perception is limited to assumptions and crippled by distorted data. The three blind men cannot agree because they do not share a common understanding of the system; its parts and its relationships. Each is looking at a multi-dimensional entity from one dimension only and for each there is no obvious way forward. So while they appear to be in conflict about the “how” they are paradoxically in agreement about the “why”. The outcome is a fruitless and wasteful series of acrimonious arguments, meaningless meetings and directionless discussions.  It is not until they declare their common purpose that their differences of opinion are seen in a realistic perspective and as an opportunity to share and to learn and to create an collective understanding that is greater than the sum of the parts.

Focus-on-the-Flow

One of the foundations of Improvement Science is visualisation – presenting data in a visual format that we find easy to assimilate quickly – as pictures.

We derive deeper understanding from observing how things are changing over time – that is the reality of our everyday experience.

And we gain even deeper understanding of how the world behaves by acting on it and observing the effect of our actions. This is how we all learned-by-doing from day-one. Most of what we know about people, processes and systems we learned long before we went to school.


When I was at school the educational diet was dominated by rote learning of historical facts and tried-and-tested recipes for solving tame problems. It was all OK – but it did not teach me anything about how to improve – that was left to me.

More significantly it taught me more about how not to improve – it taught me that the delivered dogma was not to be questioned. Questions that challenged my older-and-better teachers’ understanding of the world were definitely not welcome.

Young children ask “why?” a lot – but as we get older we stop asking that question – not because we have had our questions answered but because we get the unhelpful answer “just because.”

When we stop asking ourselves “why?” then we stop learning, we close the door to improvement of our understanding, and we close the door to new wisdom.


So to open the door again let us leverage our inborn ability to gain understanding from interacting with the world and observing the effect using moving pictures.

Unfortunately our biology limits us to our immediate space-and-time, so to broaden our scope we need to have a way of projecting a bigger space-scale and longer time-scale into the constraints imposed by the caveman wetware between our ears.

Something like a video game that is realistic enough to teach us something about the real world.

If we want to understand better how a health care system behaves so that we can make wiser decisions of what to do (and what not to do) to improve it then a real-time, interactive, healthcare system video game might be a useful tool.

So, with this design specification I have created one.

The goal of the game is to defeat the enemy – and the enemy is intangible – it is the dark cloak of ignorance – literally “not knowing”.

Not knowing how to improve; not knowing how to ask the “why?” question in a respectful way.  A way that consolidates what we understand and challenges what we do not.

And there is an example of the Health Care System Flow Game being played here.

Reality trumps Rhetoric

One of the biggest challenges posed by Improvement is the requirement for beliefs to change – because static beliefs imply stagnated learning and arrested change.  We all display our beliefs for all to hear and see through our language – word and deed – our spoken language and our body language – and what we do not say and do not do is as important as what we do say and what we do do.  Let us call the whole language thing our Rhetoric – the external manifestation of our internal mental model.

Disappointingly, exercising our mental model does not seem to have much impact on Reality – at least not directly. We do not seem to be able to perform acts of telepathy or telekinesis. We are not like the Jedi knights in the Star Wars films who have learned to master the Force – for good or bad. We are not like the wizards in the Harry Potter who have mastered magical powers – again for good or bad. We are weak-minded muggles and Reality is spectacularly indifferent to our feeble powers. No matter what we might prefer to believe – Reality trumps Rhetoric.

Of course we can side step this uncomfortable feeling by resorting to the belief of One Truth which is often another way of saying My Opinion – and we then assume that if everyone else changed their belief to our belief then we would have full alignment, no conflict, and improvement would automatically flow.  What we actually achieve is a common Rhetoric about which Reality is still completely indifferent.  We know that if we disagree then one of us must be wrong or rather un-real-istic; but we forget that even if we agree then we can still both be wrong. Agreement is not a good test of the validity of our Rhetoric. The only test of validity is Reality itself – and facing the unfeeling Reality risks bruising our rather fragile egos – so we shy away from doing so.

So one way to facilitate improvement is to employ Reality as our final arbiter and to do this respectfully.  This is why teachers of improvement science must be masters of improvement science. They must be able to demonstrate their Improvenent Science Rhetoric by using Reality and their apprentices need to see the IS Rhetoric applied to solving real problems. One way to do this is for the apprentices to do it themselves, for real, with guidance of an IS master and in a safe context where they can make errors and not damage their egos. When this is done what happens is almost magical – the Rhetoric changes – the spoken language and the body language changes – what is said and what is done changes – and what is not said and not done changess too. And very often the change is not noticed at least by those who change.  We only appear to have one mental model: only one view of Reality so when it changes we change.

It is also interesting to observe is that this evolution of Rhetoric does not happen immediately or in one blinding flash of complete insight. We take small steps rather than giant leaps. More often the initial emotional reaction is confusion because our experience of the Reality clashes with the expectation of our Rhetoric.  And very often the changes happen when we are asleep – it is almost as if our minds work on dissolving the confusion when it is not distracted with the demands of awake-work; almost like we are re-organising our mental model structure when it is offline. It is a very common to have a sleepless night after such an Reality Check and to wake with a feeling of greater clarity – our updated mental model declaring itself as our New Rhetoric. Experienced facilitators of Improvement Science understand this natural learning process and that it happens to everyone – including themselves. It is this feeling of increased clarity, deeper understanding, and released energy that is the buzz of Improvement Science – the addictive drug.  We learn that our memory plays tricks on us; and what was conflict yesterday becomes confusion today and clarity tomorrow. One behaviour that often emerges spontaneously is the desire to keep a journal – sometimes at the bedside – to capture the twists and turns of the story of our evolving Rhetoric.

This blog just such a journal.