The Bucket Brigade Fire Fighting Service

Fire-fighting is a behaviour that has a long history, and before Fireman Sam arrived on the scene we had the Bucket Brigade.  This was a people-intensive process designed to deliver water from the nearest pump, pond or river with as little risk, delay and effort as possible. The principle of a bucket-brigade is that a chain of people forms between the pump and the fire and they pass buckets in two directions – full ones from the pump to the fire and empty ones from the fire back to the pump.

A bucket brigade is useful metaphor for many processes and an Improvement Science Practitioner (ISP) can learn a lot from exploring its behaviour.

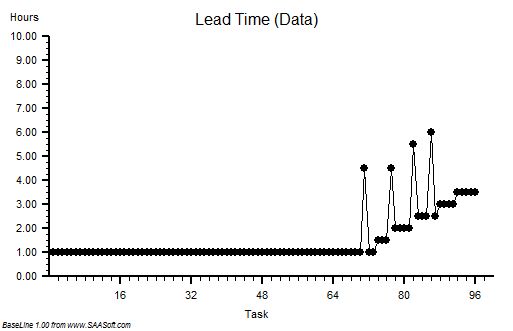
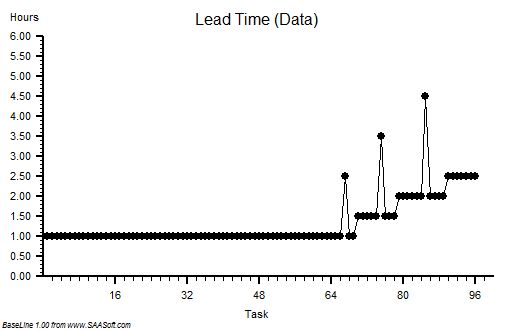
First of all the number of steps in the process or stream is fixed because it is determined by the distance between the pump and the fire. The time it takes for a Bucket Passer to pass a bucket to the next person is predictable  too and it is this cycle-time that determines the rate at which a bucket will move along the line. The fixed step-number and fixed cycle-time implies that the time it takes for a bucket to pass from one end of the line to the other is fixed too. It does not matter if the bucket is empty, half empty or full – the delivery time per bucket is consistent from bucket to bucket. The outflow however is not fixed – it is determined by how full each bucket is when it reaches the end of the line: empty buckets means zero flow, full buckets means maximum flow.

This implies that the process is behaving like a time-trap because the delivery time and the delivery volume (i.e. flow) are independent. Having bigger buckets or fuller buckets makes no difference to the time it takes to traverse the line but it does influence the outflow.

Most systems have many processes that are structured just like a bucket brigade: each step in the process contributes to completing the task before handing the part-completed task on to the next step.

The four dimensions of improvement are Safety, Flow, Quality and Productivity and we can see that, if we are not dropping buckets, then the safety, flow and quality are fixed by the design of the process. So what can we do to improve productivity?

Well, it is evident that the time it takes to do the hand-off adds to the cycle-time of each step. So along comes the Fire Service Finance Department who sees time-as-money and they work out that the unit cost of each step of the process could be reduced by accumulating the jobs at each stage and then handing them off as a batch – because the time-is-money and the cost of the hand-off can now be shared across several buckets. They conclude that the unit cost for the steps will come down and productivity will go up – simple maths and intuitively obvious in theory – but does it actually work in reality?

Q1: Does it reduce the number of Bucket Passers? No. We need just as many as we did before. What we are doing is replacing the smaller buckets with bigger ones – and that will require capital investment.  So when our Finance Department use the lower unit cost as justification then the bigger, more expensive buckets start to look like a good financial option – on paper. But looking at the wage bills we can see that they are the same as before so this raises a question: have the bigger buckets increased the flow or reduced the delivery time? We will need a tangible, positive and measurable  improvement in productivity to justify our capital investment.

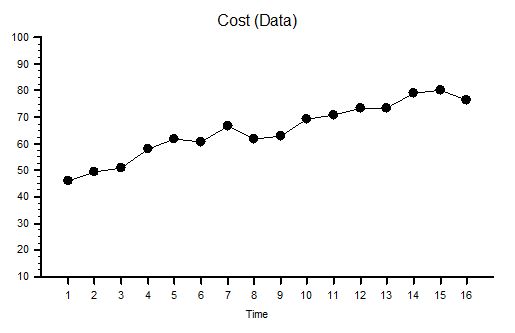
To summarise: we have the same number of Bucket Passers working at the same cycle time so there is no improvement in how long it takes for the water to reach the fire from the pump! The delivery time is unchanged. And using bigger buckets implies that the pump needs to be able to work faster to fill them in one cycle of the process – but to minimise cost when we created the Fire Service we bought a pump with just enough average flow capacity and it cannot be made to increase its flow. So, equipped with a bigger bucket the first Bucket Passer has to wait longer for their bigger bucket to be filled before passing it on down the line.  This implies a longer cycle-time for the first step, and therefore also for every step in the chain. So the delivery-time will actually get longer and the flow will stay the same – on average. All we have appear to have achieved is a higher cost and longer delivery time – which is precisely the opposite of what we intended. Productivity has actually fallen!

In a state of  near-panic the Fire Service Finance Department decide to measure the utilisation of the Bucket Passers and discover that it has fallen which must mean that they have become lazy! So a Push Policy is imposed to make them work faster – the Service cannot afford financial inducements – and threats cost nothing. The result is that in their haste to avoid penalties the bigger, fuller, heavier buckets get fumbled and some of the precious water is lost – so less reaches the fire.  The yield of the process falls and now we have a more expensive, longer delivery time, lower flow process. Productivity has fallen even further and now the Bucket Passers and Accountants are at war. How much worse can it get?

Where did we go wrong?

We made an error of omission. We omitted to learn the basics of process design before attempting to improve the productivity of our time-trap dominated process!  Our error of omission led us to confuse the step, stage, stream and system and we incorrectly used stage metrics (unit cost and utilisation) in an attempt to improve system performance (productivity). The outcome was the exact opposite of what we intended; a line of unhappy Bucket Passers; a frustrated Finance Department and an angry Customer whose house burned down because our Fire Service did not deliver enough water on time. Lose-Lose-Lose.

Q1: Is it possible to improve the productivity of a time-trap design?

Q1: Yes, it is.

Q2: How do we avoid making the same error?

A2: Follow the FISH .

Homeostasis

Improvement Science is not just about removing the barriers that block improvement and building barriers to prevent deterioration – it is also about maintaining acceptable, stable and predictable performance.

In fact most of the time this is what we need our systems to do so that we can focus our attention on the areas for improvement rather than running around keeping all the plates spinning.  Improving the ability of a system to maintain itself is a worthwhile and necessary objective.

Long term stability cannot be achieved by assuming a stable context and creating a rigid solution because the World is always changing. Long term stability is achieved by creating resilient solutions that can adjust their behaviour, within limits, to their ever-changing context.

This self-adjusting behaviour of a system is called homeostasis.

The foundation for the concept of homeostasis was first proposed by Claude Bernard (1813-1878) who unlike most of his contemporaries, believed that all living creatures were bound by the same physical laws as inanimate matter.  In his words: “La fixité du milieu intérieur est la condition d’une vie libre et indépendante” (“The constancy of the internal environment is the condition for a free and independent life”).

The term homeostasis is attributed to Walter Bradford Cannon (1871 – 1945) who was a professor of physiology at Harvard medical school and who popularized his theories in a book called The Wisdom of the Body (1932). Cannon described four principles of homeostasis:

  1. Constancy in an open system requires mechanisms that act to maintain this constancy.
  2. Steady-state conditions require that any tendency toward change automatically meets with factors that resist change.
  3. The regulating system that determines the homeostatic state consists of a number of cooperating mechanisms acting simultaneously or successively.
  4. Homeostasis does not occur by chance, but is the result of organised self-government.

Homeostasis is therefore an emergent behaviour of a system and is the result of organised, cooperating, automatic mechanisms. We know this by another name – feedback control – which is passing data from one part of a system to guide the actions of another part. Any system that does not have homeostatic feedback loops as part of its design will be inherently unstable – especially in a changing environment.  And unstable means untrustworthy.

Take driving for example. Our vehicle and its trusting passengers want to get to their desired destination on time and in one piece. To achieve this we will need to keep our vehicle within the boundaries of the road – the white lines – in order to avoid “disappointment”.

As their trusted driver our feedback loop consists of a view of the road ahead via the front windscreen; our vision connected through a working nervous system to the muscles in ours arms and legs; to the steering wheel, accelerator and brakes; then to the engine, transmission, wheels and tyres and finally to the road underneath the wheels. It is quite a complicated multi-step feedback system – but an effective one. The road can change direction and unpredictable things can happen and we can adapt, adjust and remain in control.  An inferior feedback design would be to use only the rear-view mirror and to steer by looking at the whites lines emerging from behind us. This design is just as complicated but it is much less effective and much less safe because it is entirely reactive.  We get no early warning of what we are approaching.  So, any system that uses the output performance as the feedback loop to the input decision step is like driving with just a rear view mirror.  Complex, expensive, unstable, ineffective and unsafe.     

As the number of steps in a process increases the more important the design of  the feedback stabilisation becomes – as does the number of ways we can get it wrong:  Wrong feedback signal, or from the wrong place, or to the wrong place, or at the wrong time, or with the wrong interpretation – any of which result in the wrong decision, the wrong action and the wrong outcome. Getting it right means getting all of it right all of the time – not just some of it right some of the time. We can’t leave it to chance – we have to design it to work.

Let us consider a real example. The NHS 18-week performance requirement.

The stream map shows a simple system with two parallel streams: A and B that each has two steps 1 and 2. A typical example would be generic referral of patients for investigations and treatment to one of a number of consultants who offer that service. The two streams do the same thing so the first step of the system is to decide which way to direct new tasks – to Step A1 or to Step B1. The whole system is required to deliver completed tasks in less than 18 weeks (18/52) – irrespective of which stream we direct work into.   What feedback data do we use to decide where to direct the next referral?

The do nothing option is to just allocate work without using any feedback. We might do that randomly, alternately or by some other means that are independent of the system.  This is called a push design and is equivalent to driving with your eyes shut but relying on hope and luck for a favourable outcome. We will know when we have got it wrong – but it is too late then – we have crashed the system! 

A more plausible option is to use the waiting time for the first step as the feedback signal – streaming work to the first step with the shortest waiting time. This makes sense because the time waiting for the first step is part of the lead time for the whole stream so minimising this first wait feels reasonable – and it is – BUT only in one situation: when the first steps are the constraint steps in both streams [the constraint step is one one that defines the maximum stream flow].  If this condition is not met then we heading for trouble and the map above illustrates why. In this case Stream A is just failing the 18-week performance target but because the waiting time for Step A1 is the shorter we would continue to load more work onto the failing  stream – and literally push it over the edge. In contrast Stream B is not failing and because the waiting time for Step B1 is the longer it is not being overloaded – it may even be underloaded.  So this “plausible” feedback design can actually make the system less stable. Oops!

In our transport metaphor – this is like driving too fast at night or in fog – only being able to see what is immediately ahead – and then braking and swerving to get around corners when they “suddenly” appear and running off the road unintentionally! Dangerous and expensive.

With this new insight we might now reasonably suggest using the actual output performance to decide which way to direct new work – but this is back to driving by watching the rear-view mirror!  So what is the answer?

The solution is to design the system to use the most appropriate feedback signal to guide the streaming decision. That feedback signal needs to be forward looking, responsive and to lead to stable and equitable performance of the whole system – and it may orginate from inside the system. The diagram above holds the hint: the predicted waiting time for the second step would be a better choice.  Please note that I said the predicted waiting time – which is estimated when the task leaves Step 1 and joins the back of the queue between Step 1 and Step 2. It is not the actual time the most recent task came off the queue: that is rear-view mirror gazing again.

When driving we look as far ahead as we can, for what we are heading towards, and we combine that feedback with our present speed to predict how much time we have before we need to slow down, when to turn, in which direction, by how much, and for how long. With effective feedback we can behave proactively, avoid surprises, and eliminate sudden braking and swerving! Our passengers will have a more comfortable ride and are more likely to survive the journey! And the better we can do all that the faster we can travel in both comfort and safety – even on an unfamiliar road.  It may be less exciting but excitement is not our objective. On time delivery is our goal.

Excitement comes from anticipating improvement – maintaining what we have already improved is rewarding.  We need both to sustain us and to free us to focus on the improvement work! 


Pushmepullyu

The pushmepullyu is a fictional animal immortalised in the 1960’s film Dr Dolittle featuring Rex Harrison who learned from a parrot how to talk to animals.  The pushmepullyu was a rare, mysterious animal that was never captured and displayed in zoos. It had a sharp-horned head at both ends and while one head slept the other stayed awake so it was impossible to sneak up on and capture.

The spirit of the pushmepullyu lives on in Improvement Science as Push-Pull and remains equally mysterious and difficult to understand and explain. It is confusing terminology. So what does Push-Pull acually mean?

To decode the terminology we need to first understand a critical metric of any process – the constraint cycle time (CCT) – and to do that we need to define what the terms constraint and cycle time mean.

Consider a process that comprises a series of steps that must be completed in sequence.  If we put one task through the process we can measure how long each step takes to complete its contribution to the whole task.  This is the touch time of the step and if the resource is immediately available to start the next task this is also the cycle time of the step.

If we now start two tasks at the same time then we will observe when an upstream step has a longer cycle time than the next step downstream because it will shadow the downstream step. In contrast, if the upstream step has a shorter cycle time than the next step down stream then it will expose the downstream step. The differences in the cycle times of the steps will determine the behaviour of the process.

Confused? Probably.  The description above is correct BUT hard to understand because we learn better from reality than from rhetoric; and we find pictures work better than words.  Pragmatic comes before academic; reality before theory.  We need a realistic example to learn from.

Suppose we have a process that we are told has three steps in sequence, and when one task is put through it takes 30 mins to complete.  This is called the lead time and is an important process output metric. We now know it is possible to complete the work in 30 mins so we can set this as our lead time expectation.  

Suppose we plot a chart of lead times in the order that the tasks start and record the start time and lead time for each one – and we get a chart that looks like this. It is called a lead time run chart.  The first six tasks complete in 30 mins as expected – then it all goes pear-shaped. But why?  The run chart does not tell  us the reason – it just alerts us to dig deeper. 

The clue is in the run chart but we need to know what to look for.  We do not know how to do that yet so we need to ask for some more data.

We are given this run chart – which is a count of the number of tasks being worked on recorded at 5 minute intervals. It is the work in progress run chart.

We know that we have a three step process and three separate resources – one for each step. So we know that that if there is a WIP of less than 3 we must have idle resources; and if there is a WIP of more than 3 we must have queues of tasks waiting.

We can see that the WIP run chart looks a bit like the lead time run chart.  But it still does not tell us what is causing the unstable behaviour.

In fact we do already have all the data we need to work it out but it is not intuitively obvious how to do it. We feel we need to dig deeper.

 We decide to go and see for ourselves and to observe exactly what happens to each of the twelve tasks and each of the three resources. We use these observations to draw a Gantt chart.

Now we can see what is happening.

We can see that the cycle time of Step 1 (green) is 10 mins; the cycle time for Step 2 (amber) is 15 mins; and the cycle time for Step 3 (blue) is 5 mins.


This explains why the minimum lead time was 30 mins: 10+15+5 = 30 mins. OK – that makes sense now.

Red means tasks waiting and we can see that a lead time longer than 30 mins is associated with waiting – which means one or more queues.  We can see that there are two queues – the first between Step 1 and Step 2 which starts to form at Task G and then grows; and the second before Step 1 which first appears for Task J  and then grows. So what changes at Task G and Task J?

Looking at the chart we can see that the slope of the left hand edge is changing – it is getting steeper – which means tasks are arriving faster and faster. We look at the interval between the start times and it confirms our suspicion. This data was the clue in the original lead time run chart. 

Looking more closely at the differences between the start times we can see that the first three arrive at one every 20 mins; the next three at one every 15 mins; the next three at one every 10 mins and the last three at one every 5 mins.

Ah ha!

Tasks are being pushed  into the process at an increasing rate that is independent of the rate at which the process can work.     

When we compare the rate of arrival with the cycle time of each step in a process we find that one step will be most exposed – it is called the constraint step and it is the step that controls the flow in the whole process. The constraint cycle time is therefore the critical metric that determines the maximum flow in the whole process – irrespective of how many steps it has or where the constraint step is situated.

If we push tasks into the process slower than the constraint cycle time then all the steps in the process will be able to keep up and no queues will form – but all the resources will be under-utilised. Tasks A to C;

If we push tasks into the process faster than the cycle time of any step then queues will grow upstream of these multiple constraint steps – and those queues will grow bigger, take up space and take up time, and will progressively clog up the resources upstream of the constraints while starving those downstream of work. Tasks G to L.

The optimum is when the work arrives at the same rate as the cycle time of the constraint – this is called pull and it means that the constraint is as the pacemaker and used to pull the work into the process. Tasks D to F.

With this new understanding we can see that the correct rate to load this process is one task every 15 mins – the cycle time of Step 2.

We can use a Gantt chart to predict what would happen.

The waiting is eliminated, the lead time is stable and meeting our expectation, and when task B arrives thw WIP is 2 and stays stable.

In this example we can see that there is now spare capacity at the end for another task – we could increase our productivity; and we can see that we need less space to store the queue which also improves our productivity.  Everyone wins. This is called pull scheduling.  Pull is a more productive design than push. 

To improve process productivity it is necessary to measure the sequence and cycle time of every step in the process.  Without that information it is impossible to understand and rationally improve our process.     

BUT in reality we have to deal with variation – in everything – so imagine how hard it is to predict how a multi-step process will behave when work is being pumped into it at a variable rate and resources come and go! No wonder so many processes feel unpredictable, chaotic, unstable, out-of-control and impossible to both understand and predict!

This feeling is an illusion because by learning and using the tools and techniques of Improvement Science it is possible to design and predict-within-limits how these complex systems will behave.  Improvement Science can unravel this Gordian knot!  And it is not intuitively obvious. If it were we would be doing it.

Design-for-Productivity

One tangible output of process or system design exercise is a blueprint.

This is the set of Policies that define how the design is built and how it is operated so that it delivers the specified performance.

These are just like the blueprints for an architectural design, the latter being the tangible structure, the former being the intangible function.

A computer system has the same two interdependent components that must be co-designed at the same time: the hardware and the software.


The functional design of a system is manifest as the Seven Flows and one of these is Cash Flow, because if the cash does not flow to the right place at the right time in the right amount then the whole system can fail to meet its design requirement. That is one reason why we need accountants – to manage the money flow – so a critical component of the system design is the Budget Policy.

We employ accountants to police the Cash Flow Policies because that is what they are trained to do and that is what they are good at doing – they are the Guardians of the Cash.

Providing flow-capacity requires providing resource-capacity, which requires providing resource-time; and because resource-time-costs-money then the flow-capacity design is intimately linked to the budget design.

This raises some important questions:
Q: Who designs the budget policy?
Q: Is the budget design done as part of the system design?
Q: Are our accountants trained in system design?

The challenge for all organisations is to find ways to improve productivity, to provide more for the same in a not-for-profit organisation, or to deliver a healthy return on investment in the for-profit arena (and remember our pensions are dependent on our future collective productivity).

To achieve the maximum cash flow (i.e. revenue) at the minimum cash cost (i.e. expense) then both the flow scheduling policy and the resource capacity policy must be co-designed to deliver the maximum productivity performance.


If we have a single-step process it is relatively easy to estimate both the costs and the budget to generate the required activity and revenue; but how do we scale this up to the more realistic situation when the flow of work crosses many departments – each of which does different work and has different skills, resources and budgets?

Q: Does it matter that these departments and budgets are managed independently?
Q: If we optimise the performance of each department separately will we get the optimum overall system performance?

Our intuition suggests that to maximise the productivity of the whole system we need to maximise the productivity of the parts.  Yes – that is clearly necessary – but is it sufficient?


To answer this question we will consider a process where the stream flows though several separate steps – separate in the sense that that they have separate budgets – but not separate in that they are linked by the same flow.

The separate budgets are allocated from the total revenue generated by the outflow of the process. For the purposes of this exercise we will assume the goal is zero profit and we just need to calculate the price that needs to be charged the “customer” for us to break even.

The internal reports produced for each of our departments for each time period are:
1. Activity – the amount of work completed in the period.
2. Expenses – the cost of the resources made available in the period – the budget.
3. Utilisation – the ratio of the time spent using resources to the total time the resources were available.

We know that the theoretical maximum utilisation of resources is 100% and this can only be achieved when there is zero-variation. This is impossible in the real world but we will assume it is achievable for the purpose of this example.

There are three questions we need answers to:
Q1: What is the lowest price we can achieve and meet the required demand?
Q2: Will optimising each step independently step give us this lowest price?
Q3: How do we design our budgets to deliver maximum productivity?


To explore these questions let us play with a real example.

Let us assume we have a single stream of work that crosses six separate departments labelled A-F in that sequence. The department budgets have been allocated based on historical activity and utilisation and our required activity of 50 jobs per time period. We have already worked hard to remove all the errors, variation and “waste” within each department and we have achieved 100% observed utilisation of all our resources. We are very proud of our high effectiveness and our high efficiency.

Our current not-for-profit price is £202,000/50 = £4,040 and because our observed utilisation of resources at each step is 100% we conclude this is the most efficient design and that this is the lowest possible price.

Unfortunately our celebration is short-lived because the market for our product is growing bigger and more competitive and our market research department reports that to retain our market share we need to deliver 20% more activity at 80% of the current price!

A quick calculation shows that our productivity must increase by 50% (New Activity/New Price = 120%/80% = 150%) but as we already have a utilisation of 100% then this challenge looks hopelessly impossible.  To increase activity by 20% will require increasing flow-capacity by 20% which will imply a 20% increase in costs so a 20% increase in budget – just to maintain the current price.  If we no longer have customers who want to pay our current price then we are in trouble.

Fortunately our conclusion is incorrect – and it is incorrect because we are not using the data available to co-design the system such that cash flow and work flow are aligned.  And we do not do that because we have not learned how to design-for-productivity.  We are not even aware that this is possible.  It is, and it is called Value Stream Accounting.

The blacked out boxes in the table above hid the data that we need to do this – an we do not know what they are. Yet.

But if we apply the theory, techniques and tools of system design, and we use the data that is already available then we get this result …

 We can see that the total budget is less, the budget allocations are different, the activity is 20% up and the zero-profit price is 34% less – which is a 83% increase in productivity!

More than enough to stay in business.

Yet the observed resource utilisation is still 100%  and that is counter-intuitive and is a very surprising discovery for many. It is however the reality.

And it is important to be reminded that the work itself has not changed – the ONLY change here is the budget policy design – in other words the resource capacity available at each stage.  A zero-cost policy change.

The example answers our first two questions:
A1. We now have a price that meets our customers needs, offers worthwhile work, and we stay in business.
A2. We have disproved our assumption that 100% utilisation at each step implies maximum productivity.

Our third question “How to do it?” requires learning the tools, techniques and theory of System Engineering and Design.  It is not difficult and it is not intuitively obvious – if it were we would all be doing it.

Want to satisfy your curiosity?
Want to see how this was done?
Want to learn how to do it yourself?

You can do that here.


For more posts like this please vote here.
For more information please subscribe here.

What Is The Cost Of Reality?

It is often assumed that “high quality costs more” and there is certainly ample evidence to support this assertion: dinner in a high quality restaurant commands a high price. The usual justifications for the assumption are (a) quality ingredients and quality skills cost more to provide; and (b) if people want a high quality product or service that is in relatively short supply then it commands a higher price – the Law of Supply and Demand.  Together this creates a self-regulating system – it costs more to produce and so long as enough customers are prepared to pay the higher price the system works.  So what is the problem? The problem is that the model is incorrect. The assumption is incorrect.  Higher quality does not always cost more – it usually costs less. Convinced?  No. Of course not. To be convinced we need hard, rational evidence that disproves our assumption. OK. Here is the evidence.

Suppose we have a simple process that has been designed to deliver the Perfect Service – 100% quality, on time, first time and every time – 100% dependable and 100% predictable. We choose a Service for our example because the product is intangible and we cannot store it in a warehouse – so it must be produced as it is consumed.

To measure the Cost of Quality we first need to work out the minimum price we would need to charge to stay in business – the sum of all our costs divided by the number we produce: our Minimum Viable Price. When we examine our Perfect Service we find that it has three parts – Part 1 is the administrative work: receiving customers; scheduling the work; arranging for the necessary resources to be available; collecting the payment; having meetings; writing reports and so on. The list of expenses seems endless. It is the necessary work of management – but it is not what adds value for the customer. Part 3 is the work that actually adds the value – it is the part the customer wants – the Service that they are prepared to pay for. So what is Part 2 work? This is where our customers wait for their value – the queue. Each of the three parts will consume resources either directly or indirectly – each has a cost – and we want Part 3 to represent most of the cost; Part 2 the least and Part 1 somewhere in between. That feels realistic and reasonable. And in our Perfect Service there is no delay between the arrival of a customer and starting the value work; so there is  no queue; so no work in progress waiting to start, so the cost of Part 2 is zero.  

The second step is to work out the cost of our Perfect Service – and we could use algebra and equations to do that but we won’t because the language of abstract mathematics excludes too many people from the conversation – let us just pick some realistic numbers to play with and see what we discover. Let us assume Part 1 requires a total of 30 mins of work that uses resources which cost £12 per hour; and let us assume Part 3 requires 30 mins of work that uses resources which cost £60 per hour; and let us assume Part 2 uses resources that cost £6 per hour (if we were to need them). We can now work out the Minimum Viable Price for our Perfect Service:

Part 1 work: 30 mins @ £12 per hour = £6
Part 2 work:  = £0
Part 3 work: 30 mins at £60 per hour = £30
Total: £36 per customer.

Our Perfect Service has been designed to deliver at the rate of demand which is one job every 30 mins and this means that the Part 1 and Part 3 resources are working continuously at 100% utilisation. There is no waste, no waiting, and no wobble. This is our Perfect Service and £36 per job is our Minimum Viable Price.         

The third step is to tarnish our Perfect Service to make it more realistic – and then to do whatever is necessary to counter the necessary imperfections so that we still produce 100% quality. To the outside world the quality of the service has not changed but it is no longer perfect – they need to wait a bit longer, and they may need to pay a bit more. Quality costs remember!  The question is – how much longer and how much more? If we can work that out and compare it with our Minimim Viable Price we will get a measure of the Cost of Reality.

We know that variation is always present in real systems – so let the first Dose of Reality be the variation in the time it takes to do the value work. What effect does this have?  This apparently simple question is surprisingly difficult to answer in our heads – and we have chosen not to use “scarymatics” so let us run an empirical experiment and see what happens. We could do that with the real system, or we could do it on a model of the system.  As our Perfect Service is so simple we can use a model. There are lots of ways to do this simulation and the technique used in this example is called discrete event simulation (DES)  and I used a process simulation tool called CPS (www.SAASoft.com).

Let us see what happens when we add some random variation to the time it takes to do the Part 3 value work – the flow will not change, the average time will not change, we will just add some random noise – but not too much – something realistic like 10% say.

The chart shows the time from start to finish for each customer and to see the impact of adding the variation the first 48 customers are served by our Perfect Service and then we switch to the Realistic Service. See what happens – the time in the process increases then sort of stabilises. This means we must have created a queue (i.e. Part 2 work) and that will require space to store and capacity to clear. When we get the costs in we work out our new minimum viable price it comes out, in this case, to be £43.42 per task. That is an increase of over 20% and it gives us a measure of the Cost of the Variation. If we repeat the exercise many times we get a similar answer, not the same every time because the variation is random, but it is always an extra cost. It is never less that the perfect proce and it does not average out to zero. This may sound counter-intuitive until we understand the reason: when we add variation we need a bit of a queue to ensure there is always work for Part 3 to do; and that queue will form spontaneously when customers take longer than average. If there is no queue and a customer requires less than average time then the Part 3 resource will be idle for some of the time. That idle time cannot be stored and used later: time is not money.  So what happens is that a queue forms spontaneously, so long as there is space for it,  and it ensures there is always just enough work waiting to be done. It is a self-regulating system – the queue is called a buffer.

Let us see what happens when we take our Perfect Process and add a different form of variation – random errors. To prevent the error leaving the system and affecting our output quality we will repeat the work. If the errors are random and rare then the chance of getting it wrong twice for the same customer will be small so the rework will be a rough measure of the internal process quality. For a fair comparison let us use the same degree of variation as before – 10% of the Part 3 have an error and need to be reworked – which in our example means work going to the back of the queue.

Again, to see the effect of the change, the first 48 tasks are from the Perfect System and after that we introduce a 10% chance of a task failing the quality standard and needing to be reworked: in this example 5 tasks failed, which is the expected rate. The effect on the start to finish time is very different from before – the time for the reworked tasks are clearly longer as we would expect, but the time for the other tasks gets longer too. It implies that a Part 2 queue is building up and after each error we can see that the queue grows – and after a delay.  This is counter-intuitive. Why is this happening? It is because in our Perfect Service we had 100% utiliation – there was just enough capacity to do the work when it was done right-first-time, so if we make errors and we create extra demand and extra load, it will exceed our capacity; we have created a bottleneck and the queue will form and it will cointinue to grow as long as errors are made.  This queue needs space to store and capacity to clear. How much though? Well, in this example, when we add up all these extra costs we get a new minimum price of £62.81 – that is a massive 74% increase!  Wow! It looks like errors create much bigger problem for us than variation. There is another important learning point – random cycle-time variation is self-regulating and inherently stable; random errors are not self-regulating and they create inherently unstable processes.

Our empirical experiment has demonstrated three principles of process design for minimising the Cost of Reality:

1. Eliminate sources of errors by designing error-proofed right-first-time processes that prevent errors happening.
2. Ensure there is enough spare capacity at every stage to allow recovery from the inevitable random errors.
3. Ensure that all the steps can flow uninterrupted by allowing enough buffer space for the critical steps.

With these Three Principles of cost-effective design in mind we can now predict what will happen if we combine a not-for-profit process, with a rising demand, with a rising expectation, with a falling budget, and with an inspect-and-rework process design: we predict everyone will be unhappy. We will all be miserable because the only way to stay in budget is to cut the lower priority value work and reinvest the savings in the rising cost of checking and rework for the higher priority jobs. But we have a  problem – our activity will fall, so our revenue will fall, and despite the cost cutting the budget still doesn’t balance because of the increasing cost of inspection and rework – and we enter the death spiral of finanical decline.

The only way to avoid this fatal financial tailspin is to replace the inspection-and-rework habit with a right-first-time design; before it is too late. And to do that we need to learn how to design and deliver right-first-time processes.

Charts created using BaseLine

The Crime of Metric Abuse

We live in a world that is increasingly intolerant of errors – we want everything to be right all the time – and if it is not then someone must have erred with deliberate intent so they need to be named, blamed and shamed! We set safety standards and tough targets; we measure and check; and we expose and correct anyone who is non-conformant. We accept that is the price we must pay for a Perfect World … Yes? Unfortunately the answer is No. We are deluded. We are all habitual criminals. We are all guilty of committing a crime against humanity – the Crime of Metric Abuse. And we are blissfully ignorant of it so it comes as a big shock when we learn the reality of our unconscious complicity.

You might want to sit down for the next bit.

First we need to set the scene:
1. Sustained improvement requires actions that result in irreversible and beneficial changes to the structure and function of the system.
2. These actions require making wise decisions – effective decisions.
3. These actions require using resources well – efficient processes.
4. Making wise decisions requires that we use our system metrics correctly.
5. Understanding what correct use is means recognising incorrect use – abuse awareness.

When we commit the Crime of Metric Abuse, even unconsciously, we make poor decisions. If we act on those decisions we get an outcome that we do not intend and do not want – we make an error.  Unfortunately, more efficiency does not compensate for less effectiveness – if fact it makes it worse. Efficiency amplifies Effectiveness – “Doing the wrong thing right makes it wronger not righter” as Russell Ackoff succinctly puts it.  Paradoxically our inefficient and bureaucratic systems may be our only defence against our ineffective and potentially dangerous decision making – so before we strip out the bureaucracy and strive for efficiency we had better be sure we are making effective decisions and that means exposing and treating our nasty habit for Metric Abuse.

Metric Abuse manifests in many forms – and there are two that when combined create a particularly virulent addiction – Abuse of Ratios and Abuse of Targets. First let us talk about the Abuse of Ratios.

A ratio is one number divided by another – which sounds innocent enough – and ratios are very useful so what is the danger? The danger is that by combining two numbers to create one we throw away some information. This is not a good idea when making the best possible decision means squeezing every last drop of understanding our of our information. To unconsciously throw away useful information amounts to incompetence; to consciously throw away useful information is negligence because we could and should know better.

Here is a time-series chart of a process metric presented as a ratio. This is productivity – the ratio of an output to an input – and it shows that our productivity is stable over time.  We started OK and we finished OK and we congratulate ourselves for our good management – yes? Well, maybe and maybe not.  Suppose we are measuring the Quality of the output and the Cost of the input; then calculating our Value-For-Money productivity from the ratio; and then only share this derived metric. What if quality and cost are changing over time in the same direction and by the same rate? The productivity ratio will not change.


Suppose the raw data we used to calculate our ratio was as shown in the two charts of measured Ouput Quality and measured Input Cost  – we can see immediately that, although our ratio is telling us everything is stable, our system is actually changing over time – it is unstable and therefore it is unpredictable. Systems that are unstable have a nasty habit of finding barriers to further change and when they do they have a habit of crashing, suddenly, unpredictably and spectacularly. If you take your eyes of the white line when driving and drift off course you may suddenly discover a barrier – the crash barrier for example, or worse still an on-coming vehicle! The apparent stability indicated by a ratio is an illusion or rather a delusion. We delude ourselves that we are OK – in reality we may be on a collision course with catastrophe. 

But increasing quality is what we want surely? Yes – it is what we want – but at what cost? If we use the strategy of quality-by-inspection and add extra checking to detect errors and extra capacity to fix the errors we find then we will incur higher costs. This is the story that these Quality and Cost charts are showing.  To stay in business the extra cost must be passed on to our customers in the price we charge: and we have all been brainwashed from birth to expect to pay more for better quality. But what happens when the rising price hits our customers finanical constraint?  We are no longer able to afford the better quality so we settle for the lower quality but affordable alternative.  What happens then to the company that has invested in quality by inspection? It loses customers which means it loses revenue which is bad for its financial health – and to survive it starts cutting prices, cutting corners, cutting costs, cutting staff and eventually – cutting its own throat! The delusional productivity ratio has hidden the real problem until a sudden and unpredictable drop in revenue and profit provides a reality check – by which time it is too late. Of course if all our competitors are committing the same crime of metric abuse and suffering from the same delusion we may survive a bit longer in the toxic mediocrity swamp – but if a new competitor who is not deluded by ratios and who learns how to provide consistently higher quality at a consistently lower price – then we are in big trouble: our customers leave and our end is swift and without mercy. Competition cannot bring controlled improvement while the Abuse of Ratios remains rife and unchallenged.

Now let us talk about the second Metric Abuse, the Abuse of Targets.

The blue line on the Productivity chart is the Target Productivity. As leaders and managers we have bee brainwashed with the mantra that “you get what you measure” and with this belief we commit the crime of Target Abuse when we set an arbitrary target and use it to decide when to reward and when to punish. We compound our second crime when we connect our arbitrary target to our accounting clock and post periodic praise when we are above target and periodic pain when we are below. We magnify the crime if we have a quality-by-inspection strategy because we create an internal quality-cost tradeoff that generates conflict between our governance goal and our finance goal: the result is a festering and acrimonious stalemate. Our quality-by-inspection strategy paradoxically prevents improvement in productivity and we learn to accept the inevitable oscillation between good and bad and eventually may even convince ourselves that this is the best and the only way.  With this life-limiting-belief deeply embedded in our collective unconsciousness, the more enthusiastically this quality-by-inspection design is enforced the more fear, frustration and failures it generates – until trust is eroded to the point that when the system hits a problem – morale collapses, errors increase, checks are overwhelmed, rework capacity is swamped, quality slumps and costs escalate. Productivity nose-dives and both customers and staff jump into the lifeboats to avoid going down with the ship!  

The use of delusional ratios and arbitrary targets (DRATs) is a dangerous and addictive behaviour and should be made a criminal offense punishable by Law because it is both destructive and unnecessary.

With painful awareness of the problem a path to a solution starts to form:

1. Share the numerator, the denominator and the ratio data as time series charts.
2. Only put requirement specifications on the numerator and denominator charts.
3. Outlaw quality-by-inspection and replace with quality-by-design-and-improvement.  

Metric Abuse is a Crime. DRATs are a dangerous addiction. DRATs kill Motivation. DRATs Kill Organisations.

Charts created using BaseLine

Synigence

The “Qualigence, Quantigence and Synergence” blopic has generated some interesting informal feedback and since being more attuned to this concept I have seen evidence of it at work in practice. My own reflection is that synergence does not quite hit the spot because syn-erg-gence can be translated as “knowing how to work together” and from this small niggle a new word was born – synigence – which I feel captures the concept better. It is an improvement. 

Improvement Science always considers a challenge from three perspectives – quality, delivery and quantity. The delivery dimension involves time and can be viewed both qualitatively and quantitatively.  The pure qualitative dimension is the subjective experience (feelings) and the pure quanitative dimension is the objective evidence (facts) – very often presented in the Universal Language of Money (ULM). The diagram attempts to capture this idea of three perspectives and that there is common ground between all three;  the soil in which the seeds of improvement take root. There is more to it though – this common ground/vision/goal/sense does not look the same from different perspectives and for synergy to develop the synigent facilitator needs to be capable of translating the one vision into three languages. It is rather like the Rosetta Stone an ancient Egyptian grandiorite stele inscribed with a decree issued at Memphis, Egypt in 196 BC on behalf of King Ptolemy V. The decree appears in three scripts: Ancient Egyptian hieroglyphs, Demotic Egyptian script, and Ancient Greek and, as it presents essentially the same text in all three scripts, it provided the key to the modern understanding of Egyptian hieroglyphs.  With this key the wisdom of the Ancient Egyptians was unlocked.

My learning this week is that this is less on an exercise in how to influence others and more of an exercise in how to influence oneself and by that route the sum can become greater than the parts.  Things that looked impossible for either working alone (or more often in conflict) now become not only possible but also inevitable.  Once we have seen we cannot forget – and once we believe we cannot understand that it is not obvious to everyone else: and there lurks a trap for the unsynigent – it is not obvious – if it were we would have seen it sooner ourselves.

Deming’s “System of Profound Knowledge”

W. Edwards Deming (1900-1993) is sometimes referred to as the Father of Quality. He made such a significant contribution to Japan’s burgeoning post-war reputation for innovative high-quality products, and the rapid development of their economic power, that he is regarded as having made more of a difference than any other individual not of Japanese heritage.

Though best known as a statistician and economist, he was initially educated as an electrical engineer and mathematical physicist. To me however he was more of a social scientist – interested in the science of improvement and the creation of value for customers. A lifelong learner, in his later years (1) he became fascinated by epistemology – the processes by which knowledge is created – and this led him into wanting to know more about the psychology of human behaviour and its underlying motivations.

In his nineties he put his whole life of learning into one model – his System of Profound Knowledge (SoPK). What follows is my brief take on each of the four elements of the SoPK and how they fit together.

THE PSYCHOLOGY OF HUMAN BEHAVIOUR
Everyone is different, and we all SEE things differently. We then DO things based on how we see things – and we GET results – of some kind. Over time we shore up our own particular view of the world – some call this a “paradigm” – our own particular world view – multiple loops of DO-GET-SEE (2) are self-reinforcing and as our sense making becomes increasingly fixed we BEHAVE – BECOME – BELIEVE. The trouble is we each to some extent get divorced from reality, or at least how most others see it – in extreme cases we might even get classified by some people as “insane” – indeed the clinical definition of insanity is doing the same things whilst expecting different results.

THE ACQUISITION OF KNOWLEDGE
So when we DO things it would be helpful if we could do them as little experiments that test our sense of what works and what is real. Even better we might get others to help us interpret the results from the benefit of their particular world view/ paradigm. Did you study science at school? If so you might recognize that learning in this way by experimentation is the “scientific method” in action. Through these cycles of learning knowledge gets continually refined and builds. It is also where improvement comes from and how reality evolves. Deming referred to this as the PLAN-DO-STUDY-ACT Cycle (1) – personally i prefer the words in this adjacent diagram. For me the cycle is as much about good mental health as acquiring knowledge, because effective learning (3) keeps individuals and organizations connected to reality and in control of their lives.

UNDERSTANDING VARIATION
The origins of PDSA lie with Walter Shewhart (4) who in 1925 – invented it to help people in organizations methodically and continually inquire into what is happening. He observed that when workers or managers make changes in their working practices so that their processes run better, the results vary, and that this variation often fools them. So he invented a tool for collecting numbers in real time so that each process can be listened in to as a “system” – much like a doctor uses a stethoscope to collect data and interpret how their patient’s system is behaving, by asking what might be contributing to – actually causing – the system’s outcomes. Shewhart named the tool Statistical Process Control – three words, each of which for many people are an instant turn-off. This means they miss his critical insight that there are two distinct types of variation – noise and signal, and that whilst all systems contain noise, only some contain signals – which if present can be taken to be assignable causes of systemic behaviour. Indeed to make it more palatable the tool might better be referred to as a “system behaviour chart”. It is meant to be interpreted like a doctor or nurse interprets the vital sign graph on the end of a patient’s bed i.e. to decide what action if any to take and when. Here is an example that has been created in BaseLine© which is specifically designed to offer the agnostic direct access to the power of Shewhart’s thinking. (5).

THINKING SYSTEMICALLY
What is meant by the word “system”? It means all the parts connected and interrelated as a whole (3). It is often helpful to get representatives of the various stakeholder groups to map the system – with its parts, the flows and the connections – so they can see how different people make sense of say.. their family system, their work system, a particular process of interest.. indeed any system of any kind that feels important to them. The map shown here is one used that might be used generically by manufacturers to help them investigate the separate causal sources of systemic variation – from the Suppliers of Inputs received, to the Processes that convert those inputs into Outputs, which can then be received by Customers – all made possible by vital support processes. This map (1) was taught by Deming in 1950 to Japan’s leaders. When making sense of their own particular systemic context others may prefer a different kind of map, but why? How come others prefer to make sense of things in their own way? To answer this Peter Senge (3) in his own equivalent to the SoPK says you need 5 distinct disciplines: the ability to think systemically, to learn as a team, to create a shared vision, to understand how our mental models get ingrained, and lastly “personal mastery” … which takes me back to where I started.

Aware that he was at the end of his life of learning, Deming bequeathed his System of Profound Knowledge to us so that we might continue his work. Personally, I love the SoPK because it is so complete. It is hard however to keep such a model, complete and as a whole, continually in the front of our minds – such that everything we think and do can be viewed as a fractal of that elegant whole. Indeed as a system, the system of profound knowledge is seriously – even fatally – undermined if any single part is missing ..

• Without understanding the causes of human behaviour we have no empathy for other people’s worldviews, other value systems. Without empathy our ability to manage change is fundamentally impaired.

• Without being good at experimentation and turning our experience into Knowledge – the very essence of science – we threaten our very mental health.

• Without understanding variation we are all too easily deluded – ask any magician (6). We spin our own reality. In ignoring or falsely interpreting data we are even “wilfully blind” (7). Baseline© for example is designed to help people make more of their time-series data – a window onto the system that their data is representing – using its inherent variation to gain an enhanced sense of what’s actually happened, as well as what’s really happening, and what if things stay the same is most likely to happen.

• Without being able to see how things are connected – as a whole system – and seeing the uniqueness of our own particular context, moment to moment, we miss the importance of our maps – and those of others – for good sense-making. We therefore miss the sharing of our individual realities, and with it the potential to spot what really causes outcomes – which neatly takes us back to the need for empathy and for understanding the psychology of human behaviour.

For me the challenge is to be continually striving for that sense of the SoPK – as a complete whole – and by doing this to see how I might grow my influence in the world.

Julian Simcox

References

1. Deming W.E – The New Economics – 1993
2. Covey S.R. – The 7 habits of Highly Effective People – 1989
3. Senge P. M. – The Fifth Discipline: the art and practice of the learning organization – 1990
4. Wheeler D.J. & Poling S.R.– Building Continual Improvement – 1998
5. BaseLine© is available via www.threewinsacademy.co.uk.
6. Macknik S, et al – Sleights of Mind – What the neuroscience of magic reveals about our brains – 2011.
7. Heffernan M. – Wilfully Blind – 2011

The Rubik Cube Problem

Look what popped out of Santa’s sack!

I have not seen one of these for years and it brought back memories of hours of frustration and time wasted in attempting to solve it myself; a sense of failure when I could not; a feeling of envy for those who knew how to; and a sense of indignation when they jealously guarded the secret of their “magical” power.

The Rubik Cube got me thinking – what sort of problem is this?

At first it is easy enough but it becomes quickly apparent that it becomes more difficult the closer we get to the final solution – because our attempts to reach perfection undo our previous good work.  It is very difficult to maintain our initial improvement while exploring new options. 

This insight struck me as very similar to many of the problems we face in life and the sense of futility that creates a powerful force that resists further attempts at change.  Fortunately, we know that it is possible to solve the Rubik cube – so the question this raises is “Is there a way to solve it in a rational, reliable and economical way from any starting point?

One approach is to try every possible combination of moves until we find the solution. That is the way a computer might be programmed to solve it – the zero intelligence or brute force approach.

The problem here is that it works in theory but fails in practice because of the number of possible combinations of moves. At each step you can move one of the six faces in one of two directions – that is 12 possible options; and for each of these there are 12 second moves or 12 x 12 possible two-move paths; 12 x 12 x 12 = 1728 possible three-move paths; about 3 million six-move paths; and nearly half a billion eight-move paths!

You get the idea – solving it this way is not feasible unless you are already very close to the solution.

So how do we actually solve the Rubik Cube?  Well, the instructions that come with a new one tells you – a combination of two well-known ingredients: strategy and tactics. The strategy is called goal-directed and in my instructions the recommended strategy is to solving each layer in sequence. The tactics are called heuristics: tried-tested-and-learned sequences of actions that are triggered by specific patterns.

At each step we look for a small set of patterns and when we find one we follow the pre-designed heuristic and that moves us forward along the path towards the next goal. Of the billions of possible heuristics we only learn, remember, use and teach the small number that preserve the progress we have already made – these are our magic spells.

So where do these heuristics come from?

Well, we can search for them ourselves or we can learn them from someone else.  The first option holds the opportunity for new insights and possible breakthroughs – the second option is quicker!  Someone who designs or discovers a better heuristic is assured a place in history – most of us only ever learn ones that have been discovered or taught by others – it is a much quicker way to solve problems.  

So, for a bit of fun I compared the two approaches using a computer: the competitive-zero-intelligence-brute-force versus the collaborative-goal-directed-learned-and-shared-heuristics.  The heuristic method won easily every time!

The Rubik Cube is an example of a mechanical system: each of the twenty-six parts are interdependent, we cannot move one facet independently of the others, we can only move groups of nine at a time. Every action we make has nine consequences – not just one.  To solve the whole Rubik Cube system problem we must be mindful of the interdependencies and adopt methods that preserve what works while improving what does not.

The human body is a complex biological system. In medicine we have a phrase for this concept of preserving what works while improving what does not: “primum non nocere” which means “first of all do no harm”.  Doctors are masters of goal-directed heuristics; the medical model of diagnosis before prognosis before treatment is a goal-directed strategy and the common tactic is to quickly and accurately pattern-match from a small set of carefully selected data. 

In reality we all employ goal-directed-heuristics all of the time – it is the way our caveman brains have evolved.  Relative success comes from having a more useful set of heuristics – and these can be learned.  Just as with the Rubik Cube – it is quicker to learn what works from someone who can demonstrate that it works and can explain how it works – than to always laboriously work it out for ourselves.

An organisation is a bio-psycho-socio-economic system: a set of interdependent parts called people connected together by relationships and communication processes we call culture.  Improvement Science is a set of heuristics that have been discovered or designed to guide us safely and reliably towards any goal we choose to select – preserving what has been shown to work and challenging what does not.  Improvement Science does not define the path it only helps us avoid getting stuck, or going around in circles, or getting hopelessly lost while we are on the life-journey to our chosen goal.

And Improvement Science is learnable.

Lies, Damned Lies and Statistics!

Most people are confused by statistics and because of this experts often regard them as ignorant, stupid or both.  However, those who claim to be experts in statistics need to proceed with caution – and here is why.

The people who are confused by statistics are confused for a reason – the statistics they see presented do not make sense to them in their world.  They are not stupid – many are graduates and have high IQ’s – so this means they must be ignorant and the obvious solution is to tell them to go and learn statistics. This is the strategy adopted in medicine: Trainees are expected to invest some time doing research and in the process they are expected to learn how to use statistics in order to develop their critical thinking and decision making.  So far so good, so what  is the outcome?

Well, we have been running this experiment for decades now – there are millions of peer reviewed papers published – each one having passed the scrutiny of a statistical expert – and yet we still have a health care system that is not delivering what we need at a cost we can afford.  So, there must be someone else at fault – maybe the managers! They are not expected to learn or use statistics so that statistically-ignorant rabble must be the problem -so the next plan is “Beat up the managers” and “Put statistically trained doctors in charge”.

Hang on a minute! Before we nail the managers and restructure the system let us step back and consider another more radical hypothesis. What if there is something not right about the statistics we are using? The medical statistics experts will rise immediately and state “Research statistics is a rigorous science derived from first principles and is mathematically robust!”  They are correct. It is. But all mathematical derivations are based on some initial fundamental assumptions so when the output does not seem to work in all cases then it is always worth re-examining the initial assumptions. That is the tried-and-tested path to new breakthroughs and new understanding.

The basic assumption that underlies research statistics is that all measurements are independent of each other which also implies that order and time can be ignored.  This is the reason that so much effort, time and money is invested in the design of a research trial – to ensure that the statistical analysis will be correct and the conclusions will be valid. In other words the research trial is designed around the statistical analysis method and its founding assumption. And that is OK when we are doing research.

However, when we come to apply the output of our research trials to the Real World we have a problem.

How do we demonstrate that implementing the research recommendation has resulted in an improvement? We are outside the controlled environment of research now and we cannot distort the Real World to suit our statistical paradigm.  Are the statistical tools we used for the research still OK? Is the founding assumption still valid? Can we still ignore time? Our answer is clearly “NO” because we are looking for a change over time! So can we assume the measurements are independent – again our answer is “NO” because for a process the measurement we make now is influenced by the system before, and the same system will also influence the next measurement. The measurements are NOT independent of each other.

Our statistical paradigm suddenly falls apart because the founding assumption on which it is built is no longer valid. We cannot use the statistics that we used in the research when we attempt to apply the output of the research to the Real World. We need a new and complementary statistical approach.

Fortunately for us it already exists and it is called improvement statistics and we use it all the time – unconsciously. No doctor would manage the blood pressure of a patient on Ward A  based on the average blood pressure of the patients on Ward B – it does not make sense and would not be safe.  This single flash of insight is enough to explain our confusion. There is more than one type of statistics!

New insights also offer new options and new actions. One action would be that the Academics learn improvement statistics so that they can understand better the world outside research; another action would be that the Pragmatists learn improvement statistics so that they can apply the output of well-conducted research in the Real World in a rational, robust and safe way. When both groups have a common language the opportunities for systemic improvment increase. 

BaseLine© is a tool designed specifically to offer the novice a path into the world of improvement statistics.

More than the Sum or Less?

It is often assumed that if you combine world-class individuals into a team you will get a world-class team.

Meredith Belbin showed 30 years ago that you do not and it was a big shock at the time!

So, if world class individuals are not enough, what are the necessary and sufficient conditions for a world-class team?

The late Russell Ackoff described it perfectly – he said that if you take the best parts of all the available cars and put them together you do not get the best car – you do not even get a car. The parts are necessary but they are not sufficient – how the parts connect to each other and how they influence each other is more important.  These interdependencies are part of the system – and to understand a system requires understanding both the parts and their relationships.

A car is a mechanical system; the human body is a biological system; and a team is a social system. So to create a high performance, healthy, world class team requires that both the individuals and their relationships with each other are aligned and resonant.

When the parts are aligned we get more than the sum of the parts; and when they are not we get less.

If we were to define intelligence quotient as “an ability to understand and solve novel problems” then the capability of a team to solve novel problems is the collective intelligence.  Experience suggests that a group can appear to be less intelligent than any of the individual members.  The problem here is with the relationships between the parts – and the term that is often applied is “dysfunctional”.

The root cause is almost always distrustful attitudes which lead from disrespectful prejudices and that lead to discounting behaviour.  We learn these prejudices, attitudes and behaviours from each other and we reinforce them with years of practice.  But if they are learned then they can be un-learned. It is simple in theory, and it is possible in practice, but it is not easy.

So if we want to (dis)solve complex, novel problems thenwe need world-class problem solving teams; and to transform our 3rd class dysfunctional teams we must first learn to challenge respectfully our disrespectful behaviour.

The elephant is in the room!

How to Kill an Organisation with a Budget.

The primary goal of an organisation is to survive – and to do that it must be financially viable. The income must meet or exceed the expenses; the bottom line must be zero or greater; your financial assets much equal or exceed your financial liabilities.  So, organisations have to make financial plans to ensure finanical survival and as large organisations are usually sub-divided into smaller functional parts the common finanical planning tool is the departmental budget. We all know from experience that the future is not precisely predictable and that costs tend to creep up; and the budget is also commonly used as an expense containment tool.  A perfectly reasonable strategy to help ensure survival.  But by combining the two reasonable requirements intoi one tool have we unintentionally created a potentially lethal combination? The answer is “yes” – and this is why ….

The usual policy for a budget is to set the future budget based on the past performance.  Perfectly reasonable. And to contain costs we say “if our expenses were less than our budget then we didn’t need the extra money and we can remove it from our budget for next year.” Very plausible.  And was also say “if our expenses were more than our budget then we are suffering from cost-creep and the deficit is carried over to next year and our budget is not increased.”  What do we observe?  We observe pain!  The first behaviour is that departments on track to underspend will try to spend the remainder of the budget by the end of the period to ensure the next budget is not reduced … they spend their reserves.  The departments on track to overspend cut all the soft costs they can – such as not recruiting when people leave, buying cheap low quality supplies, cancelling training etc.  The result is that teh departments that impose internal cuts will perform less well – because they do not have the capacity to do their work – and that has a knock on effect on other departments because the revenue generating work is usually crosses several departments.  A constraint in just one will affect the flow through all of them.  The combined result is a fall in throughput, a fall in revenue, more severe budget restrictions, and a self-reinforcing spiral of decline to organisational death! Precisely the opposite intention of the budget design.

If that is the disease then what is the root cause? What is the patholgy?

The problem here is the mismatch between the financial specification (budget available) and the financial capability (cost required).  The solution is to recognise the importance of the difference. The first step is to set the budget specification to match the cost capability at each step along the process in order to stabilise the flow; the second step is to redesign the process to improve the cost capability and only reduce the budget when the process has been shown to be capable of working at a lower cost.  This requires two skills: first to be able to work out the cost capability of every step in the process; and second to design-for-cost. Budgets do neither of these and without these skills a budget transforms from a useful management asset to lethal organisational liability!

What do We Mean by Capacity?

I often hear the statement “Our problem is caused by lack of capacity?” and this is usually followed by a heated debate (i.e. an arugment) about how to get more resources to solve the “capacity problem”: The protagonists are usually Governance who start the debate by raising a safety or quality problem; Operations who are tasked to resolve the problem and Finance who are expected to pay.

But what are they talking about? What exactly is “Capacity”? The reason I ask is because the word is ambiguous – it has several meanings – and unless the precise meaning is made explicit then individuals may unconsciously assume different interpretations and crossed-wires, confusion and conflict will ensue.

From the perspective of a process there are at least two distinct meanings that must not be confused: one is flow capacity and the other is inventory capacity.  To give an example of the distinction consider your household plumbing system: the hot water tank has a capacity that is measured in the volume of the tank – e.g. in litres; the pipe that leads from the tank to your tap has a capacity that is measured by the flow through the pipe – e.g. in litres per minute.  These are clearly NOT the same; they are related by time: A 50 litre capacity tank connected to a 5 litre per minute capacity pipe will empty in 10 minutes. So when you are talking about “capacity” be sure to be explicit about which form you mean … volume or flow; static or dynamic; inventory or activity.  It will avoid a LOT of confusion!!

Can Chance make Us a Killer?

Imagine you are a hospital doctor. Some patients die. But how many is too many before you or your hospital are labelled killers? If you check out the BBC page

Are we Stuck in a Toxic Emotional Waste Swamp?

Have you ever had the uncomfortable experience of joining a new group of people and discovering that your usual modus operandi does not seem to fit?  Have you ever experienced the pain of a behavioural expectation mismatch – a clash of culture? What do we do when that happens? Do we keep quiet, listen and try to work out the expected behaviours by observing others and then mimic their behaviour to fit in? Do we hold our ground, stay true to our norms and habits and challenge the group? Do we just shrug, leave and not return?

The other side of this common experience is the effect on the group of a person who does not match the behavioural norms of the group.  Are they regarded as a threat or an opportunity? Usually a threat. But a threat to whom? It depends. And it primarily depends on the emotional state of the chief, chair or boss of the group – the person who holds the social power. We are social animals and we have evolved over millions of years to be hard-wired to tune in to the emotional state of the pack leader – because it is a proven survival strategy!

If the chief is in a negative emotional state then the group will be too and a newcomer expressing a positive emotional outlook will create an emotional tension. People prefer leaders who broadcast a positive emotional state because it makes them feel happier; and leaders are attracted by power – so in this situation the chief will perceive a challenge to the balance of power and will react by putting the happy newcomer firmly in their place in the pecking order. The group observe the mauling and learn that a positive emotional attitude is an unsuccessful strategy to gain favour with the chief – and so the status quo is maintained. The toxic emotional waste swamp gets a bit deeper, the sides get a bit more slippery, and the emotional crocodiles who lurk in the murk get a tasty snack. Yum yum – that’ll teach you to be happy around here!

If the chief has a uniformly positive emotional approach then the group will echo that and a newcomer expressing a negative emotional state creates a different tension. The whole group makes it clear that this negative behaviour is unwelcome – they don’t want someone spoiling their cosy emotional oasis! And the status quo is maintained again. Unfortunately, the only difference between this and the previous example is that this only-happy-people-allowed-here group is drowning in emotional treacle rather than emotional turds. It is still an emotional swamp and the outcome is the same – you get stuck in it.

This either-or model is not a successful long-term strategy because it does not foster learning – it maintains the status quo – tough-minded or touch-feely – pessimistic or optimistic – but not realistic.

Effective learning only happens when the status quo is challenged in a way that respects both the power and authority of the chief and of the group – and the safest way to do that is to turn to reality for feedback and to provide the challenge to the group.  To do this in practice requires a combination of confidence and humility by both the chief and the group: the confidence to reject complacency and to face up to reality and the humility to employ what is discovered to keep moving on, to keep learning, to keep improving.

Reality will provide both positive and negative feedback (“Nuggets” and “Niggles”) and the future will hold both positive and negative challenges (“Nice-Ifs” and “Noo-Noos”).  Effective leaders know this and are able to maintain the creative tension. For those of us who are learning to be more effective leaders perhaps the routes out of our Toxic Emotional Waste Swamps are drawn on our 4N charts?

Is this Second Nature or Blissful Ignorance?

Four stages of learningI haven’t done a Post-It doodle for a while so here is one of my favourites that I was reminded of this week.  Recently my organisation has mandated that we complete a 360-feedback exercise – which for me generated some anxiety – even fear. Why? What am I scared of? Could it be that I am unconsciously aware that there are things I am not very good – I just don’t know what they are – and by asking for feedback I will become painfully aware of my limitations? What then? Will I able to address those weaknesses or do I have to live with them? And even more painful to consider; what if I believed I was good at something because I have been doing it so long it has become second nature – and I discover that what I was good at is not longer appropriate or needed? Wow! That is not going to feel much fun.  I think I’ll avoid the whole process by keeping too busy to complete the online questionnaire.  That strategy did not work of course – a head-in-the-sand approach often doesn’t.  So I completed it and await my fate with trepidation.

The model of learning that I have sketched is called the Conscious-Competence model or – as I prefer to call it – Capability Awareness.  We all start bottom left – not aware of our lack of capablity – let’s call that Blissful Ignorance.  Then something happens that challenges our complacency – we become aware of our lack of capability – ouch! That is Painful Awareness.  From there we have three choices – retreat (denial), stay where we are (distress) or move forward (discovery).  If we choose the path of discovery we must actively invest time and effort to develop our capability to get to the top right position – where we are aware of what we can do – the state of Know How.  Then as we practice or new capability and build our experience we gradually become less aware of out new capability – it becomes Second Nature.  We can now do it without thinking – it becomes sort of hard-wired.  Of course, this is a very useful place to get to: it does conceal a danger though – we start to take our capability for granted as we focus our attention on new challenges. We become complacent – and as the world around us is constantly changing we may be unaware our once-appropriate capability may be growing less useful.  Being a wizard with a set of log-tables and a slide-rule became an unnecessary skill when digital calculators appeared – that was fairly obvious.  The silent danger is that we slowly slide from Second-Nature to Blissful-Ignorance; usually as we get older, become more senior, acquire more influence, more money and more power.  We now have the dramatic context for a nasty shock when, as a once capable and respected leader, we suddenly and painfully become aware of our irrelevance. Many leaders do not survive the shock and many organisations do not survive it either – especially if a once-powerful leader switches to self-justifying denial and the blame-others behaviour.

To protect ourselves from this unhappy fate just requires that we understand the dynamic of this deceptively simple model; it requires actively fostering a curious mindset; it requires a willingness to continuously challenge ourselves; to openly learn from a wide network of others who have more capability in the area we want to develop; and to be open to sharing with others what we have learned.  Maybe 360 feedback is not such a scary idea?

Can an Old Dog learn New Tricks?

I learned a new trick this week and I am very pleased with myself for two reasons. Firstly because I had the fortune to have been recommended this trick; and secondly because I had the foresight to persevere when the first attempt didn’t work very well.  The trick I learned was using a webinar to provide interactive training. “Oh that’s old hat!” I hear some of you saying. Yes, teleconferencing and webinars have been around for a while – and when I tried it a few years ago I was disappointed and that early experience probably raised my unconscious resistance. The world has moved on – and I hadn’t. High-speed wireless broadband is now widely available and the webinar software is much improved.  It was a breeze to set up (though getting one’s microphone and speakers to work seems a perennial problem!). The training I was offering was for the BaseLine process behaviour chart software – and by being able to share the dynamic image of the application on my computer with all the invitees I was able to talk through what I was doing, how I was doing it and the reasons why I was doing it.  The immediate feedback from the invitees allowed me to pace the demonstration, repeat aspects that were unclear, answer novel queries and to demonstrate features that I had not intended to in my script.  The tried and tested see-do-teach method has been reborn in the Information Age and this old dog is definitely wagging his tail and looking forward to his walk in the park (and maybe a tasty treat, huh?)

But Why?

Just two, innocent-looking, three-letter words.

So what is the big deal? If you’ve been a parent of young children you’ll recognise the feeling of desperation that happens when your pre-schooler keeps asking the “But why?” question. You start off patiently attempting to explain in language that you hope they will understand, and the better you do that the more likely you are to get the next “But why?” response. Eventually you reach the point where you’re down to two options: “I don’t know!” or “Just because!”.  How are you feeling now about yourself and your young interrogator?

The troublemaker word is “but”. A common use of the word “but” in normal conversation is “Yes … but …” such as in “I hear what you are saying but …”.

What happens inside your head when you hear that?  Does it niggle? Does the red mist start to rise?

Used in this way the word “but” reveals a mental process called discounting – and the message that you registered unconsciously is closer to “I don’t care about you and your opinion, I only care about me and my opinion and here it comes so listen up!”.  This is a form of disrespectful behaviour that often stimulates a defensive response – even an argument – which only serves to further polarise the separate opinions, to deepen the mutual disrespect, and to erode trust.

It is a self-reinforcing negative-outcome counter-productive behaviour.

The trickster word is “why?”  When someone asks you this open-ended question they are often just using it as a shortcut for a longer series of closed, factual questions such as “how, what, where, when, who …”.  We are tricked because we often unconsciously translate “why?” into “what are your motives for …” which is an emotive question and can unconsciously trigger a negative emotional response. We then associate the negative feeling with the person and that hardens prejudices, erodes trust, reinforces resistance and fuels conflict.

My intention in this post is only to raise conscious awareness of this niggle.

If you are curious to test this youself – try consciously tuning in to the “but” and “why” words in conversation and in emails.  See if you can consciously register your initial emotional response – the one that happens in the split second before your conscious thoughts catch up. Then ask youself the question “Did I just have a positive or a negative feeling?

Can We See a Story in the Data?

I often hear the comments “I cannot see the wood for the trees”, “I am drowning in an ocean of data” and “I cannot identify the cause of the problem”.  We have data, we know there is a problem and we sense there is a soluton; the gap seems to be using the data to find a solution to the problem.

Most quantitative data is presented as tables of columns and rows of numbers; and is indigestable by the majority of people.  Numbers are a recent invention on a biological timescale and we have not yet evolved to effortlessly process data presented in that format. We are visual animals and we have evolved to be very good at seeing patterns in pictures – because it was critical to survival.  Another recent invention is spoken language and, long before writing was invented, accumulated knowledge and wisdom was passed down by word of mouth as legends, myths and stories. Stories are general descriptions that suggest specific solutions. So why do we have such difficulty in extracting the story from the data? Perhaps it is because we use our ears to hear stories that are communicated in words and we use our eyes to see patterns in pictures.  Presenting quantitative data as streams of printed symbols just doesn’t work as well.  To see the story in the data we need to present it as a picture and then talk about what we perceive.

Here are some data – a series of numbers recorded over a period of time – what is the story?

47, 55, 40, 52, 55, 70, 60, 43, 51, 41, 73, 73, 79, 89, 83, 86, 78, 85, 71, 70

Here is the same data converted into a picture.  You can see the message in the data … something changed between measurement 10 and 11.  The chart does not tell us why it changed – it only tells us when it happened and sugegsts what to look for – anything that is capable of causing the effect we can see.  We now have a story and our curiosity is aroused. We want an explanation; we want to understand; we want to learn; and we want to improve.  (For source of data and image visit www.valuesystemdesign.com).

A picture can save a thousand words and ten thousand numbers!

What is the Quickest way to Paralyse a System?

Create confusion by introducing a new factor that the system has little experience of how to manage. And to get the message to spread make it really scary; life-threatening-for-innocent-bystanders-scary; because bad news travels faster than good news. What happens next is predictable; a safety alarm goes off, someone hits the brakes and everything stops. We need time to focus on the new factor, to observe it, investigate it, work out what it is, how it behaves and what to do. We have switched from doing to learning. There is a perfect example of this principle operating on a global scale as I write – a volcano in Iceland that has been dormant since 1821 suddenly spews a cloud of dust high into the sky. There are volcanic eruptions all the time so why is this different? Well, because of a combination of factors that when they combine creates a BIG system-wide impact. First the location of the volcano – on the north-west corner of Europe; then the weather – the prevailing winds are carrying the volcanic plume south and east over the whole of Europe; then the effect – to create a hazard for high altitude commercial jets. Europe is one of the most congested airspaces in the world with around 28,000 flights per day – mostly short haul – but the large European hubs serve as the end points of the trans-global long haul routes. If you want to paralyse global air travel for a completely reversible yet uncontrollable and unpredictable length of time then you probably couldn’t come up with a better plan! The trouble is that the longer the paralysis persists the greater and more irreversible the long term damage. Air travel is an essential component of many industries; so loss of flying capacity not only means loss of revenue and increased costs for airlines – the effects will be felt in every corner of commerce. What triggered this chaos was not just a volcano – it required something else – fear of the unknown. Limited, accidental experience of the interaction of high altitude volcanic plumes and commercial jets shows that all the engines of the jet can shut down – clogged by the volcanic ash. Not an attractive option for anyone. The problem is we simply do not know what the limits of safety are? We are on the horns of an uncomfortable dilemma. The experts and the press who normally feed off each other are uncharacteristically quiet at the moment … everyone is watching, waiting and hoping it will just blow away and we can get back to normal. It won’t and we can’t. Our worldview has just been changed and there is no going back – we have to evolve.

Update 25/04/2010 – I got stranded abroad for a week. It could have been much worse and what was interesting to observe was how the situation was managed. After the initial shock everyone just watched and waited. After a few days it was clear that the problem wasn’t just blowing away. The airlines were haemorrhaging money and were forced to act – by testing if the fear of engine failure was justified. It appeared not to be. A reduction in the volcanic ash being generated, and a shift of the wind, and increasing confidence led to flight activity begin resumed after 7 days. Long before the Authorities could gain any meaningful “scientific” data. The current tasks are to sort out the backlog of displaced passengers; find someone to blame and to sue for compensation. If past behaviour is anything to go by the Authorities will be blamed and the Taxpayers will pick up the bill.  Have we learned anything of lasting benefit from this experience? If not then the same lesson will be repeated; sometime, somewhere, somehow – until we do.

Are your Targets a Pain in the #*&!?

If your delivery time targets are giving you a pain in the #*&! then you may be sitting on a Horned Gaussian and do not realise it. What is a Horned Gaussian? How do you detect one? And what causes it?  To establish the diagnosis you need to gather the data from the most recent couple of hundred jobs and from it calculate the interval from receipt to delivery. Next create a tally chart with Delivery Time on the vertical axis and Counts on the horizontal axis; mark your Delivery Time Target as a horizontal line about two thirds of the way up the vertical axis; draw ten equally spaced lines between it and the X axis and five more above the Target. Finally, sort your delivery times into these “bins” and look at the profile of the histogram that results. If there is a clearly separate “hump” and “horn” and the horn is just under the target then you have confirmed the diagnosis of a Horned Gaussian. The cause is the Delivery Time Target, or more specifically its effect on your behaviour.  If the Target is externally imposed  and enforced using either a reward or a punishment then when the delivery time for a request approaches the Target, you will increase the priority of the request and the job leapfrogs to the front of the queue, pushing all the other jobs back. The order of the jobs is changing and in a severe case the large number of changing priorities generates a lot of extra work to check and reschedule the jobs.  This extra work exacerbates the delays and makes the problem worse, the horn gets taller and sharper, and the pain gets worse. Does that sound a familiar story? So what is the treatment? Well, to decide that you need to create a graph of delivery times in time order and look at the pattern (using charting tool such as BaseLine© www.valuesystemdesign.com makes this easier and quicker). What you do depends on what the chart says to you … it is the Voice of the Process.  Improvement Science is learning to understand the voice of the process.

Am I in a Battle or a Race?

Do you see the challenges that Life presents to you as a series of fight-to-the-death battles or a series of stretch-for-the-finish races? Why does it matter which approach you choose? After all, each has a winner and a loser. Yes, one wins relative to other – but what is the absolute cost for both?  The doodle illustrates the point visually. In a Battle you are in opposition and your effort, time and money are spent and dissipated against each other.  The strong/angry/big will prevail over the weak/timid/small though when the protagnoists are closely matched the outcome takes longer to decide and costs more in absolute terms for both.  One will eventually win while both are weakened from the effort, time and money that is spent.  Contrast this with the race; the investment on both sides is in preparing for the race; in learning, training, and improving.  On the day of the race the more fit/focussed/skilled competitor will win yet both are strengthened from the invested effort, time and money.  In a race the more closely you are matched the more you both improve and get stronger and the quicker the outcome is decided. Exactly the opposite of the battle. It appears that Life will present us with enough new challenges to keep us occupied for the forseeable future; and to rise to those challenges will require that we all learn, train, and practice so that we have the strength, skills and stamina for the challenges we will encounter and cannot yet see.  So, it seems to me to be suicidal to choose to battle with each other and to waste our limited resources of effort, time and money to the point where we are all too weak to survive the inevitable challenges that are over the horizon.  So how would you know which approach you are using?  Well, your feelings are more often sadness, anger or fear then you are probably using the battle metaphor; if in contrast they are feelings of confidence, determination and excitement then you probably see yourself in a race.  The choice is yours.

Delusional Ratios and Arbitrary Targets

This week a friend of mine shared an interesting story.

They were told that their recent performance data showed that performance was improving. “That sounds good” they thought as they started to look at the data which was presented as a table of numbers, one number per time period, as a percentage ratio, and colour coded red, amber or green. The last number in the sequence was green; the previous ones were either red or amber. “See! Our performance has improved and is now acceptable“.

But it did not feel quite right to my friend who did not want to dampen the celebration without good reason, so enquired further “What is the ratio measuring exactly?” “H’mm, let me check, the number of failures divided by the number of customer requests.”  “And what does the red, amber and green signify?” “Oh that’s easy, whether we are above, near or below our target.” “And how was the target set and by whom?” “Um, I don’t know how it was set, we were just told what the target is and the consequences if we don’t meet it.” “And what are the consequences?” No answer – just a finger-across-the-throat gesture.  “Can I see the raw data used to calculate this ratio?” “Eh? I think so, but no one has ever asked us for that before.

My friend could now see the origin of his niggle of doubt.  The raw data showed that the number of customer requests was falling progressively over time while the number of successful requests was not changing.  They were calculating failures from the difference between demand and activity and then dividing the result by the demand to give a percentage that was intended to show their performance. And then setting an arbitrary target for acceptability.

The raw data told a very different story – their customers were going elsewhere – which meant their future income was progressively walking away.  They were blind to it; their ratio was deluding them.

And by setting an arbitrary target for this “delusional ratio” implied that so long as they were “in the green” they didn’t need to do anything, they could sit back and relax. They could not see the nasty surprise coming.

This story led me to wonder how many organsiations get into trouble by following delusional ratios linked to arbitrary targets? How many never see the storm coming until it is too late to avoid it?  Where do these delusional ratios and arbitrary targets come from?  Do they have a valid and useful purpose? And if so, how do we know when to use a ratio or a target and when not to?

It also gave me a new acronym – D.R.A.T. – which seems rather appropriate.

What is the Dis-Ease?

Dis-EaseDo you ever go into places where there is a feeling of uneasiness?

You can feel it almost immediately – there is something in the room that no one is talking about.

An invisible elephant in the room, a rotting something under the table.

This week I have been pondering the cause of this dis-ease and my eureka moment happened while re-reading a book called “The Speed of Trust” by Stephen R. Covey.

A common elephant-in-the-room appears to be distrust and this got me thinking about both the causes of distrust and the effects of distrust.  My doodle captures the output of my musing.  For me, a potent cause of distrust is to be discounted; and discounting comes from disrespect.  This can happen both within yourself and between yourself and others. If you feel un-trust-worthy then you tend to disengage; and by disengaging the system functions less well – it becomes dysfunctional.  Dysfunction erodes respect and so on around the vicious circle.

This then led me to the question: Why haven’t we all drowned in our own distrust by now?  I believe what happens is that we reach an equilibrium where our level of trust is stable; so there must be a counteracting trust-building force that balances the trust-eroding force. That trust-building force seem to comes from our day-to-day social interactions with others.

The Achilles Heel of negative-cause-effect circles is that you can break into them at many points to sap their power and reduce their influence.  So, one strategy might be to identify the Errors of Commission that create the Disease of Distrust.

Consider the question: “If I have developed a high level of trust then what could I do to erode it as quickly as possible?”.

Disrespectful attitude and discounting behaviour would be all that is needed to start the vicious downward spiral of distrust disease.

Who of us never disrespects or discounts others?

Are we all infected with the same disease?

Is there a cure or can we only expect to hold it in remission?

How can we strengthen our emotional immune systems and neutralise the infective agents of the Disease of Distrust?

Do we just need to identify and stop our trust eroding behaviour?

That would be a start.

What Can We Learn From Fish?

A few weeks ago we were asked to look after the class fish during the half-term school holiday. Easy enough, just feed it daily and change the water when it gets murky was our handed-down knowledge of fish-management.  So when we observed the fish swimming at the surface apparently gulping air, even our limited grasp of fish-biology suggested that something was not quite right.  After a short web-surf our anxiety was confirmed: our fish was exhibiting high stress behaviour – it was being poisoned by toxic waste – the waste it makes itself.  We learned that a fish-tank is a delicate and complex eco-system.  Too big a fish in too small a tank, over-feeding, stagnation and infrequent complete water changes with toxic (chlorinated) tap-water are the commonest ways we upset this delicate balance. We were unintentionally killing the fish! The remedy was obvious: we had to learn about fish and learn how to maintain the fish-tank-eco-system. And fast! The fish was delivered back to school in a much bigger tank, complete with light, filter, pump, and the output of our learning – written instructions. The reaction was: “Wow! We can’t believe this is the same fish. It looks and behaves completely differently. It looks happy”.

This life-lesson reminded me of a book that I read some years ago called “Fish!” which involves the Pike Place Fish Market in Seattle and a story of how the fish-mongers inspired others to dramatically improve their own toxic work places.  The message in the story is that we all swim in the emotional toxic waste that we ourselves create; each of us has the choice to commit to reducing our toxic emotional waste emissions; we can contract to hold each other to account on this commitment; and collectively we have the power to drain our own toxic emotional waste swamps. This led to an “eureka” moment: Improvement can not happen in a toxic emotional environment. So how do we know we have one? What are the symptoms and signs? With this insight I believe we can answer that question by just looking and listening.

And if you fancy a diet of near-pure toxic emotional waste all you have to do is read a daily newspaper. Yeuk!

What do you do when you don’t know what to do?

One of the scariest feelings I experience is when I am asked “What should we do?” or “What would you do?” and there is an expectation that I should know what to do … and I don’t.

Do I say “I don’t know” or do I play for time and spout some b*****t and hope my lack of knowledge is not exposed?

Reflecting on this uncomfortable, and oft repeated, experience I am led to some questions:

1. Where does the expectation come from? The person asking, myself or both?

2. Where does the feeling of fear come from? What am I scared of? Who am I scared of?

Pondering these questions I have the fleeting impression that my fear comes from me.  I am afraid of disappointing myself.  It is me that I am scared of.

Then the impression is replaced by a conscious process of looking for evidence that proves that it can’t be me – it must be someone else making me feel scared – and to feel better I have to shift the blame from myself.

Oooooo … that’s a bit of an “Eureka” moment!

And now I have a new option. Choose to behave like of a victim of myself and shift the blame; or choose to address the problem – my deep fear of part of myself.

Phew!  I feel better already – I have a new opportunity to explore …

The Effect of Feedback?

Feedback?I find that I have to draw pictures when I am thinking – it seems to help.

One thing I have been thinking about this week is how to predict the outcome of an action; because I don’t want to do something that has a negative outcome that I did not anticipate.

I know that whatever I do will change the “system” and may have an ongoing effect that may be positive and negative; and once I have set the ball rolling even reversing my action may not change the course.

So the problem I have is this: although I can work out what I feel is the best thing to do now, I do not seem to be able to predict the knock-on effects of my actions.  I know from experience that I may be the recipient of the future effect of my actions today. I will get feedback one way or the other.

So how do we work out what is the best thing to do now? How do we get good feedback?