 Dr Bob runs a Clinic for Sick Systems and is sharing the story of a recent case – a hospital that has presented with chronic pain in their A&E department.
It is a complicated story so Dr Bob is presenting it in bite-sized bits that only require a few minutes to read. Part 1 is here. Part 2 is here.
To summarise the case history so far:
The patient is St.Elsewhere’s® Hospital, a medium sized district general hospital situated in mid-England. StE has a type-1 A&E Department that receives about 200 A&E arrivals per day which is rather average. StE is suffering with chronic pain – specifically the emotional, operational, cultural and financial pain caused by failing their 4-hour A&E target. Their Paymasters and Inspectors have the thumbscrews on, and each quarter … when StE publish their performance report that shows they have failed their A&E target (again) … the thumbscrews are tightened a few more clicks. Arrrrrrrrrrrrgh.
Dr Bob has discovered that StE routinely collect data on when individual patients arrive in A&E and when they depart, and that they use this information for three purposes:
1) To calculate their daily and quarterly 4-hour target failure rate.
2) To create action plans that they believe will eliminate their pain-of-failure.
3) To expedite patients who are approaching the 4-hour target – because that eases the pain.
But the action plans do not appear to have worked and, despite their heroic expeditionary effort, the chronic pain is getting worse. StE is desperate and has finally accepted that it needs help. The Board are worried that they might not survive the coming winter storm and when they hear whispers of P45s being armed and aimed by the P&I then they are finally scared enough to seek professional advice. So they Choose&Book an urgent appointment at Dr Bob’s clinic … and they want a solution yesterday … but they fear the worst. They fear discovering that there is no solution!
The Board, the operational managers and the senior clinicians feel like they are between a rock and a hard place. If Dr Bob’s diagnosis is ‘terminal’ then they cannot avert the launch of the P45’s and it is Game Over for the Board and probably for StE as well. And if Dr Bob’s diagnosis is ‘treatable’ then they cannot avert accepting the painful exposure of their past and present ineptitude – particularly if the prescribed humble pie is swallowed and has the desired effect of curing the A&E pain.
So whatever the diagnosis they appear to have an uncomfortable choice: leave or learn?
Dr Bob has been looking at the A&E data for one typical week that StE have shared.
And Dr Bob knows what to look for … the footprint of a dangerous yet elusive disease. A characteristic sign that doctors have a name for … a pathognomic sign.
Dr Bob is looking for the Horned Gaussian … and has found it!
So now Dr Bob has to deliver the bittersweet news to the patient.
<Dr Bob> Hello again. Please sit down and make yourselves comfortable. As you know I have been doing some tests on the A&E data that you shared. I have the results of those tests and I need to be completely candid with you. There is good news and there is not-so-good news.
[pause]
Would you like to hear this news and if so … in what order?
<StE> Oh dear. We were hoping there was only good news so perhaps we should start there.
<Dr Bob> OK. The good news is that you appear to be suffering from a treatable disease. The data shows the unmistakable footprint of a Horned Gaussian.
<StE> Phew! Thank the Stars! That is what we had hoped and prayed for! Thank you so much. You cannot imagine how much better we feel already. But what is the not-so-good news?
<Dr Bob> The not-so-good news is that the disease is iatrogenic which is medical jargon for self-inflicted. And I appreciate that you did not do this knowingly so you should not feel guilt or blame for doing things that you did not know are self-defeating.
[pause]
And in order to treat this disease we have to treat the root cause and that implies you have a simple choice to make.
<StE> Actually, what you are saying does not come as a surprise. We have sensed for some time that there was something that we did not really understand but we have been so consumed by fighting-the-fire that we have prevaricated in grasping that nettle. And we think we know what the choice is: to leave or to learn. Continuing as we are is no longer an option.
<Dr Bob> You are correct. That is the choice.
StE confers and unanimously choose to take the more courageous path … they choose to learn.
<StE> We choose to learn. Can we start immediately? Can you teach us about the Horned Gaussian?
<Dr Bob> Of course, but before that we need to understand what a Gaussian is.
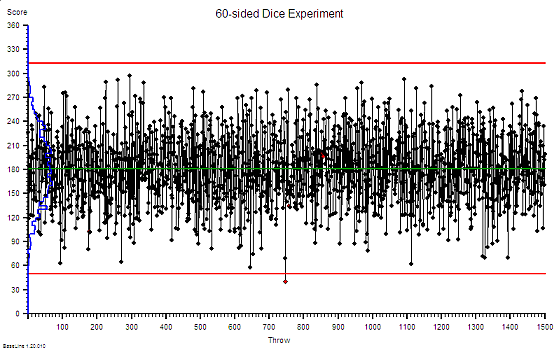
Suppose we have some very special sixty-sided dice with faces numbered 1 to 59, and suppose we toss six of them and wait until they come to rest. Then suppose we count up the total score on the topmost facet of each die … and then suppose we write that total down. And suppose we do this 1500 times and then calculate the average total score. What do you suppose the average would be … approximately?
<StE> Well … the score on each die can be between 1 and 59 and each number is equally likely to happen … so the average score for 1500 throws of one die will be about 30 … so the average score for six of these mega-dice will be about 180.
<Dr Bob> Excellent. And how will the total score vary from throw to throw?
<StE> H’mm … tricky. We know that it will vary but our intuition does not tell us by how much.
<Dr Bob> I agree. It is not intuitively obvious at all. We sense that the further away from 180 we look the less likely we are to find that score in our set of 1500 totals but that is about as close as our intuition can take us. So we need to do an empirical experiment and we can do that easily with a spreadsheet. I have run this experiment and this is what I found …
 Notice that there is rather a wide spread around our expected average of 180 and remember that this is just tossing a handful of sixty-sided dice … so this variation is random … it is inherent and expected and we have no influence over it. Notice too that on the left the distribution of the scores is plotted as a histogram … the blue line. Notice the symmetrical hump-like shape … this is the footprint of a Gaussian.
<StE> So what? This is a bit abstract and theoretical for us. How does it help us?
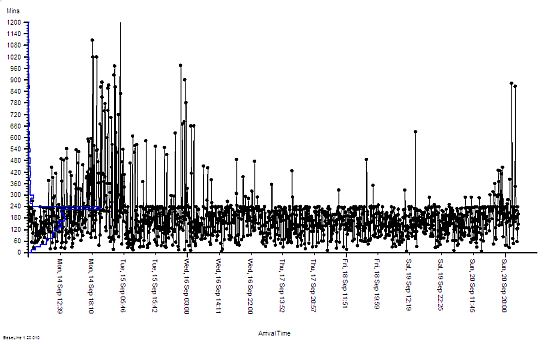
<Dr Bob> Please bear with me a little longer. I have also plotted the time that each of your patients were in A&E last week on the same sort of chart. What do you notice?
<StE> H’mm. This is very odd. It looks like someone has taken a blunt razor to the data … they fluffed the first bit but sharpened up their act for the rest of it. And the histogram looks a bit like the one on your chart, well the lower half does, then there is a big spike. Is that the Horned thingamy?
<Dr Bob> Yes. This is the footprint of a Horned Gaussian. What this picture of your data says is that something is distorting the natural behaviour of your A&E system and that something is cutting in at 240 minutes. Four hours.
<StE> Wait a minute! That is exactly what we do. We admit patients who are getting close to the 4-hour target to stop the A&E clock and reduce the pain of 4-hour failure. But we can only admit as many as we have space for … and sometimes we run out of space. That happened last Monday evening. The whole of StE hospital was gridlocked and we had no option but to store the A&E patients in the corridors – some for more than 12 hours! Just as the chart shows.
<Dr Bob> And by distorting your natural system behaviour in this way you are also distorting the data. Your 4-hour breach rate is actually a lot lower that it would otherwise be … until the system gridlocks then it goes through the roof. This design is unstable and unsafe.
[pause]
Are Mondays always like this?
<StE> Usually, yes. Tuesday feels less painful and the agony eases up to Friday then it builds up again. It is worse than Groundhog Day … it is more like Groundhog Week! The chaos and firefighting is continuous though, particularly in the late afternoon and evenings.
<Dr Bob> So now we are gaining some understanding. The uncomfortable discovery when we look in the mirror is that: part of the cause is our own policies that create the symptoms and obscure the disease. We have looked in the mirror and “we have seen the enemy and the enemy is us“. This is an iatrogenic disease and in my experience a common root cause is something called carveoutosis. Understanding the pathogenesis of carveoutosis is the path to understanding what is needed to treat it. Are you up for that?
<StE> You bet we are!
<Dr Bob> OK. First we need to establish a new habit. You need to start plotting your A&E data just like this. Every day. Every week. Forever. This is your primary feedback loop. This chart will tell you when real improvement is happening. Your quarterly average 4-hour breach percentage will not. The Paymasters, Inspectors and Government will still ask for that quarterly aggregated target failure data but you will use these diagnostic and prognostic system behaviour charts for all your internal diagnosis, decisions and actions. And next week we will explore carveoutosis …
St.Elsewhere’s® is a registered trademark of Kate Silvester Ltd.
And to read more real cases of 4-hour pain download Kate’s: The Christmas Crisis

