The Six Dice Game

<Ring Ring><Ring Ring>

Hello, you are through to the Improvement Science Helpline. How can we help?

This is Leslie, one of your apprentices.  Could I speak to Bob – my Improvement Science coach?

Yes, Bob is free. I will connect you now.

<Ring Ring><Ring Ring>

B: Hello Leslie, Bob here. What is on your mind?

L: Hi Bob, I have a problem that I do not feel my Foundation training has equipped me to solve. Can I talk it through with you?

B: Of course. Can you outline the context for me?

L: OK. The context is a department that is delivering an acceptable quality-of-service and is delivering on-time but is failing financially. As you know we are all being forced to adopt austerity measures and I am concerned that if their budget is cut then they will fail on delivery and may start cutting corners and then fail on quality too.  We need a win-win-win outcome and I do not know where to start with this one.

B: OK – are you using the 6M Design method?

L: Yes – of course!

B: OK – have you done The 4N Chart for the customer of their service?

L: Yes – it was their customers who asked me if I could help and that is what I used to get the context.

B: OK – have you done The 4N Chart for the department?

L: Yes. And that is where my major concerns come from. They feel under extreme pressure; they feel they are working flat out just to maintain the current level of quality and on-time delivery; they feel undervalued and frustrated that their requests for more resources are refused; they feel demoralized; demotivated and scared that their service may be ‘outsourced’. On the positive side they feel that they work well as a team and are willing to learn. I do not know what to do next.

B: OK. Dispair not. This sounds like a very common and treatable system illness.  It is a stream design problem which may be the reason your Foundations training feels insufficient. Would you like to see how a Practitioner would approach this?

L: Yes please!

B: OK. Have you mapped their internal process?

L: Yes. It is a six-step process for each job. Each step has different requirements and are done by different people with different skills. In the past they had a problem with poor service quality so extra safety and quality checks were imposed by the Governance department.  Now the quality of each step is measured on a 1-6 scale and the quality of the whole process is the sum of the individual steps so is measured on a scale of 6 to 36. They now have been given a minimum quality target of 21 to achieve for every job. How they achieve that is not specified – it was left up to them.

B: OK – do they record their quality measurement data?

L: Yes – I have their report.

B: OK – how is the information presented?

L: As an average for the previous month which is reported up to the Quality Performance Committee.

B: OK – what was the average for last month?

L: Their results were 24 – so they do not have an issue delivering the required quality. The problem is the costs they are incurring and they are being labelled by others as ‘inefficient’. Especially the departments who are in budget and they are annoyed that this failing department keeps getting ‘bailed out’.

B: OK. One issue here is the quality reporting process is not alerting you to the real issue. It sounds from what you say that you have fallen into the Flaw of Averages trap.

L: I don’t understand. What is the Flaw of Averages trap?

B: The answer to your question will become clear. The finance issue is a symptom – an effect – it is unlikely to be the cause. When did this finance issue appear?

L: Just after the Safety and Quality Review. They needed to employ more agency staff to do the extra work created by having to meet the new Minimum Quality target.

B: OK. I need to ask you a personal question. Do you believe that improving quality always costs more?

L: I have to say that I am coming to that conclusion. Our Governance and Finance departments are always arguing about it. Governance state ‘a minimum standard of safety and quality is not optional’ and finance say ‘but we are going out of business’. They are at loggerheads. The service departments get caught in the cross-fire.

B: OK. We will need to use reality to demonstrate that this belief is incorrect. Rhetoric alone does not work. If it did then we would not be having this conversation. Do you have the raw data from which the averages are calculated?

L: Yes. We have the data. The quality inspectors are very thorough!

B: OK – can you plot the quality scores for the last fifty jobs as a BaseLine chart?

L: Yes – give me a second. The average is 24 as I said.

B: OK – is the process stable?

L: Yes – there is only one flag for the fifty. I know from my Foundations training that is not a cause for alarm.

B: OK – what is the process capability?

L: I am sorry – I don’t know what you mean by that?

B: My apologies. I forgot that you have not completed the Practitioner training yet. The capability is the range between the red lines on the chart.

L: Um – the lower line is at 17 and the upper line is at 31.

L: OK – how many points lie below the target of 21.

B: None of course. They are meeting their Minimum Quality target. The issue is not quality – it is money.

There was a pause.  Leslie knew from experience that when Bob paused there was a surprise coming.

B: Can you email me your chart?

A cold-shiver went down Leslie’s back. What was the problem here? Bob had never asked to see the data before.

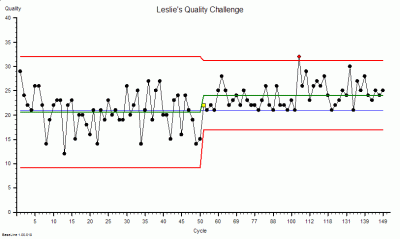
Sure. I will send it now.  The recent fifty is on the right, the data on the left is from after the quality inspectors went in and before the the Minimum Quality target was imposed. This is the chart that Governance has been using as evidence to justify their existence because they are claiming the credit for improving the quality.

B: OK – thanks. I have got it – let me see.  Oh dear.

Leslie was shocked. She had never heard Bob use language like ‘Oh dear’.

There was another pause.

B: Leslie, what is the context for this data? What does the X-axis represent?

Leslie looked at the chart again – more closely this time. Then she saw what Bob was getting at. There were fifty points in the first group, and about the same number in the second group. That was not the interesting part. In the first group the X-axis went up to 50 in regular steps of five; in the second group it went from 50 to just over 149 and was no longer regularly spaced. Eventually she replied.

Bob, that is a really good question. My guess it is that this is the quality of the completed work.

B: It is unwise to guess. It is better to go and see reality.

You are right. I knew that. It is drummed into us during the Foundations training! I will go and ask. Can I call you back?

B: Of course. I will email you my direct number.


<Ring Ring><Ring Ring>

B: Hello, Bob here.

L: Bob – it is Leslie. I am  so excited! I have discovered something amazing.

B: Hello Leslie. That is good to hear. Can you tell me what you have discovered?

L: I have discovered that better quality does not always cost more.

B: That is a good discovery. Can you prove it with data?

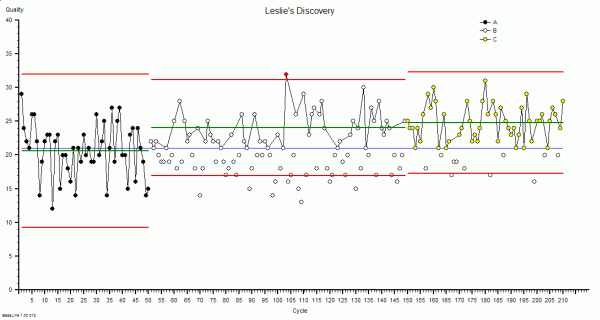
L: Yes I can!  I am emailing you the chart now.

B: OK – I am looking at your chart. Can you explain to me what you have discovered?

L: Yes. When I went to see for myself I saw that when a job failed the Minimum Quality check at the end then the whole job had to be re-done because there was no time to investigate and correct the causes of the failure.  The people doing the work said that they were helpless victims of errors that were made upstream of them – and they could not predict from one job to the next what the error would be. They said it felt like quality was a lottery and that they were just firefighting all the time. They knew that just repeating the work was not solving the problem but they had no other choice because they were under enormous pressure to deliver on-time as well. The only solution they could see is was to get more resources but their requests were being refused by Finance on the grounds that there is no more money. They felt completely trapped.

B: OK. Can you describe what you did?

L: Yes. I saw immediately that there were so many sources of errors that it would be impossible for me to tackle them all. So I used the tool that I had learned in the Foundations training: the Niggle-o-Gram. That focussed us and led to a surprisingly simple, quick, zero-cost process design change. We deliberately did not remove the Inspection-and-Correction policy because we needed to know what the impact of the change would be. Oh, and we did one other thing that challenged the current methods. We plotted every attempt, both the successes and the failures, on the BaseLine chart so we could see both the the quality and the work done on one chart.  And we updated the chart every day and posted it chart on the notice board so everyone in the department could see the effect of the change that they had designed. It worked like magic! They have already slashed their agency staff costs, the whole department feels calmer and they are still delivering on-time. And best of all they now feel that they have the energy and time to start looking at the next niggle. Thank you so much! Now I see how the tools and techniques I learned in Foundations are so powerful and now I understand better the reason we learned them first.

B: Well done Leslie. You have taken an important step to becoming a fully fledged Practitioner. You have learned some critical lessons in this challenge.


This scenario is fictional but realistic.

And it has been designed so that it can be replicated easily using a simple game that requires only pencil, paper and some dice.

If you do not have some dice handy then you can use this little program that simulates rolling six dice.

The Six Digital Dice program (for PC only).

Instructions
1. Prepare a piece of A4 squared paper with the Y-axis marked from zero to 40 and the X-axis from 1 to 80.
2. Roll six dice and record the score on each (or roll one die six times) – then calculate the total.
3. Plot the total on your graph. Left-to-right in time order. Link the dots with lines.
4. After 25 dots look at the chart. It should resemble the leftmost data in the charts above.
5. Now draw a horizontal line at 21. This is the Minimum Quality Target.
6. Keep rolling the dice – six per cycle, adding the totals to the right of your previous data.

But this time if the total is less than 21 then repeat the cycle of six dice rolls until the score is 21 or more. Record on your chart the output of all the cycles – not just the acceptable ones.

7. Keep going until you have 25 acceptable outcomes. As long as it takes.

Now count how many cycles you needed to complete in order to get 25 acceptable outcomes.  You should find that it is about twice as many as before you “imposed” the Inspect-and-Correct QI policy.

This illustrates the problem of an Inspection-and-Correction design for quality improvement.  It does improve the quality of the final output – but at a higher cost.

We are treating the symptoms (effects) and ignoring the disease (causes).

The internal design of the process is unchanged so it is still generating mistakes.

How much quality improvement you get and how much it costs you is determined by the design of the underlying process – which has not changed. There is a Law of Diminishing returns here – and a big risk.

The risk is that if quality improves as the result of applying a quality target then it encourages the Governance thumbscrews to be tightened further and forces those delivering the service further into cross-fire between Governance and Finance.

The other negative consequence of the Inspect-and-Correct approach is that it increases both the average and the variation in lead time which also fuels the calls for more targets, more sticks, calls for  more resources and pushes costs up even further.

The lesson from this simple exercise seems clear.

The better strategy for improving quality is to design the root causes of errors out of the processes  because then we will get improved quality and improved delivery and improved productivity and we will discover that we have improved safety as well.  Win-win-win-win.

The Six Dice Game is a simpler version of the famous Red Bead Game that W Edwards Deming used to explain why, in the modern world, the arbitrary-target-driven-command-and-control-stick-and-carrot style of performance management creates more problems than it solves.

The illusion is of short-term gain but the reality is of long-term pain.

And if you would like to see and hear Deming talking about the science of improvement there is a video of him speaking in 1984. He is at the bottom of the page.  Click here.

The Three R’s

Processes are like people – they get poorly – sometimes very poorly.

Poorly processes present with symptoms. Symptoms such as criticism, complaints, and even catastrophes.

Poorly processes show signs. Signs such as fear, queues and deficits.

So when a process gets very poorly what do we do?

We follow the Three R’s

1-Resuscitate
2-Review
3-Repair

Resuscitate means to stabilize the process so that it is not getting sicker.

Review means to quickly and accurately diagnose the root cause of the process sickness.

Repair means to make changes that will return the process to a healthy and stable state.

So the concept of ‘stability’ is fundamental and we need to understand what that means in practice.

Stability means ‘predictable within limits’. It is not the same as ‘constant’. Constant is stable but stable is not necessarily constant.

Predictable implies time – so any measure of process health must be presented as time-series data.

We are now getting close to a working definition of stability: “a useful metric of system performance that is predictable within limits over time”.

So what is a ‘useful metric’?

There will be at least three useful metrics for every system: a quality metric, a time metric and a money metric.

Quality is subjective. Money is objective. Time is both.

Time is the one to start with – because it is the easiest to measure.

And if we treat our system as a ‘black box’ then from the outside there are three inter-dependent time-related metrics. These are external process metrics (EPMs) – sometimes called Key Performance Indicators (KPIs).

Flow in – also called demand
Flow out – also called activity
Delivery time – which is the time a task spends inside our system – also called the lead time.

But this is all starting to sound like rather dry, conceptual, academic mumbo-jumbo … so let us add a bit of realism and drama – let us tell this as a story …

[reveal heading=”Click here to reveal the story …“] 


Picture yourself as the manager of a service that is poorly. Very poorly. You are getting a constant barrage of criticism and complaints and the occasional catastrophe. Your service is struggling to meet the required delivery time performance. Your service is struggling to stay in budget – let alone meet future cost improvement targets. Your life is a constant fire-fight and you are getting very tired and depressed. Nothing you try seems to make any difference. You are starting to think that anything is better than this – even unemployment! But you have a family to support and jobs are hard to come by in austere times so jumping is not an option. There is no way out. You feel you are going under. You feel are drowning. You feel terrified and helpless!

In desperation you type “Management fire-fighting” into your web search box and among the list of hits you see “Process Improvement Emergency Service”.  That looks hopeful. The link takes you to a website and a phone number. What have you got to lose? You dial the number.

It rings twice and a calm voice answers.

?“You are through to the Process Improvement Emergency Service – what is the nature of the process emergency?”

“Um – my service feels like it is on fire and I am drowning!”

The calm voice continues in a reassuring tone.

?“OK. Have you got a minute to answer three questions?”

“Yes – just about”.

?“OK. First question: Is your service safe?”

“Yes – for now. We have had some catastrophes but have put in lots of extra safety policies and checks which seems to be working. But they are creating a lot of extra work and pushing up our costs and even then we still have lots of criticism and complaints.”

?“OK. Second question: Is your service financially viable?”

“Yes, but not for long. Last year we just broke even, this year we are projecting a big deficit. The cost of maintaining safety is ‘killing’ us.”

?“OK. Third question: Is your service delivering on time?”

“Mostly but not all of the time, and that is what is causing us the most pain. We keep getting beaten up for missing our targets.  We constantly ask, argue and plead for more capacity and all we get back is ‘that is your problem and your job to fix – there is no more money’. The system feels chaotic. There seems to be no rhyme nor reason to when we have a good day or a bad day. All we can hope to do is to spot the jobs that are about to slip through the net in time; to expedite them; and to just avoid failing the target. We are fire-fighting all of the time and it is not getting better. In fact it feels like it is getting worse. And no one seems to be able to do anything other than blame each other.”

There is a short pause then the calm voice continues.

?“OK. Do not panic. We can help – and you need to do exactly what we say to put the fire out. Are you willing to do that?”

“I do not have any other options! That is why I am calling.”

The calm voice replied without hesitation. 

?“We all always have the option of walking away from the fire. We all need to be prepared to exercise that option at any time. To be able to help then you will need to understand that and you will need to commit to tackling the fire. Are you willing to commit to that?”

You are surprised and strangely reassured by the clarity and confidence of this response and you take a moment to compose yourself.

“I see. Yes, I agree that I do not need to get toasted personally and I understand that you cannot parachute in to rescue me. I do not want to run away from my responsibility – I will tackle the fire.”

?“OK. First we need to know how stable your process is on the delivery time dimension. Do you have historical data on demand, activity and delivery time?”

“Hey! Data is one thing I do have – I am drowning in the stuff! RAG charts that blink at me like evil demons! None of it seems to help though – the more data I get sent the more confused I become!”

?“OK. Do not panic.  The data you need is very specific. We need the start and finish events for the most recent one hundred completed jobs. Do you have that?”

“Yes – I have it right here on a spreadsheet – do I send the data to you to analyse?”

?“There is no need to do that. I will talk you through how to do it.”

“You mean I can do it now?”

?“Yes – it will only take a few minutes.”

“OK, I am ready – I have the spreadsheet open – what do I do?”

?“Step 1. Arrange the start and finish events into two columns with a start and finish event for each task on each row.

You copy and paste the data you need into a new worksheet. 

“OK – done that”.

?“Step 2. Sort the two columns into ascending order using the start event.”

“OK – that is easy”.

?“Step 3. Create a third column and for each row calculate the difference between the start and the finish event for that task. Please label it ‘Lead Time’”.

“OK – do you want me to calculate the average Lead Time next?”

There was a pause. Then the calm voice continued but with a slight tinge of irritation.

?“That will not help. First we need to see if your system is unstable. We need to avoid the Flaw of Averages trap. Please follow the instructions exactly. Are you OK with that?”

This response was a surprise and you are starting to feel a bit confused.    

“Yes – sorry. What is the next step?”

?“Step 4: Plot a graph. Put the Lead Time on the vertical axis and the start time on the horizontal axis”.

“OK – done that.”

?“Step 5: Please describe what you see?”

“Um – it looks to me like a cave full of stalagtites. The top is almost flat, there are some spikes, but the bottom is all jagged.”

?“OK. Step 6: Does the pattern on the left-side and on the right-side look similar?”

“Yes – it does not seem to be rising or falling over time. Do you want me to plot the smoothed average over time or a trend line? They are options on the spreadsheet software. I do that use all the time!”

The calm voice paused then continued with the irritated overtone again.

?“No. There is no value is doing that. Please stay with me here. A linear regression line is meaningless on a time series chart. You may be feeling a bit confused. It is common to feel confused at this point but the fog will clear soon. Are you OK to continue?”

An odd feeling starts to grow in you: a mixture of anger, sadness and excitement. You find yourself muttering “But I spent my own hard-earned cash on that expensive MBA where I learned how to do linear regression and data smoothing because I was told it would be good for my career progression!”

?“I am sorry I did not catch that? Could you repeat it for me?”

“Um – sorry. I was talking to myself. Can we proceed to the next step?”

?”OK. From what you say it sounds as if your process is stable – for now. That is good.  It means that you do not need to Resuscitate your process and we can move to the Review phase and start to look for the cause of the pain. Are you OK to continue?”

An uncomfortable feeling is starting to form – one that you cannot quite put your finger on.

“Yes – please”. 

?Step 7: What is the value of the Lead Time at the ‘cave roof’?”

“Um – about 42”

?“OK – Step 8: What is your delivery time target?”

“42”

?“OK – Step 9: How is your delivery time performance measured?”

“By the percentage of tasks that are delivered late each month. Our target is better than 95%. If we fail any month then we are named-and-shamed at the monthly performance review meeting and we have to explain why and what we are going to do about it. If we succeed then we are spared the ritual humiliation and we are rewarded by watching others else being mauled instead. There is always someone in the firing line and attendance at the meeting is not optional!”

You also wanted to say that the data you submit is not always completely accurate and that you often expedite tasks just to avoid missing the target – in full knowkedge that the work had not been competed to the required standard. But you hold that back. Someone might be listening.

There was a pause. Then the calm voice continued with no hint of surprise. 

?“OK. Step 10. The most likely diagnosis here is a DRAT. You have probably developed a Gaussian Horn that is creating the emotional pain and that is fuelling the fire-fighting. Do not panic. This is a common and curable process illness.”

You look at the clock. The conversation has taken only a few minutes. Your feeling of panic is starting to fade and a sense of relief and curiosity is growing. Who are these people?

“Can you tell me more about a DRAT? I am not familiar with that term.”

?“Yes.  Do you have two minutes to continue the conversation?”

“Yes indeed! You have my complete attention for as long as you need. The emails can wait.”

The calm voice continues.

?“OK. I may need to put you on hold or call you back if another emergency call comes in. Are you OK with that?”

“You mean I am not the only person feeling like this?”

?“You are not the only person feeling like this. The process improvement emergency service, or PIES as we call it, receives dozens of calls like this every day – from organisations of every size and type.”

“Wow! And what is the outcome?”

There was a pause. Then the calm voice continued with an unmistakeable hint of pride.

?“We have a 100% success rate to date – for those who commit. You can look at our performance charts and the client feedback on the website.”

“I certainly will! So can you explain what a DRAT is?” 

And as you ask this you are thinking to yourself ‘I wonder what happened to those who did not commit?’ 

The calm voice interrupts your train of thought with a well-practiced explanation.

?“DRAT stands for Delusional Ratio and Arbitrary Target. It is a very common management reaction to unintended negative outcomes such as customer complaints. The concept of metric-ratios-and-performance-specifications is not wrong; it is just applied indiscriminately. Using DRATs can drive short-term improvements but over a longer time-scale they always make the problem worse.”

One thought is now reverberating in your mind. “I knew that! I just could not explain why I felt so uneasy about how my service was being measured.” And now you have a new feeling growing – anger.  You control the urge to swear and instead you ask:

“And what is a Horned Gaussian?”

The calm voice was expecting this question.

?“It is easier to demonstrate than to explain. Do you still have your spreadsheet open and do you know how to draw a histogram?”

“Yes – what do I need to plot?”

?“Use the Lead Time data and set up ten bins in the range 0 to 50 with equal intervals. Please describe what you see”.

It takes you only a few seconds to do this.  You draw lots of histograms – most of them very colourful but meaningless. No one seems to mind though.

“OK. The histogram shows a sort of heap with a big spike on the right hand side – at 42.”

The calm voice continued – this time with a sense of satisfaction.

?“OK. You are looking at the Horned Gaussian. The hump is the Gaussian and the spike is the Horn. It is a sign that your complex adaptive system behaviour is being distorted by the DRAT. It is the Horn that causes the pain and the perpetual fire-fighting. It is the DRAT that causes the Horn.”

“Is it possible to remove the Horn and put out the fire?”

?“Yes.”

This is what you wanted to hear and you cannot help cutting to the closure question.

“Good. How long does that take and what does it involve?”

The calm voice was clearly expecting this question too.

?“The Gaussian Horn is a non-specific reaction – it is an effect – it is not the cause. To remove it and to ensure it does not come back requires treating the root cause. The DRAT is not the root cause – it is also a knee-jerk reaction to the symptoms – the complaints. Treating the symptoms requires learning how to diagnose the specific root cause of the lead time performance failure. There are many possible contributors to lead time and you need to know which are present because if you get the diagnosis wrong you will make an unwise decision, take the wrong action and exacerbate the problem.”

Something goes ‘click’ in your head and suddently your fog of confusion evaporates. It is like someone just switched a light on.

“Ah Ha! You have just explained why nothing we try seems to work for long – if at all.  How long does it take to learn how to diagnose and treat the specific root causes?”

The calm voice was expecting this question and seemed to switch to the next part of the script.

?“It depends on how committed the learner is and how much unlearning they have to do in the process. Our experience is that it takes a few hours of focussed effort over a few weeks. It is rather like learning any new skill. Guidance, practice and feedback are needed. Just about anyone can learn how to do it – but paradoxically it takes longer for the more experienced and, can I say, cynical managers. We believe they have more unlearning to do.”

You are now feeling a growing sense of urgency and excitement.

“So it is not something we can do now on the phone?”

?“No. This conversation is just the first step.”

You are eager now – sitting forward on the edge of your chair and completely focussed.

“OK. What is the next step?”

There is a pause. You sense that the calm voice is reviewing the conversation and coming to a decision.

?“Before I can answer your question I need to ask you something. I need to ask you how you are feeling.”

That was not the question you expected! You are not used to talking about your feelings – especially to a complete stranger on the phone – yet strangely you do not sense that you are being judged. You have is a growing feeling of trust in the calm voice.

You pause, collect your thoughts and attempt to put your feelings into words. 

“Er – well – a mixture of feelings actually – and they changed over time. First I had a feeling of surprise that this seems so familiar and straightforward to you; then a sense of resistance to the idea that my problem is fixable; and then a sense of confusion because what you have shown me challenges everything I have been taught; and then a feeling distrust that there must be a catch and then a feeling of fear of embarassement if I do not spot the trick. Then when I put my natural skepticism to one side and considered the possibility as real then there was a feeling of anger that I was not taught any of this before; and then a feeling of sadness for the years of wasted time and frustration from battling something I could not explain.  Eventually I started to started to feel that my cherished impossibility belief was being shaken to its roots. And then I felt a growing sense of curiosity, optimism and even excitement that is also tinged with a feeling of fear of disappointment and of having my hopes dashed – again.”

There was a pause – as if the calm voice was digesting this hearty meal of feelings. Then the calm voice stated:

?“You are experiencing the Nerve Curve. It is normal and expected. It is a healthy sign. It means that the healing process has already started. You are part of your system. You feel what it feels – it feels what you do. The sequence of negative feelings: the shock, denial, anger, sadness, depression and fear will subside with time and the positive feelings of confidence, curiosity and excitement will replace them. Do not worry. This is normal and it takes time. I can now suggest the next step.”

You now feel like you have just stepped off an emotional rollercoaster – scary yet exhilarating at the same time. A sense of relief sweeps over you. You have shared your private emotional pain with a stranger on the phone and the world did not end! There is hope.

“What is the next step?”

This time there was no pause.

?“To commit to learning how to diagnose and treat your process illnesses yourself.”

“You mean you do not sell me an expensive training course or send me a sharp-suited expert who will come tell me what to do and charge me a small fortune?”

There is an almost sarcastic tone to your reply that you regret as soon as you have spoken.

Another pause.  An uncomfortably long one this time. You sense the calm voice knows that you know the answer to your own question and is waiting for you to answer it yourself.

You answer your own question.  

“OK. I guess not. Sorry for that. Yes – I am definitely up for learning how! What do I need to do.”

?“Just email us. The address is on the website. We will outline the learning process. It is neither difficult nor expensive.”

The way this reply was delivered – calmly and matter-of-factly – was reassuring but it also promoted a new niggle – a flash of fear.

“How long have I got to learn this?”

This time the calm voice had an unmistakable sense of urgency that sent a cold prickles down your spine.

?”Delay will add no value. You are being stalked by the Horned Gaussian. This means your system is on the edge of a catastrophe cliff. It could tip over any time. You cannot afford to relax. You must maintain all your current defenses. It is a learning-by-doing process. The sooner you start to learn-by-doing the sooner the fire starts to fade and the sooner you move away from the edge of the cliff.”       

“OK – I understand – and I do not know why I did not seek help a long time ago.”

The calm voice replied simply.

?”Many people find seeking help difficult. Especially senior people”.

Sensing that the conversation is coming to an end you feel compelled to ask:

“I am curious. Where do the DRATs come from?”

?“Curiosity is a healthy attitude to nurture. We believe that DRATs originated in finance departments – where they were originally called Fiscal Averages, Ratios and Targets.  At some time in the past they were sucked into operations and governance departments by a knowledge vacuum created by an unintended error of omission.”

You are not quite sure what this unfamiliar language means and you sense that you have strayed outside the scope of the “emergency script” but the phrase ‘error of omission sounds interesting’ and pricks your curiosity. You ask: 

“What was the error of omission?”

?“We believe it was not investing in learning how to design complex adaptive value systems to deliver capable win-win-win performance. Not investing in learning the Science of Improvement.”

“I am not sure I understand everything you have said.”

?“That is OK. Do not worry. You will. We look forward to your email.  My name is Bob by the way.”

“Thank you so much Bob. I feel better just having talked to someone who understands what I am going through and I am grateful to learn that there is a way out of this dark pit of despair. I will look at the website and send the email immediately.”

?”I am happy to have been of assistance.”

[/reveal]

Systems within Systems

Each of us is a small part of a big system.  Each of us is a big system made of smaller parts. The concept of a system is the same at all scales – it is called scale invariant

When we put a system under a microscope we see parts that are also systems. And when we zoom in on those we see their parts are also systems. And if we look outwards with a telescope we see that we are part of a bigger system which in turn is part of an even bigger system.

This concept of systems-within-systems has a down-side and an up-side.

The down-side is that it quickly becomes impossible to create a mental picture of the whole system-of-systems. Our caveman brains are just not up to the job. So we just focus our impressive-but-limited cognitive capacity on the bit that affects us most. The immediate day-to-day people-and-process here-and-now stuff. And we ignore the ‘rest’. We deliberately become ignorant – and for good reason. We do not ask about the ‘rest’ because we do not want to know because we cannot comprehend the complexity. We create cognitive comfort zones and personal silos.

And we stay inside our comfort zones and we hide inside our silos.


Unfortunately – ignoring the ‘rest’ does not make it go away.

We are part of a system – we are affected by it and it is affected by us. That is how systems work.


The up-side is that all systems behave in much the same way – irrespective of the level.  This is very handy because if we can master a method for understanding and improving a system at one level – then we can use the same method at any level.  The only change is the degree of detail. We can chunk up and down and still use the same method.  

The improvement scientist needs to be a master of one method and to be aware of three levels: the system level, the stream level and the step level.

The system provides the context for the streams. The steps provide the content of the streams.

  1. Direction operates at the system level.
  2. Delivery operates at the stream level.
  3. Doing operates at the step level.

So an effective and efficient improvement science method must work at all three levels – and one method that has been demonstrated to do that is called 6M Design®.


6M Design® is not the only improvement science method, and it is not intended to be the best. Being the best is not the purpose because it is not necessary. Having better than what we had before is the purpose because it is sufficient. That is improvement.


6M Design® works at all three levels.  It is sufficient for system-wide and system-deep improvement. So that is what I use.


The first M stands for Map.

Maps are designed to be visual and two-dimensional because that is how our Mark-I eyeballs abd visual sensory systems work. Our caveman brains are good at using pictures and in extraction meaning from the detail. It is a survival skill. 

All real systems have a lot more than two dimensions. Safety, Quality, Flow and Cost are four dimensions to start with, and there are many more. So we need lots of maps. Each one looking at just two of the dimensions.  It is our set of maps that provide us with a multi-dimensional picture of the system we want to improve.

One dimension features more often in the maps than any other – and that dimension is time.

The Western cultural convention is to put time on the horizonal axis with past in the left and future on the right. Left-to-right means looking forward in time.  Right-to-left means looking backwards in time. 


We have already seen one of the time-dependent maps – The 4N Chart®.

It is a Emotion-Time map. How do we feel now and why? What do we want to feel in the futrure and why? It is a status-at-a-glance map. A static map. A snapshot.

The emotional roller coaster of change – the Nerve Curve – is an Emotion-Time map too. It is a dynamic map – an expected trajectory map.  The emotional ups and downs that we expect to encounter when we engage in significant change.

Change usually involves several threads at the same time – each with its own Nerve Curve. 

The 4N Charts® are snapshots of all the parallel threads of change – they evolve over time – they are our day-to-day status-at-a-glance maps – and they guide us to which Nerve Curve to pay attention to next and what to do. 

The map that links the three – the purposes, the pathways and the parts – is the map that underpins 6M Design®. A map that most people are not familiar with because it represents a counter-intuitive way of thinking.

And it is that critical-to-success map which differentiates innovative design from incremental improvement.

And using that map can be learned quite quickly – if you have a guide – an Improvement Scientist.

A Recipe for Improvement PIE.

Most of us are realists. We have to solve problems in the real world so we prefer real examples and step-by-step how-to-do recipes.

A minority of us are theorists and are more comfortable with abstract models and solving rhetorical problems.

Many of these Improvement Science blog articles debate abstract concepts – because I am a strong iNtuitor by nature. Most realists are Sensors – so by popular request here is a “how-to-do” recipe for a Productivity Improvement Exercise (PIE)

Step 1 – Define Productivity.

There are many definitions we could choose because productivity means the results delivered divided by the resources used.  We could use any of the three currencies – quality, time or money – but the easiest is money. And that is because it is easier to measure and we have well established department for doing it – Finance – the guardians of the money.  There are two other departments who may need to be involved – Governance (the guardians of the safety) and Operations (the guardians of the delivery).

So the definition we will use is productivity = revenue generated divided cost incurred.

Step 2 – Draw a map of the process we want to make more productive.

This means creating a picture of the parts and their relationships to each other – in particular what the steps in the process are; who does what, where and when; what is done in parallel and what is done in sequence; what feeds into what and what depends on what. The output of this step is a diagram with boxes and arrows and annotations – called a process map. It tells us at a glance how complex our process is – the number of boxes and the number of arrows.  The simpler the process the easier it is to demonstrate a productivity improvement quickly and unambiguously.

Step 3 – Decide the objective metrics that will tell us our productivity.

We have chosen a finanical measure of productivity so we need to measure revenue and cost over time – and our Finance department do that already so we do not need to do anything new. We just ask them for the data. It will probably come as a monthly report because that is how Finance processes are designed – the calendar month accounting cycle is not negotiable.

We will also need some internal process metrics (IPMs) that will link to the end of month productivity report values because we need to be observing our process more often than monthly. Weekly, daily or even task-by-task may be necessary – and our monthly finance reports will not meet that time-granularity requirement.

These internal process metrics will be time metrics.

Start with objective metrics and avoid the subjective ones at this stage. They are necessary but they come later.

Step 4 – Measure the process.

There are three essential measures we usually need for each step in the process: A measure of quality, a measure of time and a measure of cost.  For the purposes of this example we will simplify by making three assumptions. Quality is 100% (no mistakes) and Predictability is 100% (no variation) and Necessity is 100% (no worthless steps). This means that we are considering a simplified and theoretical situation but we are novices and we need to start with the wood and not get lost in the trees.

The 100% Quality means that we do not need to worry about Governance for the purposes of this basic recipe.

The 100% Predictability means that we can use averages – so long as we are careful.

The 100% Necessity means that we must have all the steps in there or the process will not work.

The best way to measure the process is to observe it and record the events as they happen. There is no place for rhetoric here. Only reality is acceptable. And avoid computers getting in the way of the measurement. The place for computers is to assist the analysis – and only later may they be used to assist the maintenance – after the improvement has been achieved.

Many attempts at productivity improvement fail at this point – because there is a strong belief that the more computers we add the better. Experience shows the opposite is usually the case – adding computers adds complexity, cost and the opportunity for errors – so beware.

Step 5 – Identify the Constraint Step.

The meaning of the term constraint in this context is very specific – it means the step that controls the flow in the whole process.  The critical word here is flow. We need to identify the current flow constraint.

A tap or valve on a pipe is a good example of a flow constraint – we adjust the tap to control the flow in the whole pipe. It makes no difference how long or fat the pipe is or where the tap is, begining, middle or end. (So long as the pipe is not too long or too narrow or the fluid too gloopy because if they are then the pipe will become the flow constraint and we do not want that).

The way to identify the constraint in the system is to look at the time measurements. The step that shows the same flow as the output is the constraint step. (And remember we are using the simplified example of no errors and no variation – in real life there is a bit more to identifying the constraint step).

Step 6 – Identify the ideal place for the Constraint Step.

This is the critical-to-success step in the PIE recipe. Get this wrong and it will not work.

This step requires two pieces of measurement data for each step – the time data and the cost data. So the Operational team and the Finance team will need to collaborate here. Tricky I know but if we want improved productivity then there is no alternative.

Lots of productivity improvement initiatives fall at the Sixth Fence – so beware.  If our Finance and Operations departments are at war then we should not consider even starting the race. It will only make the bad situation even worse!

If they are able to maintain an adult and respectful face-to-face conversation then we can proceed.

The time measure for each step we need is called the cycle time – which is the time interval from starting one task to being ready to start the next one. Please note this is a precise definition and it should be used exactly as defined.

The money measure for each step we need is the fully absorbed cost of time of providing the resource.  Your Finance department will understand that – they are Masters of FACTs!

The magic number we need to identify the Ideal Constraint is the product of the Cycle Time and the FACT – the step with the highest magic number should be the constraint step. It should control the flow in the whole process. (In reality there is a bit more to it than this but I am trying hard to stay out of the trees).

Step 7 – Design the capacity so that the Ideal Constraint is the Actual Constraint.

We are using a precise definition of the term capacity here – the amount of resource-time available – not just the number of resources available. Again this is a precise definition and should be used as defined.

The capacity design sequence  means adding and removing capacity to and from steps so that the constraint moves to where we want it.

The sequence  is:
7a) Set the capacity of the Ideal Constraint so it is capable of delivering the required activity and revenue.
7b) Increase the capacity of the all the other steps so that the Ideal Constraint actually controls the flow.
7c) Reduce the capacity of each step in turn, a click at a time until it becomes the constraint then back off one click.

Step 8 – Model your whole design to predict the expected productivity improvement.

This is critical because we are not interested in suck-it-and-see incremental improvement. We need to be able to decide if the expected benefit is worth the effort before we authorise and action any changes.  And we will be asked for a business case. That necessity is not negotiable either.

Lots of productivity improvement projects try to dodge this particularly thorny fence behind a smoke screen of a plausible looking business case that is more fiction than fact. This happens when any of Steps 2 to 7 are omitted or done incorrectly.  What we need here is a model and if we are not prepared to learn how to build one then we should not start. It may only need a simple model – but it will need one. Intuition is too unreliable.

A model is defined as a simplified representation of reality used for making predictions.

All models are approximations of reality. That is OK.

The art of modeling is to define the questions the model needs to be designed to answer (and the precision and accuracy needed) and then design, build and test the model so that it is just simple enough and no simpler. Adding unnecessary complexity is difficult, time consuming, error prone and expensive. Using a computer model when a simple pen-and-paper model would suffice is a good example of over-complicating the recipe!

Many productivity improvement projects that get this far still fall at this fence.  There is a belief that modeling can only be done by Marvins with brains the size of planets. This is incorrect.  There is also a belief that just using a spreadsheet or modelling software is all that is needed. This is incorrect too. Competent modelling requires tools and training – and experience because it is as much art as science.

Step 9 – Modify your system as per the tested design.

Once you have demonstrated how the proposed design will deliver a valuable increase in productivity then get on with it.

Not by imposing it as a fait accompli – but by sharing the story along with the rationale, real data, explanation and results. Ask for balanced, reasoned and respectful feedback. The question to ask is “Can you think of any reasons why this would not work?” Very often the reply is “It all looks OK in theory but I bet it won’t work in practice but I can’t explain why”. This is an emotional reaction which may have some basis in fact. It may also just be habitual skepticism/cynicism. Further debate is usually  worthless – the only way to know for sure is by doing the experiment. As an experiment – as a small-scale and time-limited pilot. Set the date and do it. Waiting and debating will add no value. The proof of the pie is in the eating.

Step 10 – Measure and maintain your system productivity.

Keep measuring the same metrics that you need to calculate productivity and in addition monitor the old constraint step and the new constraint steps like a hawk – capturing their time metrics for every task – and tracking what you see against what the model predicted you should see.

The correct tool to use here is a system behaviour chart for each constraint metric.  The before-the-change data is the baseline from which improvement is measured over time;  and with a dot plotted for each task in real time and made visible to all the stakeholders. This is the voice of the process (VoP).

A review after three months with a retrospective financial analysis will not be enough. The feedback needs to be immediate. The voice of the process will dictate if and when to celebrate. (There is a bit more to this step too and the trees are clamoring for attention but we must stay out of the wood a bit longer).

And after the charts-on-the-wall have revealed the expected improvement has actually happened; and after the skeptics have deleted their ‘we told you so’ emails; and after the cynics have slunk off to sulk; and after the celebration party is over; and after the fame and glory has been snatched by the non-participants – after all of that expected change management stuff has happened …. there is a bit more work to do.

And that is to establish the new higher productivity design as business-as-usual which means tearing up all the old policies and writing new ones: New Policies that capture the New Reality. Bin the out-of-date rubbish.

This is an essential step because culture changes slowly.  If this step is omitted then out-of-date beliefs, attitudes, habits and behaviours will start to diffuse back in, poison the pond, and undo all the good work.  The New Policies are the reference – but they alone will not ensure the improvement is maintained. What is also needed is a PFL – a performance feedback loop.

And we have already demonstrated what that needs to be – the tactical system behaviour charts for the Intended Constraint step.

The finanical productivity metric is the strategic output and is reported monthly – as a system behaviour chart! Just comparing this month with last month is meaningless.  The tactical SBCs for the constraint step must be maintained continuously by the people who own the constraint step – because they control the productivity of the whole process.  They are the guardians of the productivity improvement and their SBCs are the Early Warning System (EWS).

If the tactical SBCs set off an alarm then investigate the root cause immediately – and address it. If they do not then leave it alone and do not meddle.

This is the simplified version of the recipe. The essential framework.

Reality is messier. More complicated. More fun!

Reality throws in lots of rusty spanners so we do also need to understand how to manage the complexity; the unnecessary steps; the errors; the meddlers; and the inevitable variation.  It is possible (though not trivial) to design real systems to deliver much higher productivity by using the framework above and by mastering a number of other tools and techniques.  And for that to succeed the Governance, Operations and Finance functions need to collaborate closely with the People and the Process – initially with guidance from an experienced and competent Improvement Scientist. But only initially. This is a learnable skill. And it takes practice to master – so start with easy ones and work up.

If any of these bits are missing or are dysfunctional the recipe will not work. So that is the first nettle the Executive must grasp. Get everyone who is necessary on the same bus going in the same direction – and show the cynics the exit. Skeptics are OK – they will counter-balance the Optimists. Cynics add no value and are a liability.

What you may have noticed is that 8 of the 10 steps happen before any change is made. 80% of the effort is in the design – only 20% is in the doing.

If we get the design wrong the the doing will be an ineffective and inefficient waste of effort, time and money.


The best complement to real Improvement PIE is a FISH course.


Look Out For The Time Trap!

There is a common system ailment which every Improvement Scientist needs to know how to manage.

In fact, it is probably the commonest.

The Symptoms: Disappointingly long waiting times and all resources running flat out.

The Diagnosis?  90%+ of managers say “It is obvious – lack of capacity!”.

The Treatment? 90%+ of managers say “It is obvious – more capacity!!”

Intuitively obvious maybe – but unfortunately these are incorrect answers. Which implies that 90%+ of managers do not understand how their systems work. That is a bit of a worry.  Lament not though – misunderstanding is a treatable symptom of an endemic system disease called agnosia (=not knowing).

The correct answer is “I do not yet have enough information to make a diagnosis“.

This answer is more helpful than it looks because it prompts four other questions:

Q1. “What other possible system diagnoses are there that could cause this pattern of symptoms?”
Q2. “What do I need to know to distinguish these system diagnoses?”
Q3. “How would I treat the different ones?”
Q4. “What is the risk of making the wrong system diagnosis and applying the wrong treatment?”


Before we start on this list we need to set out a few ground rules that will protect us from more intuitive errors (see last week).

The first Rule is this:

Rule #1: Data without context is meaningless.

For example 130  is a number – it is data. 130 what? 130 mmHg. Ah ha! The “mmHg” is the units – it means millimetres of mercury and it tells us this data is a pressure. But what, where, when,who, how and why? We need more context.

“The systolic blood pressure measured in the left arm of Joe Bloggs, a 52 year old male, using an Omron M2 oscillometric manometer on Saturday 20th October 2012 at 09:00 is 130 mmHg”.

The extra context makes the data much more informative. The data has become information.

To understand what the information actually means requires some prior knowledge. We need to know what “systolic” means and what an “oscillometric manometer” is and the relevance of the “52 year old male”.  This ability to extract meaning from information has two parts – the ability to recognise the language – the syntax; and the ability to understand the concepts that the words are just labels for; the semantics.

To use this deeper understanding to make a wise decision to do something (or not) requires something else. Exploring that would  distract us from our current purpose. The point is made.

Rule #1: Data without context is meaningless.

In fact it is worse than meaningless – it is dangerous. And it is dangerous because when the context is missing we rarely stop and ask for it – we rush ahead and fill the context gaps with assumptions. We fill the context gaps with beliefs, prejudices, gossip, intuitive leaps, and sometimes even plain guesses.

This is dangerous – because the same data in a different context may have a completely different meaning.

To illustrate.  If we change one word in the context – if we change “systolic” to “diastolic” then the whole meaning changes from one of likely normality that probably needs no action; to one of serious abnormality that definitely does.  If we missed that critical word out then we are in danger of assuming that the data is systolic blood pressure – because that is the most likely given the number.  And we run the risk of missing a common, potentially fatal and completely treatable disease called Stage 2 hypertension.

There is a second rule that we must always apply when using data from systems. It is this:

Rule #2: Plot time-series data as a chart – a system behaviour chart (SBC).

The reason for the second rule is because the first question we always ask about any system must be “Is our system stable?”

Q: What do we mean by the word “stable”? What is the concept that this word is a label for?

A: Stable means predictable-within-limits.

Q: What limits?

A: The limits of natural variation over time.

Q: What does that mean?

A: Let me show you.

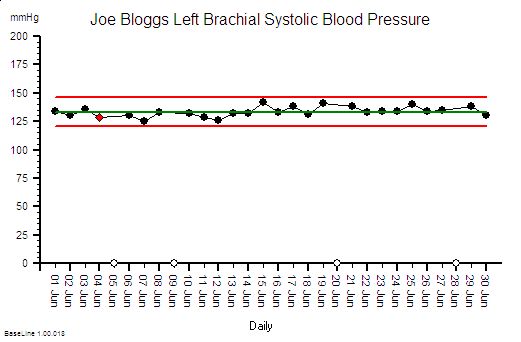
Joe Bloggs is disciplined. He measures his blood pressure almost every day and he plots the data on a chart together with some context .  The chart shows that his systolic blood pressure is stable. That does not mean that it is constant – it does vary from day to day. But over time a pattern emerges from which Joe Bloggs can see that, based on past behaviour, there is a range within which future behaviour is predicted to fall.  And Joe Bloggs has drawn these limits on his chart as two red lines and he has called them expectation lines. These are the limits of natural variation over time of his systolic blood pressure.

If one day he measured his blood pressure and it fell outside that expectation range  then he would say “I didn’t expect that!” and he could investigate further. Perhaps he made an error in the measurement? Perhaps something else has changed that could explain the unexpected result. Perhaps it is higher than expected because he is under a lot of emotional stress a work? Perhaps it is lower than expected because he is relaxing on holiday?

His chart does not tell him the cause – it just flags when to ask more “What might have caused that?” questions.

If you arrive at a hospital in an ambulance as an emergency then the first two questions the emergency care team will need to know the answer to are “How sick are you?” and “How stable are you?”. If you are sick and getting sicker then the first task is to stabilise you, and that process is called resuscitation.  There is no time to waste.


So how is all this relevant to the common pattern of symptoms from our sick system: disappointingly long waiting times and resources running flat out?

Using Rule#1 and Rule#2:  To start to establish the diagnosis we need to add the context to the data and then plot our waiting time information as a time series chart and ask the “Is our system stable?” question.

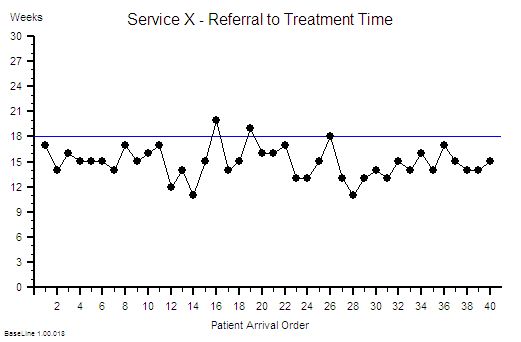
Suppose we do that and this is what we see. The context is that we are measuring the Referral-to-Treatment Time (RTT) for consecutive patients referred to a single service called X. We only know the actual RTT when the treatment happens and we want to be able to set the expectation for new patients when they are referred  – because we know that if patients know what to expect then they are less likely to be disappointed – so we plot our retrospective RTT information in the order of referral.  With the Mark I Eyeball Test (i.e. look at the chart) we form the subjective impression that our system is stable. It is delivering a predictable-within-limits RTT with an average of about 15 weeks and an expected range of about 10 to 20 weeks.

So far so good.

Unfortunately, the purchaser of our service has set a maximum limit for RTT of 18 weeks – a key performance indicator (KPI) target – and they have decided to “motivate” us by withholding payment for every patient that we do not deliver on time. We can now see from our chart that failures to meet the RTT target are expected, so to avoid the inevitable loss of income we have to come up with an improvement plan. Our jobs will depend on it!

Now we have a problem – because when we look at the resources that are delivering the service they are running flat out – 100% utilisation. They have no spare flow-capacity to do the extra work needed to reduce the waiting list. Efficiency drives and exhortation have got us this far but cannot take us any further. We conclude that our only option is “more capacity”. But we cannot afford it because we are operating very close to the edge. We are a not-for-profit organisation. The budgets are tight as a tick. Every penny is being spent. So spending more here will mean spending less somewhere else. And that will cause a big argument.

So the only obvious option left to us is to change the system – and the easiest thing to do is to monitor the waiting time closely on a patient-by-patient basis and if any patient starts to get close to the RTT Target then we bump them up the list so that they get priority. Obvious!

WARNING: We are now treating the symptoms before we have diagnosed the underlying disease!

In medicine that is a dangerous strategy.  Symptoms are often not-specific.  Different diseases can cause the same symptoms.  An early morning headache can be caused by a hangover after a long night on the town – it can also (much less commonly) be caused by a brain tumour. The risks are different and the treatment is different. Get that diagnosis wrong and disappointment will follow.  Do I need a hole in the head or will a paracetamol be enough?


Back to our list of questions.

What else can cause the same pattern of symptoms of a stable and disappointingly long waiting time and resources running at 100% utilisation?

There are several other process diseases that cause this symptom pattern and none of them are caused by lack of capacity.

Which is annoying because it challenges our assumption that this pattern is always caused by lack of capacity. Yes – that can sometimes be the cause – but not always.

But before we explore what these other system diseases are we need to understand why our current belief is so entrenched.

One reason is because we have learned, from experience, that if we throw flow-capacity at the problem then the waiting time will come down. When we do “waiting list initiatives” for example.  So if adding flow-capacity reduces the waiting time then the cause must be lack of capacity? Intuitively obvious.

Intuitively obvious it may be – but incorrect too.  We have been tricked again. This is flawed causal logic. It is called the illusion of causality.

To illustrate. If a patient complains of a headache and we give them paracetamol then the headache will usually get better.  That does not mean that the cause of headaches is a paracetamol deficiency.  The headache could be caused by lots of things and the response to treatment does not reliably tell us which possible cause is the actual cause. And by suppressing the symptoms we run the risk of missing the actual diagnosis while at the same time deluding ourselves that we are doing a good job.

If a system complains of  long waiting times and we add flow-capacity then the long waiting time will usually get better. That does not mean that the cause of long waiting time is lack of flow-capacity.  The long waiting time could be caused by lots of things. The response to treatment does not reliably tell us which possible cause is the actual cause – so by suppressing the symptoms we run the risk of missing the diagnosis while at the same time deluding ourselves that we are doing a good job.

The similarity is not a co-incidence. All systems behave in similar ways. Similar counter-intuitive ways.


So what other system diseases can cause a stable and disappointingly long waiting time and high resource utilisation?

The commonest system disease that is associated with these symptoms is a time trap – and they have nothing to do with capacity or flow.

They are part of the operational policy design of the system. And we actually design time traps into our systems deliberately! Oops!

We create a time trap when we deliberately delay doing something that we could do immediately – perhaps to give the impression that we are very busy or even overworked!  We create a time trap whenever we deferring until later something we could do today.

If the task does not seem important or urgent for us then it is a candidate for delaying with a time trap.

Unfortunately it may be very important and urgent for someone else – and a delay could be expensive for them.

Creating time traps gives us a sense of power – and it is for that reason they are much loved by bureaucrats.

To illustrate how time traps cause these symptoms consider the following scenario:

Suppose I have just enough resource-capacity to keep up with demand and flow is smooth and fault-free.  My resources are 100% utilised;  the flow-in equals the flow-out; and my waiting time is stable.  If I then add a time trap to my design then the waiting time will increase but over the long term nothing else will change: the flow-in,  the flow-out,  the resource-capacity, the cost and the utilisation of the resources will all remain stable.  I have increased waiting time without adding or removing capacity. So lack of resource-capacity is not always the cause of a longer waiting time.

This new insight creates a new problem; a BIG problem.

Suppose we are measuring flow-in (demand) and flow-out (activity) and time from-start-to-finish (lead time) and the resource usage (utilisation) and we are obeying Rule#1 and Rule#2 and plotting our data with its context as system behaviour charts.  If we have a time trap in our system then none of these charts will tell us that a time-trap is the cause of a longer-than-necessary lead time.

Aw Shucks!

And that is the primary reason why most systems are infested with time traps. The commonly reported performance metrics we use do not tell us that they are there.  We cannot improve what we cannot see.

Well actually the system behaviour charts do hold the clues we need – but we need to understand how systems work in order to know how to use the charts to make the time trap diagnosis.

Q: Why bother though?

A: Simple. It costs nothing to remove a time trap.  We just design it out of the process. Our flow-in will stay the same; our flow-out will stay the same; the capacity we need will stay the same; the cost will stay the same; the revenue will stay the same but the lead-time will fall.

Q: So how does that help me reduce my costs? That is what I’m being nailed to the floor with as well!

A: If a second process requires the output of the process that has a hidden time trap then the cost of the queue in the second process is the indirect cost of the time trap.  This is why time traps are such a fertile cause of excess cost – because they are hidden and because their impact is felt in a different part of the system – and usually in a different budget.

To illustrate. Suppose that 60 patients per day are discharged from our hospital and each one requires a prescription of to-take-out (TTO) medications to be completed before they can leave.  Suppose that there is a time trap in this drug dispensing and delivery process. The time trap is a policy where a porter is scheduled to collect and distribute all the prescriptions at 5 pm. The porter is busy for the whole day and this policy ensures that all the prescriptions for the day are ready before the porter arrives at 5 pm.  Suppose we get the event data from our electronic prescribing system (EPS) and we plot it as a system behaviour chart and it shows most of the sixty prescriptions are generated over a four hour period between 11 am and 3 pm. These prescriptions are delivered on paper (by our busy porter) and the pharmacy guarantees to complete each one within two hours of receipt although most take less than 30 minutes to complete. What is the cost of this one-delivery-per-day-porter-policy time trap? Suppose our hospital has 500 beds and the total annual expense is £182 million – that is £0.5 million per day.  So sixty patients are waiting for between 2 and 5 hours longer than necessary, because of the porter-policy-time-trap, and this adds up to about 5 bed-days per day – that is the cost of 5 beds – 1% of the total cost – about £1.8 million.  So the time trap is, indirectly, costing us the equivalent of £1.8 million per annum.  It would be much more cost-effective for the system to have a dedicated porter working from 12 am to 5 pm doing nothing else but delivering dispensed TTOs as soon as they are ready!  And assuming that there are no other time traps in the decision-to-discharge process;  such as the time trap created by batching all the TTO prescriptions to the end of the morning ward round; and the time trap created by the batch of delivered TTOs waiting for the nurses to distribute them to the queue of waiting patients!


Q: So how do we nail the diagnosis of a time trap and how do we differentiate it from a Batch or a Bottleneck or Carveout?

A: To learn how to do that will require a bit more explanation of the physics of processes.

And anyway if I just told you the answer you would know how but might not understand why it is the answer. Knowledge and understanding are not the same thing. Wise decisions do not follow from just knowledge – they require understanding. Especially when trying to make wise decisions in unfamiliar scenarios.

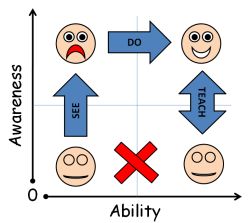
It is said that if we are shown we will understand 10%; if we can do we will understand 50%; and if we are able to teach then we will understand 90%.

So instead of showing how instead I will offer a hint. The first step of the path to knowing how and understanding why is in the following essay:

A Study of the Relative Value of Different Time-series Charts for Proactive Process Monitoring. JOIS 2012;3:1-18

Click here to visit JOIS

Safety by Despair, Desire or Design?

Imagine the health and safety implications of landing a helicopter carrying a critically ill patient on the roof of a hospital.

Consider the possible number of ways that this scenario could go horribly wrong. But in reality it does not because this is a very visible hazard and the associated risks are actively mitigated.

It is much more dangerous for a slightly ill patient to enter the doors of the hospital on their own two legs.  Surely not!  How can that be?

First the reality – the evidence.

Repeated studies have shown that about 1 in 300  emergency admissions to hospitals do not leave alive and their death is avoidable. And it is not just weekends that are risky. That means about 1 person per week for each large acute hospital in England. That is about a jumbo-jet full of people every week in England. If you want to see the evidence click here to get a copy of a recent study.

How long would an airline stay in business if it crashed one plane full of passengers every week?

And how do we know that these are the risks? Well by looking at hospitals who have recognised the hazards and the risks and have actively done something about it. The ones that have used Improvement Science – and improved.


In one hospital the death rate from a common, high-risk emergency was significantly reduced overnight simply by designing and implementing a protocol that ensured these high-risk patients were admitted to the same ward. It cost nothing to do. No extra staff or extra beds. The effect was a consistently better level of care through proactive medical management. Preventing risk rather than correcting harm. The outcome was not just fewer deaths – the survivers did better too. More of them returned to independent living – which had a huge financial implication for the cost of long term care. It was cheaper for the healthcare system. But that benefit was felt in a different budget so there was no direct financial reward to the hospital for improving the outcome.  So the improvement was not celebrated and sustained. Finance trumped Governance. Desire to improve safety is not enough.


Eventually and inevitably the safety issue will resurface and bite back.  The Mid Staffordshire Hospital debacle is a timely reminder. Eventually despair will drive change – but it will come at a high price.  The emotional knee jerk reaction driven by public outrage will be to add yet more layers of bureaucracy and cost: more inspectors, inspections and delays.  The knee jerk is not designed to understand the root cause and correct it – that toxic combination of ignorance and confidence that goes by the name arrogance.


The reason that the helicopter-on-the-hospital is safer is because it is designed to be – and one of the tools used in safe process design is called Failure Modes and Effects Analysis or FMEA.

So if there is anyone reading this who is in a senior clinical or senior mangerial role in a hospital that has any safety issues – and who has not heard of FMEA then they have a golden opportunity to learn a skill that will lead to safer-by-design hospital.

Safer-by-design hospitals are less frightening to walk into, less demotivating to work in and cheaper to run.  Everyone wins.

If you want to learn more now then click here for a short summary of FMEA from the Institute of Healthcare Improvement.

It was written in 2004. That is eight years ago.

Structure Time to Fuel Improvement

The expected response to any suggestion of change is “Yes, but I am too busy – I do not have time.”

And the respondent is correct. They do not.

All their time is used just keeping their head above water or spinning the hamster wheel or whatever other metaphor they feel is appropriate.  We are at an impasse. A stalemate. We know change requires some investment of time and there is no spare time to invest so change cannot happen. Yes?  But that is not good enough – is it?

Well-intended experts proclaim that “I’m too busy” actually means “I have other things to do that are higher priority“. And by that we mean ” … that are a greater threat to my security and to what I care about“. So to get our engagement our well-intended expert pours emotional petrol on us and sets light to it. They show us dramatic video evidence of how our “can’t do” attitude and behaviour is part of the problem. We are the recalcitrant child who is standing in the way of  change and we need to have our face rubbed in our own cynical poo.

Now our platform is really burning. Inflamed is exactly what we are feeling – angry in fact. “Thanks-a-lot. Now #!*@ off!”   And our well-intentioned expert retreats – it is always the same. The Dinosaurs and the Dead Wood are clogging the way ahead.

Perhaps a different perspective might be more constructive.


It is not just how much time we have that is most important – it is how our time is structured.


Humans hate unstructured time. We like to be mentally active for all of our waking moments. 

To test this hypothesis try this demonstration of our human need to fill idle time with activity. When you next talk to someone you know well – at some point after they have finished telling you something just say nothing;  keep looking at them; and keep listening – and say nothing. For up to twenty seconds if necessary. Both you and they will feel an overwhelming urge to say something, anything – to fill the silence. It is called the “pregnant pause effect” and most people find even a gap of a second or two feels uncomfortable. Ten seconds would be almost unbearable. Hold your nerve and stay quiet. They will fill the gap.

This technique is used by cognitive behavioural therapists, counsellors and coaches to help us reveal stuff about ourselves to ourselves – and it works incredibly well. It is also used for less altrusitic purposes by some – so when you feel the pain of the pregnant pause just be aware of what might be going on and counter with a question.


If we have no imposed structure for our time then we will create one – because we feel better for it. We have a name for these time-structuring behaviours: habits, past-times and rituals. And they are very important to us because they reduce anxiety.

There is another name for a pre-meditated time-structure:  it is called a plan or a process design. Many people hate not having a plan – and to them any plan is better than none. So in the absence of an imposed alternative we habitually make do with time-wasting plans and poorly designed processes.  We feel busy because that is the purpose of our time-structuring behaviour – and we look busy too – which is also important. This has an important lesson for all improvement scientists: Using a measure of “business” such as utilisation as a measure of efficiency and productivity is almost meaningless. Utilisation does not distinguish between useful busi-ness and useless busi-ness.

We also time-structure our non-working lives. Reading a newspaper, doing the crossword, listening to the radio,  watching television, and web-browsing are all time-structuring behaviours.


This insight into our need for structured time leads to a rational way to release time for change and improvement – and that is to better structure some of our busy time.

A useful metaphor for a time-structure is a tangible structure – such as a building. Buildings have two parts – a supporting, load bearing, structural framework and the functional fittings that are attached to it. Often the structural framework is invisible in the final building – invisible but essential. That is why we need structural engineers. The same is true for time-structuring: the supporting form should be there but it should not not get in the way of the intended function. That is why we need process design engineers too. Good process design is invisible time-structuring.


One essential investment of time in all organisations is communication. Face-to-face talking, phone calls, SMS, emails, reports, meetings, presentations, webex and so on. We spend more time communicating with each other than doing anything else other than sleeping.  And more niggles are generated by poorly designed and delivered communication processes than everything else combined. By a long way.


As an example let us consider management meetings.

From a process design perspective mmany management meetings are both ineffective and inefficient. They are unproductive.  So why do we still have them?

One possibkle answer is because meetings have two other important purposes: first as a tool for social interaction, and second as a way to structure time.  It turns out that we dislike loneliness even more than idleness – and we can meet both needs at the same time by having a meeting. Productivity is not the primary purpose.


So when we do have to communicate effectively and efficiently in order to collectively resolve a real and urgent problem then we are ill prepared. And we know this. We know that as soon as Crisis Management Committees start to form then we are in really big trouble. What we want in a time of crisis is for someone to structure time for us. To tell us what to do.

And some believe that we unconsciously create crisis after crisis for just that purpose.


Recently I have been running an improvement experiment.  I have  been testing the assumption that we have to meet face-to-face to be effective. This has big implications for efficiency because I work in a multi-site organisation and to attend a meeting on another site implies travelling there and back. That travel takes one hour in each direction when all the separate parts are added together. It has two other costs. The financial cost of the fuel – which is a variable cost – if I do not travel then I do not incur the cost. And there is an emotional cost – I have to concentrate on driving and will use up some of my brain-fuel in doing so. There are three currencies – emotional, temporal and financial.

The experiment was a design change. I changed the design of the communication process from at-the-same-place-and-time to just at-the-same-time. I used an internet-based computer-to-computer link (rather like Skype or FaceTime but with some other useful tools like application sharing).

It worked much better than I expected.

There was the anticipated “we cannot do this because we do not have webcams and no budget for even pencils“. This was solved by buying webcams from the money saved by not burning petrol. The conversion rate was one webcam per four trips – and the webcam is a one off capital cost not a recurring revenue cost. This is accpiuntant-speak for “the actual cash released will fund the change“. No extra budget is required. And combine the fuel savings for everyone, and parking charges and the payback time is even shorter.

There were also the anticipated glitches as people got used to the unfamiliar technology (they did not practice of course because they were too busy) but the niggles go away with a few iterations.

So what were the other benefits?

Well one was the travel time saved – two hours per meeting – which was longer than the meeting! The released time cannot be stored and used later like the money can – it has to be reinvested immediately. I reinvested it in other improvement work. So the benefit was amplified.

Another was the brain-fuel saved from not having to drive – which I used to offset my cumuative brain-fuel deficit called chronic fatigue. The left over was re-invested in the improvement work. 100% recycled. Nothing was wasted.


The unexpected benefit was the biggest one.

The different communication design of a virtual meeting required a different form of meeting structure and discipline. It took a few iterations to realise this – then click – both effectiveness and efficiency jumped up. The time became even better structured, more productive and released even more time to reinvest. Wow!

And the whole thing funded itself.

The Frightening Cost Of Fear

The recurring theme this week has been safety and risk.

Specifically in a healthcare context. Most people are not aware just how risky our current healthcare systems are. Those who work in healthcare are much more aware of the dangers but they seem powerless to do much to make their systems safer for patients.


The shroud-waving  zealots who rant on about safety often use a very unhelpful quotation. They say “Every system is perfectly designed to deliver the performance it does“. The implication is that when the evidence shows that our healthcare systems are dangerous …. then …. we designed them to be dangerous.  The reaction from the audience is emotional and predictable “We did not intend this so do not try to pin the blame on us!”  The well-intentioned shroud-waving safety zealot loses whatever credibility they had and the collective swamp of cynicism and despair gets a bit deeper.


The warning-word here is design – because it has many meanings.  The design of a system can mean “what the system is” in the sense of a blueprint. The design of a system can also mean “how the blueprint was created”.  This process sense is the trap – because it implies intention.  Design needs a purpose – the intended outcome – so to say an unsafe system has been designed is to imply that it was intended to be unsafe. This is incorrect.

The message in the emotional backlash that our well-intended zealot provoked is “You said we intended bad things to happen which is not correct so if you are wrong on that fundamental belief then how can I trust anything else you say?“. This is the reason zealots lose credibility and actually make improvement less likely to happen.


The reality is not that the system was designed to be unsafe – it is that it was not designed not to be. The double negatives are intentional. The two statements are not the same.


The default way of the Universe is evolutionary (which is unintentional and reactive) and chaotic (which is unstable and unsafe). To design a system to be not-unsafe we need to understand Two Sciences – Design Science and Safety Science. Only then can we proactively and intentionally design safe, stable, and trustable systems.    If we do nothing and do not invest in mastering the Two Sciences then we will get the default outcome: unintended unsafety.  This is what the uncomfortable  evidence says we have.


So where does the Frightening Cost of Fear come in?

If our system is unintentionally and unpredictably unsafe then of course we will try to protect ourselves from the blame which inevitably will follow from disappointed customers.  We fear the blame partly because we know it is justified and partly because we feel powerless to avoid it. So we cover our backs. We invent and implement complex check-and-correct systems and we document everything we do so that we have the evidence in the inevitable event of a bad outcome and the backlash it unleashes. The evidence that proves we did our best; it shows we did what the safety zealots told us to do; it shows that we cannot be held responsible for the bad outcome.

Unfortunately this strategy does little to prevent bad outcomes. In fact it can have has exactly the opposite effect of what is intended. The added complexity and cost of our cover-my-back bureaucracy actually increases the stress and chaos and makes bad outcomes more likely to happen. It makes the system even less safe. It does not deflect the blame. It just demonstrates that we do not understand how to design a not-unsafe system.


And the financial cost of our fear is frighteningly high.

Studies have shown that over 60% of nursing time is spent on documentation – and about 70% of healthcare cost is on hospital nurse salaries. The maths is easy – at least 42% of total healthcare cost is spent on back-covering-blame-deflection-bureaucracy.

It gets worse though.

Those legal documents called clinical records need to be moved around and stored for a minimum of seven years. That is expensive. Converting them into an electronic format misses the point entirely. Finding the few shreds of valuable clinical information amidst the morass of back-covering-bureaucracy uses up valuable specialist time and has a high risk of failure. Inevitably the risk of decision errors increases – but this risk is unmeasured and is possibly unmeasurable. The frustration and fear it creates is very obvious though: to anyone willing to look.

The cost of correcting the Niggles that have been detected before they escalate to Not Agains, Near Misses and Never Events can itself account for half the workload. And the cost of clearing up the mess after the uncommon but inevitable disaster becomes built into the system too – as insurance premiums to pay for future litigation and compensation. It is no great surprise that we have unintentionally created a compensation culture! Patient expectation is rising.

Add all those costs up and it becomes plausible to suggest that the Cost of Fear could be a terrifying 80% of the total cost!


Of course we cannot just flick a switch and say “Right – let us train everyone in safe system design science“.  What would all the people who make a living from feeding on the present dung-heap do? What would the checkers and auditors and litigators and insurers do to earn a crust? Join the already swollen ranks of the unemployed?


If we step back and ask “Does the Cost of Fear principle apply to everything?” then we are faced with the uncomfortable conclusion that it most likely is.  So the cost of everything we buy will have a Cost of Fear component in it. We will not see it written down like that but it will be in there – it must be.

This leads us to a profound idea.  If we collectively invested in learning how to design not-unsafe systems then the cost of everything could fall. This means we would not need to work as many hours to earn enough to pay for what we need to live. We could all have less fear and stress. We could all have more time to do what we enjoy. We could all have both of these and be no worse off in terms of financial security.

This Win-Win-Win outcome feels counter-intuitive enough to deserve serious consideration.


So here are some other blog topics on the theme of Safety and Design:

Never Events, Near Misses, Not Agains and Nailing Niggles

The Safety Line in the Quality Sand

Safety By Design

Predictable and Explainable – or Not

It is a common and intuitively reasonable assumption to believe that if something is explainable then it is predictable; and if it is not explainable then it is not predictable. Unfortunately this beguiling assumption is incorrect.  Some things are explainable but not predictable; and some others are predictable but not explainable.  Believe me? Of course not. We are all skeptics when our intuitively obvious assumptions and conclusions are challenged! We want real and rational evidence not rhetorical exhortation.

OK.  Explainable means that the principles that guide the process are conceptually simple. We can explain the parts in detail and we can explain how they are connected together in detail. Predictable implies that if we know the starting point in detail, and the intervention in detail, then we can predict what the outcome will be – in detail.


Let us consider an example. Say we know how much we have in our bank account, and we know how much we intend to spend on that new whizzo computer, then we can predict what will be left in out bank account when the payment has been processed. Yes. This is an explainable and predictable system. It is called a linear system.


Let us consider another example. Say we know we have six dice each with numbers 1 to 6 printed on them and we throw them at the same time. Can we predict where they will land and what the final sum will be? No. We can say that it will be between 6 and 36 but that is all. And after we have thrown the dice we will not be able to explain, in detail, how they came to rest exactly where they did.  This is an unpredictable and unexplainable system. It is called a random system.


This is a picture of a conceptually simple system. It is a novelty toy and it comprises two thin sheets of glass held a few millimetres apart by some curved plastic spacers. The narrow space is filled with green coloured oil, some coarse black volcanic sand, and some fine white coral sand. That is all. It is a conceptually simple toy. I have (by some magical means) layered the sand so that the coarse black sand is at the bottom and the fine white sand is on top. It is stable arrangement – and explainable. I then tipped the toy on its side – I rotated it through 90 degrees. It is a simple intervention – and explainable.

My intervention has converted a stable system to an unstable one and I confidently predict that the sand and oil will flow under the influence of gravity. There is no randomness here – I do not jiggle the toy – so the outcome should be predictable because I can explain all the parts in detail before we start;  and I can explain the process in detail; and I can explain precisely what my intervention will be. So I should be able to predict the final configuration of the sand when this simple and explainable system finally settles into a new stable state again. Yes?

Well, I cannot. I can make some educated guesses – some plausible projections. But the only way to find out precisely what will happen is by doing the experiment and observing what actually happens.

This is what happened.

The final, stable configuration of the coarse black and fine white sand has a strange beauty in the way the layers are re-arranged. The result is not random – it has structure. And with the benefit of hindsight I feel I can work backwards and understand how it might have come about. It is explainable in retrospect but I could not predict it in prospect – even with a detailed knowledge of the starting point and the process.

This is called a non-linear system. Explainable in concept but difficult to predict in practice. The weather is another example of a non-linear system – explainable in terms of the physics but not precisely predictable. How reliable are our long range weather forecasts – or the short range ones for that matter?

Non-linear systems exhibit complex and unpredictable  behaviour – even though they may be simple in concept and uncomplicated in construction.  Randomness is usually present in real systems but it is not the cause of the complex behaviour, and making our systems more complicated seems likely to result in more unpredictable behaviour – not less.

If we want the behaviour of our system to be predictable and our system has non-linear parts and relationships in it – then we are forced to accept two Universal Truths.

1. That our system behaviour will only be predictable within limits (even if there is little or no randomness in it).

2. That to keep the behaviour within acceptable limits then we need to be careful how we arrange the parts and how they relate to each other.

This challenge of creating a predictable-within-acceptable-limits system from non-linear parts is called resilient design.


We have a fourth option to consider: a system that has a predictable outcome but an unexplainable reason.

We make predictions two ways – by working out what will happen or by remembering what has happened before. The second method is much easier so it is the one we use most of the time: it is called re-cognition. We call it knowledge.

If we have a black box with inputs on one side and outputs on the other, and we observe that when we set the inputs to a specific configuration we always get the same output – then we have a predicable system. We cannot explain how the inputs result in the output because the inner workings are hidden. It could be very simple – or it could be fiendishly complicated – we do not know.

It this situation we have no choice but to accept the status quo – and we have to accept that to get a predictable outcome we have to follow the rules and just do what we have always done before. It is the creed of blind acceptance – the If you always do what you have always done you will always get what you always got. It is knowledge but it is not understanding.  New knowledge  can only be found by trial and error.  It is not wisdom, it is not design, it is not curiosity and it is not Improvement Science.


If our systems are non-linear (which they are) and we want predictable and acceptable performance (which we do) then we must strive to understand them and then to design them to be as simple as possible (which is difficult) so that we have the greatest opportunity to improve their performance by design (which is called Improvement Science).


This is a snapshot of the evolving oil-and-sand system. Look at that weird wine-glass shaped hole in the top section caused by the black sand being pulled down through the gap in the spacer then running down the slope of the middle section to fill a white sand funnel and then slip through the next hole onto the top of the white sand pyramid created by the white sand in the middle section that slipped through earlier onto the top of the sliding sand in the lowest section. Did you predict that? I suspect not. Me neither. But I can explain it – with the benefit of hindsight.

So what is it that is causing this complex behaviour? It is the spacers – the physical constraints to the flow of the sand and oil. And the same is true of systems – when the process hits a constraint then the behaviour suddenly changes and complex behaviour emerges.  And there is more to it than even this. It is the gaps between the spacers that is creating the complex behaviour. The flow from one compartment leaking into the next and influencing its behaviour, and then into the next.  This is what happens in all systems – the more constraints that are added to force the behaviour into predictable channels, and the more gaps that exist in the system of constraints then the more complex and unpredictable the system behaviour becomes. Which is exactly the opposite of the intended outcome.


The lesson that this simple toy can teach us is that if we want stable and predictable (i.e. non-complex) behaviour from our complicated systems then we must design them to operate inside the constraints so that they just never quite touch them. That requires data, information, knowledge, understanding and wise design. That is called Improvement Science.


But if, in an act of desperation, we force constraints onto the system we will make the system less stable, less predictable, less safe, less productive, less enjoyable and less affordable. That is called tampering.

Little and Often

There seem to be two extremes to building the momentum for improvement – One Big Whack or Many Small Nudges.


The One Big Whack can come at the start and is a shock tactic designed to generate an emotional flip – a Road to Damascus moment – one that people remember very clearly. This is the stuff that newspapers fall over themselves to find – the Big Front Page Story – because it is emotive so it sells newspapers.  The One Big Whack can also come later – as an act of desperation by those in power who originally broadcast The Big Idea and who are disappointed and frustrated by lack of measurable improvement as the time ticks by and the money is consumed.


Many Small Nudges do not generate a big emotional impact; they are unthreatening; they go almost unnoticed; they do not sell newspapers, and they accumulate over time.  The surprise comes when those in power are delighted to discover that significant improvement has been achieved at almost no cost and with no cajoling.

So how is the Many Small Nudge method implemented?

The essential element is The Purpose – and this must not be confused with A Process.  The Purpose is what is intended; A Process is how it is achieved.  And answering the “What is my/our purpose?” question is surprisingly difficult to do.

For example I often ask doctors “What is our purpose?”  The first reaction is usually “What a dumb question – it is obvious”.  “OK – so if it is obvious can you describe it?”  The reply is usually “Well, err, um, I suppose, um – ah yes – our purpose is to heal the sick!”  “OK – so if that is our purpose how well are we doing?”  Embarrassed silence. We do not know because we do not all measure our outcomes as a matter of course. We measure activity and utilisation – which are measures of our process not of our purpose – and we justify not measuring outcome by being too busy – measuring activity and utilisation.

Sometimes I ask the purpose question a different way. There is a Latin phrase that is often used in medicine: primum non nocere which means “First do no harm”.  So I ask – “Is that our purpose?”.  The reply is usually something like “No but safety is more important than efficiency!”  “OK – safety and efficiency are both important but are they our purpose?”.  It is not an easy question to answer.

A Process can be designed – because it has to obey the Laws of Physics. The Purpose relates to People not to Physics – so we cannot design The Purpose, we can only design a process to achieve The Purpose. We can define The Purpose though – and in so doing we achieve clarity of purpose.  For a healthcare organisation a possible Clear Statement of Purpose might be “WE want a system that protects, improves and restores health“.

Purpose statements state what we want to have. They do not state what we want to do, to not do or to not have.  This may seem like a splitting hairs but it is important because the Statement of Purpose is key to the Many Small Nudges approach.

Whenever we have a decision to make we can ask “How will this decision contribute to The Purpose?”.  If an option would move us in the direction of The Purpose then it gets a higher ranking to a choice that would steer us away from The Purpose.  There is only one On Purpose direction and many Off Purpose ones – and this insight explains why avoiding what we do not want (i.e. harm) is not the same as achieving what we do want.  We can avoid doing harm and yet not achieve health and be very busy all at the same time.


Leaders often assume that it is their job to define The Purpose for their Organisation – to create the Vision Statement, or the Mission Statement. Experience suggests that clarifying the existing but unspoken purpose is all that is needed – just by asking one little question – “What is our purpose?” – and asking it often and of everyone – and not being satisfied with a “process” answer.

The Essential Role of the Credible Skeptic

All improvement implies change – some may be incremental elimination of current Niggles; other may be breakthrough achievement of future NiceIfs.

Change is an uphill struggle and the inevitable friction generates heat and sparks which dissipate some of the energy.

People throw spanners into the wheel which may eventually grind to a halt. Experts talk about “oiling the wheels of change” and generating momentum. The mechanical metaphors are numerous and have a common thread – that change requires pushing.

The unstated assumption is that resistance is “bad” and any means to overcome or bypass resistance is therefore justified – but this assumption is one-sided and discounts the possibility that there is a “good” side to resistance.

Suppose a design is proposed that would be effective (it would do the right thing) then resistance-to-change would be counter-improvement. Suppose the proposed design would be ineffective (it would not do the right thing and might even lead to the wrong thing) then resistance-to-change would be protective. The difference is the effectiveness of the design – not the presence of resistance-to-change.


Effectiveness has two components – effective in theory and effective in practice.  Demonstrating effectiveness in theory is the purpose of pure research; delivering effectiveness in practice is the purpose of applied research. Both are embraced in Improvement Science.

Who is best placed to decide what will work in theory? An academic.

Who is best placed to decide what can work in practice? A pragmatist.

So we need both doing the parts that they do best.  And we need them doing it at the same time … not in sequence … not theory and then practice.


It is a common assumption that novel designs are created sequentially – working from big conceptual chunks in stages of increasing detail to the final blueprints.

Reality is a bit messier than this!

An experienced design team will flip between broad-brush and fine-detail and they know the importance of including both theorists and pragmatists in the team. This is where the practical challenge comes because most people have a preference for one or the other modes of thinking.

Coordinating the effective-design-conversation requires awareness by everyone of the value of both.  This is not discussion, instruction, manipulation, or facilitation – it is education. The role of the design team leader is to create the context to allow the learning to flow and the synergy to emerge.


The symptoms and signs associated with inexperienced design teams are:

  • Design done behind closed doors by strategists with the assistance of theoretical advisors called management consultants.
  • Design decisions are delivered as a “fait accompli” to those expected to “operationalise” them.
  • Language such as “herding cats” is used to refer to the influential skeptics who represent the “front line barrier to change”.

These symptoms are harbingers of failure – poor designs that flounder on the Rocks of Don’t Do and good designs that get stuck on the Sands of Won’t Do.


The experienced design team knows these hidden dangers and has learned how to steer around them by demonstrating respect for the theory and for the practice and staying in the Channel to Success. There need to be respected Optics (visionary optimists) and credible Skeptics (respectful pessimists) at both the academic and the pragmatic poles to generate creative resonance. Synergy. An effective design team includes the role of Credible Skeptic.


And there are no chairs at the effective design table for the Politics (egocentric activists) and the Cynics (disrespectful pessimists). Their beliefs, attitudes and behaviours generate dissonance and turbulence which dissipates and wastes the effort, time and money of everyone else.


And we must always remember that effective design comes before efficient design.  Doing the wrong thing efficiently makes it wronger!  First do the right thing – then do it better. That is a design where everyone benefits.


Disappointers, Delighters and Satisfiers.

There are two broad approaches to improvement. One is to start with what we have got now and tinker with it in the hope it will get better.  When this is done well it is effective albeit slow. When it is done badly it amounts to dangerous meddling. The more interconnected the system we are trying to improve the more likely our well intentioned tinkering will create a bigger problem in the future than we have now.

Another approach is to start with what-we-want-to-have in the future and then design-to-deliver it. Our starting point is not an aspirational dream vision, also known as an hallucination, it is a clear performance specification with four dimensions: safety, delivery, quality and affordability. This is called a SFQP specification.

The first one to focus on is safety … and what we usually find is that risk of harm is usually a knock-on effect of delivery and quality design problems.

The easiest one is delivery – because it is the application of process physics. The next easiest one is affordability because that is the application of value system accounting.

The tricky one is quality because that implies subjectivity, people, psychology, behaviour and politics. When we add quality to our design challenge we rack up the wickedness score!

So, how do we create a clear and realistic output quality performance specification?

If we draw up a chart with Subjective Quality on the Y-axis and Objective Performance on the X-axis, we can plot all the characteristics of our current and future design on this chart.  And when we do that we discover some surprising things.

First – some factors go unnoticed until the performance drops. Said another way we do not notice when it is working – we only only notice when it is not.  These factors are called Disappointers.  We take for granted that things work 99% of the time – the sun comes up every morning; there is 21% of oxygen in the atmosphere; the air temperature is OK; the electricity is on; the milk, paper and post gets delivered; the car starts and so on. We take it all for granted and we complain when it unexpectedly does not.

So if we ask our customers what they want from an improved service they do not spontaneously volunteer what is currently working well and that they take for granted – because it is out of their awareness.  This is what Henry Ford implied when he said “If I asked the customer what they wanted I would have got a faster horse“. It is also the reason why a Three Wins design starts with The 4N Chart® – and specifically the Nuggets corner. We need to make conscious what works well because when we plan improvement we do not want to unintentionally discard the baby with the bath water!

Second – some factors go unnoticed until performance exceeds a minimum threshold. They are not expected so we do not mind if they are not provided – but if they are unexpectedly provided then we are surprised and Delighted.  The first time. Once we know what is possible we come to expect it again, and eventually every time.


A common design error is to try to use a Delighter to compensate for a Disappointer.

Suppose we walked into our hotel room and found a complimentary bottle of wine that we were not expecting and then we discovered that there was no toilet paper and the shower was cold. The bottle of wine would not compensate for our disappointment and it might even irritate us because we conclude that the management does not care about our basic needs. Our trust is eroded and our feedback reflects that.


Effective design for trusted quality starts by eliminating the possibility of disappointment. We design it so the expected essentials are “right first time and every time“.  Our measure of success is not praise – it is absence of complaints. A deafening silence. It is what does not happen that is important. Good expected essential design is invisible – because it never intrudes on our awareness.  And for this reason it is surprisingly difficult to do. It requires pro-action not re-action.


The third type of factor is the Satisfier – and these are the ones that our customers will volunteer because they are aware of them. Lower performance giving lower perceived quality scores and higher performance giving higher.  These are the “you get what you pay for” factors. A better designed car is expected to be more comfortable, quieter, easier to drive, safer, more reliable, more effort-saving gadgets and so on. Price is a satisfier. Cost is not. Cost is an output of the design process. So the better the design the greater the gap can be between cost and price.


This method is called Kano Analysis and an understanding of it is essential for effective quality improvement. And like so much of Improvement Science it appears counter-intuitive at first,  common-sense when explained, and blindingly obvious when experienced.


The Challenge of Wicked Problems

“Wicked problem” is a phrase used to describe a problem that is difficult or impossible to solve because of incomplete, contradictory, and changing requirements that are often not recognised.
The term ‘wicked’ is used, not in the sense of evil, but rather in the sense that it is resistant to resolution.
The complex inter-dependencies imply that an effort to solve one aspect of a wicked problem may reveal or create other problems.

System-level improvement is a very common example of a wicked problem, so an Improvement Scientist needs to be able to sort the wicked problems from the tame ones.

Tame problems can be solved using well known and understood methods and the solution is either right or wrong. For example – working out how much resource capacity is needed to deliver a defined demand is a tame problem.  Designing a booking schedule to avoid excessive waiting is a tame problem.  The fact that many people do not know how to solve these tame problems does not make them wicked ones.  Ignorance in not that same as intransigence.

Wicked problems do not have right or wrong solutions – they have better or worse outcomes.  Wicked problems cannot be precisely defined, dissected, analysed and solved. They are messy. They are more than complicated – they are complex.  A mechanical clock is a complicated mechanism but designing, building, operating and even repairing a clock is a tame problem not a wicked one.

So how can we tell a wicked problem from a tame one?

If a problem has been solved and there is a known and repeatable solution then it is, by definition, a tame problem.  If a problem has never been solved then it might be tame – and the only way to find out is to try solving it.
The barrier we then discover is that each of us gets stuck in the mud of our habitual, unconscious assumptions. Experience teaches us that just taking a different perspective can be enough to create the breakthrough insight – the “Ah ha!” moment. Seeking other perspectives and opinions is an effective strategy when stuck.

So, if two-heads-are-better-than-one then many heads must be even better! Do we need a committee to solve wicked problems?
Experience teaches us that when we try it we find that it often does not work!
The different perspectives also come with different needs, different assumptions, and different agendas and we end up with a different wicked problem. The committee is rendered ineffective and inefficient by rhetorical discussion and argument.

This is where a very useful Improvement Science technique comes in handy. It is called Argument Free Problem Solving (AFPS) and it was intentionally designed to facilitate groups working on complex problems.

The trick to AFPS is to understand what generates the arguments and to design these causes out of the problem solving process. There are several contributors.

First there is just good old fashioned disrespectful skepticism – otherwise known as cynicism.  The antidote to this poison is to respectfully challenge the disrespectful component of the cynical behaviour – the personal discounting bit.  And it is surprisingly effective!

Second there is the well known principle that different people approach life and problems in different ways.  Some call this temperament and others call it personality. Whatever the label, knowing our preferred style and how different styles can conflict is useful because it leads to mutual respect for our different gifts.  One tried and tested method is Jungian Typology which comes in various brands such as the MBTI® (Myers Briggs Type Indicator).

Third there is the deepening understanding of how the 1.3 kg of caveman wetware between our ears actually works.  The ongoing advances in neuroscience are revealing fascinating insights into how “irrational” we really are and how easy it is to fool the intuition. Stage magicians and hypnotists make a living out of this inherent “weakness”. One of the lessons from neuroscience is that we find it easier to communicate when we are all in the same mental state – even if we have different temperaments.  It is called cognitive  resonance.  Being on the same wavelength.  Arguments arise when different people are in conflicting mental states – cognitive dissonance.

So an effective problem solving team is more akin to a flock of birds or a shoal of fish – that can change direction quickly and as one – without a committee, without an argument, and without creating chaos.  For birds and fish it is an effective survival strategy because it confounds the predators. The ones that do not join in … get eaten!

When a group are able to change perspective together and still stay focused on the problem then the tame ones get resolved and the wicked ones start to be dissolved.
And that is all we can expect for wicked problems.

The AFPS method can be learned quickly – and experience shows that just one demonstration is usually enough to convince the participants when a team is hopelessly entangled in a wicked-looking problem!

The Surprising Science of Motivation

Intended improvement requires focussed change which requires systemic design which requires collaborative action which requires motivation. So where does the motivation come from? Money? or Meaning?  This animated talk by Dan Pink from RSA is so much more effective than a feeble blog!

Design work is the antithesis of the repetitive, mechanical, uninspiring, mundane, day-to-day work that we do for money. Design work is always unique, always challenging, and always fun – and hard – and many people do it in their own time for nothing. The whole Open Source Software movement is testament to that.

But why should the designers have all the fun? The question misses the point – we are all designers and we can can all become better designers. We can mix up the designing and the delivering. And when we do that it gets even better because we get the fun of the design bit and the reward of the delivery bit too.

So how can we justify staying as we are when we can see how much fun is feasible?

Productivity Improvement Science

Very often there is a requirement to improve the productivity of a process and operational managers are usually measured and rewarded for how well they do that. Their primary focus is neither safety nor quality – it is productivity – because that is their job.

For-profit organisations see improved productivity as a path to increased profit. Not-for-profit organisations see improved productivity as a path to being able to grow through re-investment of savings.  The goal may be different but the path is the same – productivity improvement.

First we need to define what we mean by productivity: it is the ratio of a system output to a system input. There are many input and output metrics to choose from and a convenient one to use is the ratio of revenue to expenses for a defined period of time.  Any change that increases this ratio represents an improvement in productivity on this purely financial dimension and we know that this financial data is measured. We just need to look at the bank statement.

There are two ways to approach productivity improvement: by considering the forces that help productivity and the forces that hinder it. This force-field metaphor was described by the psychologist Kurt Lewin (1890-1947) and has been developed and applied extensively and successfully in many organisations and many scenarios in the context of change management.

Improvement results from either strengthening helpers or weakening hinderers or both – and experience shows that it is often quicker and easier to focus attention on the hinderers because that leads to both more improvement and to less stress in the system. Usually it is just a matter of alignment. Two strong forces in opposition results in high stress and low motion; but in alignment creates low stress and high acceleration.

So what hinders productivity?

Well, anything that reduces or delays workflow will reduce or delay revenue and therefore hinder productivity. Anything that increases resource requirement will increase cost and therefore hinder productivity. So looking for something that causes both and either removing or realigning it will have a Win-Win impact on productivity!

A common factor that reduces and delays workflow is the design of the process – in particular a design that has a lot of sequential steps performed by different people in different departments. The handoffs between the steps are a rich source of time-traps and bottlenecks and these both delay and limit the flow.  A common factor that increases resource requirement is making mistakes because errors generate extra work – to detect and to correct.  And there is a link between fragmentation and errors: in a multi-step process there are more opportunities for errors – particularly at the handoffs between steps.

So the most useful way to improve the productivity of a process is to simplify it by combining several, small, separate steps into single large ones.

A good example of this can be found in healthcare – and specifically in the outpatient department.

Traditionally visits to outpatients are defined as “new” – which implies the first visit for a particular problem – and “review” which implies the second and subsequent visits.  The first phase is the diagnostic work and this often requires special tests or investigations to be performed (such as blood tests, imaging, etc) which are usually done by different departments using specialised equipment and skills. The design of departmental work schedules requires a patient to visit on a separate occasion to a different department for each test. Each of these separate visits incurs a delay and a risk of a number of errors – the commonest of which is a failure to attend for the test on the appointed day and time. Such did-not-attend or DNA rates are surprisingly high – and values of 10% are typical in the NHS.

The cumulative productivity hindering effect of this multi-visit diagnostic process design is large.  Suppose there are three steps: New-Test-Review and each step has a 10% DNA rate and a 4 week wait. The quickest that a patient could complete the process is 12 weeks and the chance of getting through right first time (the yield) is about 90% x 90% x 90% = 73% which implies that 27% extra resource is needed to correct the failures.  Most attempts to improve productivity focus on forcing down the DNA rate – usually with limited success. A more effective approach is to redesign process by combining the three New-Test-Review steps into one visit.  Exactly the same resources are needed to do the work as before but now the minimum time would be 4 weeks, the right-first-time yield would increase to 90% and the extra resources required to manage the two handoffs, the two queues, and the two sources of DNAs would be unnecessary.  The result is a significant improvement in productivity at no cost.  It is also an improvement in the quality of the patient experience but that is a unintended bonus.

So if the solution is that obvious and that beneficial then why are we not doing this everywhere? The answer is that we do in some areas – in particular where quality and urgency is important such as fast-track one-stop clinics for suspected cancer. However – we are not doing it as widely as we could and one reason for that is a hidden hinderer: the way that the productivity is estimated in the business case and measured in the the day-to-day business.

Typically process productivity is estimated using the calculated unit price of the product or service. The unit price is arrived at by adding up the unit costs of the steps and adding an allocation of the overhead costs (how overhead is allocated is subject to a lot of heated debate by accountants!). The unit price is then multiplied by expected activity to get expected revenue and divided by the total cost (or budget) to get the productivity measure.  This approach is widely taught and used and is certainly better than guessing but it has a number of drawbacks. Firstly, it does not take into account the effects of the handoffs and the queues between the steps and secondly it drives step-optimisation behaviour. A departmental operational manager who is responsible and accountable for one step in the process will focus their attention on driving down costs and pushing up utilisation of their step because that is what they are performance managed on. This in itself is not wrong – but it can become counter-productive when it is done in isolation and independently of the other steps in the process.  Unfortunately our traditional management accounting methods do not prevent this unintentional productivity hindering behaviour – and very often they actually promote it – literally!

This insight is not new – it has been recognised by some for a long time – so we might ask ourselves why this is still the case? This is a very good question that opens another “can of worms” which for the sake of brevity will be deferred to a later conversation.

So, when applying Improvement Science in the domain of financial productivity improvement then the design of both the process and of the productivity modelling-and-monitoring method may need addressing at the same time.  Unfortunately this does not seem to be common knowledge and this insight may explain why productivity improvements do not happen more often – especially in publically funded not-for-profit service organisations such as the NHS.

All Aboard for the Ride of Our Lives!

In 1825 the world changed when the Age of Rail was born with the opening of the Darlington-to-Stockton line and the demonstration that a self-powered mobile steam engine could pull more trucks of coal than a team of horses.

This launched the industrial revolution into a new phase by improving the capability to transport heavy loads over long distances more conveniently, reliably, quickly, and cheaply than could canals or roads.

Within 25 years the country was criss-crossed by thousands of miles of railway track and thousands more miles were rapidly spreading across the world. We take it for granted now but this almost overnight success was the result of over 100 years of painful innovation and improvement. Iron rail tracks had been in use for a long time – particularly in quarries and ports. Newcomen’s atmospheric steam engine had been pumping water out of mines since 1712; James Watt and Matthew Boulton had patented their improved separate condenser static steam engine in 1775; and Richard Trevethick had built a self-propelled high pressure steam engine called “Puffing Devil” in 1801. So why did it take so long for the idea to take off? The answer was quite simple – it needed the lure of big profits to attract the entrepreneurs who had the necessary influence and cash to make it happen at scale and pace.  The replacement of windmills and watermills by static steam engines had already allowed factories to be built anywhere – rather than limiting them to the tops of windy hills and the sides of fast flowing rivers. But it was not until the industrial revolution had achieved sufficient momentum that road and canal transport became a serious constraint to further growth of industry, wealth and the British Empire.

But not everyone was happy with the impact that mechanisation brought – the Luddites were the skilled craftsmen who opposed the use of mechanised looms that could be operated by lower-skilled and therefore cheaper labour.  They were crushed in 1812 by political forces more powerful than they were – and the term “luddite” is now used for anyone who blindly opposes change from a position self-protection.

Only 140 years later it was all over for the birthplace of the Rail Age – the steam locomotive was relegated to the museums when Dr Richard Beeching , the efficiency-focussed Technical Director of ICI, published his reports that led to the cost-improvement-programme (CIP) that reorganised the railways and led to the loss of 70,000 jobs, hundreds of small “unprofitable” stations and 1000’s of miles of track.  And the reason for the collapse of the railways was that roads had leap-frogged both canals and railways because the “internal combustion engine” proved a smaller, lighter, more powerful, cheaper and more flexible alternative to steam or horses.

It is of historical interest that Henry Ford developed the production line to mass produce automobiles at a price that a factory worker could afford – and Toyoda invented a self-stopping mechanised loom that improved productivity dramatically by preventing damaged cloth being produced if a thread broke by accident. The historical links come together because Toyoda sold the patents to his self-stopping loom to fund the creation of the Toyota Motor Company which used Henry Ford’s production-line design and integrated the Toyoda self-monitoring, stopping and continuous improvement philosophy.

It was not until twenty years after British Rail was created that Japan emerged as an industrial superpower by demonstrating that it had learned how to improve both quality and reduce cost much more effectively than the “complacent” Europe and America. The tables were turned and this time it was the West that had to learn – and quickly.  Unfortunately not quickly enough. Other developing countries seized the opportunity that mass mechanisation, customisation and a large, low-expectation, low-cost workforce offered. They now produce manufactured goods at prices that European and American companies cannot compete with. Made in Britain has become Made in China.

The lesson of history has been repeated many times – innovations are like seeds that germinate but do not disseminate until the context is just right – then they grow, flower, seed and spread – and are themselves eventually relegated to museums by the innovations that they spawned.

Improvement Science has been in existence for a long time in various forms, and it is now finding more favourable soil to grow as traditional reactive and incremental improvement methods run out of steam when confronted with complex system problems. Wicked problems such as a world population that is growing larger and older at the same time as our reserves of non-renewable natural resources are dwindling.

The promise that Improvement Science offers is the ability to avoid the boom-to-bust economic roller-coaster that devastates communities twice – on the rise and again on the fall. Improvement Science offers an approach that allows sensible and sustainable changes to be planned, implemented and then progressively improved.

So what do we want to do? Watch from the sidelines and hope, or leap aboard and help?

And remember what happened to the Luddites!

The Nerve Curve

The Nerve Curve is the emotional roller-coaster ride that everyone who engages in Improvement needs to become confident to step onto.

Just like a theme park ride it has ups and downs, twists and turns, surprises and challenges, an element of danger and a splash of excitement.  If it did not have all of those components then it would not be fun and there would not be queues of people wanting to ride, again and again.  And the reason that theme parks are so successful is because their rides have been very carefully designed – to be challenging, exciting, fun and safe – all at the same time.

So, when we challenge others to step aboard our Improvement Nerve Curve then we need to ensure that our ride is safe – and to do that we need to understand where the emotional dangers lurk, to actively point them out and then avoid them.

A big danger hides right at the start.  To get aboard the Nerve Curve we have to ask questions that expose the Elephant-in-the-Room issues.  Everyone knows they are there – but no one wants to talk about them.   The biggest one is called Distrust – which is wrapped up in all sorts of different ways and inside the nut is the  Kernel of Cynicism.  The inexperienced improvement facilitator may blunder straight into this trap just by using one small word … the word “Why”?  Arrrrrgh!  Kaboom!  Splat!  Game Over.

The “Why” question is like throwing a match into a barrel of emotional gunpowder – because it is interpreted as “What is your purpose?” and in a low-trust climate no one will want to reveal what their real purpose or intention is.  They have learned from experience to keep their cards close to their chest – it is safer to keep agendas hidden.

A much safer question is “What?”  What are the facts?  What are the effects? What are the causes? What works well? What does not? What do we want? What don’t we want? What are the constraints? What are our change options? What would each deliver? What are everyone’s views?  What is our decision?  What is our first action? What is the deadline?

Sticking to the “What” question helps to avoid everyone diving for the Political Panic Button and pulling the Emotional Emergency Brake before we have even got started.

The first part of the ride is the “Awful Reality Slope” that swoops us down into “Painful Awareness Canyon” which is the emotional low-point of the ride.  This is where the elephants-in-the-room roam for all to see and where passengers realise that, once the issues are in plain view, there is no way back.

The next danger is at the far end of the Canyon and is called the Black Chasm of Ignorance and the roller-coaster track goes right to the edge of it.  Arrrgh – we are going over the edge of the cliff – quick grab the Wilful Blindness Goggles and Denial Bag from under the seat, apply the Blunder Onwards Blind Fold and the Hope-for-the-Best Smoke Hood.

So, before our carriage reaches the Black Chasm we need to switch on the headlights to reveal the Bridge of How:  The structure and sequence that spans the chasm and that is copiously illuminated with stories from those who have gone before.  The first part is steep though and the climb is hard work.  Our carriage clanks and groans and it seems to take forever but at the top we are rewarded by a New Perspective and the exhilarating ride down into the Plateau of Understanding where we stop to reflect and to celebrate our success.

Here we disembark and discover the Forest of Opportunity which conceals many more Nerve Curves going off in all directions – rides that we can board when we feel ready for a new challenge.  There is danger lurking here too though – hidden in the Forest is Complacency Swamp – which looks innocent except that the Bridge of How is hidden from view.   Here we can get lured by the pungent perfume of Power and the addictive aroma of Arrogance and we can become too comfortable in the Zone.   As we snooze in the Hammock of Calm from we do not notice that the world around us is changing.  In reality we are slipping backwards into Blissful Ignorance and we do not notice – until we suddenly find ourselves in an unfamiliar Canyon of Painful Awareness.  Ouch!

Being forewarned is our best defense.  So, while we are encouraged to explore the Forest of Opportunity,  we learn that we must also return regularly to the Plateau of Understanding to don the Habit of Humility.  We must  regularly refresh ourselves from the Fountain of New Knowledge by showing others what we have learned and learning from them in return.  And when we start to crave more excitement we can board another Nerve Curve to a new Plateau of Understanding.

The Safety Harness of our Improvement journey is called See-Do-Teach and the most important part is Teach.  Our educators need to have more than just a knowledge of how-to-do, they also need to have enough understanding to be able to explore the why-to -do. The Quest for Purpose.

To convince others to get onboard the Nerve Curve we must be able to explain why the Issues still exist and why the current methods are not sufficient.  Those who have been on the ride are the only ones who are credible because they understand.  They have learned by doing.

And that understanding grows with practice and it grows more quickly when we take on the challenge of learning how to explore purpose and explain why.  This is Nerve Curve II.

All aboard for the greatest ride of all.

Building a Big Picture from the Small Bits

We are all a small piece of a complex system that extends well beyond the boundaries of our individual experience.

We all know this.

We also know that seeing the big picture is very helpful because it gives us context, meaning and leads to better decisions more effective actions.

We feel better when we know where we fit into the Big Picture – and we feel miserable when we do not.

And when our system is not working as well as we would like then we need to improve it; and to do that we need to understand how it works so that we only change what we need to.

To do that we need to see the Big Picture and to understand it.


So how do we build the Big Picture from the Small Bits?

Solving a jigsaw puzzle is a good metaphor for the collective challenge we face. Each of us holds a piece which we know very well because it is what we see, hear, touch, smell and taste every day. But how do we assemble the pieces so that we can all clearly see and appreciate the whole rather than dimly perceive a dysfunctional heap of bits?

One strategy is to look for tell-tale features that indicate where a piece might fit – irrespective of the unique picture on it. Such as the four corners.

We also use this method to group pieces that belong on the sides – but this is not enough  to tell us which side and where on which side each piece fits.

So far all we have are some groups of bits – rough parts of the whole – but no clear view of the picture. To see that we need to look at the detail – the uniqueness of each piece.


Our next strategy is to look at the shapes of the edges to find the pieces that are complementary – that leave no gaps when fitted together. These are our potential neighbours. Sometimes there is only one bit that fits, sometimes there are many that fit well enough.


Our third strategy is to look at the patterns on the potential neighbours and to check for continuity because the picture should flow across the boundary – and a mismatch means we have made an error.

 What we have now is the edges of the picture and a heap of bits that go somewhere in the middle.

By connecting the edge-pieces we can see that there are gaps and this is an important insight.

It is not until we have a framework that spans the whole picture that the gaps become obvious.

But we do not know yet if our missing pieces are in the heap or not – we will not know that until we have solved the jigsaw puzzle.


Throughout the problem-dissolving process we are using three levels of content:
Data that we gain through our senses, in this case our visual system;
Information which is the result of using context to classify the data – shape and colour for example; and
Knowlege which we derive from past experience to help us make decisions – “That is a top-left corner so it goes there; that is an edge so it goes in that group; that edge matches that one so they might be neighbours and I will try fitting them together; the picture does not flow so they cannot be neighbours and I must separate them”.

The important point is that we do not need to Understand the picture to do this – we can just use “dumb” pattern-matching techniques, simple logic and brute force to decide which bits go together and which do not. A computer could do it – and we or the computer can solve the puzzle and still not recognise what we are looking at, understand what it means, or be able to make a wise decision.


To do that we need to search for meaning – and that usually means looking for and recognising symbols that are labels for concepts and using the picture to reveal how they relate to each other.

As we fit the neighbours together we see words and phrases that we may recognise – “Legend” and “cycle” for example (click the picture to enlarge)  – and we can use these labels to start to build a conceptual framework, and from that we create an expectation. Just as we did with the corners and edges.

The word “cycle” implies a circle, which is often drawn as a curved line, so we can use this expectation to look for pieces of a circle and lay them out – just as we did with the edges.

We may not recognise all the symbols – “citric acid” for example – and that finding means that there is new knowledge hidden in the picture. By the end we may understand what those new symbols mean from the context that the Big Picture creates.

By searching for meaning we are doing more than mechanically completing a task – we are learning, expanding our knowledge and deepening our understanding.

But to do this we need to separate the heap of bits so they do not obscure each other and so we can see each clearly. When it is a mess the new learning and deeper understanding will elude us.

We have now found some pieces with lines on that look like parts of a circle, so we can arrange them into an approximate sequence – and when we do that we are delighted to find that the pieces fit together, the pictures flow from one to the other, and there is a sense of order and structure starting to emerge from within the picture itself.
Until now the only structure we saw was the artificial and meaningless boundary.  We now see a new and unfamiliar phrase “citric acid cycle” – what is that? Our curiosity is building.

As we progress we find repeated symbols that we now recognise but do not understand – red and gray circles linked together. In the top right under the word “Legend” we see the same symbols together with some we do recognise – “hydrogen, carbon and oxygen”.

Ah ha! Now we can translate the unfamiliar symbols into familiar concepts, and now we suspect that this is something to do with chemistry. But what?

We are nearly there.  Almost all the pieces are in place and we have identified where the last few fit.

Now we can see that all the pieces are from the same jigsaw, there are none missing and there are no damaged, distorted, or duplicated pieces. The Big Picture looks complete.

We can see that the lines between the pieces are not part of the picture – they are artificial boundaries created when the picture was broken into parts – and useful only for helping us to re-assemble the big picture.

Now they are getting in the way – they are distracting us from seeing the picture as clearly as we could – so we can dispense with them – they have served their purpose.

We can also see that the pieces appear to be arranged in columns and rows – and we could view our picture as a set of interlocked vertical stripes or as a set of interlocked horizontal strips – but that this is an artificial structure created by our artificial boundaries. The picture we are seeing transcends our artificial linear decomposition.

We erase all the artificial boundaries and the full picture emerges.

Now we can see that we have a chemical system where a series of reactions are linked in a cycle – and we can see something called pyruvate coming in top left and we recognise the symbols water and CO2 and we conclude that this might be part of the complex biochemical system that is called cellular respiration – the process by which the food that we eat and the oxygen we breathe is converted into energy and the CO2 that we breathe out.

Wow!

And we can see that this is just part of a bigger map – the edges were also artificial and arbitrary! But where does the oxygen fit? And which bit is the energy? And what is the link between the carbohydrate that we eat and this new thing called pyruvate?

Our bigger picture and deeper understanding has generated a lot of new questions, there is so much more to explore, to learn and to understand!!


Let us stop and reflect. What have we learned?

We have learned that our piece was not just one of a random heap of unconnected jigsaw bits; we have learned where our piece fits into a Bigger Picture; we have learned how our piece is an essential part of that picture; we have learned that there is a design in the picture and we have learned how we are part of that design.

And when we all know and we all understand the whole design and how it works then we all have a much better chance of being able to improve it in a rational, sensible, explainable and actionable way.

Building the System Picture from the disorganised heap of Step Parts is one of the key skills of an Improvement Science Practitioner.

And the more practice we get, the quicker we recognise what we are looking at – because there are a relatively few effective system designs.

This is insight is important because most of the unsolved problems are system problems – and the sooner we can diagnose the system design flaws that are the root causes of the system problems, then the sooner we can propose, test and implement solutions and experience the expected improvements.

That is a Win-Win-Win strategy.

That is systems engineering in a nutshell.

Targets, Tyrannies and Traps.

If we are required to place a sensitive part of our anatomy into a device that is designed to apply significant and sustained pressure, then the person controlling the handle would have our complete attention!

Our sole objective would be to avoid the crushing and relentless pain and this would most definitely bias our behaviour.

We might say or do things that ordinarily we would not – just to escape from the pain.

The requirement to meet well-intentioned but poorly-designed performance targets can create the organisational equivalent of a medieval thumbscrew; and the distorting effect on behaviour is the same.  Some people even seem to derive pleasure from turning the screw!

But what if we do not know how to achieve the performance target? We might then act to deflect the pain onto others – we might become tyrants too – and we might start to apply our own thumbscrews further along the chain of command.  Those unfortunate enough to be at the end of the pecking order have nowhere to hide – and that is a deeply distressing place to be – helpless and hopeless.

Fortunately there is a way out of the corporate torture chamber: It is to learn how to design systems to deliver the required performance specification – and learning how to do this is much easier than many believe.

For example, most assume without question that big queues and long waits are always caused by inefficient use of available capacity – because that is what their monitoring systems report. So out come thumbscrews heralded by the chanted mantra “increase utilisation, increase utilisation”.  Unfortunately, this belief is only partially correct: low utilisation of available capacity can and does lead to big queues and long waits but there is a much more prevalent and insidious cause of long waits that has nothing to do with capacity or utilisation. These little beasties are are called time-traps.

The essential feature of a time trap is that it is independent of both flow and time – it adds the same amount of delay irrespective of whether the flow is low or high and irrespective of when the work arrives. In contrast waits caused by insufficient capacity are flow and time dependent – the higher the flow the longer the wait – and the effect is cumulative over time.

Many confuse the time-trap with its close relative the batch – but they are not the same thing at all – and most confuse both of these with capacity-constraints which are a completely different delay generating beast altogether.

The distinction is critical because the treatments for time-traps, batches and capacity-constraints are different – and if we get the diagnosis wrong then we will make the wrong decision, choose the wrong action, and our system will get sicker, or at least no better. The corporate pain will continue and possibly get worse – leading to even more bad behaviour and more desperate a self-destructive strategies.

So when we want to reduce lead times by reducing waiting-in-queues then the first thing we need to do is to search for the time-traps, and to do that we need to be able to recognise their characteristic footprint on our time-series charts; the vital signs of our system.

We need to learn how to create and interpret the charts – and to do that quickly we need guidance from someone who can explain what to look for and how to interpret the picture.

If we lack insight and humility and choose not to learn then we are choosing to stay in the target-tyranny-trap and our pain will continue.

Seeing Is Believing or Is It?

Do we believe what we see or do we see what we believe?  It sounds like a chicken-and-egg question – so what is the answer? One, the other or both?

Before we explore further we need to be clear about what we mean by the concept “see”.  I objectively see with my real eyes but I subjectively see with my mind’s eye. So to use the word see for both is likely to result in confusion and conflict and to side-step this we will use the word perceive for seeing-with-our-minds-eye.   

When we are sure of our belief then we perceive what we believe. This may sound incorrect but psychologists know better – they have studied sensation and perception in great depth and they have proved that we are all susceptible to “perceptual bias”. What we believe we will see distorts what we actually perceive – and we do it unconsciously. Our expectation acts like a bit of ancient stained glass that obscures and distorts some things and paints in a false picture of the rest.  And that is just during the perception process: when we recall what we perceived we can add a whole extra layer of distortion and can can actually modify our original memory! If we do that often enough we can become 100% sure we saw something that never actually happened. This is why eye-witness accounts are notoriously inaccurate! 

But we do not do this all of the time.  Sometimes we are open-minded, we have no expectation of what we will see or we actually expect to be surprised by what we will see. We like the feeling of anticipation and excitement – of not knowing what will happen next.   That is the psychological basis of entertainment, of exploration, of discovery, of learning, and of improvement science.

An experienced improvement facilitator knows this – and knows how to create a context where deeply held beliefs can be explored with sensitivity and respect; how to celebrate what works and how and why it does; how to challenge what does not; and how to create novel experiences; foster creativity and release new ideas that enhance what is already known, understood and believed.

Through this exploration process our perception broadens, sharpens and becomes more attuned with reality. We achieve both greater clarity and deeper understanding – and it is these that enable us to make wiser decisions and commit to more effective action.

Sometimes we have an opportunity to see for real what we would like to believe is possible – and that can be the pivotal event that releases our passion and generates our commitment to act. It is called the Black Swan effect because seeing just one black swan dispels our belief that all swans are white.

A practical manifestation of this principle is in the rational design of effective team communication – and one of the most effective I have seen is the Communication Cell – a standardised layout of visual information that is easy-to-see and that creates an undistorted perception of reality.  I first saw it many years ago as a trainee pilot when we used it as the focus for briefings and debriefings; I saw it again a few years ago at Unipart where it is used for daily communication; and I have seen it again this week in the NHS where it is being used as part of a service improvement programme.

So if you do not believe then come and see for yourself.
Never Events and Nailing Niggles

Some events should NEVER happen – such as removing the wrong kidney; or injecting an anti-cancer drug designed for a vein into the spine; or sailing a cruise ship over a charted underwater reef; or driving a bus full of sleeping school children into a concrete wall.

But  these catastrophic irreversible and tragic Never Events do keep happening – rarely perhaps – but persistently. At the Never-Event investigation the Finger-of-Blame goes looking for the incompetent culprit while the innocent victims call for compensation.

And after the smoke has cleared and the pain of loss has dimmed another Never-Again-Event happens – and then another, and then another. Rarely perhaps – but not never.

Never Events are so awful and emotionally charged that we remember them and we come to believe that they are not rare and from that misperception we develop a constant nagging feeling of fear for the future. It is our fear that erodes our trust which leads to the paralysis that prevents us from acting.  In the globally tragic event of 9/11 several thousand innocents victims died while the world watched in horror.  More innocent victims than that die needlessly every day in high-tech hospitals from avoidable errors – but that statistic is never shared.

The metaphor that is often used is the Swiss Cheese – the sort on cartoons with lots of holes in it. The cheese represents a quality check – a barrier that catches and corrects mistakes before they cause irreversible damage. But the cheesy check-list is not perfect; it has holes in it.  Mistakes slip through.

So multiple layers of cheesy checks are added in the hope that the holes in the earlier slices will be covered by the cheese in the later ones – and our experience shows that this multi-check design does reduce the number of mistakes that get through. But not completely. And when, by rare chance, holes in each slice line up then the error penetrates all the way through and a Never Event becomes a Actual Catastrophe.  So, the typical recommendation from the after-the-never-event investigation is to add another layer of cheese to the stack – another check on the list on top of all the others.

But the cheese is not durable: it deteriorates over time with the incessant barrage of work and the pressure of increasing demand. The holes get bigger, the cheese gets thinner, and new holes appear. The inevitable outcome is the opening up of unpredictable, new paths through the cheese to a Never Event; more Never Events; more after-the-never-event investigation; and more slices of increasingly expensive and complex cheese added to the tottering, rotting heap.

A drawback of the Swiss Cheese metaphor is that it gives the impression that the slices are static and each cheesy check has a consistent position and persistent set of flaws in it. In reality this is not the case – the system behaves as if the slices and the holes are moving about: variation is jiggling , jostling and wobbling the whole cheesy edifice.

This wobble does not increase the risk of a Never Event  but it prevents the subsequent after-the-event investigation from discovering the specific conjunction of holes that caused it. The Finger of Blame cannot find a culprit and the cause is labelled a “system failure” or an unlucky individual is implicated and named-shamed-blamed and sacrificed to the Gods of Chance on the Alter of Hope! More often new slices of KneeJerk Cheese are added in the desperate hope of improvement – and creating an even greater burden of back-covering bureaucracy than before – and paradoxically increasing the number of holes!

Improvement Science offers a more rational, logical, effective and efficient approach to dissolving this messy, inefficient and ineffective safety design.

First it recognises that to prevent a Never Event then no errors should reach the last layer of cheese checking – the last opportunity to block the error trajectory. An error that penetrates that far is a Near Miss and these will happen more often than Never Events so they are the key to understanding and dissolving the problem.

Every Near Miss that is detected should be reported and investigated immediately – because that is the best time to identify the hole in the previous slice – before it wobbles out of sight. The goal of the investigation is understanding not accountability. Failure to report a near miss; failure to investigate it; failure to learn from it; failure to act on it; and failure to monitor the effect of the action are all errors of omission (EOOs) and they are the worst of management crimes.

The question to ask is “What error happened immediately before the Near Miss?”  This event is called a Not Again. Focussing attention on this Not Again and understanding what, where, when, who and how it happened is the path to preventing the Near Miss and the Never Event.  Why is not the question to ask – especially when trust is low and cynicism and fear are high – the question to ask is “how”.

The first action after Naming the Not Again is to design a counter-measure for it – to plug the hole – NOT to add another slice of Check-and Correct cheese! The second necessary action is to treat that Not Again as a Near-Miss and to monitor it so when it happens again the cause can be identified. These common, every day, repeating causes of Not Agains are called Niggles; the hundreds of minor irritations that we just accept as inevitable. This is where the real work happens – identifying the most common Niggle and focussing all attention on nailing it! Forever.  Niggle naming and nailing is everyone’s responsibility – it is part of business-as-usual – and if leaders do not demonstrate the behaviour and set the expectation then followers will not do it.

So what effect would we expect?

To answer that question we need a better metaphor than our static stack of Swiss cheese slices: we need something more dynamic – something like a motorway!

Suppose you were to set out walking across a busy motorway with your eyes shut and your fingers in your ears – hoping to get to the other side without being run over. What is the chance that you will make it across safely?  It depends on how busy the traffic is and how fast you walk – but say you have a 50:50 chance of getting across one lane safely (which is the same chance as tossing a fair coin and getting a head) – what is the chance that you will get across all six lanes safely? The answer is the same chance as tossing six heads in a row: a 1-in-2 chance of surviving the first lane (50%), a 1 in 4 chance of getting across two lanes (25%), a 1 in 8 chance of making it across three (12.5%) …. to a 1 in 64 chance of getting across all six (1.6%). Said another way that is a 63 out of 64 chance of being run over somewhere which is a 98.4% chance of failure – near certain death! Hardly a Never Event.

What happens to our risk of being run over if the traffic in just one lane is stopped and that lane is now 100% safe to cross? Well you might think that it depends on which lane it is but it doesn’t – the risk of failure is now 31/32 or 96.8% irrespective of which lane it is – so not much improvement apparently!  We have doubled the chance of success though!

Is there a better improvement strategy?

What if we work collectively to just reduce the flow of Niggles in all the lanes at the same time – and suppose we are all able to reduce the risk of a Niggle in our lane-of-influence from 1-in-2 to 1-in-6. How we do it is up to us. To illustrate the benefit we replace our coin with a six-sided die (no pun intended) and we only “die” if we throw a 1.  What happens to our pedestrian’s probability of survival? The chance of surviving the first lane is now 5/6 (83.3%), and both first and second 5/6 x 5/6 = 25/36 (69%.4) and so on to all six lanes which is 5/6 x 5/6 x 5/6 x 5/6 x 5/6 x 5/6 = 15625/46656 = 33.3% which is a lot better than our previous 1.6%!  And what if we keep plugging the holes in our bits of the cheese and we increase our individual lane success rate to 95% – our pedestrians probability of survival is now 73.5%. The chance of a catastrophic event becomes less and less.

The arithmetic may be a bit scary but the message is clear: to prevent the Never Events we must reduce the Near Misses and to to do that we investigate every Near Miss and expose the Not Agains and then use them to Name and Nail all the Niggles.  And we have complete control over the causes of our commonest Niggles because we create them.

This strategy will improve the safety of our system. It has another positive benefit – it will free up our Near Miss investigation team to do something else: it frees them to assist in the re-design the system so that Not Agains cannot happen at all – they become Never Events too – and the earlier in the path that safety-design happens the better – because it renders the other layers of check-and-correct cheesocracy irrelevant.

Just imagine what would happen in a real system if we did that …

And now try to justify not doing it …

And now consider what an individual, team and organisation would need to learn to do this …

It is called Improvement Science.

And learning the Foundations of Improvement Science in Healthcare (FISH) is one place to start.

fish

The Journal of Improvement Science

Improvement Science encompasses research, improvement and audit and includes both subjective and objective dimensions.  An essential part of collective improvement is sharing our questions and learning with others.

From the perspective of the learner it is necessary to be able to trust that what is shared is valid and from the perspective of the questioner it is necessary to be able to challenge with respect.

Sharing new knowledge is not the only purpose of publication: for academic organisations it is also a measure of performance so there is a academic peer pressure to publish both quantity and quality – an academic’s career progression depends on it.

This pressure has created a whole industry of its own – the academic journal – and to ensure quality is maintained it has created the scholastic peer review process.  The  intention is to filter submitted papers and to only publish those that are deemed worthy – those that are believed by the experts to be of most value and of highest quality.

There are several criteria that editors instruct their volunteer “independent reviewers” to apply such as originality, relevance, study design, data presentation and balanced discussion.  This process was designed over a hundred years ago and it has stood the test of time – but – it was designed specifically for research and before the invention of the Internet, of social media and the emergence of Improvement Science.

So fast-forward to the present and to a world where improvement is now seen to  be complementary to research and audit; where time-series statistics is viewed as a valid and complementary data analysis method; and where we are all able to globally share information with each other and learn from each other in seconds through the medium of modern electronic communication.

Given these changes is the traditional academic peer review journal system still fit for purpose?

One way to approach this question is from the perspective of the customers of the system – the people who read the published papers and the people who write them.  What niggles do they have that might point to opportunities for improvement?

Well, as a reader:

My first niggle is to have to pay a large fee to download an electronic copy of a published paper before I can read it. All I can see is the abstract which does not tell me what I really want to know – I want to see the details of the method and the data not just the authors edited highlights and conclusions.

My second niggle is the long lead time between the work being done and the paper being published – often measured in years!  This implies that the published news is old news  useful for reference maybe but useless for stimulating conversation and innovation.

My third niggle is what is not published.  The well-designed and well-conducted studies that have negative outcomes; lessons that offer as much opportunity for learning as the positive ones.  This is not all – many studies are never done or never published because the outcome might be perceived to adversely affect a commercial or “political” interest.

My fourth niggle is the almost complete insistence on the use of empirical data and comparative statistics – data from simulation studies being treated as “low-grade” and the use of time-series statistics as “invalid”.  Sometimes simulations and uncontrolled experiments are the only feasible way to answer real-world questions and there is more to improvement than a RCT (randomised controlled trial).

From the perspective of an author of papers I have some additional niggles – the secrecy that surrounds the review process (you are not allowed to know who has reviewed the paper); the lack of constructive feedback that could help an inexperienced author to improve their studies and submissions; and the insistence on assignment of copyright to the publisher – as an author you have to give up ownership of your creative output.

That all said there are many more nuggets to the peer review process than niggles and to a very large extent what is published can be trusted – which cannot be said for the more popular media of news, newspapers, blogs, tweets, and the continuous cacophony of partially informed prejudice, opinion and gossip that goes for “information”.

So, how do we keep the peer-reviewed baby and lose the publication-process bath water? How do we keep the nuggets and dump the niggles?

What about a Journal of Improvement Science along the lines of:

1. Fully electronic, online and free to download – no printed material.
2. Community of sponsors – who publically volunteer to support and assist authors.
3. Continuously updated ranking system – where readers vote for the most useful papers.
4. Authors can revise previously published papers – using feedback from peers and readers.
5. Authors retain the copyright – they can copy and distribute their own papers as much as they like.
6. Expected use of both time-series and comparative statistics where appropriate.
7. Short publication lead times – typically days.
8. All outcomes are publishable – warts and all.
9. Published authors are eligible to be sponsors for future submissions.
10. No commercial sponsorship or advertising.

STOP PRESS: JOIS is now launched: Click here to enter.