See-Do-Teach

Improvement implies change, and change implies learningl; so we need to understand how learning works to facilitate change and improvement.

When we learn, we acquire new knowledge, understanding and wisdom. Our ability increases.

Before we can do that we must see the gap between where we are and where we want to be, so that we can focus our attention on filling the gap with the required knowledge, understanding and wisdom. Our awareness must increase before our ability can.

We can sketch a diagram to illustrate the interaction between awareness and ability. The path of learning is shown by the green arrow which starts at the bottom left corner where we are unaware of our inability. Our goal is to master the new knowledge, understanding and wisdom to the point where it becomes second nature. When we can do it without thinking about it.

The first challenge is to see the gap, and to overcome that challenge we need to nurture three traits – willingness, humility and curiosity. We must be willing enough to test our knowledge; we must be humble enough to accept the feedback; and we must be curious enough to ask questions that challenge our assumptions.

Becoming aware of the gap creates an uncomfortable feeling because our awareness increases faster than our ability. But with respect for the ability of others, and with perseverance, discipline and practice we can gradually climb the ability slope to the point where we know how. From that position we can teach how. And over time time our new ability becomes intituive and we become less aware of how we are doing it. That is called “mastery”.

As our ability increases and our awareness decreases (the right hand side of the diagram) we feel a growing sense of confidence and excited anticipation for future learning, change and improvement.


For example, in health care systems it is common to experience what is described as “chronic chaos”. A typical example is a multidisciplinary outpatient clinic that requires the services of a range of specialists to provide specific elements of a patient’s care. The usual experience is a queue of patients waiting (often for hours) and busy staff running around trying to ensure that patients get what they need before the clinic finishes!

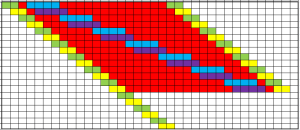
The know-how to diagnose and treat the causes of chronic chaos is available, but it is not intuitively obvious (because if it were, we would not have the problematic situation). It starts by making the complex flows within the clinic visible in a way that enables a diagnosis to be established and a plan to be formulated. That visual technique is called a diagnostic Gantt chart and it is over 100 years since it was invented by Henry L Gantt.

One of the most rewarding experiences in health care improvement is to see the surprise and delight on the faces of the staff when they see the behaviour of their clinic as a picture on the wall, and then clearly see a path ahead to a calmer and more productive service.

This is not achieved by someone doing it for them. It is achieved by someone with know-how gently raising a bit of awareness then supporting the clinic team to develop their own ability. This is called the study-plan-do cycle of learning which is the engine of the see-do-teach framework.

Seeing-by-Doing

OneStopBeforeGantt

Flow improvement-by-design requires being able to see the flows.

We can see movement very easily, but seeing flows is not so easy – particularly when they are mixed-up and unsteady.

One of the most useful tools for visualising flow was invented over 100 years ago by Henry Laurence Gantt (1861-1919).

Henry Gantt was a mechanical engineer from Johns Hopkins University and an early associate of Frederick Taylor. Gantt parted ways with Taylor because he disagreed with the philosophy of Taylorism which was that workers should be instructed what to do by managers (i.e. parent-child transactions according to Eric Berne, inventor of Transactional Analysis).  Gantt saw that workers and managers could work together for mutual benefit of themselves and their companies (i.e. adult-adult transactions).  At one point Gantt was invited to streamline the production of US munitions for the First World War and his methods were so effective that the Ordinance Department was the most productive department of the armed forces.  Gantt favoured democracy over autocracy and is quoted to have said “Our most serious trouble is incompetence in high places. The manager who has not earned his position and who is immune from responsibility will fail time and again, at the cost of the business and the workman“.

Henry Gantt invented a number of different charts – not just the one used in project management which was actually invented 20 years earlier by Karol Adamieki and re-invented by Gantt. It become popularised when it was used in the Hoover Dam project management; but that was after Gantt’s death in 1919.

The form of Gantt chart above is called a process template chart and it is designed to show the flow of tasks through  a process. Each horizontal line is a task; each vertical column is an interval of time. The colour code in each cell indicates what the task is doing and which resource the task is using during that time interval. Red indicates that the task is waiting. White means that the task is outside the scope of the chart (e.g. not yet arrived or already departed).

The Gantt chart shows two “red wedges”.  A red wedge that is getting wider from top to bottom is the pattern created by a flow constraint.  A red wedge that is getting narrower from top to bottom is the pattern of a policy constraint.  Both are signs of poor scheduling design.

A Gantt chart like this has three primary uses:
1) Diagnosis – understanding how the current flow design is creating the queues and delays.
2) Agnosis – inventing new design options by suspending judgement and lateral thinking.
3) Prognosis – selecting and testing the innovative designs so the ‘fittest for purpose’ can be chosen for implementation.

These three steps are encapsulated in the third “M” of 6M Design® – the Model step.

In this example the design flaw was the scheduling policy.  When that was redesigned the outcome was zero-wait performance. No red on the chart at all.  The same number of tasks were completed in the same with the same resources used. Just less waiting. Which means less space is needed to store the queue of waiting work (i.e. none in this case).

That this is even possible comes as a big surprise to many people. It feels counter-intuitive. It is however a fact that is easy to demonstrate with a simple table-top game. The lesson we learn from this? Our intuition can trick us.

And the predicted and observed reduction in the size of the queue implies a big cost reduction when the work-in-progress is perishable and needs constant attention [such as patients lying on A&E trolleys and in hospital beds].

So what was the recipe for re-designing this schedule?

A dash of willingness, a splash of humility, a twist of curiosity – plus a few bits of squared paper, some coloured pens, a couple hours, and the assistance of someone who knows how to do it and teach it . The one off cost is peanuts in comparison with the recurring benefit.


Anyone Heard of Henry Gantt?

Most managers have heard of Gantt charts and associate them with project management where they are widely used to help coordinate the separate threads of work so that the project finishes on time.

How many know about the man who invented them and why?

Henry Laurence Gantt (1861-1919) was an engineer and he invented the chart for a very different purpose – so that the workers and the managers could see at a glance the progress of the work and to see what was impairing the flow.  Decades before the invention of the computer, Henry Gantt created a simple and incredibly powerful visual tool for enabling workers and managers to improve processes together.

I know how simple and powerful the original Gantt chart is because I use it all the time for capturing the behaviour of a process in a visual form that stimulates constructive conversations which result in win-win-win improvements.  All you need is some squared paper, a pencil, a clock, a Mark I Eyeball or two, and a bit of practice.