Standard Ambiguity

One that causes much confusion and debate in the world of Improvement is the word standard – because it has so many different yet inter-related meanings.

It is an ambiguous word and a multi-facetted concept.

For example, standard method can be the normal way of doing something (as in a standard operating procedure  or SOP); standard can be the expected outcome of doing something; standard can mean the minimum acceptable quality of the output (as in a safety standard); standard can mean an aspirational performance target; standard can mean an absolute reference or yardstick (as in the standard kilogram); standard can mean average; and so on.  It is an ambiguous word.

So, it is no surprise that we get confused. And when we feel confused we get scared and we try to relieve our fear by asking questions; which doesn’t help because we don’t get clear answers.  We start to discuss, and debate and argue and all this takes effort, time and inevitably money.  And the fog of confusion does not lift.  If anything it gets denser.  And the reason? Standard Ambiguity.


One contributory factor is the perennial confusion between purpose and process.  Purpose is the Why.  Process is the How.  The concept of Standard applied to the Purpose will include the outcomes: the minimum acceptable (safety standard), the expected (the specification standard) and the actual (the de facto standard).  The concept of Standard applied to the Process would include the standard operating procedures and the reference standards for accurate process measurement (e.g. a gold standard).


To illustrate the problems that result from confusing purpose standards with process standards we need look no further than education.

Q: What is the purpose of a school? Why does a school exist:

A:To deliver people who have achieved their highest educational potential perhaps.

Q: What is the purpose of an exam board? Why does an exam board exist?

A: To deliver a common educational reference standard and to have a reliable method for comparing individual pupils against that reference standard perhaps.

So, where does the idea of “Being the school that achieved the highest percentage of top grades?” fit with these two purpose standards?  Where does the school league table concept fit?  It is not obvious to see immediately.  But, you might say, we do want to improve the educational capability of our population because that is a national and global asset in an increasingly complex, rapidly changing, high technology world.  Surely a league table will drive up the quality of education? But it doesn’t seem to be turning out that way. What is getting in the way?


What might be getting in the way is how we often conflate collaboration with competition.

It seems that many believe we can only have either collaboration or competition.  Either-Or thinking is a trap for the unwary and whenever these words are uttered a small alarm bell should ring.  Are collaboration and competition mutually exclusive? Or are we just making this assumption to simplify the problem? PS. We do that a lot.


Suppose the exam boards were both competing and collaborating with each other. Suppose they collaborated to set and to maintain a stable and trusted reference standard; and suppose that they competed to provide the highest quality service to the schools – in terms of setting and marking exams. What would happen?

Firstly, an exam board that stepped out of line in terms of these standards would lose its authority to set and mark exams – it would cut its own commercial throat.  Secondly, the quality of the examination process would go up because those who invest in doing that will attract more of the market share.

What about the schools – what if they both collaborated and competed too?  What if they collaborated to set and maintain a stable and trusted reference standard of conduct and competency of their teachers – and what if they competed to improve the quality of their educational process. The best schools  would attract the most pupils.

What can happen if we combine competition and collaboration is that the sum becomes greater than the parts.


A similar situation exists in healthcare.  Some hospitals are talking about competing to be the safest hospitals and collaborating to improve quality.  It sounds plausible but it is rational?

Safety is an absolute standard – it is the common minimum acceptable quality.  No hospital should fail on safety so this is not a suitable subject for competition.  All hospitals could collaborate to set and to maintain safety – helping each other by sharing data, information, knowledge, understanding and wisdom.  And with that Foundation of Trust they can then compete on quality – using their natural competitive spirit to pull them ever higher. Better quality of service, better quality of delivery and better quality of performance – including financial. Win-win-win.  And when the quality of everything improves through collaborative and competitive upwards pull, then the achievable level of minimum acceptable quality increases.  This means that the Safety Standard can improve too.  Everyone wins.


Little and Often

There seem to be two extremes to building the momentum for improvement – One Big Whack or Many Small Nudges.


The One Big Whack can come at the start and is a shock tactic designed to generate an emotional flip – a Road to Damascus moment – one that people remember very clearly. This is the stuff that newspapers fall over themselves to find – the Big Front Page Story – because it is emotive so it sells newspapers.  The One Big Whack can also come later – as an act of desperation by those in power who originally broadcast The Big Idea and who are disappointed and frustrated by lack of measurable improvement as the time ticks by and the money is consumed.

Many Small Nudges do not generate a big emotional impact; they are unthreatening; they go almost unnoticed; they do not sell newspapers, and they accumulate over time.  The surprise comes when those in power are delighted to discover that significant improvement has been achieved at almost no cost and with no cajoling.

So how is the Many Small Nudge method implemented?

The essential element is The Purpose – and this must not be confused with A Process.  The Purpose is what is intended; A Process is how it is achieved.  And answering the “What is my/our purpose?” question is surprisingly difficult to do.

For example I often ask doctors “What is our purpose?”  The first reaction is usually “What a dumb question – it is obvious”.  “OK – so if it is obvious can you describe it?”  The reply is usually “Well, err, um, I suppose, um – ah yes – our purpose is to heal the sick!”  “OK – so if that is our purpose how well are we doing?”  Embarrassed silence. We do not know because we do not all measure our outcomes as a matter of course. We measure activity and utilisation – which are measures of our process not of our purpose – and we justify not measuring outcome by being too busy – measuring activity and utilisation.

Sometimes I ask the purpose question a different way. There is a Latin phrase that is often used in medicine: primum non nocere which means “First do no harm”.  So I ask – “Is that our purpose?”.  The reply is usually something like “No but safety is more important than efficiency!”  “OK – safety and efficiency are both important but are they our purpose?”.  It is not an easy question to answer.

A Process can be designed – because it has to obey the Laws of Physics. The Purpose relates to People not to Physics – so we cannot design The Purpose, we can only design a process to achieve The Purpose. We can define The Purpose though – and in so doing we achieve clarity of purpose.  For a healthcare organisation a possible Clear Statement of Purpose might be “WE want a system that protects, improves and restores health“.

Purpose statements state what we want to have. They do not state what we want to do, to not do or to not have.  This may seem like a splitting hairs but it is important because the Statement of Purpose is key to the Many Small Nudges approach.

Whenever we have a decision to make we can ask “How will this decision contribute to The Purpose?”.  If an option would move us in the direction of The Purpose then it gets a higher ranking to a choice that would steer us away from The Purpose.  There is only one On Purpose direction and many Off Purpose ones – and this insight explains why avoiding what we do not want (i.e. harm) is not the same as achieving what we do want.  We can avoid doing harm and yet not achieve health and be very busy all at the same time.


Leaders often assume that it is their job to define The Purpose for their Organisation – to create the Vision Statement, or the Mission Statement. Experience suggests that clarifying the existing but unspoken purpose is all that is needed – just by asking one little question – “What is our purpose?” – and asking it often and of everyone – and not being satisfied with a “process” answer.

Productivity Improvement Science

Very often there is a requirement to improve the productivity of a process and operational managers are usually measured and rewarded for how well they do that. Their primary focus is neither safety nor quality – it is productivity – because that is their job.

For-profit organisations see improved productivity as a path to increased profit. Not-for-profit organisations see improved productivity as a path to being able to grow through re-investment of savings.  The goal may be different but the path is the same – productivity improvement.

First we need to define what we mean by productivity: it is the ratio of a system output to a system input. There are many input and output metrics to choose from and a convenient one to use is the ratio of revenue to expenses for a defined period of time.  Any change that increases this ratio represents an improvement in productivity on this purely financial dimension and we know that this financial data is measured. We just need to look at the bank statement.

There are two ways to approach productivity improvement: by considering the forces that help productivity and the forces that hinder it. This force-field metaphor was described by the psychologist Kurt Lewin (1890-1947) and has been developed and applied extensively and successfully in many organisations and many scenarios in the context of change management.

Improvement results from either strengthening helpers or weakening hinderers or both – and experience shows that it is often quicker and easier to focus attention on the hinderers because that leads to both more improvement and to less stress in the system. Usually it is just a matter of alignment. Two strong forces in opposition results in high stress and low motion; but in alignment creates low stress and high acceleration.

So what hinders productivity?

Well, anything that reduces or delays workflow will reduce or delay revenue and therefore hinder productivity. Anything that increases resource requirement will increase cost and therefore hinder productivity. So looking for something that causes both and either removing or realigning it will have a Win-Win impact on productivity!

A common factor that reduces and delays workflow is the design of the process – in particular a design that has a lot of sequential steps performed by different people in different departments. The handoffs between the steps are a rich source of time-traps and bottlenecks and these both delay and limit the flow.  A common factor that increases resource requirement is making mistakes because errors generate extra work – to detect and to correct.  And there is a link between fragmentation and errors: in a multi-step process there are more opportunities for errors – particularly at the handoffs between steps.

So the most useful way to improve the productivity of a process is to simplify it by combining several, small, separate steps into single large ones.

A good example of this can be found in healthcare – and specifically in the outpatient department.

Traditionally visits to outpatients are defined as “new” – which implies the first visit for a particular problem – and “review” which implies the second and subsequent visits.  The first phase is the diagnostic work and this often requires special tests or investigations to be performed (such as blood tests, imaging, etc) which are usually done by different departments using specialised equipment and skills. The design of departmental work schedules requires a patient to visit on a separate occasion to a different department for each test. Each of these separate visits incurs a delay and a risk of a number of errors – the commonest of which is a failure to attend for the test on the appointed day and time. Such did-not-attend or DNA rates are surprisingly high – and values of 10% are typical in the NHS.

The cumulative productivity hindering effect of this multi-visit diagnostic process design is large.  Suppose there are three steps: New-Test-Review and each step has a 10% DNA rate and a 4 week wait. The quickest that a patient could complete the process is 12 weeks and the chance of getting through right first time (the yield) is about 90% x 90% x 90% = 73% which implies that 27% extra resource is needed to correct the failures.  Most attempts to improve productivity focus on forcing down the DNA rate – usually with limited success. A more effective approach is to redesign process by combining the three New-Test-Review steps into one visit.  Exactly the same resources are needed to do the work as before but now the minimum time would be 4 weeks, the right-first-time yield would increase to 90% and the extra resources required to manage the two handoffs, the two queues, and the two sources of DNAs would be unnecessary.  The result is a significant improvement in productivity at no cost.  It is also an improvement in the quality of the patient experience but that is a unintended bonus.

So if the solution is that obvious and that beneficial then why are we not doing this everywhere? The answer is that we do in some areas – in particular where quality and urgency is important such as fast-track one-stop clinics for suspected cancer. However – we are not doing it as widely as we could and one reason for that is a hidden hinderer: the way that the productivity is estimated in the business case and measured in the the day-to-day business.

Typically process productivity is estimated using the calculated unit price of the product or service. The unit price is arrived at by adding up the unit costs of the steps and adding an allocation of the overhead costs (how overhead is allocated is subject to a lot of heated debate by accountants!). The unit price is then multiplied by expected activity to get expected revenue and divided by the total cost (or budget) to get the productivity measure.  This approach is widely taught and used and is certainly better than guessing but it has a number of drawbacks. Firstly, it does not take into account the effects of the handoffs and the queues between the steps and secondly it drives step-optimisation behaviour. A departmental operational manager who is responsible and accountable for one step in the process will focus their attention on driving down costs and pushing up utilisation of their step because that is what they are performance managed on. This in itself is not wrong – but it can become counter-productive when it is done in isolation and independently of the other steps in the process.  Unfortunately our traditional management accounting methods do not prevent this unintentional productivity hindering behaviour – and very often they actually promote it – literally!

This insight is not new – it has been recognised by some for a long time – so we might ask ourselves why this is still the case? This is a very good question that opens another “can of worms” which for the sake of brevity will be deferred to a later conversation.

So, when applying Improvement Science in the domain of financial productivity improvement then the design of both the process and of the productivity modelling-and-monitoring method may need addressing at the same time.  Unfortunately this does not seem to be common knowledge and this insight may explain why productivity improvements do not happen more often – especially in publically funded not-for-profit service organisations such as the NHS.

Cause and Effect

Breaking News: Scientists have discovered that people with yellow teeth are more likely to die of lung cancer. Patient-groups and dentists are now calling for tooth-whitening to be made freely available to everyone.”

Does anything about this statement strike you as illogical? Surely it is obvious. Having yellow teeth does not cause lung cancer – smoking causes both yellow teeth and lung cancer!  Providing a tax-funded tooth-whitening service will be futile – banning smoking is the way to reduce deaths from lung cancer!

What is wrong here? Do we have a problem with mad scientists, misuse of statistics or manipulative journalists? Or all three?

Unfortunately, while we may believe that smoking causes both yellow teeth and lung cancer it is surprisingly difficult to prove it – even when sane scientists use the correct statistics and their results are accurately reported by trustworthy journalists.  It is not easy to prove causality.  So we just assume it.

We all do this many times every day – we infer causality from our experience of interacting with the real world – and it is our innate ability to do that which allows us to say that the opening statement does not feel right.  And we do this effortlessly and unconsciously.

We then use our inferred-causality for three purposes. Firstly, we use it to explain how past actions led to the present situation. The chain of cause-and-effect. Secondly, we use it to create options in the present – our choices of actions. Thirdly, we use it to predict the outcome of our chosen action – we set our expectation and then compare the outcome with our prediction. If outcome is better than we expected then we feel good, if it is worse then we feel bad.

What we are doing naturally and effortlessly is called “causal modelling”. And it is an impressive skill. It is the skill needed to solve problems by designing ways around them.

Unfortunately – the ability to build and use a causal model does not guarantee that our model is a valid, complete or accurate representation of reality. Our model may be imperfect and we may not be aware of it.  This raises two questions: “How could two people end up with different causal models when they are experiencing the same reality?” and “How do we prove if either is correct and if so, which it is?”

The issue here is that no two people can perceive reality exactly the same way – we each have an unique perspective – and it is an inevitable source of variation.

We also tend to assume that what-we-perceive-is-the-truth so if someone expresses a different view of reality then we habitually jump to the conclusion that they are “wrong” and we are “right”.  This unconscious assumption of our own rightness extends to our causal models as well. If someone else believes a different explanation of how we got to where we are, what our choices are and what effect we might expect from a particular action then there is almost endless opportunity for disagreement!

Fortunately our different perceptions agree enough to create common ground which allows us to co-exist reasonably amicably.  But, then we take the common ground for granted, it slips from our awareness, and we then magnify the molehills of disagreement into mountains of discontent.  It is the way our caveman wetware works. It is part of the human condition.

So, if our goal is improvement, then we need to consider a more effective approach: which is to assume that all our causal models are approximate and that they are all works-in-progress. This implies that each of us has two challenges: first to develop a valid causal model by testing it against reality through experimentation; and second to assist the collective development of a common causal model by sharing our individual understanding through explanation and demonstration.

The problem we then encounter is that statistical analysis of historical data cannot answer questions of causality – it is necessary but it is not sufficient – and because it is insufficient it does not make common-sense.  For example, there may well be a statistically significant association between “yellow teeth” and “lung cancer” and “premature death” but knowing those facts is not enough to help us create a valid cause-and-effect model that we then use to make wiser choices of more effective actions that cause us to live longer.

Learning how to make wiser choices that lead to better outcomes is what Improvement Science is all about – and we need more than statistics – we need to learn how to collectively create, test and employ causal models.

And that has another name – is called common sense.

The Journal of Improvement Science

Improvement Science encompasses research, improvement and audit and includes both subjective and objective dimensions.  An essential part of collective improvement is sharing our questions and learning with others.

From the perspective of the learner it is necessary to be able to trust that what is shared is valid and from the perspective of the questioner it is necessary to be able to challenge with respect.

Sharing new knowledge is not the only purpose of publication: for academic organisations it is also a measure of performance so there is a academic peer pressure to publish both quantity and quality – an academic’s career progression depends on it.

This pressure has created a whole industry of its own – the academic journal – and to ensure quality is maintained it has created the scholastic peer review process.  The  intention is to filter submitted papers and to only publish those that are deemed worthy – those that are believed by the experts to be of most value and of highest quality.

There are several criteria that editors instruct their volunteer “independent reviewers” to apply such as originality, relevance, study design, data presentation and balanced discussion.  This process was designed over a hundred years ago and it has stood the test of time – but – it was designed specifically for research and before the invention of the Internet, of social media and the emergence of Improvement Science.

So fast-forward to the present and to a world where improvement is now seen to  be complementary to research and audit; where time-series statistics is viewed as a valid and complementary data analysis method; and where we are all able to globally share information with each other and learn from each other in seconds through the medium of modern electronic communication.

Given these changes is the traditional academic peer review journal system still fit for purpose?

One way to approach this question is from the perspective of the customers of the system – the people who read the published papers and the people who write them.  What niggles do they have that might point to opportunities for improvement?

Well, as a reader:

My first niggle is to have to pay a large fee to download an electronic copy of a published paper before I can read it. All I can see is the abstract which does not tell me what I really want to know – I want to see the details of the method and the data not just the authors edited highlights and conclusions.

My second niggle is the long lead time between the work being done and the paper being published – often measured in years!  This implies that the published news is old news  useful for reference maybe but useless for stimulating conversation and innovation.

My third niggle is what is not published.  The well-designed and well-conducted studies that have negative outcomes; lessons that offer as much opportunity for learning as the positive ones.  This is not all – many studies are never done or never published because the outcome might be perceived to adversely affect a commercial or “political” interest.

My fourth niggle is the almost complete insistence on the use of empirical data and comparative statistics – data from simulation studies being treated as “low-grade” and the use of time-series statistics as “invalid”.  Sometimes simulations and uncontrolled experiments are the only feasible way to answer real-world questions and there is more to improvement than a RCT (randomised controlled trial).

From the perspective of an author of papers I have some additional niggles – the secrecy that surrounds the review process (you are not allowed to know who has reviewed the paper); the lack of constructive feedback that could help an inexperienced author to improve their studies and submissions; and the insistence on assignment of copyright to the publisher – as an author you have to give up ownership of your creative output.

That all said there are many more nuggets to the peer review process than niggles and to a very large extent what is published can be trusted – which cannot be said for the more popular media of news, newspapers, blogs, tweets, and the continuous cacophony of partially informed prejudice, opinion and gossip that goes for “information”.

So, how do we keep the peer-reviewed baby and lose the publication-process bath water? How do we keep the nuggets and dump the niggles?

What about a Journal of Improvement Science along the lines of:

1. Fully electronic, online and free to download – no printed material.
2. Community of sponsors – who publically volunteer to support and assist authors.
3. Continuously updated ranking system – where readers vote for the most useful papers.
4. Authors can revise previously published papers – using feedback from peers and readers.
5. Authors retain the copyright – they can copy and distribute their own papers as much as they like.
6. Expected use of both time-series and comparative statistics where appropriate.
7. Short publication lead times – typically days.
8. All outcomes are publishable – warts and all.
9. Published authors are eligible to be sponsors for future submissions.
10. No commercial sponsorship or advertising.

STOP PRESS: JOIS is now launched: Click here to enter.

Resetting Our Systems

 Our bodies are amazing self-monitoring and self-maintaining systems – and we take them completely for granted!

The fact that it is all automatic is good news for us because it frees us up to concentrate on other things – BUT – it has a sinister side too.  Our automatic monitor-and-maintain design does not imply what is maintained is healthy – the system is just designed to keep itself stable.

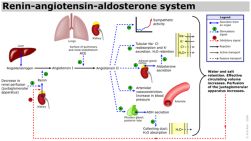
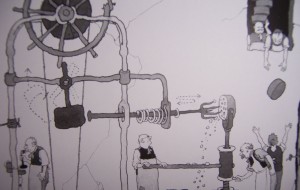
Take our blood pressure as an example. We all have two monitor-and-maintain systems that work together – one that stablises short-term changes in blood pressure (such as when you recline, stand, run, fight, and flee) and the other that stablises long-term changes. The image above is a very simplified version of the long-term regulation system!

Around one quarter of all adults are classified as having high blood pressure – which means that it is consistently higher than is healthy – and billions of £ are spent every year on drugs to reduce blood pressure in millions of people.  Why is this an issue? How does it happen? What lessons are there for the student of Improvement Science?

High blood pressure (or hypertension) is dangerous – and the higher it is the more dangerous it is. It is called the silent killer and the reason is that it is called silent is because there are no symptoms. The reason it called a killer is because over time it causes irreversible damage to vital organs – the heart, kidneys and arteries in the brain.

The vast majority of hypertensives have what is called essential hypertension – which means that there is no obvious single cause.  It is believed that this is the result of their system gradually becoming reset so that it actively maintains the high blood pressure.  This is just like gradually increasing the setting on the thermostat in our house – say by just 0.01 degree per week – not much and not even measurable – but over time the cumulative effect would have a big impact on our heating bills!

So, what resets our long-term blood pressure regulation system? It is believed that the main culprit is stress because when we feel stressed our bodies react in the short-term by pushing our blood pressure up – it is called the fright-fight-flight response. If the stress is repeated time and time again our pressure-o-stat becomes gradually reset and the high blood pressure is then maintained, even when we do not feel stressed. And we do not notice – until something catastrophic happens! And that is too late.

The same effect happens in organisations except that the pressure is emotional and is created by the stress of continually fighting to meet performance targets. The result is a gradual resetting of our expectations and behaviours and the organisation develops emotional hypertension which leads to irreversible damage to the organisations culture. This emotional creep goes largely unnoticed until a catastrophic event happens – and if severe enough the organisation will be crippled and may not survive. The Mid Staffs Hospital patient safety catastrophe is a real and recent example of cultural creep in a healthcare organisation driven by incessant target-driven behaviour. It is a stark lesson to us all. 

So what is the solution?

The first step is to realise that we cannot just rely on hope, ignore the risk and wait for the early warning  symptoms – by that time the damage may be irreversible; or the catastrophe may get us without warning. We have to actively look for the signs of the creeping cultural change – and we have to do that over a long period of time because it is gradual. So, if we have just be jolted out of denial by a too-close-for-comfort expereince then we need to adopt a different strategy and use an external absolute reference – an emotionally and culturally healthy organisation.

The second step is to adopt a method that will tell us reliably if there is a significant shift in our emotional pressure and a method that is sensitive eneough to alert  us before it goes outside a safe range – because we want to intervene as early as possible and only when necessary. Masterly inactivity and cat-like observation according to one wise medical mentor.  

The third step is to actively remove as many of the stressors as possible – and for an organisation this means replacing DRATs (Delusional Ratios and Arbitrary Targets) with well-designed specification limits; and replacing reactive fire-fighting with proactive feedback. This is the role of the leaders.

The fourth step is to actively reduce the emotional pressure but to do it gradually because the whole system needs to adjust. Dropping the emotional pressure too quickly is as dangerous as discounting its importance.

The key to all of this is the appropriate use of data and time-series analysis because the smaller long-term shifts are hidden in the large short-term variation. This is where many get stuck because they are not aware that there two different sorts of statistics. The  correct sort for monitoring systems is called time-series statistics and it not the same as the statistics that we learn at school and university. That is called comparative statistics. This is a shame really because time-series statistics is much more applicable to every day life problems such as managing our blood pressure, our weight, our finances, and the cultural health of our organisations.

Fortunately time-series statistics is easier to learn and use than school statistics so to get started on resetting your personal and organisational emot-o-stat please help yourself to the complimentary guide by clicking here.

Homeostasis

Improvement Science is not just about removing the barriers that block improvement and building barriers to prevent deterioration – it is also about maintaining acceptable, stable and predictable performance.

In fact most of the time this is what we need our systems to do so that we can focus our attention on the areas for improvement rather than running around keeping all the plates spinning.  Improving the ability of a system to maintain itself is a worthwhile and necessary objective.

Long term stability cannot be achieved by assuming a stable context and creating a rigid solution because the World is always changing. Long term stability is achieved by creating resilient solutions that can adjust their behaviour, within limits, to their ever-changing context.

This self-adjusting behaviour of a system is called homeostasis.

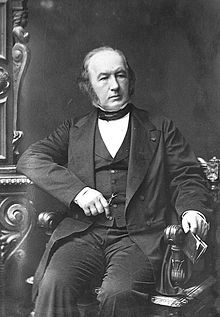
The foundation for the concept of homeostasis was first proposed by Claude Bernard (1813-1878) who unlike most of his contemporaries, believed that all living creatures were bound by the same physical laws as inanimate matter.  In his words: “La fixité du milieu intérieur est la condition d’une vie libre et indépendante” (“The constancy of the internal environment is the condition for a free and independent life”).

The term homeostasis is attributed to Walter Bradford Cannon (1871 – 1945) who was a professor of physiology at Harvard medical school and who popularized his theories in a book called The Wisdom of the Body (1932). Cannon described four principles of homeostasis:

  1. Constancy in an open system requires mechanisms that act to maintain this constancy.
  2. Steady-state conditions require that any tendency toward change automatically meets with factors that resist change.
  3. The regulating system that determines the homeostatic state consists of a number of cooperating mechanisms acting simultaneously or successively.
  4. Homeostasis does not occur by chance, but is the result of organised self-government.

Homeostasis is therefore an emergent behaviour of a system and is the result of organised, cooperating, automatic mechanisms. We know this by another name – feedback control – which is passing data from one part of a system to guide the actions of another part. Any system that does not have homeostatic feedback loops as part of its design will be inherently unstable – especially in a changing environment.  And unstable means untrustworthy.

Take driving for example. Our vehicle and its trusting passengers want to get to their desired destination on time and in one piece. To achieve this we will need to keep our vehicle within the boundaries of the road – the white lines – in order to avoid “disappointment”.

As their trusted driver our feedback loop consists of a view of the road ahead via the front windscreen; our vision connected through a working nervous system to the muscles in ours arms and legs; to the steering wheel, accelerator and brakes; then to the engine, transmission, wheels and tyres and finally to the road underneath the wheels. It is quite a complicated multi-step feedback system – but an effective one. The road can change direction and unpredictable things can happen and we can adapt, adjust and remain in control.  An inferior feedback design would be to use only the rear-view mirror and to steer by looking at the whites lines emerging from behind us. This design is just as complicated but it is much less effective and much less safe because it is entirely reactive.  We get no early warning of what we are approaching.  So, any system that uses the output performance as the feedback loop to the input decision step is like driving with just a rear view mirror.  Complex, expensive, unstable, ineffective and unsafe.     

As the number of steps in a process increases the more important the design of  the feedback stabilisation becomes – as does the number of ways we can get it wrong:  Wrong feedback signal, or from the wrong place, or to the wrong place, or at the wrong time, or with the wrong interpretation – any of which result in the wrong decision, the wrong action and the wrong outcome. Getting it right means getting all of it right all of the time – not just some of it right some of the time. We can’t leave it to chance – we have to design it to work.

Let us consider a real example. The NHS 18-week performance requirement.

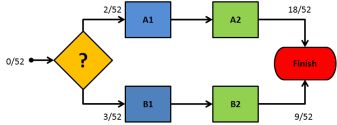
The stream map shows a simple system with two parallel streams: A and B that each has two steps 1 and 2. A typical example would be generic referral of patients for investigations and treatment to one of a number of consultants who offer that service. The two streams do the same thing so the first step of the system is to decide which way to direct new tasks – to Step A1 or to Step B1. The whole system is required to deliver completed tasks in less than 18 weeks (18/52) – irrespective of which stream we direct work into.   What feedback data do we use to decide where to direct the next referral?

The do nothing option is to just allocate work without using any feedback. We might do that randomly, alternately or by some other means that are independent of the system.  This is called a push design and is equivalent to driving with your eyes shut but relying on hope and luck for a favourable outcome. We will know when we have got it wrong – but it is too late then – we have crashed the system! 

A more plausible option is to use the waiting time for the first step as the feedback signal – streaming work to the first step with the shortest waiting time. This makes sense because the time waiting for the first step is part of the lead time for the whole stream so minimising this first wait feels reasonable – and it is – BUT only in one situation: when the first steps are the constraint steps in both streams [the constraint step is one one that defines the maximum stream flow].  If this condition is not met then we heading for trouble and the map above illustrates why. In this case Stream A is just failing the 18-week performance target but because the waiting time for Step A1 is the shorter we would continue to load more work onto the failing  stream – and literally push it over the edge. In contrast Stream B is not failing and because the waiting time for Step B1 is the longer it is not being overloaded – it may even be underloaded.  So this “plausible” feedback design can actually make the system less stable. Oops!

In our transport metaphor – this is like driving too fast at night or in fog – only being able to see what is immediately ahead – and then braking and swerving to get around corners when they “suddenly” appear and running off the road unintentionally! Dangerous and expensive.

With this new insight we might now reasonably suggest using the actual output performance to decide which way to direct new work – but this is back to driving by watching the rear-view mirror!  So what is the answer?

The solution is to design the system to use the most appropriate feedback signal to guide the streaming decision. That feedback signal needs to be forward looking, responsive and to lead to stable and equitable performance of the whole system – and it may orginate from inside the system. The diagram above holds the hint: the predicted waiting time for the second step would be a better choice.  Please note that I said the predicted waiting time – which is estimated when the task leaves Step 1 and joins the back of the queue between Step 1 and Step 2. It is not the actual time the most recent task came off the queue: that is rear-view mirror gazing again.

When driving we look as far ahead as we can, for what we are heading towards, and we combine that feedback with our present speed to predict how much time we have before we need to slow down, when to turn, in which direction, by how much, and for how long. With effective feedback we can behave proactively, avoid surprises, and eliminate sudden braking and swerving! Our passengers will have a more comfortable ride and are more likely to survive the journey! And the better we can do all that the faster we can travel in both comfort and safety – even on an unfamiliar road.  It may be less exciting but excitement is not our objective. On time delivery is our goal.

Excitement comes from anticipating improvement – maintaining what we have already improved is rewarding.  We need both to sustain us and to free us to focus on the improvement work! 


FISH

Several years ago I read an inspirational book called Fish! which recounts the tale of a manager who is given the task of “sorting out” the worst department in her organisation – a department that everyone hated to deal with and that everyone hated to work in. The nickname was The Toxic Energy Dump.

The story retells how, by chance, she stumbled across help in the unlikeliest of places – the Pike Place fish market in Seattle.  There she learned four principles that transformed her department and her worklife:

1. Work Made Fun Gets Done
2. Make Someone’s Day
3. Be Fully Present
4. Choose Your Attitude

 The take home lesson from Fish! is that we make our work miserable by the way we behave towards each other.   So if we are unhappy at work and we do nothing about our behaviour then our misery will continue.

This means we can choose to make work enjoyable – and it is the responsibility of leaders at all levels to create the context for this to happen.  Miserable staff = poor leadership.  And leadership starts with the leader.  

  • Effective leadership is inspiring others to achieve through example.
  • Leadership does not work without trust. 
  • Play is more than an activity – it is creative energy – and requires a culture of trust not a culture of fear. 
  • To make someone’s day all you need to so is show them how much you appreciate them. 
  • The attitude and behaviour of a leader has a powerful effect on those that they lead.
  • Effective leaders know what they stand for and ask others to hold them to account.

FISH has another meaning – it stands for Foundations of Improvement Science for Health – and it is the core set of skills needed to create a SELF – a Safe Environment for Learning and Fun.  The necessary context for culture change. It is more than that though – FISH also includes the skills to design more productive processes – releasing valuable lifetime and energy to invest in creative fun.  

Fish are immersed in their environment – and so are people. We learn by immersion in reality. Rhetoric – be it thinking, talking or writing – is a much less effective teacher.

So all we have to do is co-create a context for improvement and then immerse ourselves in it. The improvement that results is an inevitable consequence of th design. We design our system for improvement and it improves itself.

To learn more about Foundations of Improvement Science for Health (FISH)  click: here 

Single Sell System

In the pursuit of improvement it must be remembered that the system must remain viable: better but dead is not the intended outcome.  Viability of socioeconomic systems implies that money is flowing to where it is needed, when it is needed and in the amounts that are needed.

Money is like energy – it only does worthwhile work when it is moving: so the design of more effective money-streams is a critical part of socioeconomic system improvement.

But this is not easy or obvious because the devil is in the detail and complexity grows quicklyand obscures the picture. This lack of clear picture creates the temptation to clean, analyse, simplify and conceptualise and very often leads to analysis-paralysis and then over-simplification.

There is a useful metaphor for this challenge.

Biological systems use energy rather than money and the process of improvement has a different name – it is called evolution. Each of us is an evolution experiment. The viability requirement is the same though – the success of the experiment is measured by our viability. Do our genes and memes survive after we have gone?

It is only in recent times that the mechanism of this biological system has become better understood. It was not until the 19th Century that we realised that complex organisms were made of reproducing cells; and later that there were rules that governed how inherited characteristics passed from generation to generation; and that the vehicle of transmission was a chemical code molecule called DNA that is present in every copy of every cell capable of reproduction.

We learned that our chemical blueprint is stored in the nucleus of every cell (the dark spots in the picture of cells) and this led to the concept that the nucleus worked like a “brain” that issues chemical orders to the cell in the form of a very similar molecule called RNA.  This cellular command-and-control model is unfortunately more a projection of the rhetoric of society than the reality of the situation. The nucleus is not a “brain” – it is a gonad. The “brain” of a cell is the surface membrane – the sensitive interface between outside and inside; where the “sensor” molecules in the outer cell membrane connect to “effector” molecules on the inside.  Cells think with their skin – and their behaviour is guided by their  internal content and external context. Nature and nurture working as a system.

Cells have evolved to collaborate. Rogue cells that become “mentally” unstable and that break away, start to divide, and spread in an uncollaborative and selfish fashion threaten the viability of the whole: they are called malignant. The threat of malignant behaviour to long term viability is so great that we have evolved sophisticated mechanisms to detect and correct malignant behaviour. The fact that cancer is still a problem is because our malignancy defense mechanisms are not 100% effective. 

This realisation of the importance of the cell has led to a focus of medical research on understand how individual cells “sense”, “think”, “act” and “communicate” and has led to great leaps in our understanding of how multi-celled systems called animals and plants work; how they can go awry; and what can be done to prevent and correct these cellular niggles.  We are even learning how to “fix” bits of the the chemical blueprint to correct our chemical software glitches. We are no where near being able to design a cell from scratch though. We simply do not understand enough about how it works.

In comparison, the “single-sell” in an economic system could be considered to be a step in a process – the point where the stream and the silo meet – where expenses are converted to revenue for example.  I will wantonly bend the rules of grammar and use the word “sell” to distinguish it visually from “cell”. So before trying to understand the complex emergent behaviour of a multi-selled economic system we first need to understand better one sell works. How does work flow and time flow and money flow combined at the single sell?

When we do so we learn that the “economic mechanism” of a single sell can be described completely because it is a manfestation of the Laws of Physics – just as the mechanism of the weather can be describe using a small number of equations that combine to describe the flow, pressure, density, temperature etc of the atmospheric gases.  Our simplest single-selled economic system is described by a set of equations – there are about twenty of them in fact.

So, trying to work out in our heads how even a single sell in an economic system will behave amounts to mentally managing twenty simultanous equations – which is a bit of a problem because we’re not very good at that mental maths trick. The best we can do is to learn the patterns in the interdependent behaviour of the outputs of the equations; to recognise what they imply; and then how to use that understanding to craft wiser decisions.

No wonder the design of a viable socioeconomic multi-selled system seems to be eluding even the brightest economic minds at the moment!  It is a complicated system which exhibits complex behaviour.  Is there a better approach?  Our vastly more complex biological counterparts called “organisms” seem to have discovered one. So what can we learn from them?

One lesson might be that is is a good design to detect and correct malignant behaviour early; the unilateral, selfish, uncollaborative behaviour that multiplies, spreads, and becomes painful, incurable then lethal.

First we need to raise awareness and recognition of it … only then can we challenge and contain its toxic legacy.   

The Three Faces of Improvement Science

There is always more than one way to look at something and each perspective is complementary to the others.

Improvement Science has three faces: the first is the Process Face; the second is the People face and the third is the System face – and is represented in the logo with a different colour for each face.

The process face is the easiest to start with because it is logical, objective and absolute.  It describes the process; the what, where, when and how. It is the combination of the hardware and the software; the structure and the function – and it is constrained by the Laws of Physics.

The people face is emotional, subjective and relative.  It describes the people and their perceptions and their purposes. Each person interacts both with the process and with each other and their individual beliefs and behaviours drive the web of relationships. This is the world of psychology and politics.

The system face is neither logical nor emotional – it has characteristics that are easy to describe but difficult to define. Characteritics such a self-organisation; emergent behaviour; and complexity.  Our brains do not appear to be able to comprehend systems as easily and intuitively and we might like to believe. This is one reason why systems often feel counter-intuitive, unpredictable and mysterious. We discover that we are unable to make intuitive decisions that result in whole system improvement  because our intuition tricks us.

Gaining confidence and capability in the practical application of Improvement Science requires starting from our zone of relative strength – our conscious, logical, rational, explanable, teachable, learnable, objective dependency on the physical world. From this solid foundation we can explore our zone of self-control – our internal unconscious, psychological and emotional world; and from there to our zone of relative weakness –  the systemic world of multiple interdependencies that, over time, determine our individual and collective fate.

The good news is that the knowledge and skills we need to handle the rational physical process face are easy and quick to learn.  It can be done with only a short period of focussed, learning-by-doing.  With that foundation in place we can then explore the more difficult areas of people and systems.


The Cost of Distrust

Previously we have explored “costs” associated with processes and systems – costs that could be avoided through the effective application of Improvement Science. The Cost of Errors. The Cost of Queues. The Cost of Variation.

These costs are large, additive and cumulative and yet they pale into insignificance when compared with the most potent source of cost. The Cost of Distrust.

The picture is of Sue Sheridan and the link below is to a video of Sue telling her story of betrayed trust: in a health care system.  She describes the tragic consequences of trust-eroding health care system behaviour.  Sue is not bitter though – she remains hopeful that her story will bring everyone to the table of Safety Improvement

View the Video

The symptoms of distrust are easy to find. They are written on the faces of the people; broadcast in the way they behave with each other; heard in what they say; and felt in how they say it. The clues are also in what they do not do and what they do not say. What is missing is as important as what is present.

There are also tangible signs of distrust too – checklists, application-for-permission forms, authorisation protocols, exception logs, risk registers, investigation reports, guidelines, policies, directives, contracts and all the other machinery of the Bureaucracy of Distrust. 

The intangible symptoms of distrust and the tangible signs of distrust both have an impact on the flow of work. The untrustworthy behaviour creates dissatisfaction, demotivation and conflict; the bureaucracy creates handoffs, delays and queues.  All  are potent sources of more errors, delays and waste.

The Cost of Distrust is is counted on all three dimensions – emotional, temporal and financial.

It may appear impossible to assign a finanical cost of distrust because of the complex interactions between the three dimensions in a real system; so one way to approach it is to estimate the cost of a high-trust system.  A system in which the trustworthy behaviour is explicit and trust eroding behaviour is promptly and respectfully challenged.

Picture such a system and consider these questions:

  • How would it feel to work in a high-trust  system where you know that trust-eroding-behaviour will be challenged with respect?
  • How would it feel to be the customer of a high-trust system?
               
  • What would be the cost of a system that did not need the Bureaucracy of Distrust to deliver safety and quality?

Trust eroding behaviours are not reduced by decree, threat, exhortation, name-shame-blame, or pleading because all these behaviours are based on the assumption of distrust and say “I do not trust you to do this without my external motivation”. These attitudes behaviours give away the “I am OK but You are Not OK” belief.

Trust eroding behaviours are most effectively reduced by a collective charter which is when a group of people state what behaviours they do not expect and individually commit to avoiding and challenging. The charter is the tangible sign of the peer support that empowers everyone to challenge with respect because they have collective authority to do so. Authority that is made explicit through the collective charter: “We the undersigned commit to respectfully challenge the following trust eroding behaviours …”.

It requires confidence and competence to open a conversation about distrust with someone else and that confidence comes from insight, instruction and practice. The easiest person to practice with is ourselves – it takes courage to do and it is worth the investment – which is asking and answering two questions:

Q1: What behaviours would erode my trust in someone else?

Make a list and rank on order with the most trust-eroding at the top. 

Q2: Do I ever exhibit any of the behaviours I have just listed?

Choose just one  from your list that you feel you can commit to – and make a promose to yourself – every time you demonstrate the behaviour make a mental note of:

  • When it happened?
  • Where it happened?
  • Who was present?
  • What just happened?
  • How did you feel?

You do not need to actively challange your motives,  or to actively change your behaviour – you just need to connect up your own emotional feedback loop.  The change will happen as if by magic!

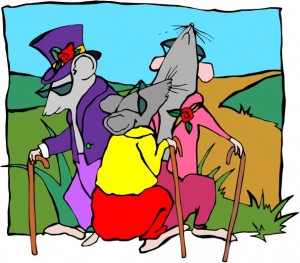
Three Blind Men and an Elephant

The Blind Men and the Elephant Story   – adapted from the poem by John Godfrey Saxe.

 “Three blind men were discussing exactly what they believed an elephant to be, since each had heard how strange the creature was, yet none had ever seen one before. So the blind men agreed to find an elephant and discover what the animal was really like. It did not take the blind men long to find an elephant at a nearby market. The first blind man approached the animal and felt the elephant’s firm flat side. “It seems to me that an elephant is just like a wall,” he said to his friends. The second blind man reached out and touched one of the elephant’s tusks. “No, this is round and smooth and sharp – an elephant is like a spear.” Intrigued, the third blind man stepped up to the elephant and touched its trunk. “Well, I can’t agree with either of you; I feel a squirming writhing thing – surely an elephant is just like a snake.” All three blind men continued to argue, based on their own individual experiences, as to what they thought an elephant was like. It was an argument that they were never able to resolve. Each of them was concerned only with their own experience. None of them could see the full picture, and none could appreciate any of the other points of view. Each man saw the elephant as something quite different, and while each blind man was correct they could not agree.”

The Elephant in this parable is the NHS and the three blind men are Governance, Operations and Finance. Each is blind because he does not see reality clearly – his perception is limited to assumptions and crippled by distorted data. The three blind men cannot agree because they do not share a common understanding of the system; its parts and its relationships. Each is looking at a multi-dimensional entity from one dimension only and for each there is no obvious way forward. So while they appear to be in conflict about the “how” they are paradoxically in agreement about the “why”. The outcome is a fruitless and wasteful series of acrimonious arguments, meaningless meetings and directionless discussions.  It is not until they declare their common purpose that their differences of opinion are seen in a realistic perspective and as an opportunity to share and to learn and to create an collective understanding that is greater than the sum of the parts.

Focus-on-the-Flow

One of the foundations of Improvement Science is visualisation – presenting data in a visual format that we find easy to assimilate quickly – as pictures.

We derive deeper understanding from observing how things are changing over time – that is the reality of our everyday experience.

And we gain even deeper understanding of how the world behaves by acting on it and observing the effect of our actions. This is how we all learned-by-doing from day-one. Most of what we know about people, processes and systems we learned long before we went to school.


When I was at school the educational diet was dominated by rote learning of historical facts and tried-and-tested recipes for solving tame problems. It was all OK – but it did not teach me anything about how to improve – that was left to me.

More significantly it taught me more about how not to improve – it taught me that the delivered dogma was not to be questioned. Questions that challenged my older-and-better teachers’ understanding of the world were definitely not welcome.

Young children ask “why?” a lot – but as we get older we stop asking that question – not because we have had our questions answered but because we get the unhelpful answer “just because.”

When we stop asking ourselves “why?” then we stop learning, we close the door to improvement of our understanding, and we close the door to new wisdom.


So to open the door again let us leverage our inborn ability to gain understanding from interacting with the world and observing the effect using moving pictures.

Unfortunately our biology limits us to our immediate space-and-time, so to broaden our scope we need to have a way of projecting a bigger space-scale and longer time-scale into the constraints imposed by the caveman wetware between our ears.

Something like a video game that is realistic enough to teach us something about the real world.

If we want to understand better how a health care system behaves so that we can make wiser decisions of what to do (and what not to do) to improve it then a real-time, interactive, healthcare system video game might be a useful tool.

So, with this design specification I have created one.

The goal of the game is to defeat the enemy – and the enemy is intangible – it is the dark cloak of ignorance – literally “not knowing”.

Not knowing how to improve; not knowing how to ask the “why?” question in a respectful way.  A way that consolidates what we understand and challenges what we do not.

And there is an example of the Health Care System Flow Game being played here.

Lub-Hub Lub-Hub Lub-Hub

If you put an ear to someones chest you can hear their heart “lub-dub lub-dub lub-dub”. The sound is caused by the valves in the heart closing, like softly slamming doors, as part of the wonderfully orchestrated process of pumping blood around the lungs and body. The heart is an impressive example of bioengineering but it was not designed – it evolved over time – its elegance and efficiency emerged over a long journey of emergent evolution.  The lub-dub is a comforting sound – it signals regularity, predictability, and stabilty; and was probably the first and most familiar sound each of heard in the womb. Our hearts are sensitive to our emotional state – and it is no accident that the beat of music mirrors the beat of the heart: slow means relaxed and fast means aroused.

Systems and processes have a heart beat too – but it is not usually audible. It can been seen though if the measures of a process are plotted as time series charts. Only artificial systems show constant and unwavering behaviour – rigidity –  natural systems have cycles.  The charts from natural systems show the “vital signs” of the system.  One chart tells us something of value – several charts considered together tell us much more.

We can measure and display the electrical activity of the heart over time – it is called an electrocardiogram (ECG) -literally “electric-heart-picture”; we can measure and display the movement of muscles, valves and blood by beaming ultrasound at the heart – an echocardiogram; we can visualise the pressure of the blood over time – a plethysmocardiogram; and we can visualise the sound the heart makes – a phonocardiogram. When we display the various cardiograms on the same time scale one above the other we get a much better understanding of how the heart is behaving  as a system. And if we have learned what to expect to see with in a normal heart we can look for deviations from healthy behaviour and use those to help us diagnose the cause.  With experience the task of diagnosis becomes a simple, effective and efficient pattern matching exercise.

The same is true of systems and processes – plotting the system metrics as time-series charts and searching for the tell-tale patterns of process disease can be a simple, quick and accurate technique: when you have learned what a “healthy” process looks like and which patterns are caused by which process “diseases”.  This skill is gained through Operations Management training and lots of practice with the guidance of an experienced practitioner. Without this investment in developing knowlewdge and understanding there is a high risk of making a wrong diagnosis and instituting an ineffective or even dangerous treatment.  Confidence is good – competence is even better.

The objective of process diagnostics is to identify where and when the LUBs and HUBs appear are in the system: a LUB is a “low utilisation bottleneck” and a HUB is a “high utilisation bottleneck”.  Both restrict flow but they do it in different ways and therefore require different management. If we confuse a LUB for a HUB and choose the wrong treatent we can unintentionally make the process sicker – or even kill the system completely. The intention is OK but if we are not competent the implementation will not be OK.

Improvement Science rests on two foundations stones – Operations Management and Human Factors – and managers of any process or system need an understanding of both and to be able to apply their knowledge in practice with competence and confidence.  Just as a doctor needs to understand how the heart works and how to apply this knowledge in clinical practice. Both technical and emotional capability is needed – the Head and the Heart need each other.                          

Safety-By-Design

The picture is of Elisha Graves Otis demonstrating, in the mid 19th century, his safe elevator that automatically applies a brake if the lift cable breaks. It is a “simple” fail-safe mechanical design that effectively created the elevator industry and the opportunity of high-rise buildings.

“To err is human” and human factors research into how we err has revealed two parts – the Error of Intention (poor decision) and the Error of Execution (poor delivery) – often referred to as “mistakes” and “slips”.

Most of the time we act unconsciously using well practiced skills that work because most of our tasks are predictable; walking, driving a car etc.

The caveman wetware between our ears has evolved to delegate this uninteresting and predictable work to different parts of the sub-conscious brain and this design frees us to concentrate our conscious attention on other things.

So, if something happens that is unexpected we may not be aware of it and we may make a slip without noticing. This is one way that process variation can lead to low quality – and these are the often the most insidious slips because they go unnoticed.

It is these unintended errors that we need to eliminate using safe process design.

There are two ways – by designing processes to reduce the opportunity for mistakes (i.e. improve our decision making); and then to avoid slips by designing the subsequent process to be predictable and therefore suitable for delegation.

Finally, we need to add a mechanism to automatically alert us of any slips and to protect us from their consequences by failing-safe.  The sign of good process design is that it becomes invisible – we are not aware of it because it works at the sub-conscious level.

As soon as we become aware of the design we have either made a slip – or the design is poor.


Suppose we walk up to a door and we are faced with a flat metal plate – this “says” to us that we need to “push” the door to open it – it is unambiguous design and we do not need to invoke consciousness to make a push-or-pull decision.  The technical term for this is an “affordance”.

In contrast a door handle is an ambiguous design – it may require a push or a pull – and we either need to look for other clues or conduct a suck-it-and-see experiment. Either way we need to switch our conscious attention to the task – which means we have to switch it away from something else. It is those conscious interruptions that cause us irritation and can spawn other, possibly much bigger, slips and mistakes.

Safe systems require safe processes – and safe processes mean fewer mistakes and fewer slips. We can reduce slips through good design and relentless improvement.

A simple and effective tool for this is The 4N Chart® – specifically the “niggle” quadrant.

Whenever we are interrupted by a poorly designed process we experience a niggle – and by recording what, where and when those niggles occur we can quickly focus our consciousness on the opportunity for improvement. One requirement to do this is the expectation and the discipline to record niggles – not necessarily to fix them immediately – but just to record them and to review them later.

In his book “Chasing the Rabbit” Steven Spear describes two examples of world class safety: the US Nuclear Submarine Programme and Alcoa, an aluminium producer.  Both are potentially dangerous activities and, in both examples, their world class safety record came from setting the expectation that all niggles are recorded and acted upon – using a simple, effective and efficient niggle-busting process.

In stark and worrying contrast, high-volume high-risk activities such as health care remain unsafe not because there is no incident reporting process – but because the design of the report-and-review process is both ineffective and inefficient and so is not used.

The risk of avoidable death in a modern hospital is quoted at around 1:300 – if our risk of dying in an elevator were that high we would take the stairs!  This worrying statistic is to be expected though – because if we lack the organisational capability to design a safe health care delivery process then we will lack the organisational capability to design a safe improvement process too.

Our skill gap is clear – we need to learn how to improve process safety-by-design.


Download Design for Patient Safety report written by the Design Council.

Other good examples are the WHO Safer Surgery Checklist, and the story behind this is told in Dr Atul Gawande’s Checklist Manifesto.

The One-Eyed Man in the Land of the Blind.

“There are known knowns; there are things we know we know.
We also know there are known unknowns; that is to say we know there are some things we do not know.
But there are also unknown unknowns – the ones we don’t know we don’t know.” Donald Rumsfeld 2002

This infamous quotation is a humorously clumsy way of expressing a profound concept. This statement is about our collective ignorance – and it hides a beguiling assumption which is that we are all so similar that we just have to accept the things that we all do not know. It is OK to be collectively and blissfully ignorant. But is this OK? Is this not the self-justifying mantra of those who live in the Land of the Blind?

Our collective blissful ignorance holds the promise of great unknown gains; and harbours the potential of great untold pain.

Our collective knowledge is vast and is growing because we have dissolved many Unknowns.  For each there must have been a point in time when the first person become painfully aware of their ignorance and, by some means, discovered some new knowledge. When that happened they had a number of options – to keep it to themselves, to share it with those they knew, or to share it with strangers. The innovators dilemma is that when they share new knowledge they know they will cause emotional pain; because to share knowledge with the blissfully ignorant implies pushing them to the state of painful awareness.

We are social animals and we demonstrate empathy and respect for others, so we do not want to deliberately cause them emotional pain – even the short term pain of awareness that must preceed the long term gain of knowledge, understanding and wisdom. It is the constant challenge that every parent, every teacher, every coach, every mentor, every leader and every healer has to learn to master.

So, how do we deal with the situation when we are painfully aware that others are in the state of blissful ignorance – of not knowing what they do not know – and we know that making them aware will be emotionally painful for them – just as it was for us? We know from experience that that an insensitive, clumsy, blunt, brutal, just-tell-it-as-it is approach can cause pain-but-no-gain; we have all had experience of others who seem to gain a perverse pleasure from the emotional impact they generate by triggering painful awareness. The disrespectful “means-justifies-the-ends” and “cruel-to-be-kind” mindset is the mantra of those who do not walk their own talk – those who do not challenge their own blissful ignorance – those who do not seek to gain an understanding of how to foster effective learning without inflicting emotional pain.

The no-pain-no-gain life limiting belief is an excuse – not a barrier. It is possible to learn without pain – we have all been doing it for our whole lives; each of us can think of people who inspired us to learn and to have fun doing so – rare and memorable role models, bright stars in the darkness of disappointment. Our challenge is to learn how to inspire ourselves.

The first step is to create an emotionally Safe Environment for Learning and Fun (SELF). For the leader/teacher/healer this requires developing an ability to build a culture of trust by actively unlearning their own trust-corroding-behaviours.  

The second step is to know what we know – to be sure of our facts and confident that we can explain and support what we know with evidence and insight. To deliberately push someone into painful awareness with no means to guide them out of that dark place is disrespectful and untrustworthy behaviour. Learning how to teach what we know is the most effective means to discover our own depth of understanding and it is an energising exercise in humility development! 

The third step is for us to have the courage to raise awareness in a sensitive and respectful way – sometimes this is done by demonstrating the knowledge; sometimes this is done by asking carefully framed questions; and sometimes it is done as a respectful challenge.  The three approaches are not mutually exclusive: leading-by-example is effective but leaders need to be teachers and healers too.  

At all stages the challenge for the leader/teacher/healer is to to ensure they maintain an OK-OK mental model of those they influence. This is the most difficult skill to attain and is the most important. The “Leadership and Self-Deception” book that is in the Library of Improvement Science is a parable that decribes this challenge.

So, how do we dissolve the One-Eyed Man in the Land of the Blind problem? How do we raise awareness of a collective blissful ignorance? How do we share something that is going to cause untold pain and misery in the future – a storm that is building over the horizon of awareness.

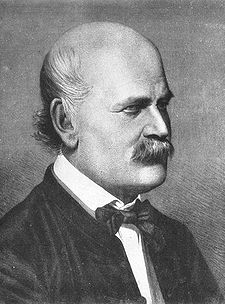
Ignaz Semmelweis (1818-1865) was the young Hungarian doctor who in 1847 discovered the dramatic live-saving benefit of the doctors cleaning their hands before entering the obstetric ward of the Vienna Hospital. This was before “germs” had been discovered and Semmelweis could not explain how his discovery worked – all he could do was to exhort others to do as he did. He did not learn how the method worked, he did not publish his data, and he demonstrated trust-eroding behaviour when he accused others of “murder” when they did not do as he told them.  The fact the he was correct did not justify the means by which he challenged their collective blissful ignorance (see http://www.valuesystemdesign.com for a fuller account).  The book that he eventually published in 1861 includes the data that supports our modern understanding of the importance of hand hygiene – but it also includes a passionate diatribe of how he had been wronged by others – a dramatic example of the “I’m OK and The Rest of the World is Not OK” worldview. Semmelweis was committed to a lunatic asylum and died there in 1865.   

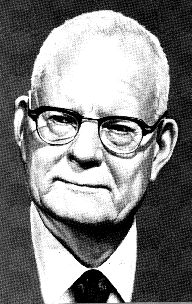
W Edwards Deming (1900-1993) was the American engineer, mathematician, mathematical physicist, statistician and student of Walter A. Shewhart who learned the importance of quality in design. After WWII he was part of the team who helped to rebuild the Japanese economy and he taught the Japanese what he had learned and practiced during WWII – which was how to create a high-quality, high-speed, high-efficiency process which, ironically, was building ships for the war effort. Later Deming attempted, and failed, to influence the post-war generation of managers that were being churned out by the new business schools to serve the growing global demand for American mass produced consumer goods. Deming returned to relative obscurity in the USA until 1980 when his teachings were rediscovered when Japan started to challenge the USA economically by producing higher-quality-and-lower-cost consumer products such as cars and electronics ( http://en.wikipedia.org/wiki/W._Edwards_Deming). Before he died in 1993 Deming wrote two books – Out of The Crisis and The New Economics in which he outlines his learning and his philosophy and in which he unreservedly and passionately blames the managers and the business schools that trained them for their arrogant attitude and disrespectful behaviour. Like Semmelweis, the fact that his books contain a deep well of wisdom does not justify the means by which he disseminated his criticism of poeple – in particular of senior management. By doing so he probably created resistance and delayed the spread of knowledge.  

History is repeating itself: the same story is being played out in the global healthcare system. Neither senior doctors nor senior managers are aware of the opportunity that the learning of Semmelweis and Deming represent – the opportunity of Improvement Science and of the theory, techniques and tools of Operations Management. The global healthcare system is in a state of collective blissful ignorance.  Our descendents be the recipients of of decisions and the judges of our behaviour – and time is running out – we do not have the luxury of learning by making the same mistake.

Fortunately, there is an growing group of people who are painfully aware of the problem and are voicing their concerns – such as the Institute of Healthcare Improvement  in America. There is a smaller and less well organised network of people who have acquired and applied some of the knowledge and are able to demonstrate how it works – the Know Hows. There appears to be an even smaller group who understand and use the principles but do it intuitively and unconsciously – they dem0nstrate what is possible but find it difficult to teach others how to do what they do. It is the Know How group that is the key to dissolving the problem.

The first collective challenge is to sign-post some safe paths from Collective Blissful Ignorance to Individual Know How. The second collective challenge is to learn an effective and respectful way to raise awareness of the problem – a way to outline the current reality and the future opportunity – and a way that illuminates the paths that link the two.

In the land of the blind the one-eyed man is the person who discovers that everyone is wearing a head-torch by accidentally finding his own and switching it on!


July 5th 2018 – The old NHS is dead.

Today is the last day of the old NHS – ironically on the 70th anniversary of its birth. Its founding principles are no more – care is no longer free at the point of delivery and is no longer provided according to needs rather than means. SickCare®, as it is now called, is a commodity just like food, water, energy, communications, possessions, housing, transport, education and leisure – and the the only things we get free-of-charge are air, sunlight, rain and gossip.  SickCare® is now only available from fiercely competitive service conglomerates – TescoHealth and VirginHealth being the two largest.  We now buy SickCare® like we buy groceries – online and instore.

Gone forever is the public-central-tax-funded-commissioner-and-provider market. Gone forever are the foundation trusts, the clinical commissioning groups and the social enterprises. Gone is the dream of cradle-to-grave equitable health care  – and all in a terrifyingly short time!

The once proud and independent professionals are now paid employees of profit-seeking private providers. Gone is their job-for-life security and gone is their gold-plated index-linked-final-salary-pensions.  Everyone is now hired and fired on the basis of performance, productivity and profit. Step out of line or go outside the limits of acceptability and it is “Sorry but you have breached your contract and we have to let you go“.

So what happened? How did the NHS-gravy-train come off the taxpayer-funded-track so suddenly?

It is easy to see with hindsight when the cracks started to appear. No-one and every-one is to blame.

We did this to ourselves. And by the time we took notice it was too late.

The final straw was when the old NHS became unaffordable because we all took it for granted and we all abused it.  Analysts now agree that there were two core factors that combined to initiate the collapse and they are unflatteringly referred to as “The Arrogance of Clinicians” and “The Ignorance of Managers“.  The latter is easier to explain.

When the global financial crisis struck 10 years ago it destabilised the whole economy and drastic “austerity” measures had to be introduced by the new coalition government. This opened the innards of the NHS to scrutiny by commercial organisations with an eager eye on the £100bn annual budget. What they discovered was a massive black-hole of management ignorance!

Protected for decades from reality by their public sector status the NHS managers had not seen the need to develop their skills and experience in Improvement Science and, when the chips were down, they were simply unable to compete.

Thousands of them hit the growing queues of the unemployed or had to settle for painful cuts in their pay and conditions before they really knew what had hit them. They were ruthlessly replaced by a smaller number of more skilled and more experienced managers from successful commercial service companies – managers who understood how systems worked and how to design them to deliver quality, productivity and profit.

The medical profession also suffered.

With the drop in demand for unproven treatments, the availability of pre-prescribed evidence-based standard protocols for 80% of the long-term conditions, and radically redesigned community-based delivery processes – a large number of super-specialised doctors were rendered “surplus to requirement”. This skill-glut created the perfect buyers market for their specialist knowledge – and they were forced to trade autonomy for survival. No longer could a GP or a Consultant choose when and how they worked; no longer were they able to discount patient opinion or patient expectation; and no longer could they operate autonomous empires within the bloated and bureaucratic trusts that were powerless to performance manage them effectively. Many doctors tried to swim against the tide and were lost – choosing to jump ship and retire early. Many who left it too late to leap failed to be appointed to their previous jobs because of “lack of required team-working and human-factor skills”.

And the public have fared no better than the public-servants. The service conglomerates have exercised their considerable financial muscle to create low-cost insurance schemes that cover only the most expensive and urgent treatments because, even in our Brave New NHS, medical bankruptcy is not politically palatable.  State subsidised insurance payouts provide a safety net  – but they cover only basic care. The too-poor-to-pay are not left to expire on the street as in some countries – but once our immediate care needs are met we have to leave or start paying the going rate.  Our cashless society and our EzeeMonee cards now mean that we pay-as-we-go for everything. The cash is transferred out of our accounts before the buy-as-you-need drug has even started to work!

A small yet strident band of evangelical advocates of the Brave New NHS say it is long overdue and that, in the long term, the health of the nation will be better for it. No longer able to afford the luxury of self-abuse through chronic overindulgence of food, cigarettes, and alcohol – and faced with the misery of the outcome of their own actions –  many people are shepherded towards healthier lifestyles. Those who comply enjoy lower insurance premiums and attractive no-claims benefits.  Healthier in body perhaps – but what price have we paid for our complacency? “


On July 15th 2012 the following headline appeared in one Sunday paper: “Nurses hired at £1,600 a day to cover shortages” and in another “Thousands of doctors face sack: NHS staff contracts could be terminated unless they agree to drastic changes to their pay and conditions“.  We were warned and it is not too late.


The Seven Flows

Improvement Science is the knowledge and experience required to improve … but to improve what?

Improve safety, delivery, quality, and productivity?

Yes – ultimately – but they are the outputs. What has to be improved to achieve these improved outputs? That is a much more interesting question.

The simple answer is “flow”. But flow of what? That is an even better question!

Let us consider a real example. Suppose we want to improve the safety, quality, delivery and productivity of our healthcare system – which we do – what “flows” do we need to consider?

The flow of patients is the obvious one – the observable, tangible flow of people with health issues who arrive and leave healthcare facilities such as GP practices, outpatient departments, wards, theatres, accident units, nursing homes, chemists, etc.

What other flows?

Healthcare is a service with an intangible product that is produced and consumed at the same time – and in for those reasons it is very different from manufacturing. The interaction between the patients and the carers is where the value is added and this implies that “flow of carers” is critical too. Carers are people – no one had yet invented a machine that cares.

As soon as we have two flows that interact we have a new consideration – how do we ensure that they are coordinated so that they are able to interact at the same place, same time, in the right way and is the right amount?

The flows are linked – they are interdependent – we have a system of flows and we cannot just focus on one flow or ignore the inter-dependencies. OK, so far so good. What other flows do we need to consider?

Healthcare is a problem-solving process and it is reliant on data – so the flow of data is essential – some of this is clinical data and related to the practice of care, and some of it is operational data and related to the process of care. Data flow supports the patient and carer flows.

What else?

Solving problems has two stages – making decisions and taking actions – in healthcare the decision is called diagnosis and the action is called treatment. Both may involve the use of materials (e.g. consumables, paper, sheets, drugs, dressings, food, etc) and equipment (e.g. beds, CT scanners, instruments, waste bins etc). The provision of materials and equipment are flows that require data and people to support and coordinate as well.

So far we have flows of patients, people, data, materials and equipment and all the flows are interconnected. This is getting complicated!

Anything else?

The work has to be done in a suitable environment so the buildings and estate need to be provided. This may not seem like a flow but it is – it just has a longer time scale and is more jerky than the other flows – planning-building-using a new hospital has a time span of decades.

Are we finished yet? Is anything needed to support the these flows?

Yes – the flow that links them all is money. Money flowing in is called revenue and investment and money flowing out is called costs and dividends and so long as revenue equals or exceeds costs over the long term the system can function. Money is like energy – work only happens when it is flowing – and if the money doesn’t flow to the right part at the right time and in the right amount then the performance of the whole system can suffer – because all the parts and flows are interdependent.

So, we have Seven Flows – Patients, People, Data, Materials, Equipment, Estate and Money – and when considering any process or system improvement we must remain mindful of all Seven because they are interdependent.

And that is a challenge for us because our caveman brains are not designed to solve seven-dimensional time-dependent problems! We are OK with one dimension, struggle with two, really struggle with three and that is about it. We have to face the reality that we cannot do this in our heads – we need assistance – we need tools to help us handle the Seven Flows simultaneously.

Fortunately these tools exist – so we just need to learn how to use them – and that is what Improvement Science is all about.

Inborn Errors of Management

There is a group of diseases called “inborn errors of metabolism” which are caused by a faulty or missing piece of DNA – the blueprint of life that we inherit from our parents. DNA is the chemical memory that stores the string of instructions for how to build every living organism – humans included. If just one DNA instruction becomes damaged or missing then we may lose the ability to make or to remove one specific chemical – and that can lead to a deficiency or an excess of other chemicals – which can then lead to dysfunction – which can then make us feel unwell – and can then limit both our quality and quantity of life.  We are a biological system of interdependent parts. If an inborn error of metabolism is lethal it will not be passed on to our offspring because we don’t live long enough – so the ones we see are the ones which and not lethal.  We treat the symptoms of an inborn error of metabolism by artificially replacing the missing chemical – but the way to treat the cause is to repair, replace or remove the faulty DNA.

The same metaphor can be applied to any social system. It too has a form of DNA which is called culture – the inherited set of knowledge, beliefs, attitudes and behaviours that the organisation uses to conduct itself in its day-to-day business of survival. These patterns of behaviour are called memes – the social equivalent to genes – and are passed on from generation to generation through language – body language and symbolic language; spoken words – stories, legends, myths, songs, poems and books – the cultural collective memory of the human bio-psycho-social system. All human organisations share a large number of common memes – just as we share a large number of common genes with other animals and plants and even bacteria. Despite this much larger common cultural heritage – it is the differences rather than the similarities that we notice – and it is these differences that spawn the cultural conflict that we observe at all levels of society.

If, by chance alone, an organisation inherits a depleted set of memes it will appear different to all the others and it will tend to defend that difference rather than to change it. If an organisation has a meme defect, a cultural mutation that affects a management process, then we have the organisational condition called an Inborn Error of Management – and so long as the mutation is not lethal to the organisation it will tend to persist and be passed largely unnoticed from one generation of managers to the next!

The NHS was born in 1948 without a professional management arm, and while it survived and grew initally, it became gradually apparent that the omisson of the professional management limb was a problem; so in the 1980’s, following the Griffiths Report, a large dose professional management was grafted on and a dose of new management memes were injected. These included finance, legal and human resource management memes but one important meme was accidentally omitted – process engineering – the ability to design a process to meet a specific quality, time and cost specification.  This omission was not noticed initially because the rapid development of new medical technologies and new treatments was delivering improvements that obscured the inborn error of management. The NHS became the envy of many other countries – high quality healthcare available to all and free at the point of delivery.  Population longevity improved, public expectation increased, demand for healthcare increased and inevitably the costs increased.  In the 1990’s the growing pains of the burgeoning NHS led to a call for more funding, quoting other countries as evidence, and at the turn of the New Millenium a ten year plan to pump billions of pounds per year into the NHS was hatched.  Unfortunately, the other healthcare services had inherited the same meme defect – so the NHS grew 40% bigger but no better – and the evidence is now accumulatung that productivity (the ratio of output quality to input cost) has actally fallen by more than 10% – there are more people doing more work but less well.  The UK along with many other countries has hit an economic brick wall and the money being sucked into the NHS cannot increase any more – even though we have created a legacy of an increasing proportion of retired and elderly members of society to support. 

The meme defect that the NHS inherited in 1948 and that was not corrected in the transplant operation  1980’s is now exerting it’s influence – the NHS has no capability for process engineering – the theory, techniques, tools and training required to design processes are not on the curriculum of either the NHS managers or the clinicians. The effect of this defect is that we can only treat the symptoms rather than the cause – and we only have blunt and ineffective instruments such as a budget restriction – the management equivalent of a straight jacket – and budget cuts – the management equivalent of a jar of leeches. To illustrate the scale of the effect of this inborn error of management we only need to look at other organisations that do not appear to suffer from the same condition – for example the electronics manufacturing industry. The almost unbelieveable increase in the performance, quality and value for money of modern electronics over the last decade (mobile phones, digital cameras, portable music players, laptop computers, etc) is because these industries have invested in developing both their electrical and process engineering capabilities. The Law of the Jungle has weeded out the companies who did not – they have gone out of business or been absorbed – but publically funded service organisations like the NHS do not have this survival pressure – they are protected from it – and trying to simulate competition with an artificial internal market and applying stick-and-carrot top-down target-driven management is not a like-for-like replacement.    

The challenge for the NHS is clear – if we want to continue to enjoy high quality health care, free at the point of delivery, and that we can afford then we will need to recognise and correct our inborn error of management. If we ignore the symptoms, deny the diagnosis and refuse to take the medicine then we will suffer a painful and lingering decline – not lethal and not enjoyable – and it is has a name: purgatory.

The good news is that the treatment is neither expensive, nor unpleasant nor dangerous – process engineering is easy to learn, quick to apply, and delivers results almost immediately – and it can be incorporated into the organisational meme-pool quite quickly by using the see-do-teach vector. All we have to do is to own up to the symptoms, consider the evidence, accept the diagnosis, recognise the challenge and take our medicine. The sooner the better!


Lies, Damned Lies and Statistics!

Most people are confused by statistics and because of this experts often regard them as ignorant, stupid or both.  However, those who claim to be experts in statistics need to proceed with caution – and here is why.

The people who are confused by statistics are confused for a reason – the statistics they see presented do not make sense to them in their world.  They are not stupid – many are graduates and have high IQ’s – so this means they must be ignorant and the obvious solution is to tell them to go and learn statistics. This is the strategy adopted in medicine: Trainees are expected to invest some time doing research and in the process they are expected to learn how to use statistics in order to develop their critical thinking and decision making.  So far so good, so what  is the outcome?

Well, we have been running this experiment for decades now – there are millions of peer reviewed papers published – each one having passed the scrutiny of a statistical expert – and yet we still have a health care system that is not delivering what we need at a cost we can afford.  So, there must be someone else at fault – maybe the managers! They are not expected to learn or use statistics so that statistically-ignorant rabble must be the problem -so the next plan is “Beat up the managers” and “Put statistically trained doctors in charge”.

Hang on a minute! Before we nail the managers and restructure the system let us step back and consider another more radical hypothesis. What if there is something not right about the statistics we are using? The medical statistics experts will rise immediately and state “Research statistics is a rigorous science derived from first principles and is mathematically robust!”  They are correct. It is. But all mathematical derivations are based on some initial fundamental assumptions so when the output does not seem to work in all cases then it is always worth re-examining the initial assumptions. That is the tried-and-tested path to new breakthroughs and new understanding.

The basic assumption that underlies research statistics is that all measurements are independent of each other which also implies that order and time can be ignored.  This is the reason that so much effort, time and money is invested in the design of a research trial – to ensure that the statistical analysis will be correct and the conclusions will be valid. In other words the research trial is designed around the statistical analysis method and its founding assumption. And that is OK when we are doing research.

However, when we come to apply the output of our research trials to the Real World we have a problem.

How do we demonstrate that implementing the research recommendation has resulted in an improvement? We are outside the controlled environment of research now and we cannot distort the Real World to suit our statistical paradigm.  Are the statistical tools we used for the research still OK? Is the founding assumption still valid? Can we still ignore time? Our answer is clearly “NO” because we are looking for a change over time! So can we assume the measurements are independent – again our answer is “NO” because for a process the measurement we make now is influenced by the system before, and the same system will also influence the next measurement. The measurements are NOT independent of each other.

Our statistical paradigm suddenly falls apart because the founding assumption on which it is built is no longer valid. We cannot use the statistics that we used in the research when we attempt to apply the output of the research to the Real World. We need a new and complementary statistical approach.

Fortunately for us it already exists and it is called improvement statistics and we use it all the time – unconsciously. No doctor would manage the blood pressure of a patient on Ward A  based on the average blood pressure of the patients on Ward B – it does not make sense and would not be safe.  This single flash of insight is enough to explain our confusion. There is more than one type of statistics!

New insights also offer new options and new actions. One action would be that the Academics learn improvement statistics so that they can understand better the world outside research; another action would be that the Pragmatists learn improvement statistics so that they can apply the output of well-conducted research in the Real World in a rational, robust and safe way. When both groups have a common language the opportunities for systemic improvment increase. 

BaseLine© is a tool designed specifically to offer the novice a path into the world of improvement statistics.

Does More Efficient equal More Productive?

It is often assumed that efficiency and productivity are the same thing – and this assumption leads to the conclusion that if we use our resources more efficiently then we will automatically be more productive. This is incorrect. The definition of productivity is the ratio of what we expect to get out divided by what we put in – and the important caveat to remember is that only the output which meets expectation is counted – only output that passes the required quality specification.

This caveat has two important implications:

1. Not all activity contributes to productivity. Failures do not.
2. To measure productivity we must define a quality specification.

Efficiency is how resources are used and is often presented as metric called utilisation – the ratio of how much time a resource was used to how much time a resource was available.  So, utilisation includes time spent by resources detecting and correcting avoidable errors.

Increasing utilisation does not always imply increasing productivity: It is possible to become more efficient and less productive by making, checking, detecting and fixing more errors.

For example, if we make more mistakes we will have more output that fails to meet the expected quality, our customers complain and productivity has gone down. Our standard reaction to this situation is to put pressure on ourselves to do more checking and to correct the erros we find – which implies that our utilisation has gone up but our productivity has remained down: we are doing more work to achieve the same outcome.

However, if we remove the cause of the mistakes then more output will meet the quality specification and productivity will go up (better outcome with same resources); and we also have have less re-work to do so utilisation goes down which means productivity goes up even further (remember: productivity = success out divided by effort in). Fixing the root case of errors delivers a double-productivity-improvement.

In the UK we have become a victim of our own success – we have a population that is living longer (hurray) and that will present a greater demand for medical care in the future – however the resources that are available to provide healthcare cannot increase at the same pace (boo) – so we have a problem looming that is not going to go away just by ignoring it. Our healthcare system needs to become more productive. It needs to deliver more care with the same cash – and that implies three requirements:
1. We need to specify our expectation of required quality.
2. We need to measure productivity so that we can measure improvement over time.
3. We need to diagnose the root-causes of errors rather than just treat their effects.

Improved productivity requires improved quality and lower costs – which is good because we want both!

Will the Cuts Cure the Problem or Kill the Patient?

Times are hard. Severe austerity measures are being imposed to plug the hole in the national finances. Cuts are being made.  But will these cuts cure the problem or kill the patient?  How would we know before it is too late? Is there an alternative to sticking the fiscal knife in and hoping we don’t damage a vital part of the system? Is a single bold slash or a series of planned incisions a better strategy?  How deep, how far and how fast is it safe to cut? The answer to these questions is “we don’t know” – or rather that we find it very hard to predict with confidence what will happen.  The reason for this is that we are dealing with a complex system of interdependent parts that connect to each other through causal links; some links are accelerators, some are brakes, some work faster and some slower.  Our caveman brains were not designed to solve this sort of predicting-the-future-behaviour-of-a-complex-system problem: our brains evolved to spot potential danger quickly and to manage a network of social relationships.  So to our caveman way of thinking complex systems behave in counter-intuitive ways.  However, all physical systems are constrained by the Laws of Nature – so if we don’t understand how they behave then the limitation is with the caveman wetware between our ears.

We do have an amazing skill though – we have the ability to develop tools that extend our limited biological capabilites. We have mastered technology – in particular the technology of data and information. We have  learned how to recode and record our expereince and our understanding so that each generation can build on the knowledge of the previous ones.  The tricky problems we are facing are ones that we have never encountered before so we have to learn as we go.

So our current problem of understanding the dynamics of our economic and social system is this: we cannot do this unconsciously and intuitively in our heads. Instead we have developed tools that can extend our predictive capability. Our challenge is to learn how to use these tools – how to wield the fiscal scalpel so that it is quick, safe and effective. We need to excise the cancer of waste while preserving our vital social and economic structures and processes.  We need the best tools available – diagnostic tools, decision tools, treatment planning tools, and progress monitoring tools.  These tools exist – we just need to learn to use them.

A perfect example of this is the reining in of public spending and the impact of cutting social service budgets.  One thing that these budgets provide are services that some people need to maintain independent living in the community.  Very often elderly people are only just coping and even a minor illness can be enough to tip them over the edge and into hospital – where they can get stuck because to discharge them safely requires extra social support – support that if provided earlier might have prevented a hospital admission. So boldly slashing the social care budget will not magically excise the waste – it means that there will be less social support capacity and patients will get stuck in the hospital part of the health and social care system. This is not good for them – or anyone else. Hospitals are not hotels and getting stuck in one is not a holiday! Hospitals are for people who are very ill – and if the hospital is full of not-so-ill people who are stuck then we have an even bigger problem – because the very ill people get even more ill – and then they need even more resources to get them well again. Some do not make it. A bold slash in just one part of the health and  social care system can, unintentionally, bring the whole health and social care system crashing down.

Fortunately there is a way to avoid this – and it is counter-intuitive – otherwise we would have done it already. And because it is counter-intuitive I cannot just explain it – the only way to understand it is to discover and demonstrate  it to ourselves.  And in the process of learning to master the tools we need we will make a lot of errors. Clearly, we do not want to impose those errors on the real system – so we need something to practice with that is not the real system yet behaves realistically enough to allow us to develop our skills. That something is a system simulation. To experience an example of a healthcare system simulation and to play the game please follow the link: click here to play the game

Reactive or Proactive?

Improvement Science is about solving problems – so looking at how we solve problems is a useful exercise – and there is a continuous spectrum from 100% reactive to 100% proactive.

The reactive paradigm implies waiting until the problem is real and urgent and then acting quickly and decisively – hence the picture of the fire-fighter.  Observe the equipment that the fire-fighter needs:  a hat and suit to keep him safe and a big axe! It is basically a destructive and unsafe job based on the “our purpose is to stop the problem getting worse”.

The proactive paradigm implies looking for the earliest signs of the problem and planning the minimum action required to prevent the problem – hence the picture of the clinician. Observe the equipment that the clinician needs: a clean white coat to keep her patients safe and a stethoscope – a tool designed to increase her sensitivity so that subtle diagnostic sounds can be detected.

If we never do the proactive we will only ever do the reactive – and that is destructive and unsafe. If we never do the reactive we run the risk of losing everything – and that is destructive and unsafe too.

To practice safe and effective Improvement Science we must be able to do both in any combination and know which and when: we need to be impatient, decisive and reactive when a system is unstable, and we need to be patient, reflective and proactive when the system is stable.  To choose our paradigm we must listen to the voice of the process. It will speak to us if we are prepared to listen and if we are prepared to learn it’s language.

The Plague of Niggles

Historians tell us that in the Middle Ages about 25 million people, one third of the population of Europe, were wiped out by a series of Plagues! We now know that the cause was probably a bacteria called Yersinia Pestis that was spread by fleas when they bite their human hosts to get a meal of blood. The fleas were carried by rats and ships carried the rats from one country to another.  The unsanitary living conditions of the ports and towns at the time provided the ideal conditions for rats and fleas and, with a superstitious belief that cats were evil, without their natural predator the population of rats increased, so the population of fleas increased, so the likehood of transmission of the lethal bacteria increased, and the number of people decreased. A classic example of a chance combination of factors that together created an unstable and deadly system.

The Black Death was not eliminated by modern hi-tech medicine; it just went away when some of the factors that fuelled the instability were reduced. A tangible one being the enforced rebuilding of London after the Great Fire in Sept 1666 which gutted the medieval city and which followed the year after the last Great Plague in 1665 that killed 20% of the population. 

The story is an ideal illustration of how apparently trivial, albeit  annoying, repeated occurences can ultimately combine and lead to a catastrophic outcome.  I have a name for these apparently trivial, annoying and repeated occurences – I call them Niggles – and we are plagued by them. Every day we are plagued by junk mail, unpredictable deliveries, peak time traffic jams, car parking, email storms, surly staff, always-engaged call centres, bad news, bureaucracy, queues, confusion, stress, disappointment, depression. Need I go on?  The Plague of Niggles saps our spirit just as the Plague of Fleas sucked our ancestors blood.  And the Plague of Niggles infect us with a life-limiting disease – not a rapidly fatal one like the Black Death – instead we are infected with a slow, progressive, wasting disease that affects our attitude and behaviour and which manifests itself as criticism, apathy and cynicism.  A disease that seems as terifying, mysterious and incurable to us today as the Plague was to our ancestors. 

History repeats itself and we now know that complex systems behave in characteristic ways – so our best strategy may the same – prevention. If we use the lesson of history as our guide we should be proactive and focus our attention on the Niggles. We should actively seek them out; see them for what they really are; exercise our amazing ability to understand and solve them; and then share the nuggets of new knowledge that we generate.

Seek-See-Solve-Share.

Can Chance make Us a Killer?

Imagine you are a hospital doctor. Some patients die. But how many is too many before you or your hospital are labelled killers? If you check out the BBC page

What Happens if We Cut the Red Tape?

Later in his career, the famous artist William Heath-Robinson (1872-1944) created works of great ingenuity that showed complex inventions that were created to solve real everyday problems.  The genius of his work was that his held-together-with-string contraptions looked comically plausible. This genre of harmless mad-inventorism has endured, for example as the eccentric Wallace and Grommet characters.

The problem arises when this seat-of-the-pants incremental invent-patch-and-fix approach is applied to real systems – in particular a healthcare system. We end up with the same result – a Heath-Robinson contraption that is held together with Red Tape.

The complex bureaucracy both holds the system together and clogs up the working – and everyone knows it. It is not harmless though – it is expensive, slow and lethal.  How then do we remove the Red Tape to allow the machine to work more quickly, more safely and more affordably – without the whole contraption falling apart?

A good first step would be to stop adding yet more Red Tape. A sensible next step would be to learn how to make the Red Tap redundant before removing it. However, if we knew how to do that already we would not have let the Red Tapeworms infest our healthcare system in the first place!  This uncomfortable conclusion raises some questions …

What insight, knowledge and skill are we missing?
Where do we need to look to find the skills we lack?
Who knows how to safely eliminate the Red Tapeworms?
Can they teach the rest of us?
How long will it take us to learn and apply the knowledge?
Why might we justify continuing as we are?
Why might we want to maintain the status quo?
Why might we ignore the symptoms and not seek advice?
What are we scared of? Having to accept some humility?

That doesn’t sound like a large price to pay for improvement!