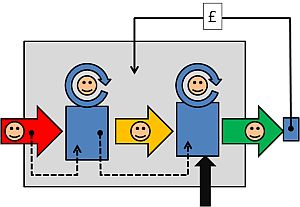
The Writing On The Wall – Part I

writing_on_the_wallThe writing is on the wall for the NHS.

It is called the Francis Report and there is a lot of it. Just the 290 recommendations runs to 30 pages. It would need a very big wall and very small writing to put it all up there for all to see.

So predictably the speed-readers have latched onto specific words – such as “Inspectors“.

Recommendation 137Inspection should remain the central method for monitoring compliance with fundamental standards.”

And it goes further by recommending “A specialist cadre of hospital inspectors should be established …”

A predictable wail of anguish rose from the ranks “Not more inspectors! The last lot did not do much good!”

The word “cadre” is not one that is used in common parlance so I looked it up:

Cadre: 1. a core group of people at the center of an organization, especially military; 2. a small group of highly trained people, often part of a political movement.

So it has a military, centralist, specialist, political flavour. No wonder there was a wail of anguish! Perhaps this “cadre of inspectors” has been unconsciously labelled with another name? Persecutors.

Of more interest is the “highly trained” phrase. Trained to do what? Trained by whom? Clearly none of the existing schools of NHS management who have allowed the fiasco to happen in the first place. So who – exactly? Are these inspectors intended to be protectors, persecutors, or educators?

And what would they inspect?

And how would they use the output of such an inspection?

Would the fear of the inspection and its possible unpleasant consequences be the stick to motivate compliance?

Is the language of the Francis Report going to create another brick wall of resistance from the rubble of the ruins of the reputation of the NHS?  Many self-appointed experts are already saying that implementing 290 recommendations is impossible.

They are incorrect.

The number of recommendations is a measure of the breadth and depth of the rot. So the critical-to-success factor is to implement them in a well-designed order. Get the first few in place and working and the rest will follow naturally.  Get the order wrong and the radical cure will kill the patient.

So where do we start?

Let us look at the inspection question again.  Why would we fear an external inspection? What are we resisting? There are three facets to this: first we do not know what is expected of us;  second we do not know if we can satisfy the expectation; and third we fear being persecuted for failing to achieve the impossible.

W Edwards Deming used a very effective demonstration of the dangers of well-intended but badly-implemented quality improvement by inspection: it was called the Red Bead Game.  The purpose of the game was to illustrate how to design an inspection system that actually helps to achieve the intended goal. Sustained improvement.

This is applied Improvement Science and I will illustrate how it is done with a real and current example.


I am assisting a department in a large NHS hospital to improve the quality of their service. I have been sent in as an external inspector.  The specific quality metric they have been tasked to improve is the turnaround time of the specialist work that they do. This is a flow metric because a patient cannot leave hospital until this work is complete – and more importantly it is a flow and quality metric because when the hospital is full then another patient, one who urgently needs to be admitted, will be waiting for the bed to be vacated. One in one out.

The department have been set a standard to meet, a target, a specification, a goal. It is very clear and it is easily measurable. They have to turnaround each job of work in less than 2 hours.  This is called a lead time specification and it is arbitrary.  But it is not unreasonable from the perspective of the patient waiting to leave and for the patient waiting to be admitted. Neither want to wait.

The department has a sophisticated IT system that measures their performance. They use it to record when each job starts and when each job is finished and from those two events the software calculates the lead time for each job in real-time. At the end of each day the IT system counts how many jobs were completed in less than 2 hours and compares this with how many were done in total and calculates a ratio which it presents as a percentage in the range of 0 and 100. This is called the process yield.  The department are dedicated and they work hard and they do all the work that arrives each day the same day – no matter how long it takes. And at the end of each day they have their score for that day. And it is almost never 100%.  Not never. Almost never. But it is not good enough and they are being blamed for it. In turn they blame others for making their job more difficult. It is a blame-game and it has been going on for years.

So how does an experienced Improvement Science-trained Inspector approach this sort of “wicked” problem?

First we need to get the writing on the wall – we need to see the reality – we need to “plot the dots” – we need to see what the performance is doing over time – we need to see the voice of the process. And that requires only their data, a pencil, some paper and for the chart to be put on the on the wall where everyone can see it.

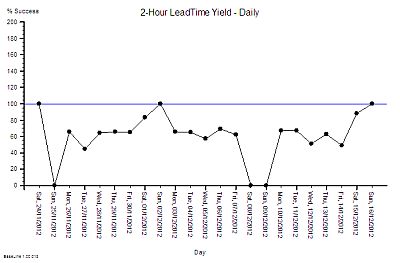
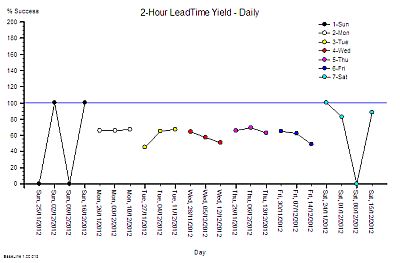
Chart_1This is what their daily % yield data for three consecutive weeks looked like as a time-series chart. The thin blue line is the 100% yield target.

The 100% target was only achieved on three days – and they were all Sundays. On the other Sunday it was zero (which may mean that there was no data to calculate a ratio from).

There is wide variation from one day to the next and it is the variation as well as the average that is of interest to an improvement scientist. What is the source of the variation it? If 100% yield can be achieved some days then what is different about those days?

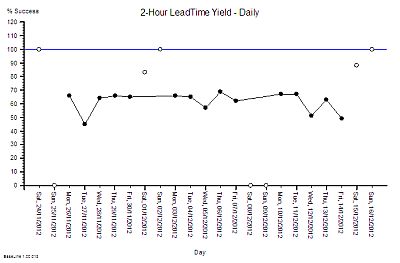
Chart_2

So our Improvement science-trained Inspector will now re-plot the data in a different way – as rational groups. This exposes the issue clearly. The variation on Weekends is very wide and the performance during the Weekdays is much less variable.  What this says is that the weekend system and the weekday system are different. This means that it is invalid to combine the data for both.

It also raises the question of why there is such high variation in yield only at weekends?  The chart cannot answer the question, so our IS-trained Inspector digs a bit deeper and discovers that the volume of work done at the weekend is low, the staffing of the department is different, and that the recording of the events is less reliable. In short – we cannot even trust the weekend data – so we have two reasons to justify excluding it from our chart and just focusing on what happens during the week.

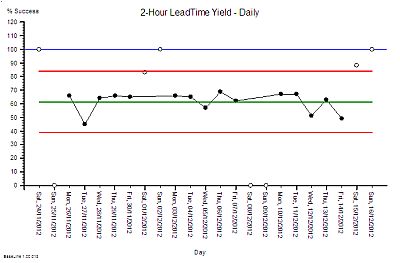
Chart_3We re-plot our chart, marking the excluded weekend data as not for analysis.

We can now see that the weekday performance of our system is visible, less variable, and the average is a long way from 100%.

The team are working hard and still only achieving mediocre performance. That must mean that they need something that is missing. Motivating maybe. More people maybe. More technology maybe.  But there is no more money for more people or technology and traditional JFDI motivation does not seem to have helped.

This looks like an impossible task!

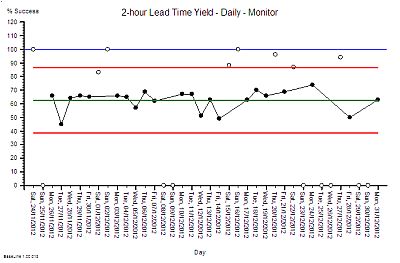
Chart_4

So what does our Inspector do now? Mark their paper with a FAIL and put them on the To Be Sacked for Failing to Meet an Externally Imposed Standard heap?

Nope.

Our IS-trained Inspector calculates the limits of expected performance from the data  and plots these limits on the chart – the red lines.  The computation is not difficult – it can be done with a calculator and the appropriate formula. It does not need a sophisticated IT system.

What this chart now says is “The current design of this process is capable of delivering between 40% and 85% yield. To expect it do do better is unrealistic”.  The implication for action is “If we want 100% yield then the process needs to be re-designed.” Persecution will not work. Blame will not work. Hoping-for-the-best will not work. The process must be redesigned.

Our improvement scientist then takes off the Inspector’s hat and dons the Designer’s overalls and gets to work. There is a method to this and it is called 6M Design®.

Chart_5

First we need to have a way of knowing if any future design changes have a statistically significant impact – for better or for worse. To do this the chart is extended into the future and the red lines are projected forwards in time as the black lines called locked-limits.  The new data is compared with this projected baseline as it comes in.  The weekends and bank holidays are excluded because we know that they are a different system. On one day (20/12/2012) the yield was surprisingly high. Not 100% but more than the expected upper limit of 85%.

Chart_6The alerts us to investigate and we found that it was a ‘hospital bed crisis’ and an ‘all hands to the pumps’ distress call went out.

Extra capacity was pulled to the process and less urgent work was delayed until later.  It is the habitual reaction-to-a-crisis behaviour called “expediting” or “firefighting”.  So after the crisis had waned and the excitement diminished the performance returned to the expected range. A week later the chart signals us again and we investigate but this time the cause was different. It was an unusually quiet day and there was more than enough hands on the pumps.

Both of these days are atypically good and we have an explanation for each of them. This is called an assignable cause. So we are justified in excluding these points from our measure of the typical baseline capability of our process – the performance the current design can be expected to deliver.

An inexperienced manager might conclude from these lessons that what is needed is more capacity. That sounds and feels intuitively obvious and it is correct that adding more capacity may improve the yield – but that does not prove that lack of capacity is the primary cause.  There are many other causes of long lead times  just as there are many causes of headaches other than brain tumours! So before we can decide the best treatment for our under-performing design we need to establish the design diagnosis. And that is done by inspecting the process in detail. And we need to know what we are looking for; the errors of design commission and the errors of design omission. The design flaws.

Only a trained and experienced process designer can spot the flaws in a process design. Intuition will trick the untrained and inexperienced.


Once the design diagnosis is established then the redesign stage can commence. Design always works to a specification and in this case it was clear – to significantly improve the yield to over 90% at no cost.  In other words without needing more people, more skills, more equipment, more space, more anything. The design assignment was made trickier by the fact that the department claimed that it was impossible to achieve significant improvement without adding extra capacity. That is why the Inspector had been sent in. To evaluate that claim.

The design inspection revealed a complex adaptive system – not a linear, deterministic, production-line that manufactures widgets.  The department had to cope with wide variation in demand, wide variation in quality of request, wide variation in job complexity, and wide variation in urgency – all at the same time.  But that is the nature of healthcare and acute hospital work. That is the expected context.

The analysis of the current design revealed that it was not well suited for this requirement – and the low yield was entirely predictable. The analysis also revealed that the root cause of the low yield was not lack of either flow-capacity or space-capacity.

This insight led to the suggestion that it would be possible to improve yield without increasing cost. The department were polite but they did not believe it was possible. They had never seen it, so why should they be expected to just accept this on faith?

Chart_7So, the next step was to develop, test and demonstrate a new design and that was done in three stages. The final stage was the Reality Test – the actual process design was changed for just one day – and the yield measured and compared with the predicted improvement.

This was the validity test – the proof of the design pudding. And to visualise the impact we used the same technique as before – extending the baseline of our time-series chart, locking the limits, and comparing the “after” with the “before”.

The yellow point marks the day of the design test. The measured yield was well above the upper limit which suggested that the design change had made a significant improvement. A statistically significant improvement.  There was no more capacity than usual and the day was not unusually quiet. At the end of the day we held a team huddle.

Our first question was “How did the new design feel?” The consensus was “Calmer, smoother, fewer interruptions” and best of all “We finished on time – there was no frantic catch up at the end of the day and no one had to stay late to complete the days work!”

The next question was “Do we want to continue tomorrow with this new design or revert back to the old one?” The answer was clear “Keep going with the new design. It feels better.”

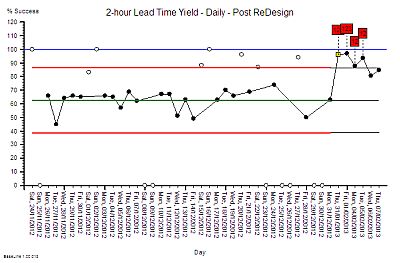
The same chart was used to show what happened over the next few days – excluding the weekends as before. The improvement was sustained – it did not revert to the original because the process design had been changed. Same work, same capacity, different process – higher yield. The red flags on the charts mark the statistically significant evidence of change and the cluster of red flags is very strong statistical evidence that the improvement is not due to chance.

The next phase of the 6M Design® method is to continue to monitor the new process to establish the new baseline of expectation. That will require at least twelve data points and it is in progress. But we have enough evidence of a significant improvement. This means that we have no credible justification to return to the old design, and it also implies that it is no longer valid to compare the new data against the old projected limits. Our chart tells us that we need to split the data into before-and-after and to calculate new averages and limits for each segment separately. We have changed the voice of the process by changing the design.

Chart_8And when we split the data at the point-of-change then the red flags disappear – which means that our new design is stable. And it has a new capability – a better one. We have moved closer to our goal of 100% yield. It is still early days and we do not really have enough data to calculate the new capability.

What we can say is that we have improved average quality yield from 63% to about 90% at no cost using a sequence of process diagnose, design, deliver.  Study-Plan-Do.

And we have hard evidence that disproves the impossibility hypothesis.


And that was the goal of the first design change – it was not to achieve 100% yield in one jump. Our design simulation had predicted an improvement to about 90%.  And there are other design changes to follow that need this stable foundation to build on.  The order of implementation is critical – and each change needs time to bed in before the next change is made. That is the nature of the challenge of improving a complex adaptive system.

The cost to the department was zero but the benefit was huge.  The bigger benefit to the organisation was felt elsewhere – the ‘customers’ saw a higher quality, quicker process – and there will be a financial benefit for the whole system. It will be difficult to measure with our current financial monitoring systems but it will be real and it will be there – lurking in the data.

The improvement required a trained and experienced Inspector/Designer/Educator to start the wheel of change turning. There are not many of these in the NHS – but the good news is that the first level of this training is now available.

What this means for the post-Francis Report II NHS is that those who want to can choose to leap over the wall of resistance that is being erected by the massing legions of noisy cynics. It means we can all become our own inspectors. It means we can all become our own improvers. It means we can all learn to redesign our systems so that they deliver higher safety, better quality, more quickly and at no extra one-off or recurring cost.  We all can have nothing to fear from the Specialist Cadre of Hospital Inspectors.

The writing is on the wall.


15/02/2013 – Two weeks in and still going strong. The yield has improved from 63% to 92% and is stable. Improvement-by-design works.

10/03/2013 – Six weeks in and a good time to test if the improvement has been sustained.

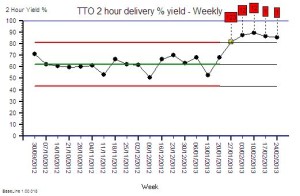
TTO_Yield_WeeklyThe chart is the weekly performance plotted for 17 weeks before the change and for 5 weeks after. The advantage of weekly aggregated data is that it removes the weekend/weekday 7-day cycle and reduces the effect of day-to-day variation.

The improvement is obvious, significant and has been sustained. This is the objective improvement. More important is the subjective improvement.

Here is what Chris M (departmental operational manager) wrote in an email this week (quoted with permission):

Hi Simon

It is I who need to thank you for explaining to me how to turn our pharmacy performance around and ultimately improve the day to day work for the pharmacy team (and the trust staff). This will increase job satisfaction and make pharmacy a worthwhile career again instead of working in constant pressure with a lack of achievement that had made the team feel rather disheartened and depressed. I feel we can now move onwards and upwards so thanks for the confidence boost.

Best wishes and many thanks

Chris

This is what Improvement Science is all about!

Kicking the Habit

no_smoking_400_wht_6805It is not easy to kick a habit. We all know that. And for some reason the ‘bad’ habits are harder to kick than the ‘good’ ones. So what is bad about a ‘bad habit’ and why is it harder to give up? Surely if it was really bad it would be easier to give up?

Improvement is all about giving up old ‘bad’ habits and replacing them with new ‘good’ habits – ones that will sustain the improvement. But there is an invisible barrier that resists us changing any habit – good or bad. And it is that barrier to habit-breaking that we need to understand to succeed. Luck is not a reliable ally.

What does that habit-breaking barrier look like?

The problem is that it is invisible – or rather it is emotional – or to be precise it is chemical.

Our emotions are the output of a fantastically complex chemical system – our brains. And influencing the chemical balance of our brains can have a profound effect on our emotions.  That is how anti-depressants work – they very slightly adjust the chemical balance of every part of our brains. The cumulative effect is that we feel happier.  Nicotine has a similar effect.

And we can achieve the same effect without resorting to drugs or fags – and we can do that by consciously practising some new mental habits until they become ingrained and unconscious. We literally overwrite the old mental habit.

So how do we do this?

First we need to make the mental barrier visible – and then we can focus our attention on eroding it. To do that we need to remove the psychological filter that we all use to exclude our emotions. It is rather like taking off our psychological sunglasses.

When we do that the invisible barrier jumps into view: illuminated by the glare of three negative emotions.  Sadness, fear, and anxiety.  So whenever we feel any of these we know there is a barrier to improvement hiding  the emotional smoke. This is the first stage: tune in to our emotions.

The next step is counter-intuitive. Instead of running away from the negative feeling we consciously flip into a different way of thinking.  We actively engage with our negative feelings – and in a very specific way. We engage in a detached, unemotional, logical, rational, analytical  ‘What caused that negative feeling?’ way.

We then focus on the causes of the negative emotions. And when we have the root causes of our Niggles we design around them, under them, and over them.  We literally design them out of our heads.

The effect is like magic.

And this week I witnessed a real example of this principle in action.

figure_pressing_power_button_150_wht_10080One team I am working with experienced the Power of Improvementology. They saw the effect with their own eyes.  There were no computers in the way, no delays, no distortion and no deletion of data to cloud the issue. They saw the performance of their process jump dramatically – from a success rate of 60% to 96%!  And not just the first day, the second day too.  “Surprised and delighted” sums up their reaction.

So how did we achieve this miracle?

We just looked at the process through a different lens – one not clouded and misshapen by old assumptions and blackened by ignorance of what is possible.  We used the 6M Design® lens – and with the clarity of insight it brings the barriers to improvement became obvious. And they were dissolved. In seconds.

Success then flowed as the Dam of Disbelief crumbled and was washed away.

figure_check_mark_celebrate_anim_150_wht_3617The chaos has gone. The interruptions have gone. The expediting has gone. The firefighting has gone. The complaining has gone.  These chronic Niggles have have been replaced by the Nuggets of calm efficiency, new hope and visible excitement.

And we know that others have noticed the knock-on effect because we got an email from our senior executive that said simply “No one has moaned about TTOs for two days … something has changed.”    

That is Improvementology-in-Action.


Curing Chronic Carveoutosis

pin_marker_lighting_up_150_wht_6683Last week the Ray Of Hope briefly illuminated a very common system design disease called carveoutosis.  This week the RoH will tarry a little longer to illuminate an example that reveals the value of diagnosing and treating this endemic process ailment.

Do you remember the days when we used to have to visit the Central Post Office in our lunch hour to access a quality-of-life-critical service that only a Central Post Office could provide – like getting a new road tax disc for our car?  On walking through the impressive Victorian entrances of these stalwart high street institutions our primary challenge was to decide which queue to join.

In front of each gleaming mahogony, brass and glass counter was a queue of waiting customers. Behind was the Post Office operative. We knew from experience that to be in-and-out before our lunch hour expired required deep understanding of the ways of people and processes – and a savvy selection.  Some queues were longer than others. Was that because there was a particularly slow operative behind that counter? Or was it because there was a particularly complex postal problem being processed? Or was it because the customers who had been waiting longer had identified that queue was fast flowing and had defected to it from their more torpid streams? We know that size is not a reliable indicator of speed or quality.figure_juggling_time_150_wht_4437

The social pressure is now mounting … we must choose … dithering is a sign of weakness … and swapping queues later is another abhorrent behaviour. So we employ our most trusted heuristic – we join the end of the shortest queue. Sometimes it is a good choice, sometimes not so good!  But intuitively it feels like the best option.

Of course  if we choose wisely and we succeed in leap-frogging our fellow customers then we can swagger (just a bit) on the way out. And if not we can scowl and mutter oaths at others who (by sheer luck) leap frog us. The Post Office Game is fertile soil for the Aint’ It Awful game which we play when we arrive back at work.

single_file_line_PA_150_wht_3113But those days are past and now we are more likely to encounter a single-queue when we are forced by necessity to embark on a midday shopping sortie. As we enter we see the path of the snake thoughtfully marked out with rope barriers or with shelves hopefully stacked with just-what-we-need bargains to stock up on as we drift past.  We are processed FIFO (first-in-first-out) which is fairer-for-all and avoids the challenge of the dreaded choice-of-queue. But the single-queue snake brings a new challenge: when we reach the head of the snake we must identify which operative has become available first – and quickly!

Because if we falter then we will incur the shame of the finger-wagging or the flashing red neon arrow that is easily visible to the whole snake; and a painful jab in the ribs from the impatient snaker behind us; and a chorus of tuts from the tail of the snake. So as we frantically scan left and right along the line of bullet-proof glass cells looking for clues of imminent availability we run the risk of developing acute vertigo or a painful repetitive-strain neck injury!

stick_figure_sitting_confused_150_wht_2587So is the single-queue design better?  Do we actually wait less time, the same time or more time? Do we pay a fair price for fair-for-all queue design? The answer is not intuitively obvious because when we are forced to join a lone and long queue it goes against our gut instinct. We feel the urge to push.

The short answer is “Yes”.  A single-queue feeding tasks to parallel-servers is actually a better design. And if we ask the Queue Theorists then they will dazzle us with complex equations that prove it is a better design – in theory.  But the scary-maths does not help us to understand how it is a better design. Most of us are not able to convert equations into experience; academic rhetoric into pragmatic reality. We need to see it with our own eyes to know it and understand it. Because we know that reality is messier than theory.    

And if it is a better design then just how much better is it?

To illustrate the potential advantage of a single-queue design we need to push the competing candiates to their performance limits and then measure the difference. We need a real example and some real data. We are Improvementologists! 

First we need to map our Post Office process – and that reveals that we have a single step process – just the counter. That is about as simple as a process gets. Our map also shows that we have a row of counters of which five are manned by fully trained Post Office service operatives.

stick_figure_run_clock_150_wht_7094Now we can measure our process and when we do that we find that we get an average of 30 customers per hour walking in the entrance and and average of 30 cusomers an hour walking out. Flow-out equals flow-in. Activity equals demand. And the average flow is one every 2 minutes. So far so good. We then observe our five operatives and we find that the average time from starting to serve one customer to starting to serve the next is 10 minutes. We know from our IS training that this is the cycle time. Good.

So we do a quick napkin calculation to check and that the numbers make sense: our system of five operatives working in parallel, each with an average cycle time of 10 minutes can collectively process a customer on average every 2 minutes – that is 30 per hour on average. So it appears we have just enough capacity to keep up with the flow of work  – we are at the limit of efficiency.  Good.

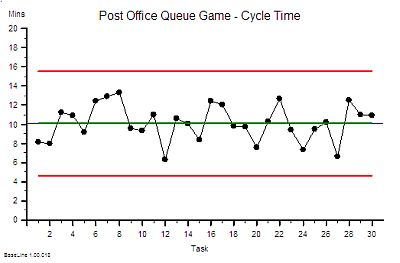
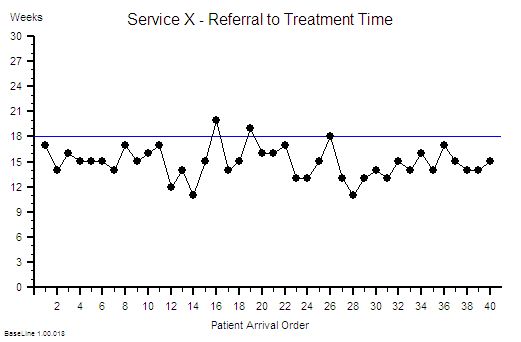
CarveOut_00We also notice that there is variation in the cycle time from customer to customer – so we plot our individual measurements asa time-series chart. There does not seem to be an obvious pattern – it looks random – and BaseLine says that it is statistically stable. Our chart tells us that a range of 5 to 15 minutes is a reasonable expectation to set.

We also observe that there is always a queue of waiting customers somewhere – and although the queues fluctuate in size and location they are always there.

 So there is always a wait for some customers. A variable wait; an unpredictable wait. And that is a concern for us because when the queues are too numerous and too long then we see customers get agitated, look at their watches, shrug their shoulders and leave – taking their custom and our income with them and no doubt telling all their friends of their poor experience. Long queues and long waits are bad for business.

And we do not want zero queues either because if there is no queue and our operatives run out of work then they become under-utilised and our system efficiency and productivity falls.  That means we are incurring a cost but not generating an income. No queues and idle resources are bad for business too.

And we do not want a mixture of quick queues and slow queues because that causes complaints and conflict.  A high-conflict customer complaint experience is bad for business too! 

What we want is a design that creates small and stable queues; ones that are just big enough to keep our operatives busy and our customers not waiting too long.

So which is the better design and how much better is it? Five-queues or a single-queue? Carve-out or no-carve-out?

To find the answer we decide to conduct a week-long series of experiments on our system and use real data to reveal the answer. We choose the time from a customer arriving to the same customer leaving as our measure of quality and performance – and we know that the best we can expect is somewhere between 5 and 15 minutes.  We know from our IS training that is called the Lead Time.

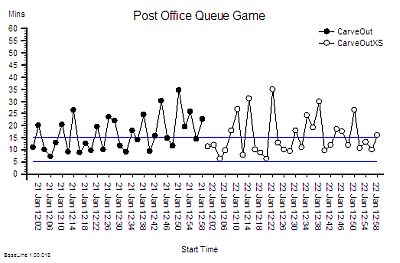
time_moving_fast_150_wht_10108On day #1 we arrange our Post Office with five queues – clearly roped out – one for each manned counter.  We know from our mapping and measuring that customers do not arrive in a steady stream and we fear that may confound our experiment so we arrange to admit only one of our loyal and willing customers every 2 minutes. We also advise our loyal and willing customers which queue they must join before they enter to avoid the customer choice challenges.  We decide which queue using a random number generator – we toss a dice until we get a number between 1 and 5.  We record the time the customer enters on a slip of paper and we ask the customer to give it to the operative and we instruct our service operatives to record the time they completed their work on the same slip and keep it for us to analyse later. We run the experiment for only 1 hour so that we have a sample of 30 slips and then we collect the slips,  calculate the difference between the arrival and departure times and plot them on a time-series chart in the order of arrival.

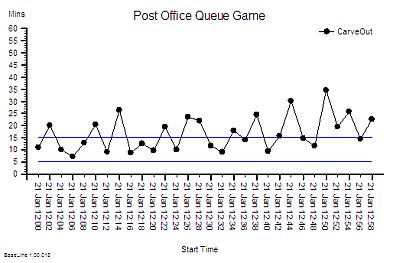
CarveOut_01This is what we found.  Given that the time at the counter is an average of 10 minutes then some of these lead times seem quite long. Some customers spend more time waiting than being served. And we sense that the performance is getting worse over time.

So for the next experiment we decide to open a sixth counter and to rope off a sixth queue. We expect that increasing capacity will reduce waiting time and we confidently expect the performance to improve.

On day #2 we run our experiment again, letting customers in one every 2 minutes as before and this time we use all the numbers on the dice to decide which queue to direct each customer to.  At the end of the hour we collect the slips, calculate the lead times and plot the data – on the same chart.

CarveOut_02This is what we see.

It does not look much better and that is big surprise!

The wide variation from customer to customer looks about the same but with the Eye of Optimism we get a sense that the overall performance looks a bit more stable.

So we conclude that adding capacity (and cost) may make a small difference.

But then we remember that we still only served 30 customers – which means that our income stayed the same while our cost increased by 20%. That is definitely NOT good for business: it is not goiug to look good in a business case “possible marginally better quality and 20% increase in cost and therefore price!”

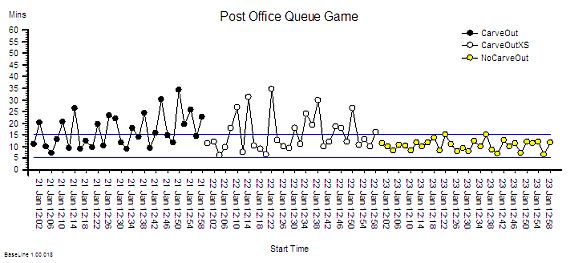
So on day #3 we change the layout. This time we go back to five counters but we re-arrange the ropes to create a single-queue so the customer at the front can be ‘pulled’ to the first available counter. Everything else stays the same – one customer arriving every 2 minutes, the dice, the slips of paper, everything.  At the end of the hour we collect the slips, do our sums and plot our chart.

CarveOut_03And this is what we get! The improvement is dramatic. Both the average and the variation has fallen – especially the variation. But surely this cannot be right. The improvement is too good to be true. We check our data again. Yes, our customers arrived and departed on average one every 2 minutes as before; and all our operatives did the work in an average of 10 minutes just as before. And we had the exactly the same capacity as we had on day #1. And we finished on time. It is correct. We are gobsmaked. It is like a magic wand has been waved over our process. We never would have predicted  that just moving the ropes around to could have such a big impact.  The Queue Theorists were correct after all!

But wait a minute! We are delivering a much better customer experience in terms of waiting time and at the same cost. So could we do even better with six counters open? What will happen if we keep the single-queue design and open the sixth desk?  Before it made little difference but now we doubt our ability to guess what will happen. Our intuition seems to keep tricking us. We are losing our confidence in predicting what the impact will be. We are in counter-intuitive land! We need to run the experiment for real.

So on day #4 we keep the single-queue and we open six desks. We await the data eagerly.

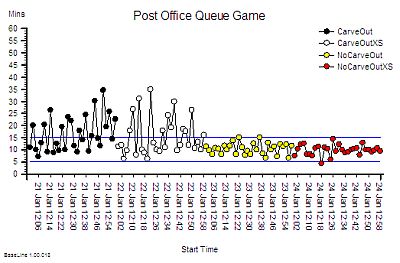
CarveOut_04And this is what happened. Increasing the capacity by 20% has made virtually no difference – again. So we now have two pieces of evidence that say – adding extra capacity did not make a difference to waiting times. The variation looks a bit less though but it is marginal.

It was changing the Queue Design that made the difference! And that change cost nothing. Rien. Nada. Zippo!

That will look much better in our report but now we have to face the emotional discomfort of having to re-evaluate one of our deepest held assumptions.

Reality is telling us that we are delivering a better quality experience using exactly the same resources and it cost nothing to achieve. Higher quality did NOT cost more. In fact we can see that with a carve-out design when we added capacity we just increased the cost we did NOT improve quality. Wow!  That is a shock. Everything we have been led to believe seems to be flawed.

Our senior managers are not going to like this message at all! We will be challening their dogma directly. And they do not like that. Oh dear! 

Now we can see how much better a no-carveout single-queue pull-design can work; and now we can explain why single-queue designs  are used; and now we can show others our experiment and our data and if they do not believe us they can repeat the experiment themselves.  And we can see that it does not need a real Post Office – a pad of Post It® Notes, a few stopwatches and some willing helpers is all we need.

And even though we have seen it with our own eyes we still struggle to explain how the single-queue design works better. What actually happens? And we still have that niggling feeling that the performance on day #1 was unstable.  We need to do some more exploring.

So we run the day#1 experiment again – the five queues – but this time we run it for a whole day, not just an hour.

CarveOut_06

Ah ha!   Our hunch was right.  It is an unstable design. Over time the variation gets bigger and bigger.

But how can that happen?

Then we remember. We told the customers that they could not choose the shortest queue or change queue after they had joined it.  In effect we said “do not look at the other queues“.

And that happens all the time on our systems when we jealously hide performance data from each other! If we are seen to have a smaller queue we get given extra work by the management or told to slow down by the union rep!  

So what do we do now?  All we are doing is trying to improve the service and all we seem to be achieving is annoying more and more people.

What if we apply a maximum waiting time target, say of 1 hour, and allow customers to jump to the front of their queue if they are at risk if breaching the target? That will smooth out spikes and give everyone a fair chance. Customers will understand. It is intuitively obvious and common sense. But our intuition has tricked us before … 

So we run the experiment again and this time we tell our customers that if they wait 50 minutes then they can jump to the front of their queue. They appreciate this because they now have a upper limit on the time they will wait.  

CarveOut_07And this is what we observe. It looks better than before, at least initially, and then it goes pear-shaped.

All we have done with our ‘carve-out and-expedite-the-long-waiters’ design is to defer the inevitable – the crunch. We cannot keep our promise. By the end everyone is pushing to the frontof the queue. It is a riot!  

And there is more. Look at the lead time for the last few customers – two hours. Not only have they waited a long time, but we have had to stay open for two hours longer. That is a BIG cost pessure in overtime payments.

So, whatever way we look at it: a single-queue design is better.  And no one loses out! The customers have a short and predictable waiting time; the operatives are kept occupied and go home on time; and the executives bask in the reflected glory of the excellent customer feedback.  It is a Three Wins® design.

Seeing is believing – and we now know that it is worth diagnosing and treating carveoutosis.

And the only thing left to do is to explain is how a single-queue design works better. It is not obvious is it? 

puzzle_lightbulb_build_PA_150_wht_4587And the best way to do that is to play the Post Office Game and see what actually happens. 

A big light-bulb moment awaits!


Update: My little Sylvanian friends have tried the Post Office Game and kindly sent me this video of the before  Sylvanian Post Office Before and the after Sylvanian Post Office After. They say they now know how the single-queue design works better. 


A Ray Of Hope

stick_figure_shovel_snow_anim_150_wht_9579It does not seem to take much to bring a real system to an almost standstill.  Six inches of snow falling between 10 AM and 2 PM in a Friday in January seems to be enough!

It was not so much the amount of snow – it was the timing.  The decision to close many schools was not made until after the pupils had arrived – and it created a logistical nightmare for parents. 

Many people suddenly needed to get home before they expected which created an early rush hour and gridlocked the road system.

The same number of people travelled the same distance in the same way as they would normally – it just took them a lot longer.  And the queues created more problems as people tried to find work-arounds to bypass the traffic jams.

How many thousands of hours of life-time was wasted sitting in near-stationary queues of cars? How many millions of poundsworth of productivity was lost? How much will the catchup cost? 

And yet while we grumble we shrug our shoulders and say “It is just one of those things. We cannot control the weather. We just have to grin and bear it.”  

Actually we do not have to. And we do not need a weather machine to control the weather. Mother Nature is what it is.

Exactly the same behaviour happens in many systems – and our conclusion is the same.  We assume the chaos and queues are inevitable.

They are not.

They are symptoms of the system design – and specifically they are the inevitable outcomes of the time-design.

But it is tricky to visualise the time-design of a system.  We can see the manifestations of the poor time-design, the queues and chaos, but we do not so easily perceive the causes. So the poor time-design persists. We are not completely useless though; there are lots of obvious things we can do. We can devise ingenious ways to manage the queues; we can build warehouses to hold the queues; we can track the jobs in the queues using sophisticated and expensive information technology; we can identify the hot spots; we can recruit and deploy expediters, problem-solvers and fire-fighters to facilitate the flow through the hottest of them; and we can pump capacity and money into defences, drains and dramatics. And our efforts seem to work so we congratulate ourselves and conclude that these actions are the only ones that work.  And we keep clamouring for more and more resources. More capacity, MORE capacity, MORE CAPACITY.

Until we run out of money!

And then we have to stop asking for more. And then we start rationing. And then we start cost-cutting. And then the chaos and queues get worse. 

And all the time we are not aware that our initial assumptions were wrong.

The chaos and queues are not inevitable. They are a sign of the time-design of our system. So we do have other options.  We can improve the time-design of our system. We do not need to change the safety-design; nor the quality-design; nor the money-design.  Just improving the time-design will be enough. For now.

So the $64,000,000 question is “How?”

Before we explore that we need to demonstrate What is possible. How big is the prize?

The class of system design problem that cause particular angst are called mixed-priority mixed-complexity crossed-stream designs.  We encounter dozens of them in our daily life and we are not aware of it.  One of particular interest to many is called a hospital. The mixed-priority dimension is the need to manage some patients as emergencies, some as urgent and some as routine. The mixed-complexity dimension is that some patients are easy and some are complex. The crossed-stream dimension is the aggregation of specialised resources into departments. Expensive equipment and specific expertise.  We then attempt to push patients with different priorites long different paths through these different departments . And it is a management nightmare! 

BlueprintOur usual and “obvious” response to this challenge is called a carve-out design. And that means we chop up our available resource capacity into chunks.  And we do that in two ways: chunks of time and chunks of space.  We try to simplify the problem by dissecting it into bits that we can understand. We separate the emergency departments from the  planned-care facilities. We separate outpatients from inpatients. We separate medicine from surgery – and we then intellectually dissect our patients into organ systems: brains, lungs, hearts, guts, bones, skin, and so on – and we create separate departments for each one. Neurology, Respiratory, Cardiology, Gastroenterology, Orthopaedics, Dermatology to list just a few. And then we become locked into the carve-out design silos like prisoners in cages of our own making.

And so it is within the departments that are sub-systems of the bigger system. Simplification, dissection and separation. Ad absurdam.

The major drawback with our carve-up design strategy is that it actually makes the system more complicated.  The number of necessary links between the separate parts grows exponentially.  And each link can hold a small queue of waiting tasks – just as each side road can hold a queue of waiting cars. The collective complexity is incomprehensible. The cumulative queue is enormous. The opportunity for confusion and error grows exponentially. Safety and quality fall and cost rises. Carve-out is an inferior time-design.

But our goal is correct: we do need to simplify the system so that means simplifying the time-design.

To illustrate the potential of this ‘simplify the time-design’ approach we need a real example.

One way to do this is to create a real system with lots of carve-out time-design built into it and then we can observe how it behaves – in reality. A carefully designed Table Top Game is one way to do this – one where the players have defined Roles and by following the Rules they collectively create a real system that we can map, measure and modify. With our Table Top Team trained and ready to go we then pump realistic tasks into our realistic system and measure how long they take in reality to appear out of the other side. And we then use the real data to plot some real time-series charts. Not theoretical general ones – real specific ones. And then we use the actual charts to diagnose the actual causes of the actual queues and actual chaos.

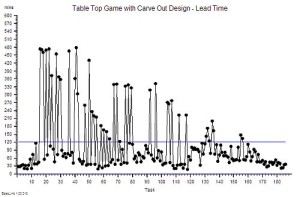
TimeDesign_BeforeThis is the time-series chart of a real Time-Design Game that has been designed using an actual hospital department and real observation data.  Which department it was is not of importance because it could have been one of many. Carve-out is everywhere.

During one run of the Game the Team processed 186 tasks and the chart shows how long each task took from arriving to leaving (the game was designed to do the work in seconds when in the real department it took minutes – and this was done so that one working day could be condensed from 8 hours into 8 minutes!)

There was a mix of priority: some tasks were more urgent than others. There was a mix of complexity: some tasks required more steps that others. The paths crossed at separate steps where different people did defined work using different skills and special equipment.  There were handoffs between all of the steps on all of the streams. There were  lots of links. There were many queues. There were ample opportunities for confusion and errors.

But the design of the real process was such that the work was delivered to a high quality – there were very few output errors. The yield was very high. The design was effective. The resources required to achieve this quality were represented by the hours of people-time availability – the capacity. The cost. And the work was stressful, chaotic, pressured, and important – so it got done. Everyone was busy. Everyone pulled together. They helped each other out. They were not idle. They were a good team. The design was efficient.

The thin blue line on the time-series chart is the “time target” set by the Organisation.  But the effective and efficient system design only achieved it 77% of the time.  So the “obvious” solution was to clamour for more people and for more space and for more equipment so that the work can be done more quickly to deliver more jobs on-time.  Unfortunately the Rules of the Time-Design Game do not allow this more-money option. There is no more money.

To succeed at the Time-Design Game the team must find a way to improve their delivery time performance with the capacity they have and also to deliver the same quality.  But this is impossible! If it were possible then the solution would be obvious and they would be doing it already. No one can succeed on the Time-Design Game. 

Wrong. It is possible.  And the assumption that the solution is obvious is incorrect. The solution is not obvious – at least to the untrained eye.

To the trained eye the time-series chart shows the characteristic signals of a carve-out time-design. The high task-to-task variation is highly suggestive as is the pattern of some of the earlier arrivals having a longer lead time. An experienced system designer can diagnose a carve-out time-design from a set of time-series charts of a process just as a doctor can diagnose the disease from the vital signs chart for a patient.  And when the diagnosis is confirmed with a verification test then the time-Redesign phase can start. 

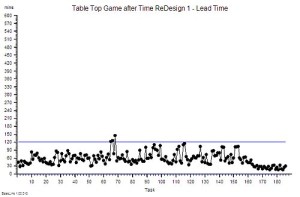
TimeDesign_AfterPhase1This chart shows what happened after the time-design of the system was changed – after some of the carve-out design was modified. The Y-axis scale is the same as before – and the delivery time improvement is dramatic. The Time-ReDesigned system is now delivering 98% achievement of the “on time target”.

The important thing to be aware of is that exactly the same work was done, using exactly the same steps, and exactly the same resources. No one had to be retrained, released or recruited.  The quality was not impaired. And the cost was actually less because less overtime was needed to mop up the spillover of work at the end of the day.

And the Time-ReDesigned system feels better to work in. It is not chaotic; flow is much smoother; and it is busy yet relaxed and even fun.  The same activity is achieved by the same people doing the same work in the same sequence. Only the Time-Design has changed. A change that delivered a win for the workers!

What was the impact of this cost-saving improvement on the customers of this service? They can now be 98% confident that they will get their task completed correctly in less than 120 minutes.  Before the Time-Redesign the 98% confidence limit was 470 minutes! So this is a win for the customers too!

And the Time-ReDesigned system is less expensive so it is a win for whoever is paying.

Same safety and quality, quicker with less variation, and at lower cost. Win-Win-Win.

And the usual reaction to playing the Time-ReDesign Game is incredulous disbelief.  Some describe it as a “light bulb” moment when they see how the diagnosis of the carve-out time-design is made and and how the Time-ReDesign is done. They say “If I had not seen it with my own eyes I would not have believed it.” And they say “The solutions are simple but not obvious!” And they say “I wish I had learned this years ago!”  And thay apologise for being so skeptical before.

And there are those who are too complacent, too careful or too cynical to play the Time-ReDesign Game (which is about 80% of people actually) – and who deny themselves the opportunity of a win-win-win outcome. And that is their choice. They can continue to grin and bear it – for a while longer.     

And for the 20% who want to learn how to do Time ReDesign for real in their actual systems there is now a Ray Of Hope.

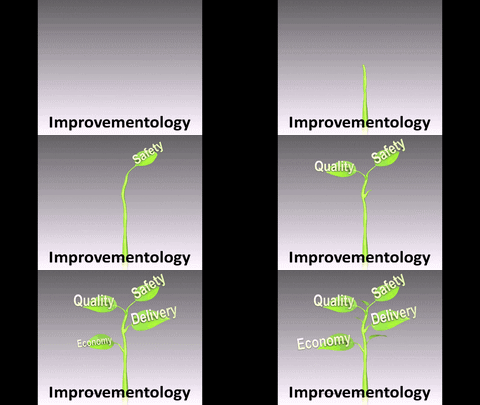
And the Ray of Hope is illuminating a signpost on which is written “This Way to Improvementology“. 

Quality First or Time First?

Before we explore this question we need to establish something. If the issue is Safety then that always goes First – and by safety we mean “a risk of harm that everyone agrees is unacceptable”.


figure_running_hamster_wheel_150_wht_4308Many Improvement Zealots state dogmatically that the only way reach the Nirvanah of “Right Thing – On Time – On Budget” is to focus on Quality First.

This is incorrect.  And what makes it incorrect is the word only.

Experience teaches us that it is impossible to divert people to focus on quality when everyone is too busy just keeping afloat. If they stop to do something else then they will drown. And they know it.

The critical word here is busy.

‘Busy’ means that everyone is spending all their time doing stuff – important stuff – the work, the checking, the correcting, the expediting, the problem solving, and the fire-fighting. They are all busy all of the time.

So when a Quality Zealot breezes in and proclaims ‘You should always focus on quality first … that will solve all the problems’ then the reaction they get is predictable. The weary workers listen with their arms-crossed, roll-their eyes, exchange knowing glances, sigh, shrug, shake their heads, grit their teeth, and trudge back to fire-fighting. Their scepticism and cynicism has been cut a notch deeper. And the weary workers get labelled as ‘Not Interested In Quality’ and ‘Resisting Change’  and ‘Laggards’ by the Quality Zealot who has spent more time studying and regurgitating rhetoric than investing time in observing and understanding reality.

The problem here is the seemingly innocuous word ‘always’. It is too absolute. Too black-and-white. Too dogmatic. Too simple.

Sometimes focussing on Quality First is a wise decision. And that situation is when there is low-quality and idle-time. There is some spare capacity to re-invest in understanding the root causes of the quality issues,  in designing them out of the process, and in implementing the design changes.

But when everyone is busy – when there is no idle-time – then focussing on quality first is not a wise decision because it can actually make the problem worse!

[The Quality Zealots will now be turning a strange red colour, steam will be erupting from their ears and sparks will be coming from their finger-tips as they reach for their keyboards to silence the heretical anti-quality lunatic. “Burn, burn, burn” they rant]. 

When everyone is busy then the first thing to focus on is Time.

And because everyone is busy then the person doing the Focus-on-Time stuff must be someone else. Someone like an Improvementologist.  The Quality Zealot is a liability at this stage – but they become an asset later when the chaos has calmed.

And what our Improvementologist is looking for are queues – also known as Work-in-Progress or WIP.

Why WIP?  Why not where the work is happening? Why not focus on resource utilisation? Isn’t that a time metric?

Yes, resource utilisation is a time-related metric but because everyone is busy then resource utilisation will be high. So looking at utilisation will only confirm what we already know.  And everyone is busy doing important stuff – they are not stupid – they are busy and they are doing their best given the constraints of their process design.        

The queue is where an Improvementologist will direct attention first.  And the specific focus of their attention is the cause of the queue.

This is because there is only one cause of a queue: a mismatch-over-time between demand and activity.

So, the critical first step to diagnosing the cause of a queue is to make the flow visible – to plot the time-series charts of demand, activity and WIP.  Until that is done then no progress will be made with understanding what is happening and it wil be impossible to decide what to do. We need a diagnosis before we can treat. And to get a diagnosis we need data from an examination of our process; and we need data on the history of how it has developed. And we need to know how to convert that data into information, and then into understanding, and then into design options, and then into a wise decision, and then into action, and then into improvement.

And we now know how to spot an experienced Improvementologist because the first thing they will look for are the Queues not the Quality.

But why bother with the flow and the queues at all? Customers are not interested in them! If time is the focus then surely it is turnaround times and waiting times that we need to measure! Then we can compare our performance with our ‘target’ and if it is out of range we can then apply the necessary ‘pressure’!

This is indeed what we observe. So let us explore the pros and cons of this approach with an example.

We are the manager of a support department that receives requests, processes them and delivers the output back to the sender. We could be one of many support departments in an organisation:  human resources, procurement, supplies, finance, IT, estates and so on. We are the Backroom Brigade. We are the unsung heros and heroines.

The requests for our service come in different flavours – some are easy to deal with, others are more complex.  They also come with different priorities – urgent, soon and routine. And they arrive as a mixture of dribbles and deluges.  Our job is to deliver high quality work (i.e. no errors) within the delivery time expected by the originator of the request (i.e. on time). If  we do that then we do not get complaints (but we do not get compliments either).

From the outside things look mostly OK.  We deliver mostly on quality and mostly on time. But on the inside our department is in chaos! Every day brings a new fire to fight. Everyone is busy and the pressure and chaos are relentless. We are keeping our head above water – but only just.  We do not enjoy our work-life. It is not fun. Our people are miserable too. Some leave – others complain – others just come to work, do stuff, take the money and go home – like Zombies. They comply.

three_wins_agreementOnce in the past we were were seduced by the sweet talk of a Quality Zealot. We were promised Nirvanah. We were advised to look at the quality of the requests that we get. And this suggestion resonated with us because we were very aware that the requests were of variable quality. Our people had to spend time checking-and-correcting them before we could process them.  The extra checking had improved the quality of what we deliver – but it had increased our costs too. So the Quality Zealot told us we should work more closely with our customers and to ‘swim upstream’ to prevent the quality problems getting to us in the first place. So we sent some of our most experienced and most expensive Inspectors to paddle upstream. But our customers were also very busy and, much as they would have liked, they did not have time to focus on quality either. So our Inspectors started doing the checking-and-correcting for our customers. Our people are now working for our customers but we still pay their wages. And we do not have enough Inspectors to check-and-correct all the requests at source so we still need to keep a skeleton crew of Inspectors in the department. And these stay-at-home Inspectors  are stretched too thin and their job is too pressured and too stressful. So no one wants to do it.And given the choice they would all rather paddle out to the customers first thing in the morning to give them as much time as possible to check-and-correct the requests so the days work can be completed on time.  It all sounds perfectly logical and rational – but it does not seem to have worked as promised. The stay-at-home Inspectors can only keep up with the more urgent work,  delivery of the less urgent work suffers and the chronic chaos and fire-fighting are now aggravated by a stream of interruptions from customers asking when their ‘non-urgent’ requests will be completed.

figure_talk_giant_phone_anim_150_wht_6767The Quality Zealot insisted we should always answer the phone to our customers – so we take the calls – we expedite the requests – we solve the problems – and we fight-the-fire.  Day, after day, after day.

We now know what Purgatory means. Retirement with a pension or voluntary redundancy with a package are looking more attractive – if only we can keep going long enough.

And the last thing we need is more external inspection, more targets, and more expensive Quality Zealots telling us what to do! 

And when we go and look we see a workplace that appears just as chaotic and stressful and angry as we feel. There are heaps of work in progress everywhere – the phone is always ringing – and our people are running around like headless chickens, expediting, fire-fighting and getting burned-out: physically and emotionally. And we feel powerless to stop it. So we hide.

Does this fictional fiasco feel familiar? It is called the Miserable Job Purgatory Vortex.

Now we know the characteristic pattern of symptoms and signs:  constant pressure of work, ever present threat of quality failure, everyone busy, just managing to cope, target-stick-and-carrot management, a miserable job, and demotivated people.

The issue here is that the queues are causing some of the low quality. It is not always low quality that causes all of the queues.

figure_juggling_time_150_wht_4437Queues create delays, which generate interruptions, which force investigation, which generates expediting, which takes time from doing the work, which consumes required capacity, which reduces activity, which increases the demand-activity mismatch, which increases the queue, which increases the delay – and so on. It is a vicious circle. And interruptions are a fertile source of internally generated errors which generates even more checking and correcting which uses up even more required capacity which makes the queues grow even faster and longer. Round and round.  The cries for ‘we need more capacity’ get louder. It is all hands to the pump – but even then eventually there is a crisis. A big mistake happens. Then Senior Management get named-blamed-and shamed,  money magically appears and is thrown at the problem, capacity increases,  the symptoms settle, the cries for more capacity go quiet – but productivity has dropped another notch. Eventually the financial crunch arrives.    

One symptom of this ‘reactive fire-fight design’ is that people get used to working late to catch up at the end of the day so that the next day they can start the whole rollercoaster ride again. And again. And again. At least that is a form of stability. We can expect tomorrow to be just a s miserable as today and yesterday and the day before that. But TOIL (Time Off In Lieu) costs money.

The way out of the Miserable Job Purgatory Vortex is to diagnose what is causing the queue – and to treat that first.

And that means focussing on Time first – and that means Focussing on Flow first.  And by doing that we will improve delivery, improve quality and improve cost because chaotic systems generate errors which need checking and correcting which costs more. Time first is a win-win-win strategy too.

And we already have everything we need to start. We can easily count what comes in and when and what goes out and when.

The first step is to plot the inflow over time (the demand), the outflow over time (the activity), and from that we work out and plot the Work-in-Progress over time. With these three charts we can start the diagnostic process and by that path we can calm the chaos.

And then we can set to work on the Quality Improvement.  


13/01/2013Newspapers report that 17 hospitals are “dangerously understaffed”  Sound familiar?

Next week we will explore how to diagnose the root cause of a queue using Time charts.

For an example to explore please play the SystemFlow Game by clicking here


The Management of Victimosis

erasable_sad_face_150_wht_6089One of the commonest psycho-socio-economic diseases is Victimosis.

This disease has a characteristic set of symptoms and signs. The symptoms are easy to detect – and the easiest way is to close your eyes and listen to the language being used. There is a characteristic vocabulary.  ‘Yes but’ is common as is ‘If only’ and ‘They should’ and ‘Not my’ and ‘Too busy’.  Hearing these phrases used frequently is good evidence that the subject is suffering from Victimosis.

Everyone suffers from Acute Victimosis occasionally, especially if they are tired and suffer a series of emotional set backs.  With the support of relatives and friends our psychoimmune system is able to combat the cause and return us to healthy normality. We are normally able to heal our emotional wounds.

Unfortunately Victimosis is an infectious and highly contagious condition and with a large enough innoculum it can spread until almost everyone in the organisation is affected to some degree.  When this happens the Victimosis behaviour can become the norm and awareness of the symptoms slips from consciousness. Victimosis then becomes the unspoken dominant culture and the transition to the Chronic Victimosis phase is complete.

dna_magnifying_glass_150_wht_8959Research has shown that Victimosis is an acquired disease linked to a transmissable meme that is picked up early in life. The meme can be transmitted person-to-person and also through mass communication systems which then leads to rapid dissemination. Typical channels are newspapers, television, the internet and now social media.  Just sample the daily news and observe how much Victimosis language is in circulation.

Those more susceptible to infection can develop into chronic carriers who constantly infect and reinfect others.  The outward mainfestations of the chronic form are incessant complaining, criticising, irrational decisions, ineffective actions, blaming and eventually depression, hopelessness and terminal despair.  The chronically infected may aggregate into like-minded groups as a safety-in-numbers reflex response.  These groups are characterised  by having a high proportion of people with the same temperament; particularly the Guardian preference (the Supervisors, Inspectors, Providers and Protectors who make up two thirds of the population).

Those able to resist infection find the context and culture toxic and they take action. They leave.

The outward manifestations of Chronic Victimosis are GroupThink and Silosis.  GroupThink is where collectives start to behave as one and their group-rhetoric becomes progressively less varied and more dogmatic. Silosis is a form of organisational tribalism where Departments become separated from each other, conceptually, emotionally, physically and financially. Both natural reactions only aggravate the condition and accelerate the decline.

patient_stumbling_with_bandages_150_wht_6861One of the effects of the Victimosis-meme is Agnostic Hyper-Reactivity. This is where both the Individuals and their Silos develop a thick emotional protective membrane that distorts their perception.  It is not that they do not sense what is happening – it is that they do not perceive it or that they perceive it in a distorted way.  This is the Agnosia part – literally ‘not knowing’.

Unfortunately being ignorant of Reality does not help and eventually the pressure of Reality builds up and punches a hole through the emotional barrier.  Something exceptionally bad happens that cannot be discounted or ignored. This is the ‘crisis‘ stage and it elicits a characteristic reflex reaction. An emotional knee-jerk. Unfortunately the reflex is an over-reaction and is poorly focussed and badly coordinated – so it does more harm than good.

This is the hyper-reactivity part.

The blind reflex reaction further destabilises an already unstable situation and accelerates the decline.  It creates a positive feedback loop that can quickly escalate to verbal, written and then psychological and physical conflict. The Lose-Lose-Lose of Self-Destructive behaviour that is characteristic of the late phase.  And that is not all.  Over time the reflex reaction gets less effective as the Victimosis Membrane thickens. The reflex fades out.  This is a dangerous development because on the surface it looks like things are improving, there is less conflict, but in reality the patient is slipping into pre-terminal Victimosis.

Fortunately there is a treatment for Victimosis.

It is called Positivicillin.

herbal_supplement_400_wht_8492This is not a new wonder drug, it is a natural product. We all produce Positivicillin and some of us produce more than others: they are called Optimists.  Positivicillin works by channelling the flow of emotional energy into the reflection-and-action pathways. Naturally occurring Positivicillin has a long-half life: the warm glow of success lasts a long time.  Unfortunately Positivicillin is irreversibly deactivated by the emotional toxin generated by the Victimosis meme: a toxin called Discountin. So in the presence of Discountin the affected person needs to generate more Positivicillin and to do so continuously and this leads to emotional exhaustion. The diffusion of Positivicillin is impeded by the Victimosis Membrane so if subject has a severe case of Chronic Victimosis then they may need extrinsic Positivicillin treatment at high dose and for a long time to prevent terminal decline. The primary goal of emergency treatment is to neutralise the excess Discountin for long enough that the natural production of Positivicillin can start to work.

So where can we get supplies of extrinsic Positivicillin from?

In its pure form Positivicillin is rare and expensive.  The number of naturally occurring Eternal Optimist Exporters is small and their collective Positivicillin production capability is limited. Healthy organisations value and attract them; unhealthy ones discount and reject them.

wine_toast_pc_400_wht_4449no_smoking_400_wht_6805So we are forced to resort to using more abundant, cheaper but inferior drugs.  One is called Alcoholimycin and another is Tobaccomycin.  They are both widely available and affordable but they have long term irreversible toxic side effects.

Chronic Victimosis is endemic so chronic abuse of Tobaccomycin and Alcoholimycin is common and, in an attempt to restrict their negative long term effects, both drugs are heavily taxed by the Authorities.

Unfortunately this only aggravates the spread of Chronic Victimosis which some report is a sign of the same condition affecting the Authorties! These radicals are calling for de-regulation of the more potent variants such a Cannabisimycin but the Authorities have opted for a tightly regulated supply of symptom-suppressants such as Anxiolytin and Antidepressin. These are now freely available and do help those who want to learn to cure themselves.

The long term goal of the Victimosis Research Council is to develop ways to produce pure Positivicillin and to treat the most severe cases of Chronic Victimosis; and to find ways to boost the natural production of Positivicillin within less seriously affected individuals and organisations.


Chronic Victimosis is not a new disease – it has been described in various forms throughout recorded history – so the search for a cure starts with the historical treatments – one of which is Confessmycin. This has been used for centuries and appears to work well for some but not others and this idiosyncratic response is believed to be due to the presence (or not) of the Rel-1-Gion meme. Active dissemination of a range of Rel-1-Gion meme variants (and the closely linked Pol-1-Tic meme variants) has been tried with considerable success but does not appear to be a viable long term option.

A recent high-tech approach is called a Twimplant.  This is an example of the Social-Media class of biopsychosocial feedback loops that uses the now ubiquitous mobiphonic symbiont to connect the individual to a regular supply of positive support, ideas and evidence called P-Tweets.  It is important to tune the Twimplant correctly because the same device can also pick up distress signals broadcast by sufferers of Chronic Victimosis who are attempting to dilute their Discountin by digitising it and exporting it to everyone else. These are called N-Tweets and are easily identifiable by their Victimosis vocabulary. N-tweets can be avoided by adopting an Unfollow policy.

heart_puzzle_piece_missing_pa_150_wht_4829One promising line of new research is called R2LM probe therapy.  This is an unconventional and innovative way of curing Chronic Victimosis. The R2LM probe is designed to identify the gaps in the organisational memetic code and to guide delivery of specific meme transplants that fill the gaps it reveals. One common gap is called the OM-meme deletion and one effective treatment for this is called FISH. Taking a course of FISH injections or using a FISH immersion technique leads to a rapid and sustained improvement in emotional balance.  That in-turn leads to an increase in the natural production of Positivicillin. From that point on the individual and can dissolve the Victimosis Membrance and correct their perceptual distortion. The treatment is sometimes uncomfortable but those who completed the course will vouch for its effectiveness.

For the milder forms of Victimosis it is possible to self-diagnose and to self-treat.

The strategy here is to actively reduce the production of Discountin and to boost the natural production of Positivicillin. These have a synergistic effect. The first step is to practice listening for the Victimosis vocabulary using a list of common phrases.  The patient is taught to listen for these in spoken communication and to look for them in written communication. Spoken communication includes their Internal Voice. The commonest phrases are:

1. “Yes but …”
2. “If only  …”
3. “I/You/We/They should …”
4. “I/We can’t …”
5. “I/We hope …”
6. “Not My/Our fault …”
7. “Constant struggle …”
8. “I/We do not know …”
9. “I am too busy to …”

The negative emotional impact of these phrases is caused by the presence of the Discountin toxin.

The second step is to substitute the contaminated phrase with an equivalent one where the Discountin is deactivated using Positivicillin. This deliberate and conscious substitution is easiest in written communication, then externally spoken and finally the Internal Voice. The replacements for the above are …

1. “Yes, and …”
2. “Next time …”
3. “I/We could …”
4. “I/We can …”
5. “I/We know …”
6. “My/Our responsibility …”
7. “Endless opportunity …”
8. “I/We will learn …”
9. “It is too important not to …”

figure_check_mark_celebrate_anim_150_wht_3617The system-wide benefits of the prompt and effective management of Chronic Victimosis are enormous. There is more reflective consideration and more effective action. There is success and celebration where before there was failure and frustration. The success stimulates natural release of more Positivicillin which builds a positive reinforcement feedback loop.  In addition the other GA-memes become progressively switched off and the signs of Passive Persecutitis and Reactive Rescuopathy resolve.

The combined effect leads to the release of Curiositonin, the natural inquisitiveness hormone, and Excitaline – the hormone that causes the addictive feeling of eager anticipation. The racing heart and the dry mouth.

From then on the ex-patient is able to maintain their emotional balance, to further develop their emotional resilience, and to assist other sufferers.  And that is a win for everyone.

The Heart of Change

In 1628 a courageous and paradigm shifting act happened. A small 72-page book was published in Frankfurt that openly challenged 1500 years of medical dogma. The book challenged the authority of Galen (129-200) the most revered medical researcher of antiquity and Hippocrates (460 BC – 370 BC) the Father of Medicine.

The writer of the book was a respected and influential English doctor called William Harvey (1578-1657) who was physician to King James I and who became personal physician to King Charles I.

William_HarveyWilliam Harvey was from yeoman stock. The salt-of-the-earth. Loyal, honest and hard-working free men often owned their land – but who were way down the social pecking order. They were the servant class.

William was the eldest son of Thomas Harvey from Folkstone who had a burning ambition to raise the station of his family from yeoman to gentry. This implied that the family was allowed to have their own coat of arms. To the modern mind this is almost meaningless – in the 17th Century it was not!

And Thomas was wealthy enough to have William formally educated and the dutiful William worked hard at his studies and was rewarded by gaining a place at Caius College in Cambridge University.  John Caius (1510-1573) was a physician who had studied in Padua, Italy – the birthplace of modern medicine. William did well and after graduating from Cambridge in 1597 he too travelled through Europe to study in Padua. There he saw Galenic dogma challenged and defused using empirical evidence. This was at the same time that Galileo Galilei (1564-1642) was challenging the geocentric dogma of the Catholic Church using empirical evidence gained by simple celestial observation with his new telescope. This was the Renaissance. The Rebirth of Learning. This was the end of the Dark Ages of Dogma.

Harvey brought this “new thinking” back to Elizabethan England and decided to focus his attention on the heart. And what Harvey discovered was that the accepted truth from the ancients about how the heart worked was wrong. Galen was wrong. Hippocrates was wrong.

But this was not the most interesting part of the story.  It was the how he proved it that was radically different. He used evidence from reality to disprove the rhetoric. He used the empirical method espoused by Francis Bacon (1561-1626): what we now call the Scientific Method. In effect what Harvey said was “If you do not believe or agree with me then all you need to do is repeat the observation yourself.  Do an autopsy“.  [aut=self and opsy=see]. William Harvey saw and conducted human dissection in Padua, and practiced both it and animal vivisection back in England – and by that means he discovered how the heart actually worked.

Harvey opened a crack in the cultural ice that had frozen medical innovation for 1500 years. The crack in the paradigm was a seed of doubt planted by a combination of curiosity and empirical experimentation:

Q1: If Galen was wrong about the heart then what else was he wrong about? The Four Humours too?
Q2: If the heart is just a simple pump then where does the Spirit reside?

Looking back with our 21st century perspective these are meaningless questions.  To a person in the 17th Century these were fundamental paradigm-challenging questions.  They rocked the whole foundation of their belief system.  The believed that illness was a natural phenomenon and was not caused by magic, curses and evil spirits; but they believed that celestial objects, the stars and planets, were influential. In 1628 astronomy and astrology were the same thing.   

And Harvey was savvy. He was both religious and a devout Royalist and he knew that he would need the support of the most powerful person in England – the monarch. And he knew that he needed to be a respectable member of a powerful institution – the Royal College of Physicians (RCP) which he gained in 1604. A remarkable achievement in itself for someone of yeoman stock. With this ticket he was able to secure a position at St Bartholomew’s Hospital in Smithfield, London and in 1615 he became the RCP Lumleian Lecturer which involved lecturing on anatomy – which he did from 1616.  By virtue of his position Harvey was able to develop a lucrative private practice in London and by that route was introduced to the Court. In 1618 he was appointed as Physician Extraordinary to King James I. [The Physician Ordinary was the top job].

And even with this level of influence, credibility and royal support his paradigm-challenging message met massive cultural and political resistance because he was challenging a 1500 year old belief.

Over the 12 years between 1616 and 1628 Harvey invested a lot of time sharing his ideas and the evidence with influential friends and he used their feedback to deepen his understanding, to guide his experiments, and to sharpen his arguments. He had learned how to debate at school and had developed his skill at Cambridge so he know how to turn argments-against into arguments-for.

Harvey was intensely curious, he knew how to challenge himself, to learn, to influence others, and to change their worldview.  He knew that easily observable phenomemon could help spread the message – such as the demonstration of venous valves in the arm illustrated in his book.  

DeMotuCordisAfter the publication of De Motu Cordis in 1628 his personal credibility and private practice suffered massively because as a self-declared challenger of the current paradigm he was treated with skepticism and distrust by his peers. Gossip is effective.

And even with all his passion, education, evidence, influence and effort it still took 20 years for his message to become widely enough accepted to survive him.  And it did so because others resonated with the message; others like a Rene Descartes (1596-1650). 

William Harvey is now remembered as one of the founders of modern medical science.  When he published De Motu Cordis he triggered a paradim shift – one that we take for granted today.  Harvey showed that the path to improvement is through respectfully challenging accepted dogma with a combination of curiosity, humility, hard-work, and empirical evidence. Reality reinforced rhetoric.

Today we are used to having the freedom of speech and we are familiar with using experimental data to test our hypotheses.  In 1628 this was new thinking and was very risky. People were burned at the stake for challenging the authority of the Catholic Church and the Holy Roman Inquisition was still active well into the 18th Century!

Harvey was also innovative in the use of arithmetic. He showed that the volume of blood pumped by the heart in a day was far more than the liver could reasonably generate.  But at that time arithmetic was the domain of merchants, accountants and money-lenders and was not seen as a tool that a self-respecting natural philosopher would use!  The use of mathematics as a scientific tool did not really take off until after Sir Isaac Newton (1642-1727) published the Principia in 1687 – 30 years after Harvey’s death. [To read more about William Harvey click here].

William Harvey was an Improvementologist.

 So what lessons can modern Improvement Scientists draw from his story?

  • The first is that all significant challanges to current thinking will meet emotional and political resistance. They will be discounted and ridiculed because they challenge the authority of experts.
  • The second is that challenges must be made respectfully. The current thinking has both purpose and value. Improvements build on the foundation of knowledge and only challenge what is not fit for purpose.
  • The third is that the challenge must be more than rhetorical – it must be backed with replicatable evidence. A difference of opinion is just that. Reality is the ultimate arbiter.
  • The fourth is that having an idea is not enough – testig, proving, explaining and demonstrating are needed too. It is hard work to change a mental paradigm and it requires an emotionally secure context to do it. People who are under pressure will find it more difficult and more traumatic. 
  • The fifth is that patience and persistence are needed. Worldview change takes time and happen in small steps. The new paradigm needs to find its place.

And Harvey did not say that Galen and Hippocrates were completely wrong – just partly wrong. And he explained that the reason that Hippocrates and Galen could not test their ideas about human anatomy was because dissection of human bodies was illegal in Greek and Roman societies. Padua in Renaissance Italy was one of the first places where dissection was permitted by Law.   

So which part of the Galenic dogma did Harvey challenge?

He challenged the dogma that blood was created continuously by the liver. He challenged the dogma that there were invisible pores between the right and left sides of the heart. He challenged the dogma that the arteries ‘sucked’ the blood from the heart. He challenged the dogma that the ‘vitalised’ arterial blood was absorbed by the tissues. And he challenged these beliefs with empirical evidence. He showed evidence that the blood circulated fom the right heart to the lungs to the left heart to the body and back to the right heart. He showed evidence that the heart was a muscular pump. And he showed evidence that it worked the same way in man and in animals.  

FourHumoursIn so doing he undermined the foundation of the whole paradigm of ancient belief that illness was the result of an imbalance between the Four Humours. Yellow Bile (associated with the liver), Black Bile (associated with the Spleen), Blood (as ociated with the heart) and Phlegm (associated with the lungs).   

We still have the remnants of this ancient belief in our language.  The Four Humours were also associated with Four Temperaments – four observable personality types. The phlegmatic type (excess phlegm), the sanguine type (excess blood), the choleric type (excess yellow bile), and the melancholic type (excess black bile).

We still talk about “the heart of the matter” and being “heartless”, “heartfelt”  and “change of heart” because the heart was believed to be where emotion and passion resided. Sanguine is the term given to people who show warmth, passion, a live-now-pay-later, optimistic and energetic disposition. And this is not an unreasonable hypothesis given that we are all very aware of changes in how our heart beats when we are emotionally aroused; and how the color of our skin changes.

So when Harvey suggested that blood flowed in a circle from the heart to the arteries and back to the heart via the veins; and that the heart was just a pump then this idea shook the current paradigm on many levels – right down to its roots.

And the ancient justification for a whole raft of medical diagnoses, prognoses and treatments was challenged. The House of Cards was challenged. And many people owed their livelihoods to these ancient beliefs – so it is no surprise that his peers were not jumping  for joy to hear what Harvey said.

But Harvey had reality on his side – and reality trumps rhetoric.

And the same is true today, 500 years later.

The current paradigm is being shaken. The belief that we can all live today and pay tomorrow. The belief that our individual actions have no global impact and no long lasting consequences. The belief that competition is the best route to contentment.

The evidence is accumulating that these beliefs are wrong.

The difference is that today the paradigm is being challenged by a collective voice – not by a lone voice.

Subscribe: [smlsubform]

Defusing Trust Eroders – Part III

<Bing Bong>

laptop_mail_PA_150_wht_2109Leslie’s computer heralded the arrival of yet another email!  They were coming in faster and faster – now that the word had got out on the grapevine about Improvementology.

Leslie glanced at the sender.

It was from Bob.  That was a surprise.  Bob had never emailed out-of-the-blue before.  Leslie was too impatient to wait until later to read the email.

<Dear Leslie, could I trouble you to ask your advice on something.  It is not urgent.  A ten minute chat on the phone would be all I need.  If that is OK please let me know a good time is and I will ring you. Bob>

Leslie was consumed with curiosity.  What could Bob possibly want advice on?  It was Leslie who sought advice from Bob – not the other way around.

Leslie could not wait and emailed back immediately that it was OK to talk now.

<Ring Ring>

L: Hello Bob, what a pleasant surprise!  I am very curious to know what you need my advice about.

B: Thank you Leslie.  What I would like your counsel on is how to engage in learning the science of improvement.

L: Wow!  That is a surprising question. I am really confused now. You helped me to learn this new thinking and now you are asking me to teach you?

B: Yes.  On the surface it seems counter-intuitive.  It is a genuine request though.  I need to learn and understand what works for you and what does not.

L: OK.  I think I am getting an idea of what you are asking.  But I am only just getting grips with the basics.  I do not know how to engage others yet and I certainly would not be able to teach anyone!

B: I must apologise.  I was not clear in my request.  I need to understand how you engaged yourself in learning.  I only provided the germ of the idea – it was you who added what was needed for it to develop into something tangible and valuable for you.  I need to understand how that happened.

L: Ahhhh! I see what you mean.  Yes.  Let me think.  Would it help if I describe my current mental metaphor?

B: That sounds like an excellent idea.

L: OK.  Well your phrase ‘germ of an idea’ was a trigger.  I see the science of improvement as a seed of information that grows into a sturdy tree of understanding.  Just like the ‘tiny acorn into the mighty oak’ concept.  Using that seed-to-tree metaphor helped me to appreciate that the seed is necessary but it is not sufficient.  There are other things that are needed too.  Soil, water, air, sunlight, and protection from hazards and predators.

I then realised that the seed-to-tree metaphor goes deeper.  One insight that I had was when I realised that the first few leaves are critical to success – because they provide the ongoing energy and food to support the growth of more leaves, and the twigs, branches, trunk, and roots that support the leaves and supply them with water and nutrients.  I see the tree as synergistic system that has a common purpose: to become big enough and stable enough to be able to survive the inevitable ups-and-downs of reality.  To weather the winter storms and survive the summer droughts.

plant_metaphor_240x135It seemed to me that the first leaf needed to be labelled ‘safety’ because in our industry if we damage our customers or our staff we do not get a second chance!  The next leaf to grow is labelled ‘quality’ and that means quality-by-design.  Doing the right thing and doing it right first time without needing inspection-and-correction. The safety and quality leaves provide the resources needed to grow the next leaf which I labelled ‘delivery’.  Getting the work done in time, on time, every time.  Together these three leaves support the growth of the fourth – ‘economy’ which means using only what is necessary and also having just enough reserve to ride over the inevitable rocks and ruts in the road of reality.

I then reflected on what the water and the sunshine would represent when applying improvement science in the real world.

It occurred to me that the water in the tree is like money in a real system.  It is required for both growth and health; it must flow to where it is needed, when it is needed and as much as needed. Too little will prevent growth, and too much water at the wrong time and wrong place is just as unhealthy.  I did some reading about the biology of trees and I learned that the water is pulled up the tree!  The ‘suck’ is created by the water evaporating from the leaves.  The plant does not have a committee that decides where the available water should go!  It is a simple self-adjusting, auto-regulating system.

The sunshine for the tree is like feedback for people.  In a plant the suns energy provides the motive force for the whole system.  In our organisations we call it motivation and the feedback loop is critical to success.  Keeping people in the dark about what is required and how they are doing is demotivating.  Healthy organisations are feedback-fuelled!

B: I see the picture in my mind clearly.  That is a powerful metaphor.  How did it help overcome the natural resistance to change?

L: Well using the 6M Design method and taking the desire to create a ‘sturdy tree of understanding’ as the goal of the seed-to-tree process, I then considered what the possible ways it could fail – the failure modes and effects analysis method that you taught me.

B: OK. Yes I see how that approach would help – approaching the problem from the far side of the invisible barrier. What insights did that lead to?

poison_faucet_150_wht_9860L: Well it highlighted that just having enough water and enough sunshine was not sufficient – it had to be clean water and the right sort of sunshine.  The quality is as critical as the quantity.  A toxic environment will kill tender new shoots of improvement long before they can get established.  Cynicism is like cyanide!  Non-specific cost cutting is like blindly wielding a pair of sharp secateurs.  Ignoring the competition from wasteful weeds and political predators is a guaranteed recipe-for-failure too.

This seed-to-tree metaphor really helped because it allowed me to draw up a checklist of necessary conditions for successful growth of knowledge and understanding.  Rather like the shopping list that a gardener might have.  Viable seeds, fertile soil, clean water, enough sunlight, and protection from threats and hazards, especially in the early stages.  And patience and perseverance.  Growing from seed takes time.  Not all seeds will germinate.  Not all seeds can thrive in the context our gardener is able to create.  And the harsher the elements the fewer the types of seed that have any chance of survival.  The conditions select the successful seeds.  Deserts select plants that hoard water so the desert remains a desert.  If money is too tight the miserly will thrive at the expense of the charitable – and money remains hoarded and fought over as the rest of the organisation withers.  And the timing is crucial – the seeds need to be planted at the right time in the cycle of change.  Too early and they cannot germinate, too late and they do not have time to become strong enough to survive in the real world winter storms.

B: Yes.  I see. The deeper you dig into your seeds-to-trees metaphor, the more insightful it becomes.

L: Bob, you just said something really profound then that has unlocked something for me.

B: Did I?  What was it?

RainForestL: You said ‘seeds-to-trees’.  Up until you said that I was unconsciously limiting myself to one-seed-to-one-tree.  Of course!  If it works for the individual it can work for the collective.  Woods and forests are collectives.  The best example I can think of is a tropical rainforest.  With ample water and sunshine the plant-collective creates a synergistic system that has endured millions of years of global climate change.  And one of the striking features of the tropical rain forest is the diversity of species.  It is as if that diversity is an important part of the design.  Competition is ever present though – all the trees compete for sunlight – but it is healthy competition.  Trees do not succeed individually by hunting each other down.  And the diversity seems to be an important component of healthy competition too.  It is as if they are in a shared race to the sun and their differences are an asset rather than a liability. If all the trees were the same the forest would be at greater risk of all making the same biological blunder and suddenly becoming extinct if their environment changes unpredictably.  Uniformity only seems to work in harsh conditions.

B: That is a profound observation Leslie.  I had not consciously made that distinction.

L: So have I answered your question?  Have I helped you?  It has certainly helped me by being asked to putting my thoughts into words.  I see it clearer too now.

B: Yes.  You are a good teacher.  I believe others will resonate with your seeds-to-trees metaphor just as I have.

L: Thank you Bob.  I believe I am beginning to understand something you said in a previous conversation – “the teacher is the person who learns the most”.  I am going to test our seeds-to-trees metaphor on the real world!  And I will feedback what I learn – because in doing that I will amplify and clarify my own learning.

B: Thank you Leslie. I look forward to learning with you.


The Three R’s

Processes are like people – they get poorly – sometimes very poorly.

Poorly processes present with symptoms. Symptoms such as criticism, complaints, and even catastrophes.

Poorly processes show signs. Signs such as fear, queues and deficits.

So when a process gets very poorly what do we do?

We follow the Three R’s

1-Resuscitate
2-Review
3-Repair

Resuscitate means to stabilize the process so that it is not getting sicker.

Review means to quickly and accurately diagnose the root cause of the process sickness.

Repair means to make changes that will return the process to a healthy and stable state.

So the concept of ‘stability’ is fundamental and we need to understand what that means in practice.

Stability means ‘predictable within limits’. It is not the same as ‘constant’. Constant is stable but stable is not necessarily constant.

Predictable implies time – so any measure of process health must be presented as time-series data.

We are now getting close to a working definition of stability: “a useful metric of system performance that is predictable within limits over time”.

So what is a ‘useful metric’?

There will be at least three useful metrics for every system: a quality metric, a time metric and a money metric.

Quality is subjective. Money is objective. Time is both.

Time is the one to start with – because it is the easiest to measure.

And if we treat our system as a ‘black box’ then from the outside there are three inter-dependent time-related metrics. These are external process metrics (EPMs) – sometimes called Key Performance Indicators (KPIs).

Flow in – also called demand
Flow out – also called activity
Delivery time – which is the time a task spends inside our system – also called the lead time.

But this is all starting to sound like rather dry, conceptual, academic mumbo-jumbo … so let us add a bit of realism and drama – let us tell this as a story …

[reveal heading=”Click here to reveal the story …“] 


Picture yourself as the manager of a service that is poorly. Very poorly. You are getting a constant barrage of criticism and complaints and the occasional catastrophe. Your service is struggling to meet the required delivery time performance. Your service is struggling to stay in budget – let alone meet future cost improvement targets. Your life is a constant fire-fight and you are getting very tired and depressed. Nothing you try seems to make any difference. You are starting to think that anything is better than this – even unemployment! But you have a family to support and jobs are hard to come by in austere times so jumping is not an option. There is no way out. You feel you are going under. You feel are drowning. You feel terrified and helpless!

In desperation you type “Management fire-fighting” into your web search box and among the list of hits you see “Process Improvement Emergency Service”.  That looks hopeful. The link takes you to a website and a phone number. What have you got to lose? You dial the number.

It rings twice and a calm voice answers.

?“You are through to the Process Improvement Emergency Service – what is the nature of the process emergency?”

“Um – my service feels like it is on fire and I am drowning!”

The calm voice continues in a reassuring tone.

?“OK. Have you got a minute to answer three questions?”

“Yes – just about”.

?“OK. First question: Is your service safe?”

“Yes – for now. We have had some catastrophes but have put in lots of extra safety policies and checks which seems to be working. But they are creating a lot of extra work and pushing up our costs and even then we still have lots of criticism and complaints.”

?“OK. Second question: Is your service financially viable?”

“Yes, but not for long. Last year we just broke even, this year we are projecting a big deficit. The cost of maintaining safety is ‘killing’ us.”

?“OK. Third question: Is your service delivering on time?”

“Mostly but not all of the time, and that is what is causing us the most pain. We keep getting beaten up for missing our targets.  We constantly ask, argue and plead for more capacity and all we get back is ‘that is your problem and your job to fix – there is no more money’. The system feels chaotic. There seems to be no rhyme nor reason to when we have a good day or a bad day. All we can hope to do is to spot the jobs that are about to slip through the net in time; to expedite them; and to just avoid failing the target. We are fire-fighting all of the time and it is not getting better. In fact it feels like it is getting worse. And no one seems to be able to do anything other than blame each other.”

There is a short pause then the calm voice continues.

?“OK. Do not panic. We can help – and you need to do exactly what we say to put the fire out. Are you willing to do that?”

“I do not have any other options! That is why I am calling.”

The calm voice replied without hesitation. 

?“We all always have the option of walking away from the fire. We all need to be prepared to exercise that option at any time. To be able to help then you will need to understand that and you will need to commit to tackling the fire. Are you willing to commit to that?”

You are surprised and strangely reassured by the clarity and confidence of this response and you take a moment to compose yourself.

“I see. Yes, I agree that I do not need to get toasted personally and I understand that you cannot parachute in to rescue me. I do not want to run away from my responsibility – I will tackle the fire.”

?“OK. First we need to know how stable your process is on the delivery time dimension. Do you have historical data on demand, activity and delivery time?”

“Hey! Data is one thing I do have – I am drowning in the stuff! RAG charts that blink at me like evil demons! None of it seems to help though – the more data I get sent the more confused I become!”

?“OK. Do not panic.  The data you need is very specific. We need the start and finish events for the most recent one hundred completed jobs. Do you have that?”

“Yes – I have it right here on a spreadsheet – do I send the data to you to analyse?”

?“There is no need to do that. I will talk you through how to do it.”

“You mean I can do it now?”

?“Yes – it will only take a few minutes.”

“OK, I am ready – I have the spreadsheet open – what do I do?”

?“Step 1. Arrange the start and finish events into two columns with a start and finish event for each task on each row.

You copy and paste the data you need into a new worksheet. 

“OK – done that”.

?“Step 2. Sort the two columns into ascending order using the start event.”

“OK – that is easy”.

?“Step 3. Create a third column and for each row calculate the difference between the start and the finish event for that task. Please label it ‘Lead Time’”.

“OK – do you want me to calculate the average Lead Time next?”

There was a pause. Then the calm voice continued but with a slight tinge of irritation.

?“That will not help. First we need to see if your system is unstable. We need to avoid the Flaw of Averages trap. Please follow the instructions exactly. Are you OK with that?”

This response was a surprise and you are starting to feel a bit confused.    

“Yes – sorry. What is the next step?”

?“Step 4: Plot a graph. Put the Lead Time on the vertical axis and the start time on the horizontal axis”.

“OK – done that.”

?“Step 5: Please describe what you see?”

“Um – it looks to me like a cave full of stalagtites. The top is almost flat, there are some spikes, but the bottom is all jagged.”

?“OK. Step 6: Does the pattern on the left-side and on the right-side look similar?”

“Yes – it does not seem to be rising or falling over time. Do you want me to plot the smoothed average over time or a trend line? They are options on the spreadsheet software. I do that use all the time!”

The calm voice paused then continued with the irritated overtone again.

?“No. There is no value is doing that. Please stay with me here. A linear regression line is meaningless on a time series chart. You may be feeling a bit confused. It is common to feel confused at this point but the fog will clear soon. Are you OK to continue?”

An odd feeling starts to grow in you: a mixture of anger, sadness and excitement. You find yourself muttering “But I spent my own hard-earned cash on that expensive MBA where I learned how to do linear regression and data smoothing because I was told it would be good for my career progression!”

?“I am sorry I did not catch that? Could you repeat it for me?”

“Um – sorry. I was talking to myself. Can we proceed to the next step?”

?”OK. From what you say it sounds as if your process is stable – for now. That is good.  It means that you do not need to Resuscitate your process and we can move to the Review phase and start to look for the cause of the pain. Are you OK to continue?”

An uncomfortable feeling is starting to form – one that you cannot quite put your finger on.

“Yes – please”. 

?Step 7: What is the value of the Lead Time at the ‘cave roof’?”

“Um – about 42”

?“OK – Step 8: What is your delivery time target?”

“42”

?“OK – Step 9: How is your delivery time performance measured?”

“By the percentage of tasks that are delivered late each month. Our target is better than 95%. If we fail any month then we are named-and-shamed at the monthly performance review meeting and we have to explain why and what we are going to do about it. If we succeed then we are spared the ritual humiliation and we are rewarded by watching others else being mauled instead. There is always someone in the firing line and attendance at the meeting is not optional!”

You also wanted to say that the data you submit is not always completely accurate and that you often expedite tasks just to avoid missing the target – in full knowkedge that the work had not been competed to the required standard. But you hold that back. Someone might be listening.

There was a pause. Then the calm voice continued with no hint of surprise. 

?“OK. Step 10. The most likely diagnosis here is a DRAT. You have probably developed a Gaussian Horn that is creating the emotional pain and that is fuelling the fire-fighting. Do not panic. This is a common and curable process illness.”

You look at the clock. The conversation has taken only a few minutes. Your feeling of panic is starting to fade and a sense of relief and curiosity is growing. Who are these people?

“Can you tell me more about a DRAT? I am not familiar with that term.”

?“Yes.  Do you have two minutes to continue the conversation?”

“Yes indeed! You have my complete attention for as long as you need. The emails can wait.”

The calm voice continues.

?“OK. I may need to put you on hold or call you back if another emergency call comes in. Are you OK with that?”

“You mean I am not the only person feeling like this?”

?“You are not the only person feeling like this. The process improvement emergency service, or PIES as we call it, receives dozens of calls like this every day – from organisations of every size and type.”

“Wow! And what is the outcome?”

There was a pause. Then the calm voice continued with an unmistakeable hint of pride.

?“We have a 100% success rate to date – for those who commit. You can look at our performance charts and the client feedback on the website.”

“I certainly will! So can you explain what a DRAT is?” 

And as you ask this you are thinking to yourself ‘I wonder what happened to those who did not commit?’ 

The calm voice interrupts your train of thought with a well-practiced explanation.

?“DRAT stands for Delusional Ratio and Arbitrary Target. It is a very common management reaction to unintended negative outcomes such as customer complaints. The concept of metric-ratios-and-performance-specifications is not wrong; it is just applied indiscriminately. Using DRATs can drive short-term improvements but over a longer time-scale they always make the problem worse.”

One thought is now reverberating in your mind. “I knew that! I just could not explain why I felt so uneasy about how my service was being measured.” And now you have a new feeling growing – anger.  You control the urge to swear and instead you ask:

“And what is a Horned Gaussian?”

The calm voice was expecting this question.

?“It is easier to demonstrate than to explain. Do you still have your spreadsheet open and do you know how to draw a histogram?”

“Yes – what do I need to plot?”

?“Use the Lead Time data and set up ten bins in the range 0 to 50 with equal intervals. Please describe what you see”.

It takes you only a few seconds to do this.  You draw lots of histograms – most of them very colourful but meaningless. No one seems to mind though.

“OK. The histogram shows a sort of heap with a big spike on the right hand side – at 42.”

The calm voice continued – this time with a sense of satisfaction.

?“OK. You are looking at the Horned Gaussian. The hump is the Gaussian and the spike is the Horn. It is a sign that your complex adaptive system behaviour is being distorted by the DRAT. It is the Horn that causes the pain and the perpetual fire-fighting. It is the DRAT that causes the Horn.”

“Is it possible to remove the Horn and put out the fire?”

?“Yes.”

This is what you wanted to hear and you cannot help cutting to the closure question.

“Good. How long does that take and what does it involve?”

The calm voice was clearly expecting this question too.

?“The Gaussian Horn is a non-specific reaction – it is an effect – it is not the cause. To remove it and to ensure it does not come back requires treating the root cause. The DRAT is not the root cause – it is also a knee-jerk reaction to the symptoms – the complaints. Treating the symptoms requires learning how to diagnose the specific root cause of the lead time performance failure. There are many possible contributors to lead time and you need to know which are present because if you get the diagnosis wrong you will make an unwise decision, take the wrong action and exacerbate the problem.”

Something goes ‘click’ in your head and suddently your fog of confusion evaporates. It is like someone just switched a light on.

“Ah Ha! You have just explained why nothing we try seems to work for long – if at all.  How long does it take to learn how to diagnose and treat the specific root causes?”

The calm voice was expecting this question and seemed to switch to the next part of the script.

?“It depends on how committed the learner is and how much unlearning they have to do in the process. Our experience is that it takes a few hours of focussed effort over a few weeks. It is rather like learning any new skill. Guidance, practice and feedback are needed. Just about anyone can learn how to do it – but paradoxically it takes longer for the more experienced and, can I say, cynical managers. We believe they have more unlearning to do.”

You are now feeling a growing sense of urgency and excitement.

“So it is not something we can do now on the phone?”

?“No. This conversation is just the first step.”

You are eager now – sitting forward on the edge of your chair and completely focussed.

“OK. What is the next step?”

There is a pause. You sense that the calm voice is reviewing the conversation and coming to a decision.

?“Before I can answer your question I need to ask you something. I need to ask you how you are feeling.”

That was not the question you expected! You are not used to talking about your feelings – especially to a complete stranger on the phone – yet strangely you do not sense that you are being judged. You have is a growing feeling of trust in the calm voice.

You pause, collect your thoughts and attempt to put your feelings into words. 

“Er – well – a mixture of feelings actually – and they changed over time. First I had a feeling of surprise that this seems so familiar and straightforward to you; then a sense of resistance to the idea that my problem is fixable; and then a sense of confusion because what you have shown me challenges everything I have been taught; and then a feeling distrust that there must be a catch and then a feeling of fear of embarassement if I do not spot the trick. Then when I put my natural skepticism to one side and considered the possibility as real then there was a feeling of anger that I was not taught any of this before; and then a feeling of sadness for the years of wasted time and frustration from battling something I could not explain.  Eventually I started to started to feel that my cherished impossibility belief was being shaken to its roots. And then I felt a growing sense of curiosity, optimism and even excitement that is also tinged with a feeling of fear of disappointment and of having my hopes dashed – again.”

There was a pause – as if the calm voice was digesting this hearty meal of feelings. Then the calm voice stated:

?“You are experiencing the Nerve Curve. It is normal and expected. It is a healthy sign. It means that the healing process has already started. You are part of your system. You feel what it feels – it feels what you do. The sequence of negative feelings: the shock, denial, anger, sadness, depression and fear will subside with time and the positive feelings of confidence, curiosity and excitement will replace them. Do not worry. This is normal and it takes time. I can now suggest the next step.”

You now feel like you have just stepped off an emotional rollercoaster – scary yet exhilarating at the same time. A sense of relief sweeps over you. You have shared your private emotional pain with a stranger on the phone and the world did not end! There is hope.

“What is the next step?”

This time there was no pause.

?“To commit to learning how to diagnose and treat your process illnesses yourself.”

“You mean you do not sell me an expensive training course or send me a sharp-suited expert who will come tell me what to do and charge me a small fortune?”

There is an almost sarcastic tone to your reply that you regret as soon as you have spoken.

Another pause.  An uncomfortably long one this time. You sense the calm voice knows that you know the answer to your own question and is waiting for you to answer it yourself.

You answer your own question.  

“OK. I guess not. Sorry for that. Yes – I am definitely up for learning how! What do I need to do.”

?“Just email us. The address is on the website. We will outline the learning process. It is neither difficult nor expensive.”

The way this reply was delivered – calmly and matter-of-factly – was reassuring but it also promoted a new niggle – a flash of fear.

“How long have I got to learn this?”

This time the calm voice had an unmistakable sense of urgency that sent a cold prickles down your spine.

?”Delay will add no value. You are being stalked by the Horned Gaussian. This means your system is on the edge of a catastrophe cliff. It could tip over any time. You cannot afford to relax. You must maintain all your current defenses. It is a learning-by-doing process. The sooner you start to learn-by-doing the sooner the fire starts to fade and the sooner you move away from the edge of the cliff.”       

“OK – I understand – and I do not know why I did not seek help a long time ago.”

The calm voice replied simply.

?”Many people find seeking help difficult. Especially senior people”.

Sensing that the conversation is coming to an end you feel compelled to ask:

“I am curious. Where do the DRATs come from?”

?“Curiosity is a healthy attitude to nurture. We believe that DRATs originated in finance departments – where they were originally called Fiscal Averages, Ratios and Targets.  At some time in the past they were sucked into operations and governance departments by a knowledge vacuum created by an unintended error of omission.”

You are not quite sure what this unfamiliar language means and you sense that you have strayed outside the scope of the “emergency script” but the phrase ‘error of omission sounds interesting’ and pricks your curiosity. You ask: 

“What was the error of omission?”

?“We believe it was not investing in learning how to design complex adaptive value systems to deliver capable win-win-win performance. Not investing in learning the Science of Improvement.”

“I am not sure I understand everything you have said.”

?“That is OK. Do not worry. You will. We look forward to your email.  My name is Bob by the way.”

“Thank you so much Bob. I feel better just having talked to someone who understands what I am going through and I am grateful to learn that there is a way out of this dark pit of despair. I will look at the website and send the email immediately.”

?”I am happy to have been of assistance.”

[/reveal]

Systems within Systems

Each of us is a small part of a big system.  Each of us is a big system made of smaller parts. The concept of a system is the same at all scales – it is called scale invariant

When we put a system under a microscope we see parts that are also systems. And when we zoom in on those we see their parts are also systems. And if we look outwards with a telescope we see that we are part of a bigger system which in turn is part of an even bigger system.

This concept of systems-within-systems has a down-side and an up-side.

The down-side is that it quickly becomes impossible to create a mental picture of the whole system-of-systems. Our caveman brains are just not up to the job. So we just focus our impressive-but-limited cognitive capacity on the bit that affects us most. The immediate day-to-day people-and-process here-and-now stuff. And we ignore the ‘rest’. We deliberately become ignorant – and for good reason. We do not ask about the ‘rest’ because we do not want to know because we cannot comprehend the complexity. We create cognitive comfort zones and personal silos.

And we stay inside our comfort zones and we hide inside our silos.


Unfortunately – ignoring the ‘rest’ does not make it go away.

We are part of a system – we are affected by it and it is affected by us. That is how systems work.


The up-side is that all systems behave in much the same way – irrespective of the level.  This is very handy because if we can master a method for understanding and improving a system at one level – then we can use the same method at any level.  The only change is the degree of detail. We can chunk up and down and still use the same method.  

The improvement scientist needs to be a master of one method and to be aware of three levels: the system level, the stream level and the step level.

The system provides the context for the streams. The steps provide the content of the streams.

  1. Direction operates at the system level.
  2. Delivery operates at the stream level.
  3. Doing operates at the step level.

So an effective and efficient improvement science method must work at all three levels – and one method that has been demonstrated to do that is called 6M Design®.


6M Design® is not the only improvement science method, and it is not intended to be the best. Being the best is not the purpose because it is not necessary. Having better than what we had before is the purpose because it is sufficient. That is improvement.


6M Design® works at all three levels.  It is sufficient for system-wide and system-deep improvement. So that is what I use.


The first M stands for Map.

Maps are designed to be visual and two-dimensional because that is how our Mark-I eyeballs abd visual sensory systems work. Our caveman brains are good at using pictures and in extraction meaning from the detail. It is a survival skill. 

All real systems have a lot more than two dimensions. Safety, Quality, Flow and Cost are four dimensions to start with, and there are many more. So we need lots of maps. Each one looking at just two of the dimensions.  It is our set of maps that provide us with a multi-dimensional picture of the system we want to improve.

One dimension features more often in the maps than any other – and that dimension is time.

The Western cultural convention is to put time on the horizonal axis with past in the left and future on the right. Left-to-right means looking forward in time.  Right-to-left means looking backwards in time. 


We have already seen one of the time-dependent maps – The 4N Chart®.

It is a Emotion-Time map. How do we feel now and why? What do we want to feel in the futrure and why? It is a status-at-a-glance map. A static map. A snapshot.

The emotional roller coaster of change – the Nerve Curve – is an Emotion-Time map too. It is a dynamic map – an expected trajectory map.  The emotional ups and downs that we expect to encounter when we engage in significant change.

Change usually involves several threads at the same time – each with its own Nerve Curve. 

The 4N Charts® are snapshots of all the parallel threads of change – they evolve over time – they are our day-to-day status-at-a-glance maps – and they guide us to which Nerve Curve to pay attention to next and what to do. 

The map that links the three – the purposes, the pathways and the parts – is the map that underpins 6M Design®. A map that most people are not familiar with because it represents a counter-intuitive way of thinking.

And it is that critical-to-success map which differentiates innovative design from incremental improvement.

And using that map can be learned quite quickly – if you have a guide – an Improvement Scientist.

A Recipe for Improvement PIE.

Most of us are realists. We have to solve problems in the real world so we prefer real examples and step-by-step how-to-do recipes.

A minority of us are theorists and are more comfortable with abstract models and solving rhetorical problems.

Many of these Improvement Science blog articles debate abstract concepts – because I am a strong iNtuitor by nature. Most realists are Sensors – so by popular request here is a “how-to-do” recipe for a Productivity Improvement Exercise (PIE)

Step 1 – Define Productivity.

There are many definitions we could choose because productivity means the results delivered divided by the resources used.  We could use any of the three currencies – quality, time or money – but the easiest is money. And that is because it is easier to measure and we have well established department for doing it – Finance – the guardians of the money.  There are two other departments who may need to be involved – Governance (the guardians of the safety) and Operations (the guardians of the delivery).

So the definition we will use is productivity = revenue generated divided cost incurred.

Step 2 – Draw a map of the process we want to make more productive.

This means creating a picture of the parts and their relationships to each other – in particular what the steps in the process are; who does what, where and when; what is done in parallel and what is done in sequence; what feeds into what and what depends on what. The output of this step is a diagram with boxes and arrows and annotations – called a process map. It tells us at a glance how complex our process is – the number of boxes and the number of arrows.  The simpler the process the easier it is to demonstrate a productivity improvement quickly and unambiguously.

Step 3 – Decide the objective metrics that will tell us our productivity.

We have chosen a finanical measure of productivity so we need to measure revenue and cost over time – and our Finance department do that already so we do not need to do anything new. We just ask them for the data. It will probably come as a monthly report because that is how Finance processes are designed – the calendar month accounting cycle is not negotiable.

We will also need some internal process metrics (IPMs) that will link to the end of month productivity report values because we need to be observing our process more often than monthly. Weekly, daily or even task-by-task may be necessary – and our monthly finance reports will not meet that time-granularity requirement.

These internal process metrics will be time metrics.

Start with objective metrics and avoid the subjective ones at this stage. They are necessary but they come later.

Step 4 – Measure the process.

There are three essential measures we usually need for each step in the process: A measure of quality, a measure of time and a measure of cost.  For the purposes of this example we will simplify by making three assumptions. Quality is 100% (no mistakes) and Predictability is 100% (no variation) and Necessity is 100% (no worthless steps). This means that we are considering a simplified and theoretical situation but we are novices and we need to start with the wood and not get lost in the trees.

The 100% Quality means that we do not need to worry about Governance for the purposes of this basic recipe.

The 100% Predictability means that we can use averages – so long as we are careful.

The 100% Necessity means that we must have all the steps in there or the process will not work.

The best way to measure the process is to observe it and record the events as they happen. There is no place for rhetoric here. Only reality is acceptable. And avoid computers getting in the way of the measurement. The place for computers is to assist the analysis – and only later may they be used to assist the maintenance – after the improvement has been achieved.

Many attempts at productivity improvement fail at this point – because there is a strong belief that the more computers we add the better. Experience shows the opposite is usually the case – adding computers adds complexity, cost and the opportunity for errors – so beware.

Step 5 – Identify the Constraint Step.

The meaning of the term constraint in this context is very specific – it means the step that controls the flow in the whole process.  The critical word here is flow. We need to identify the current flow constraint.

A tap or valve on a pipe is a good example of a flow constraint – we adjust the tap to control the flow in the whole pipe. It makes no difference how long or fat the pipe is or where the tap is, begining, middle or end. (So long as the pipe is not too long or too narrow or the fluid too gloopy because if they are then the pipe will become the flow constraint and we do not want that).

The way to identify the constraint in the system is to look at the time measurements. The step that shows the same flow as the output is the constraint step. (And remember we are using the simplified example of no errors and no variation – in real life there is a bit more to identifying the constraint step).

Step 6 – Identify the ideal place for the Constraint Step.

This is the critical-to-success step in the PIE recipe. Get this wrong and it will not work.

This step requires two pieces of measurement data for each step – the time data and the cost data. So the Operational team and the Finance team will need to collaborate here. Tricky I know but if we want improved productivity then there is no alternative.

Lots of productivity improvement initiatives fall at the Sixth Fence – so beware.  If our Finance and Operations departments are at war then we should not consider even starting the race. It will only make the bad situation even worse!

If they are able to maintain an adult and respectful face-to-face conversation then we can proceed.

The time measure for each step we need is called the cycle time – which is the time interval from starting one task to being ready to start the next one. Please note this is a precise definition and it should be used exactly as defined.

The money measure for each step we need is the fully absorbed cost of time of providing the resource.  Your Finance department will understand that – they are Masters of FACTs!

The magic number we need to identify the Ideal Constraint is the product of the Cycle Time and the FACT – the step with the highest magic number should be the constraint step. It should control the flow in the whole process. (In reality there is a bit more to it than this but I am trying hard to stay out of the trees).

Step 7 – Design the capacity so that the Ideal Constraint is the Actual Constraint.

We are using a precise definition of the term capacity here – the amount of resource-time available – not just the number of resources available. Again this is a precise definition and should be used as defined.

The capacity design sequence  means adding and removing capacity to and from steps so that the constraint moves to where we want it.

The sequence  is:
7a) Set the capacity of the Ideal Constraint so it is capable of delivering the required activity and revenue.
7b) Increase the capacity of the all the other steps so that the Ideal Constraint actually controls the flow.
7c) Reduce the capacity of each step in turn, a click at a time until it becomes the constraint then back off one click.

Step 8 – Model your whole design to predict the expected productivity improvement.

This is critical because we are not interested in suck-it-and-see incremental improvement. We need to be able to decide if the expected benefit is worth the effort before we authorise and action any changes.  And we will be asked for a business case. That necessity is not negotiable either.

Lots of productivity improvement projects try to dodge this particularly thorny fence behind a smoke screen of a plausible looking business case that is more fiction than fact. This happens when any of Steps 2 to 7 are omitted or done incorrectly.  What we need here is a model and if we are not prepared to learn how to build one then we should not start. It may only need a simple model – but it will need one. Intuition is too unreliable.

A model is defined as a simplified representation of reality used for making predictions.

All models are approximations of reality. That is OK.

The art of modeling is to define the questions the model needs to be designed to answer (and the precision and accuracy needed) and then design, build and test the model so that it is just simple enough and no simpler. Adding unnecessary complexity is difficult, time consuming, error prone and expensive. Using a computer model when a simple pen-and-paper model would suffice is a good example of over-complicating the recipe!

Many productivity improvement projects that get this far still fall at this fence.  There is a belief that modeling can only be done by Marvins with brains the size of planets. This is incorrect.  There is also a belief that just using a spreadsheet or modelling software is all that is needed. This is incorrect too. Competent modelling requires tools and training – and experience because it is as much art as science.

Step 9 – Modify your system as per the tested design.

Once you have demonstrated how the proposed design will deliver a valuable increase in productivity then get on with it.

Not by imposing it as a fait accompli – but by sharing the story along with the rationale, real data, explanation and results. Ask for balanced, reasoned and respectful feedback. The question to ask is “Can you think of any reasons why this would not work?” Very often the reply is “It all looks OK in theory but I bet it won’t work in practice but I can’t explain why”. This is an emotional reaction which may have some basis in fact. It may also just be habitual skepticism/cynicism. Further debate is usually  worthless – the only way to know for sure is by doing the experiment. As an experiment – as a small-scale and time-limited pilot. Set the date and do it. Waiting and debating will add no value. The proof of the pie is in the eating.

Step 10 – Measure and maintain your system productivity.

Keep measuring the same metrics that you need to calculate productivity and in addition monitor the old constraint step and the new constraint steps like a hawk – capturing their time metrics for every task – and tracking what you see against what the model predicted you should see.

The correct tool to use here is a system behaviour chart for each constraint metric.  The before-the-change data is the baseline from which improvement is measured over time;  and with a dot plotted for each task in real time and made visible to all the stakeholders. This is the voice of the process (VoP).

A review after three months with a retrospective financial analysis will not be enough. The feedback needs to be immediate. The voice of the process will dictate if and when to celebrate. (There is a bit more to this step too and the trees are clamoring for attention but we must stay out of the wood a bit longer).

And after the charts-on-the-wall have revealed the expected improvement has actually happened; and after the skeptics have deleted their ‘we told you so’ emails; and after the cynics have slunk off to sulk; and after the celebration party is over; and after the fame and glory has been snatched by the non-participants – after all of that expected change management stuff has happened …. there is a bit more work to do.

And that is to establish the new higher productivity design as business-as-usual which means tearing up all the old policies and writing new ones: New Policies that capture the New Reality. Bin the out-of-date rubbish.

This is an essential step because culture changes slowly.  If this step is omitted then out-of-date beliefs, attitudes, habits and behaviours will start to diffuse back in, poison the pond, and undo all the good work.  The New Policies are the reference – but they alone will not ensure the improvement is maintained. What is also needed is a PFL – a performance feedback loop.

And we have already demonstrated what that needs to be – the tactical system behaviour charts for the Intended Constraint step.

The finanical productivity metric is the strategic output and is reported monthly – as a system behaviour chart! Just comparing this month with last month is meaningless.  The tactical SBCs for the constraint step must be maintained continuously by the people who own the constraint step – because they control the productivity of the whole process.  They are the guardians of the productivity improvement and their SBCs are the Early Warning System (EWS).

If the tactical SBCs set off an alarm then investigate the root cause immediately – and address it. If they do not then leave it alone and do not meddle.

This is the simplified version of the recipe. The essential framework.

Reality is messier. More complicated. More fun!

Reality throws in lots of rusty spanners so we do also need to understand how to manage the complexity; the unnecessary steps; the errors; the meddlers; and the inevitable variation.  It is possible (though not trivial) to design real systems to deliver much higher productivity by using the framework above and by mastering a number of other tools and techniques.  And for that to succeed the Governance, Operations and Finance functions need to collaborate closely with the People and the Process – initially with guidance from an experienced and competent Improvement Scientist. But only initially. This is a learnable skill. And it takes practice to master – so start with easy ones and work up.

If any of these bits are missing or are dysfunctional the recipe will not work. So that is the first nettle the Executive must grasp. Get everyone who is necessary on the same bus going in the same direction – and show the cynics the exit. Skeptics are OK – they will counter-balance the Optimists. Cynics add no value and are a liability.

What you may have noticed is that 8 of the 10 steps happen before any change is made. 80% of the effort is in the design – only 20% is in the doing.

If we get the design wrong the the doing will be an ineffective and inefficient waste of effort, time and money.


The best complement to real Improvement PIE is a FISH course.


The First Step Looks The Steepest

Getting started on improvement is not easy.

It feels like we have to push a lot to get anywhere and when we stop pushing everything just goes back to where it was before and all our effort was for nothing.

And it is easy to become despondent.  It is easy to start to believe that improvement is impossible. It is easy to give up. It is not easy to keep going.


One common reason for early failure is that we often start by  trying to improve something that we have little control over. Which is natural because many of the things that niggle us are not of our making.

But not all Niggles are like that; there are also many Niggles over which we have almost complete control.

It is these close-to-home Niggles that we need to start with – and that is surprisingly difficult too – because it requires a bit of time-investment.


The commonest reason for not investing time in improvement is: “I am too busy.”

Q: Too busy doing what – specifically?

This simple question is  a  good place to start because just setting aside a few minutes each day to reflect on where we have been spending our time is a worthwhile task.

And the output of our self-reflection is usually surprising.

We waste lifetime every day doing worthless work.

Then we complain that we are too busy to do the worthwhile stuff.

Q: So what are we scared of? Facing up to the uncomfortable reality of knowing how much lifetime we have wasted already?

We cannot change the past. We can only influence the future. So we need to learn from the past to make wiser choices.


Lifetime is odd stuff.  It both is and is not like money.

We can waste lifetime and we can waste money. In that  respect they are the same. Money we do not use today we can save for tomorrow, but lifetime not used today is gone forever.

We know this, so we have learned to use up every last drop of lifetime – we have learned to keep ourselves busy.

And if we are always busy then any improvement will involve a trade-off: dis-investing and re-investing our lifetime. This implies the return on our lifetime re-investment must come quickly and predictably – or we give up.


One tried-and-tested strategy is to start small and then to re-invest our time dividend in the next cycle of improvement.  An if we make wise re-investment choices, the benefit will grow exponentially.

Successful entrepreneurs do not make it big overnight.

If we examine their life stories we will find a repeating cycle of bigger and bigger business improvement cycles.

The first thing successful entrepreneurs learn is how to make any investment lead to a return – consistently. It is not luck.  They practice with small stuff until they can do it reliably.

Successful entrepreneurs are disciplined and they only take calculated risks.

Unsuccessful entrepreneurs are more numerous and they have a different approach.

They are the get-rich-quick brigade. The undisciplined gamblers. And the Laws of Probability ensure that they all will fail eventually.

Sustained success is not by chance, it is by design.

The same is true for improvement.  The skill to learn is how to spot an opportunity to release some valuable time resource by nailing a time-sapping-niggle; and then to reinvest that time in the next most promising cycle of improvement  – consistently and reliably.  It requires discipline and learning to use some novel tools and techniques.

This is where Improvement Science helps – because the tools and techniques apply to any improvement. Safety. Flow. Quality. Productivity. Stability. Reliability.

In a nutshell … trustworthy.


The first step looks the steepest because the effort required feels high and the benefit gained looks small.  But it is climbing the first step that separates the successful from the unsuccessful. And successful people are self-disciplined people.

After a few invest-release-reinvest cycles the amount of time released exceeds the amount needed to reinvest. It is then we have time to spare – and we can do what we choose with that.

Ask any successful athlete or entrepreneur – they keep doing it long after they need to – just for the “rush” it gives them.


The tool I use, because it is quick, easy and effective, is called The 4N Chart®.  And it has a helpful assistant called a Niggle-o-Gram®.   Together they work like a focusing lens – they show where the most fertile opportunity for improvement is – the best return on an investment of time and effort.

And when we have proved to yourself that the first step of improvement is not as steep as you believed – then we have released some time to re-invest in the next cycle of improvement – and in sharing what we have discovered.

That is where the big return comes from.

10/11/2012: Feedback from people who have used The 4N Chart and Niggle-o-Gram for personal development is overwhelmingly positive.

Look Out For The Time Trap!

There is a common system ailment which every Improvement Scientist needs to know how to manage.

In fact, it is probably the commonest.

The Symptoms: Disappointingly long waiting times and all resources running flat out.

The Diagnosis?  90%+ of managers say “It is obvious – lack of capacity!”.

The Treatment? 90%+ of managers say “It is obvious – more capacity!!”

Intuitively obvious maybe – but unfortunately these are incorrect answers. Which implies that 90%+ of managers do not understand how their systems work. That is a bit of a worry.  Lament not though – misunderstanding is a treatable symptom of an endemic system disease called agnosia (=not knowing).

The correct answer is “I do not yet have enough information to make a diagnosis“.

This answer is more helpful than it looks because it prompts four other questions:

Q1. “What other possible system diagnoses are there that could cause this pattern of symptoms?”
Q2. “What do I need to know to distinguish these system diagnoses?”
Q3. “How would I treat the different ones?”
Q4. “What is the risk of making the wrong system diagnosis and applying the wrong treatment?”


Before we start on this list we need to set out a few ground rules that will protect us from more intuitive errors (see last week).

The first Rule is this:

Rule #1: Data without context is meaningless.

For example 130  is a number – it is data. 130 what? 130 mmHg. Ah ha! The “mmHg” is the units – it means millimetres of mercury and it tells us this data is a pressure. But what, where, when,who, how and why? We need more context.

“The systolic blood pressure measured in the left arm of Joe Bloggs, a 52 year old male, using an Omron M2 oscillometric manometer on Saturday 20th October 2012 at 09:00 is 130 mmHg”.

The extra context makes the data much more informative. The data has become information.

To understand what the information actually means requires some prior knowledge. We need to know what “systolic” means and what an “oscillometric manometer” is and the relevance of the “52 year old male”.  This ability to extract meaning from information has two parts – the ability to recognise the language – the syntax; and the ability to understand the concepts that the words are just labels for; the semantics.

To use this deeper understanding to make a wise decision to do something (or not) requires something else. Exploring that would  distract us from our current purpose. The point is made.

Rule #1: Data without context is meaningless.

In fact it is worse than meaningless – it is dangerous. And it is dangerous because when the context is missing we rarely stop and ask for it – we rush ahead and fill the context gaps with assumptions. We fill the context gaps with beliefs, prejudices, gossip, intuitive leaps, and sometimes even plain guesses.

This is dangerous – because the same data in a different context may have a completely different meaning.

To illustrate.  If we change one word in the context – if we change “systolic” to “diastolic” then the whole meaning changes from one of likely normality that probably needs no action; to one of serious abnormality that definitely does.  If we missed that critical word out then we are in danger of assuming that the data is systolic blood pressure – because that is the most likely given the number.  And we run the risk of missing a common, potentially fatal and completely treatable disease called Stage 2 hypertension.

There is a second rule that we must always apply when using data from systems. It is this:

Rule #2: Plot time-series data as a chart – a system behaviour chart (SBC).

The reason for the second rule is because the first question we always ask about any system must be “Is our system stable?”

Q: What do we mean by the word “stable”? What is the concept that this word is a label for?

A: Stable means predictable-within-limits.

Q: What limits?

A: The limits of natural variation over time.

Q: What does that mean?

A: Let me show you.

Joe Bloggs is disciplined. He measures his blood pressure almost every day and he plots the data on a chart together with some context .  The chart shows that his systolic blood pressure is stable. That does not mean that it is constant – it does vary from day to day. But over time a pattern emerges from which Joe Bloggs can see that, based on past behaviour, there is a range within which future behaviour is predicted to fall.  And Joe Bloggs has drawn these limits on his chart as two red lines and he has called them expectation lines. These are the limits of natural variation over time of his systolic blood pressure.

If one day he measured his blood pressure and it fell outside that expectation range  then he would say “I didn’t expect that!” and he could investigate further. Perhaps he made an error in the measurement? Perhaps something else has changed that could explain the unexpected result. Perhaps it is higher than expected because he is under a lot of emotional stress a work? Perhaps it is lower than expected because he is relaxing on holiday?

His chart does not tell him the cause – it just flags when to ask more “What might have caused that?” questions.

If you arrive at a hospital in an ambulance as an emergency then the first two questions the emergency care team will need to know the answer to are “How sick are you?” and “How stable are you?”. If you are sick and getting sicker then the first task is to stabilise you, and that process is called resuscitation.  There is no time to waste.


So how is all this relevant to the common pattern of symptoms from our sick system: disappointingly long waiting times and resources running flat out?

Using Rule#1 and Rule#2:  To start to establish the diagnosis we need to add the context to the data and then plot our waiting time information as a time series chart and ask the “Is our system stable?” question.

Suppose we do that and this is what we see. The context is that we are measuring the Referral-to-Treatment Time (RTT) for consecutive patients referred to a single service called X. We only know the actual RTT when the treatment happens and we want to be able to set the expectation for new patients when they are referred  – because we know that if patients know what to expect then they are less likely to be disappointed – so we plot our retrospective RTT information in the order of referral.  With the Mark I Eyeball Test (i.e. look at the chart) we form the subjective impression that our system is stable. It is delivering a predictable-within-limits RTT with an average of about 15 weeks and an expected range of about 10 to 20 weeks.

So far so good.

Unfortunately, the purchaser of our service has set a maximum limit for RTT of 18 weeks – a key performance indicator (KPI) target – and they have decided to “motivate” us by withholding payment for every patient that we do not deliver on time. We can now see from our chart that failures to meet the RTT target are expected, so to avoid the inevitable loss of income we have to come up with an improvement plan. Our jobs will depend on it!

Now we have a problem – because when we look at the resources that are delivering the service they are running flat out – 100% utilisation. They have no spare flow-capacity to do the extra work needed to reduce the waiting list. Efficiency drives and exhortation have got us this far but cannot take us any further. We conclude that our only option is “more capacity”. But we cannot afford it because we are operating very close to the edge. We are a not-for-profit organisation. The budgets are tight as a tick. Every penny is being spent. So spending more here will mean spending less somewhere else. And that will cause a big argument.

So the only obvious option left to us is to change the system – and the easiest thing to do is to monitor the waiting time closely on a patient-by-patient basis and if any patient starts to get close to the RTT Target then we bump them up the list so that they get priority. Obvious!

WARNING: We are now treating the symptoms before we have diagnosed the underlying disease!

In medicine that is a dangerous strategy.  Symptoms are often not-specific.  Different diseases can cause the same symptoms.  An early morning headache can be caused by a hangover after a long night on the town – it can also (much less commonly) be caused by a brain tumour. The risks are different and the treatment is different. Get that diagnosis wrong and disappointment will follow.  Do I need a hole in the head or will a paracetamol be enough?


Back to our list of questions.

What else can cause the same pattern of symptoms of a stable and disappointingly long waiting time and resources running at 100% utilisation?

There are several other process diseases that cause this symptom pattern and none of them are caused by lack of capacity.

Which is annoying because it challenges our assumption that this pattern is always caused by lack of capacity. Yes – that can sometimes be the cause – but not always.

But before we explore what these other system diseases are we need to understand why our current belief is so entrenched.

One reason is because we have learned, from experience, that if we throw flow-capacity at the problem then the waiting time will come down. When we do “waiting list initiatives” for example.  So if adding flow-capacity reduces the waiting time then the cause must be lack of capacity? Intuitively obvious.

Intuitively obvious it may be – but incorrect too.  We have been tricked again. This is flawed causal logic. It is called the illusion of causality.

To illustrate. If a patient complains of a headache and we give them paracetamol then the headache will usually get better.  That does not mean that the cause of headaches is a paracetamol deficiency.  The headache could be caused by lots of things and the response to treatment does not reliably tell us which possible cause is the actual cause. And by suppressing the symptoms we run the risk of missing the actual diagnosis while at the same time deluding ourselves that we are doing a good job.

If a system complains of  long waiting times and we add flow-capacity then the long waiting time will usually get better. That does not mean that the cause of long waiting time is lack of flow-capacity.  The long waiting time could be caused by lots of things. The response to treatment does not reliably tell us which possible cause is the actual cause – so by suppressing the symptoms we run the risk of missing the diagnosis while at the same time deluding ourselves that we are doing a good job.

The similarity is not a co-incidence. All systems behave in similar ways. Similar counter-intuitive ways.


So what other system diseases can cause a stable and disappointingly long waiting time and high resource utilisation?

The commonest system disease that is associated with these symptoms is a time trap – and they have nothing to do with capacity or flow.

They are part of the operational policy design of the system. And we actually design time traps into our systems deliberately! Oops!

We create a time trap when we deliberately delay doing something that we could do immediately – perhaps to give the impression that we are very busy or even overworked!  We create a time trap whenever we deferring until later something we could do today.

If the task does not seem important or urgent for us then it is a candidate for delaying with a time trap.

Unfortunately it may be very important and urgent for someone else – and a delay could be expensive for them.

Creating time traps gives us a sense of power – and it is for that reason they are much loved by bureaucrats.

To illustrate how time traps cause these symptoms consider the following scenario:

Suppose I have just enough resource-capacity to keep up with demand and flow is smooth and fault-free.  My resources are 100% utilised;  the flow-in equals the flow-out; and my waiting time is stable.  If I then add a time trap to my design then the waiting time will increase but over the long term nothing else will change: the flow-in,  the flow-out,  the resource-capacity, the cost and the utilisation of the resources will all remain stable.  I have increased waiting time without adding or removing capacity. So lack of resource-capacity is not always the cause of a longer waiting time.

This new insight creates a new problem; a BIG problem.

Suppose we are measuring flow-in (demand) and flow-out (activity) and time from-start-to-finish (lead time) and the resource usage (utilisation) and we are obeying Rule#1 and Rule#2 and plotting our data with its context as system behaviour charts.  If we have a time trap in our system then none of these charts will tell us that a time-trap is the cause of a longer-than-necessary lead time.

Aw Shucks!

And that is the primary reason why most systems are infested with time traps. The commonly reported performance metrics we use do not tell us that they are there.  We cannot improve what we cannot see.

Well actually the system behaviour charts do hold the clues we need – but we need to understand how systems work in order to know how to use the charts to make the time trap diagnosis.

Q: Why bother though?

A: Simple. It costs nothing to remove a time trap.  We just design it out of the process. Our flow-in will stay the same; our flow-out will stay the same; the capacity we need will stay the same; the cost will stay the same; the revenue will stay the same but the lead-time will fall.

Q: So how does that help me reduce my costs? That is what I’m being nailed to the floor with as well!

A: If a second process requires the output of the process that has a hidden time trap then the cost of the queue in the second process is the indirect cost of the time trap.  This is why time traps are such a fertile cause of excess cost – because they are hidden and because their impact is felt in a different part of the system – and usually in a different budget.

To illustrate. Suppose that 60 patients per day are discharged from our hospital and each one requires a prescription of to-take-out (TTO) medications to be completed before they can leave.  Suppose that there is a time trap in this drug dispensing and delivery process. The time trap is a policy where a porter is scheduled to collect and distribute all the prescriptions at 5 pm. The porter is busy for the whole day and this policy ensures that all the prescriptions for the day are ready before the porter arrives at 5 pm.  Suppose we get the event data from our electronic prescribing system (EPS) and we plot it as a system behaviour chart and it shows most of the sixty prescriptions are generated over a four hour period between 11 am and 3 pm. These prescriptions are delivered on paper (by our busy porter) and the pharmacy guarantees to complete each one within two hours of receipt although most take less than 30 minutes to complete. What is the cost of this one-delivery-per-day-porter-policy time trap? Suppose our hospital has 500 beds and the total annual expense is £182 million – that is £0.5 million per day.  So sixty patients are waiting for between 2 and 5 hours longer than necessary, because of the porter-policy-time-trap, and this adds up to about 5 bed-days per day – that is the cost of 5 beds – 1% of the total cost – about £1.8 million.  So the time trap is, indirectly, costing us the equivalent of £1.8 million per annum.  It would be much more cost-effective for the system to have a dedicated porter working from 12 am to 5 pm doing nothing else but delivering dispensed TTOs as soon as they are ready!  And assuming that there are no other time traps in the decision-to-discharge process;  such as the time trap created by batching all the TTO prescriptions to the end of the morning ward round; and the time trap created by the batch of delivered TTOs waiting for the nurses to distribute them to the queue of waiting patients!


Q: So how do we nail the diagnosis of a time trap and how do we differentiate it from a Batch or a Bottleneck or Carveout?

A: To learn how to do that will require a bit more explanation of the physics of processes.

And anyway if I just told you the answer you would know how but might not understand why it is the answer. Knowledge and understanding are not the same thing. Wise decisions do not follow from just knowledge – they require understanding. Especially when trying to make wise decisions in unfamiliar scenarios.

It is said that if we are shown we will understand 10%; if we can do we will understand 50%; and if we are able to teach then we will understand 90%.

So instead of showing how instead I will offer a hint. The first step of the path to knowing how and understanding why is in the following essay:

A Study of the Relative Value of Different Time-series Charts for Proactive Process Monitoring. JOIS 2012;3:1-18

Click here to visit JOIS

Predictable and Explainable – or Not

It is a common and intuitively reasonable assumption to believe that if something is explainable then it is predictable; and if it is not explainable then it is not predictable. Unfortunately this beguiling assumption is incorrect.  Some things are explainable but not predictable; and some others are predictable but not explainable.  Believe me? Of course not. We are all skeptics when our intuitively obvious assumptions and conclusions are challenged! We want real and rational evidence not rhetorical exhortation.

OK.  Explainable means that the principles that guide the process are conceptually simple. We can explain the parts in detail and we can explain how they are connected together in detail. Predictable implies that if we know the starting point in detail, and the intervention in detail, then we can predict what the outcome will be – in detail.


Let us consider an example. Say we know how much we have in our bank account, and we know how much we intend to spend on that new whizzo computer, then we can predict what will be left in out bank account when the payment has been processed. Yes. This is an explainable and predictable system. It is called a linear system.


Let us consider another example. Say we know we have six dice each with numbers 1 to 6 printed on them and we throw them at the same time. Can we predict where they will land and what the final sum will be? No. We can say that it will be between 6 and 36 but that is all. And after we have thrown the dice we will not be able to explain, in detail, how they came to rest exactly where they did.  This is an unpredictable and unexplainable system. It is called a random system.


This is a picture of a conceptually simple system. It is a novelty toy and it comprises two thin sheets of glass held a few millimetres apart by some curved plastic spacers. The narrow space is filled with green coloured oil, some coarse black volcanic sand, and some fine white coral sand. That is all. It is a conceptually simple toy. I have (by some magical means) layered the sand so that the coarse black sand is at the bottom and the fine white sand is on top. It is stable arrangement – and explainable. I then tipped the toy on its side – I rotated it through 90 degrees. It is a simple intervention – and explainable.

My intervention has converted a stable system to an unstable one and I confidently predict that the sand and oil will flow under the influence of gravity. There is no randomness here – I do not jiggle the toy – so the outcome should be predictable because I can explain all the parts in detail before we start;  and I can explain the process in detail; and I can explain precisely what my intervention will be. So I should be able to predict the final configuration of the sand when this simple and explainable system finally settles into a new stable state again. Yes?

Well, I cannot. I can make some educated guesses – some plausible projections. But the only way to find out precisely what will happen is by doing the experiment and observing what actually happens.

This is what happened.

The final, stable configuration of the coarse black and fine white sand has a strange beauty in the way the layers are re-arranged. The result is not random – it has structure. And with the benefit of hindsight I feel I can work backwards and understand how it might have come about. It is explainable in retrospect but I could not predict it in prospect – even with a detailed knowledge of the starting point and the process.

This is called a non-linear system. Explainable in concept but difficult to predict in practice. The weather is another example of a non-linear system – explainable in terms of the physics but not precisely predictable. How reliable are our long range weather forecasts – or the short range ones for that matter?

Non-linear systems exhibit complex and unpredictable  behaviour – even though they may be simple in concept and uncomplicated in construction.  Randomness is usually present in real systems but it is not the cause of the complex behaviour, and making our systems more complicated seems likely to result in more unpredictable behaviour – not less.

If we want the behaviour of our system to be predictable and our system has non-linear parts and relationships in it – then we are forced to accept two Universal Truths.

1. That our system behaviour will only be predictable within limits (even if there is little or no randomness in it).

2. That to keep the behaviour within acceptable limits then we need to be careful how we arrange the parts and how they relate to each other.

This challenge of creating a predictable-within-acceptable-limits system from non-linear parts is called resilient design.


We have a fourth option to consider: a system that has a predictable outcome but an unexplainable reason.

We make predictions two ways – by working out what will happen or by remembering what has happened before. The second method is much easier so it is the one we use most of the time: it is called re-cognition. We call it knowledge.

If we have a black box with inputs on one side and outputs on the other, and we observe that when we set the inputs to a specific configuration we always get the same output – then we have a predicable system. We cannot explain how the inputs result in the output because the inner workings are hidden. It could be very simple – or it could be fiendishly complicated – we do not know.

It this situation we have no choice but to accept the status quo – and we have to accept that to get a predictable outcome we have to follow the rules and just do what we have always done before. It is the creed of blind acceptance – the If you always do what you have always done you will always get what you always got. It is knowledge but it is not understanding.  New knowledge  can only be found by trial and error.  It is not wisdom, it is not design, it is not curiosity and it is not Improvement Science.


If our systems are non-linear (which they are) and we want predictable and acceptable performance (which we do) then we must strive to understand them and then to design them to be as simple as possible (which is difficult) so that we have the greatest opportunity to improve their performance by design (which is called Improvement Science).


This is a snapshot of the evolving oil-and-sand system. Look at that weird wine-glass shaped hole in the top section caused by the black sand being pulled down through the gap in the spacer then running down the slope of the middle section to fill a white sand funnel and then slip through the next hole onto the top of the white sand pyramid created by the white sand in the middle section that slipped through earlier onto the top of the sliding sand in the lowest section. Did you predict that? I suspect not. Me neither. But I can explain it – with the benefit of hindsight.

So what is it that is causing this complex behaviour? It is the spacers – the physical constraints to the flow of the sand and oil. And the same is true of systems – when the process hits a constraint then the behaviour suddenly changes and complex behaviour emerges.  And there is more to it than even this. It is the gaps between the spacers that is creating the complex behaviour. The flow from one compartment leaking into the next and influencing its behaviour, and then into the next.  This is what happens in all systems – the more constraints that are added to force the behaviour into predictable channels, and the more gaps that exist in the system of constraints then the more complex and unpredictable the system behaviour becomes. Which is exactly the opposite of the intended outcome.


The lesson that this simple toy can teach us is that if we want stable and predictable (i.e. non-complex) behaviour from our complicated systems then we must design them to operate inside the constraints so that they just never quite touch them. That requires data, information, knowledge, understanding and wise design. That is called Improvement Science.


But if, in an act of desperation, we force constraints onto the system we will make the system less stable, less predictable, less safe, less productive, less enjoyable and less affordable. That is called tampering.

Focus-on-the-Flow

One of the foundations of Improvement Science is visualisation – presenting data in a visual format that we find easy to assimilate quickly – as pictures.

We derive deeper understanding from observing how things are changing over time – that is the reality of our everyday experience.

And we gain even deeper understanding of how the world behaves by acting on it and observing the effect of our actions. This is how we all learned-by-doing from day-one. Most of what we know about people, processes and systems we learned long before we went to school.


When I was at school the educational diet was dominated by rote learning of historical facts and tried-and-tested recipes for solving tame problems. It was all OK – but it did not teach me anything about how to improve – that was left to me.

More significantly it taught me more about how not to improve – it taught me that the delivered dogma was not to be questioned. Questions that challenged my older-and-better teachers’ understanding of the world were definitely not welcome.

Young children ask “why?” a lot – but as we get older we stop asking that question – not because we have had our questions answered but because we get the unhelpful answer “just because.”

When we stop asking ourselves “why?” then we stop learning, we close the door to improvement of our understanding, and we close the door to new wisdom.


So to open the door again let us leverage our inborn ability to gain understanding from interacting with the world and observing the effect using moving pictures.

Unfortunately our biology limits us to our immediate space-and-time, so to broaden our scope we need to have a way of projecting a bigger space-scale and longer time-scale into the constraints imposed by the caveman wetware between our ears.

Something like a video game that is realistic enough to teach us something about the real world.

If we want to understand better how a health care system behaves so that we can make wiser decisions of what to do (and what not to do) to improve it then a real-time, interactive, healthcare system video game might be a useful tool.

So, with this design specification I have created one.

The goal of the game is to defeat the enemy – and the enemy is intangible – it is the dark cloak of ignorance – literally “not knowing”.

Not knowing how to improve; not knowing how to ask the “why?” question in a respectful way.  A way that consolidates what we understand and challenges what we do not.

And there is an example of the Health Care System Flow Game being played here.

The Seven Flows

Improvement Science is the knowledge and experience required to improve … but to improve what?

Improve safety, delivery, quality, and productivity?

Yes – ultimately – but they are the outputs. What has to be improved to achieve these improved outputs? That is a much more interesting question.

The simple answer is “flow”. But flow of what? That is an even better question!

Let us consider a real example. Suppose we want to improve the safety, quality, delivery and productivity of our healthcare system – which we do – what “flows” do we need to consider?

The flow of patients is the obvious one – the observable, tangible flow of people with health issues who arrive and leave healthcare facilities such as GP practices, outpatient departments, wards, theatres, accident units, nursing homes, chemists, etc.

What other flows?

Healthcare is a service with an intangible product that is produced and consumed at the same time – and in for those reasons it is very different from manufacturing. The interaction between the patients and the carers is where the value is added and this implies that “flow of carers” is critical too. Carers are people – no one had yet invented a machine that cares.

As soon as we have two flows that interact we have a new consideration – how do we ensure that they are coordinated so that they are able to interact at the same place, same time, in the right way and is the right amount?

The flows are linked – they are interdependent – we have a system of flows and we cannot just focus on one flow or ignore the inter-dependencies. OK, so far so good. What other flows do we need to consider?

Healthcare is a problem-solving process and it is reliant on data – so the flow of data is essential – some of this is clinical data and related to the practice of care, and some of it is operational data and related to the process of care. Data flow supports the patient and carer flows.

What else?

Solving problems has two stages – making decisions and taking actions – in healthcare the decision is called diagnosis and the action is called treatment. Both may involve the use of materials (e.g. consumables, paper, sheets, drugs, dressings, food, etc) and equipment (e.g. beds, CT scanners, instruments, waste bins etc). The provision of materials and equipment are flows that require data and people to support and coordinate as well.

So far we have flows of patients, people, data, materials and equipment and all the flows are interconnected. This is getting complicated!

Anything else?

The work has to be done in a suitable environment so the buildings and estate need to be provided. This may not seem like a flow but it is – it just has a longer time scale and is more jerky than the other flows – planning-building-using a new hospital has a time span of decades.

Are we finished yet? Is anything needed to support the these flows?

Yes – the flow that links them all is money. Money flowing in is called revenue and investment and money flowing out is called costs and dividends and so long as revenue equals or exceeds costs over the long term the system can function. Money is like energy – work only happens when it is flowing – and if the money doesn’t flow to the right part at the right time and in the right amount then the performance of the whole system can suffer – because all the parts and flows are interdependent.

So, we have Seven Flows – Patients, People, Data, Materials, Equipment, Estate and Money – and when considering any process or system improvement we must remain mindful of all Seven because they are interdependent.

And that is a challenge for us because our caveman brains are not designed to solve seven-dimensional time-dependent problems! We are OK with one dimension, struggle with two, really struggle with three and that is about it. We have to face the reality that we cannot do this in our heads – we need assistance – we need tools to help us handle the Seven Flows simultaneously.

Fortunately these tools exist – so we just need to learn how to use them – and that is what Improvement Science is all about.